
Abstract
Current methods for freezing mesenchymal stromal cells (MSCs) result in poor post-thaw function, which limits the clinical utility of these cells. This investigation develops a novel approach to preserve MSCs using combinations of sugars, sugar alcohols, and small-molecule additives. MSCs frozen using these solutions exhibit improved post-thaw attachment and a more normal alignment of the actin cytoskeleton compared to cells exposed to dimethylsulfoxide (DMSO). Osteogenic and chondrogenic differentiation assays show that cells retain their mesenchymal lineage properties. Genomic analysis indicates that the different freezing media evaluated have different effects on the levels of DNA hydroxymethylation, which are a principal epigenetic mark and a key step in the demethylation of CpG doublets. RNA sequencing and quantitative real time-polymerase chain reaction validation demonstrate that transcripts for distinct classes of cytoprotective genes, as well as genes related to extracellular matrix structure and growth factor/receptor signaling are upregulated in experimental freezing solutions compared to DMSO. For example, the osmotic regulator galanin, the antiapoptotic marker B cell lymphoma 2, as well as the cell surface adhesion molecules CD106 (vascular cell adhesion molecule 1) and CD54 (intracellular adhesion molecule 1) are all elevated in DMSO-free solutions. These studies validate the concept that DMSO-free solutions improve post-thaw biological functions and are viable alternatives for freezing MSCs. These novel solutions promote expression of cytoprotective genes, modulate the CpG epigenome, and retain the differentiation ability of MSCs, suggesting that osmolyte-based freezing solutions may provide a new paradigm for therapeutic cell preservation.
Introduction
M
It is common for MSCs to be cryopreserved and stored in a low-temperature cell bank until needed therapeutically [3]. To survive freezing, cell samples must be combined with cryoprotective agents, which enables them to survive the stresses of freezing and thawing [4]. Dimethylsulfoxide (DMSO) has been the standard cryoprotective agent used for cell freezing. However, DMSO is cytotoxic and toxic on infusion in humans. Its side effects range from mild (eg, nausea and vomiting) to severe (eg, cardiovascular and respiratory complications) when transfused [5].
Current protocols for MSC freezing utilize DMSO, and assessment of cellular function post-thaw is often limited to membrane integrity [6]. Despite attempts at defining minimal potency criteria [7], there is a lack of consensus [8] at least, in part, due to our limited understanding of the mechanistic basis for cell therapy in vivo [2 –6,9] and phenotypic effects of freezing cells in DMSO.
MSCs exhibit immunomodulatory behavior in vivo [10 –12], and cryopreservation with DMSO has been associated with functional changes in cells, including reduced suppression of T cell proliferation caused by changes in the indoleamine 2,3 dioxygenase signaling cascade and changes in cellular senescence [13 –16]. In addition, cryopreservation in DMSO has been associated with reduced engraftment, disruption of the actin cytoskeleton [17 –19], as well as clearance of cells via inflammatory reactions after systemic delivery to patients [20]. DMSO has also been implicated in epigenetic changes in cells [21,22]. It has been speculated that the failure of a phase 3 clinical trial using cryopreserved MSCs resulted from poor post-thaw function of the cells [23].
In this study, we examined the effects of optimized non-DMSO cryopreservation solutions on the molecular, cellular, and biological properties of MSCs. These studies demonstrate that experimental DMSO-free formulations improve post-thaw function of MSCs via effects on the epigenome and activation of cytoprotective gene expression programs. Thus, these DMSO-free solutions address a critical clinical need for improved post-thaw functions of MSCs for cell therapy.
Materials and Methods
Cell culture
The study involved the use of induced MSCs derived from H9 embryonic stem cells (H9-MSCs) [24], which exhibit a similar cell surface phenotype as bone marrow-derived MSCs, as well as appropriate in vivo migration and homing behavior in mouse models [25]. Media used with H9 MSCs were composed of alpha minimum essential medium (αMEM) base (Life Technologies), 10% fetal bovine serum (qualified), and 1% nonessential amino acids (Life Technologies). Culture flasks were coated with 0.01% porcine gelatin (Fisher) for a minimum of 2 h before H9 MSC seeding. H9 MSCs were seeded in gelatin-coated flasks at a density of ∼2,500 cells/cm2. Cells were split when they reached 70% confluence and were used for experiments only between passages 8 and 12.
Optimization
The differential evolution algorithm used in this study was developed from strategy 2 (DE/local-to-best/1, balances robustness and convergence) by Storn and Price [26] and was coded in MATLAB based on open source code. This group has previously validated the algorithm for convergence, and a detailed description of its operation is available in Pollock et al. [27]. Briefly, the algorithm evaluates differences between experimental results, and correlates these to an emerging map of the parameter space to predict what conditions to test next. With continued iteration between algorithm and experiment, an optimized result can be obtained using far fewer experiments than traditional factorial experimental designs. For this investigation, the algorithm was set to accept and provide output for discrete parameter vectors. Conservative values were selected for both weight (= 0.85 to limit the step size) and crossover ( = 1 to maximize the number of new solutions being tested in each iteration), and neither was altered during the course of the study. Cell attachment after freezing in each solution was used to iterate the cost function.
Surface marker characterization
Cells were suspended to a concentration of 1 × 10⁶ cells/mL in media and stained with a panel of the following antibodies: mouse IgG1 anti-human CD73 (APC conjugated; BD Pharmingen; clone AD2), mouse IgG1 anti-human CD90 (fluorescein isothiocyanate conjugate; Molecular Probes by Life Technologies; clone 5E10), mouse IgG1 anti-human CD105 (PE conjugated; R&D Systems; clone 166707), and mouse IgG1 anti-human CD45 (BV421 conjugated; BD Horizon; clone HI30). Cells were incubated with antibodies for 30 min at 4°C. Flow cytometry was performed on an LSRII at low flow rate, with the fine adjust knob five turns from maximum. At least 15,000 events were recorded for each sample. Cell populations were gated for forward and side scatter compared to unstained MSCs, and CD45 expressing Jurkat cells as, respectively, negative and positive controls to establish boundaries for fluorescent signals.
Multilineage differentiation
Differentiation of both fresh and post-thaw cells was induced using StemPro chondrogenesis and osteogenesis media and protocols. Chondrogenic micromass cultures were stained with 1% Alcian blue solution, while osteogenic cultures were stained with 2% Alizarin red solution.
Vial freezing
Optimized solutions were prepared at double (2 × ) the final freezing concentration and added stepwise to cells in Normosol R (Hospira) at a 1:1 final volume ratio in a Nalgene freezing vial (Nunc; Thermo Scientific). Control cells in media were similarly combined stepwise with DMSO at a 1:1 final volume ratio. Each of these vials was incubated at room temperature for 0, 1, or 2 h. Sucrose, glycerol, creatine (SGC) and sucrose/glycerol/isoleucine (SGI) solutions were incubated for 1 h before freezing, while sucrose, mannitol, creatine (SMC) solutions were incubated for 2 h before freezing based on the minimum penetration time for the components used in each solution [28]. DMSO solutions were incubated for 0 or 1 h as labeled in the results. On a Planar Series III Kryo 10 controlled rate freezer, a multistep freezing procedure was initiated in which the starting temperature was set at 20°C, and temperatures were subsequently modulated as indicated: −10°C/min to 0°C, hold at 0°C for 15 min, −1°C/min to −8°C, −50°C/min to −45°C, +15°C/min to −12°C, and finally, −1°C (DMSO) or −3°C/min (experimental solutions) to −100°C, followed by transfer to liquid nitrogen vapor-phase storage. The rapid cooling and warming steps of the freezing profile (50°C/min to −45°C, +15°C/min to −12°C) correspond to a temperature spike included to reliably induce extracellular ice formation in samples before they undercool substantially (which can result in undesirable intracellular ice formation when nucleation does finally occur). If this spike event is omitted from the protocol, less uniform nucleation may occur among different samples frozen in the same run, which could contribute to greater sample-to-sample variability post-thaw.
Previous screening experiments analyzed for interactions using a linear mixed effects model (Supplementary Table S1) showed that cells with experimental solutions frozen at 3°C/min resulted in higher recoveries than those frozen at 1°C/min (Supplementary Table S2); see the Screening Results and Rationale for Cooling Rate Selection section in Supplementary Data for more detail; Supplementary Data are available online at
Thawing
Samples were rapidly transferred (<2 min) from liquid nitrogen storage and partially submerged (below cap height) in a 37°C bath and observed until only a small ice crystal was present. Samples were mixed using a pipette, and an aliquot was immediately combined with acridine orange/propidium iodide and counted using a hemocytometer. The remaining sample volume was diluted in complete media and centrifuged at 1,000 rpm for 5 min. The supernatant was aspirated after centrifugation, and cells were then prepared for cellular assays measuring proliferation, senescence, or actin alignment, as well as biochemical studies using isolated DNA and RNA.
Attachment and proliferation
Cell attachment of samples post-thaw was measured using a fluorescent plate reader. Samples were resuspended in media and seeded in each of two gelatin-coated, six-well plates. After 2 or 24 h, these paired plates were washed with phosphate-buffered saline (PBS), 1 μM calcein-acetoxymethyl (AM) dye was added, and then analyzed for fluorescence on a plate reader. Raw fluorescence values were used to calculate the number of live cells present in each well by correlating to a control curve of cells seeded at known densities. The live cell attachment was calculated by dividing the number of live cells present in 2-h plated samples (calcein-AM plate reader fluorescence) by the number of live cells seeded prefreeze.
Senescence
Cell senescence of samples post-thaw was measured using a luminescent plate reader. Samples were resuspended in media and equal parts were added to each of four gelatin-coated six-well plates. After incubation to permit attachment, plates were washed with PBS and two plates were analyzed at a time, one for proliferation and one for senescence. Beta-Glo (Promega) luminescent dye was added to measure senescence, and 1 μM calcein-AM dye was added to measure proliferation. Plates were analyzed using a BioTek plate reader for luminescence (Beta-Glo plate) and fluorescence (485ex/528em, calcein-AM plate), respectively. A relative measure of senescence is reported here by dividing the base-corrected luminescence (approximation of total senescence) per well by the base-corrected fluorescence (approximation of total cells per well). H9-MSCs treated for 1 h on seven consecutive days with 100 μM tert-butyl hydro peroxide (t-BHP) (to induce senescence) were used as a positive control.
Actin staining, imaging, and analysis
MSCs were resuspended in 1 mL of media and plated in a gelatin-coated, six-well plate containing a cover slip. After 2 h, wells were washed with PBS, fixed with 3.7% formaldehyde, permeabilized with 0.1% Triton x-100, followed by addition of 250 μM phalloidin for 20 min. Cover slips were mounted on glass slides using ProLong-Gold antifade reagent with 4′,6-diamidino-2-phenylindole (Invitrogen) and imaged using a Zeiss Axioplan 2 scope with 20× objective. Greater than five fields of view were captured for each slide, and MATLAB edge detect [29] (a more computationally efficient alternative to Fast Fourier Transform (FFT) [30]) was used to isolate and analyze fiber orientation in 30 individual cells total from five or more fields of view for each sample. Samples were isolated from cells frozen on three separate days, and results were averaged for 90 total cells from each sample.
DNA isolation and quantification
Pellets of cells were flash frozen in liquid nitrogen and then transferred for further DNA isolation and processing. Genomic DNA was isolated from the eight treatment group samples using QIAGEN DNeasy Blood and Tissue Kit according to the manufacturer's protocol. The purified DNA was quantified using NanoDrop® 2000. The purity of the DNA was verified by determining the A260/A280 ratio for all samples and the ratio was consistently ∼1.8.
DNA hydroxymethylation by dot blotting
DNA samples were prepared by diluting total DNA to final amounts of 2, 1, 0.5, and 0.25 μg with 0.1 M NaOH. The samples were denatured at 95°C for 10 min and cooled quickly on an ice bath followed by neutralization with ammonium acetate. Loading sample volumes of 400 μL were prepared by adding equal volumes of 0.1 M NaOH and 2 M ammonium acetate to the denatured DNA. The nitrocellulose membrane was prewet in distilled water and placed on the Bio-Dot® Microfiltration Apparatus (Bio-Rad Laboratories) as per the manufacturer's recommendations. Vacuum was applied and the screws retightened to hold the apparatus together. The membrane was rehydrated with 0.1 M NaOH to prepare for sample application. With vacuum off, denatured DNA was added to sample wells, while all other wells were filled with the same volume of distilled water to obtain homogenous filtration. The samples were filtered by applying gentle vacuum, followed by an addition of 0.1 M NaOH to each well. The vacuum was applied again until wells were empty. The apparatus was disassembled and the membrane rinsed with 2× saline-sodium citrate. After air-drying, the membrane was blocked with 5% skimmed milk in PBS for 1 h. The membranes were washed with PBS and incubated with anti-5 hydroxymethyl cytosine (5hmC) overnight. The next day, the membrane was washed with PBS and incubated with the anti-rabbit secondary antibody. The blots were washed and developed using the SuperSignal West Femto Maximum Sensitivity Substrate kit (Thermo Fisher Scientific) by autoexposure settings on the ChemiDoc™ Touch Imaging System (Bio-Rad Laboratories). Data were quantified by densitometry and analyzed using Image Lab software by applying background subtraction and approximated for linearity.
Gene expression analysis by real-time quantitative polymerase chain reaction and RNA sequencing
Pellets of thawed samples described above were resuspended in QIAzol for further RNA isolation and processing. RNA was isolated using the miRNeasy Mini Kit as per the manufacturer's protocol for cultured cells and cell pellets. The purified RNA was quantified using a NanoDrop 2000 device to determine concentration.
For quantitative real time-polymerase chain reaction (qRT-PCR) studies, 800 ng of RNA was used for reverse transcription to make cDNA, using SuperScript III First-Strand Synthesis System (Invitrogen). cDNA was diluted to a concentration of 4 ng/μL and real-time qPCR was performed with 10 ng cDNA per 10 μL reaction with QuantiTect SYBR Green PCR Kit (Qiagen) on CFX384 Real-Time PCR detection system (Bio-Rad). The list of genes and their primer sequences are provided in Table 1. Melt curves were analyzed using the comparative CT method [31] with GAPDH as an internal control gene.
High-throughput mRNA sequencing was performed on RNA isolated from the eight sample groups followed by bioinformatics analysis as described previously in Dudakovic et al. [32,33]. Gene expression is expressed in reads per kilobase pair per million (RPKM) mapped reads. Sequencing data are available at the National Center for Biotechnology Information using Gene Expression Omnibus accession number GSE88946. Because of the considerable expense of high-throughput RNA-seq analysis, and the number of conditions we examined, it was not realistic to analyze each individual biological replicate. Therefore, each analysis was done with a single pooled sample that contained RNA from three individual H9 cultures to reduce biological variation.
Results
Osmolyte-based cryopreservation formulations retain MSC post-thaw viability
Algorithm optimization was performed for different combinations of sugars, sugar alcohols, and small-molecule additives and identified concentrations of components in solution which, when combined and frozen with cells, resulted in maximum cell attachment at 2 h post-thaw. Figure 1A shows a representative generational progression of the algorithm for a solution of SGI. Over multiple generations, the post-thaw recovery of live cells increases and the percentage of those recovered cells that are able to attach to a surface also increases. The optimums identified for three separate iterations of the algorithm using different components in solution were as follows: SGC (0 mM sucrose, 1.25% glycerol, 2 mM creatine), SGI (30 mM sucrose, 5% glycerol, 7.5 mM isoleucine), and SMC (150 mM sucrose, 62.5 mM mannitol, 6.25 mM creatine). A complete data set for each optimization with concentration levels discretized (Supplementary Table S3) is included in the supplement, with data sets included for SGC (Supplementary Table S4), SGI (Supplementary Table S5), and SMC (Supplementary Table S6).
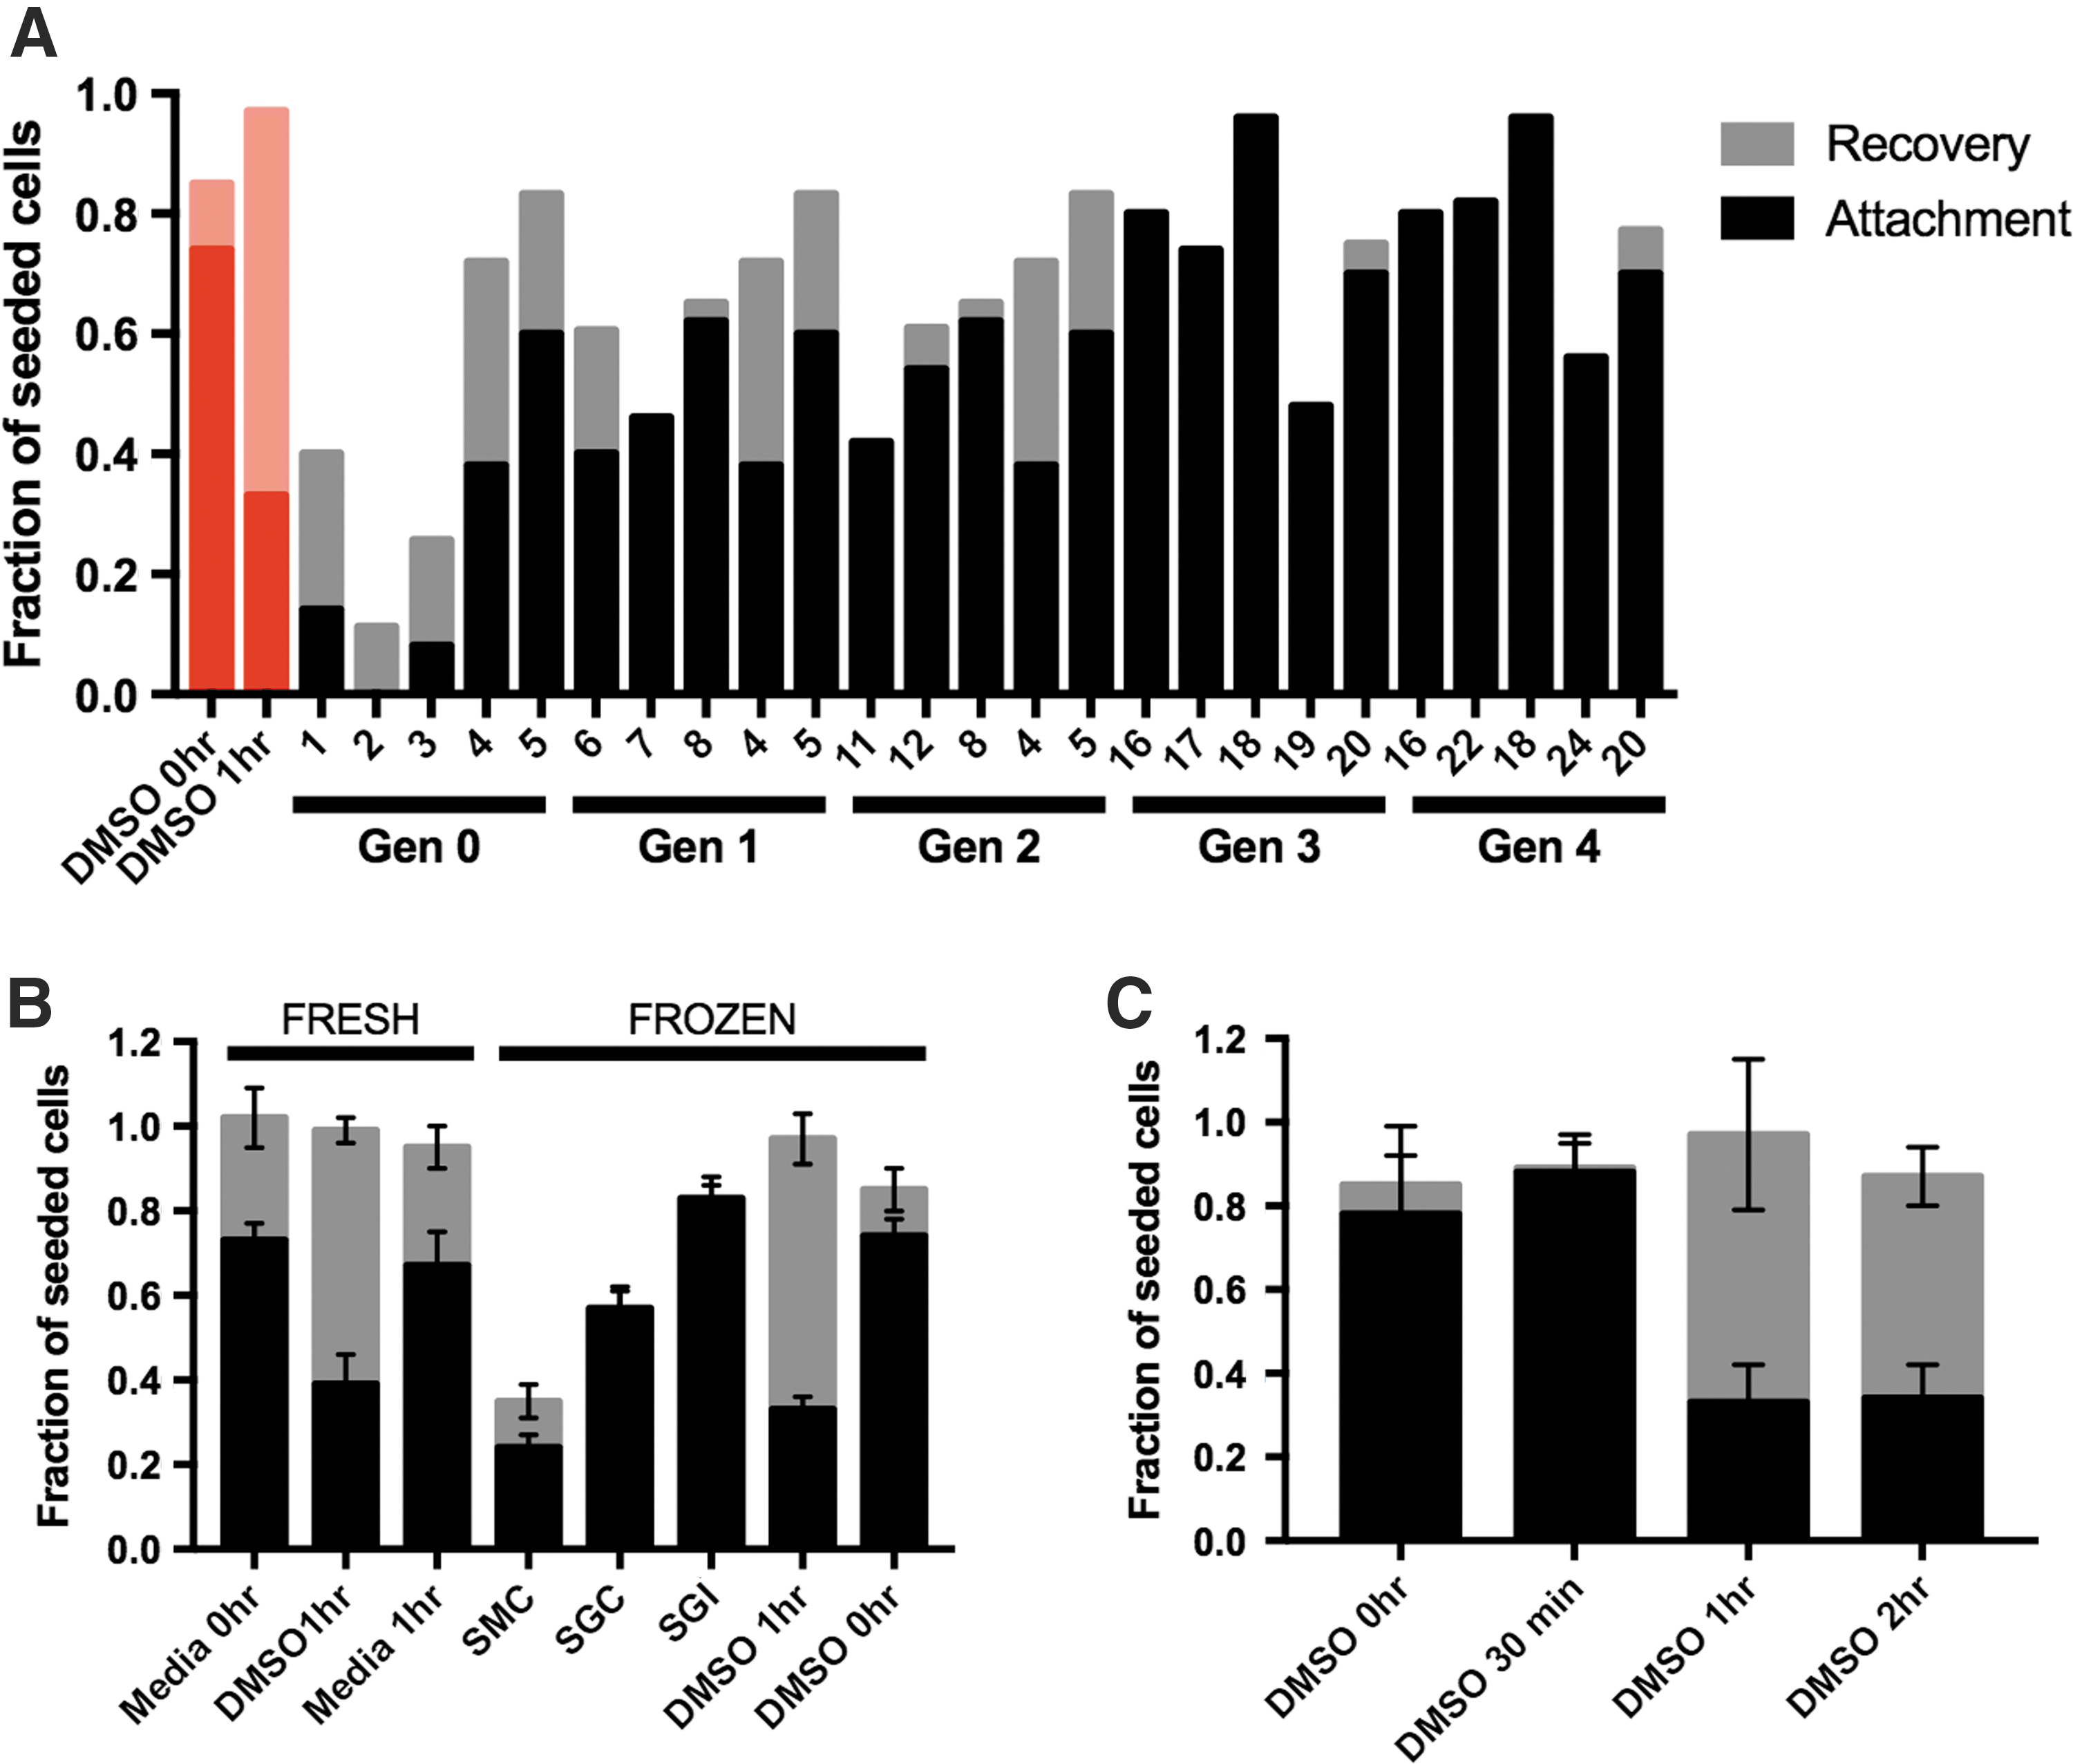
Algorithm optimization and post-thaw characterization of optimized solutions.
MSCs frozen in these optimized formulations were tested for attachment and recovery using statistical triplicates of biological replicates. Figure 1B shows that samples frozen in experimental solutions have different attachment and recovery behavior. High-performing combinations, such as SGI, display recovery and attachment that are not statistically different (P > 0.05) from both fresh cells and samples frozen in DMSO without any further incubation (Fig. 1B, C, “DMSO 0-h incubation”). Other experimental combinations, including SGC and SMC, displayed significantly lower recovery (P < 0.05) compared to fresh samples, but had attachment values that approached their total recovery.
Incubation of the cells in DMSO before freezing did not alter cell recovery but significantly reduced the attachment of cells with a decreasing fraction of cells attaching with increasing time of DMSO exposure (Fig. 1C). Diminished cell attachment was observed for cells incubated with DMSO that do not undergo freezing (Fig. 1B).
MSCs frozen in osmolyte-based freezing solutions retain characteristic cell surface markers, proliferation, and osteochondral differentiation potential
All fresh cells frozen in experimental solutions and DMSO frozen H9 MSCs showed normal expression of positive (>99% for CD73, CD90, CD105) and negative (<1% for CD45) surface markers. These surface marker expression characteristics are well within conventional thresholds for cell surface phenotype expression and show that freezing with DMSO and with experimental solutions does not change the expression of these markers significantly.
Cells displayed normal multilineage differentiation in all samples, as shown in Fig. 2A. Micromass cultures treated with chondrogenic media all showed characteristic blue color after staining with Alcian blue, indicating that these cultures produced glycosaminoglycan content consistent with chondrogenesis. Cell monolayers treated with osteogenic differentiation media showed characteristic red color after staining with Alizarin red, consistent with osteogenesis.

Post-thaw characterization of MSC differentiation, proliferation, and senescence.
Analysis of proliferation (Fig. 2B) showed that proliferative capacity was maintained in SGI samples and was similar to both fresh and DMSO frozen samples, but was slightly reduced in SMC and SGC samples based on the reduced slope of their growth curves between 2 and 24 h.
Senescence (Fig. 2C) did not vary significantly between samples. There were slight differences in senescence per cell at 2 h, and these differences were reduced after 24 h. All samples showed significantly lower senescence than positive control t-BHP-treated cells.
Alignment of the actin cytoskeleton differs between DMSO and osmolyte-based freeze solutions
Actin alignment in fresh, low-passage MSCs tends to be unidirectional (Fig. 3A), with a majority of fibers oriented in a single direction along the axis of the cell. Cells frozen in experimental solutions (Fig. 3B) more closely resemble fresh cells, while DMSO frozen cells (Fig. 3C) exhibit disrupted actin alignment. A quantitative analysis of fiber alignment was performed for fresh and frozen samples by isolating fibers, and grouping each fiber alignment angle into a histogram. For example of highly aligned circle circled in white in Fig. 3A, blown up in 3D this fiber alignment histogram has a clear peak (Fig. 3D), while example of poorly aligned cell circled in white in Fig. 3C, blown up in 3E cells have no discernable peak (Fig. 3E) with comparatively lower standard deviation and peak strength (peak strength = highest/lowest grouped histogram value). The average peak strength (Fig. 3F) and standard deviation (Fig. 3G) for 90 individual cells were not statistically different between SMC, SGC, SGI samples and fresh samples, but were significantly worse for DMSO frozen samples regardless of incubation time. In addition, the average cell size (Fig. 3H) was significantly reduced for DMSO frozen cells compared to fresh samples, while cells frozen using experimental solutions were not significantly different from fresh.
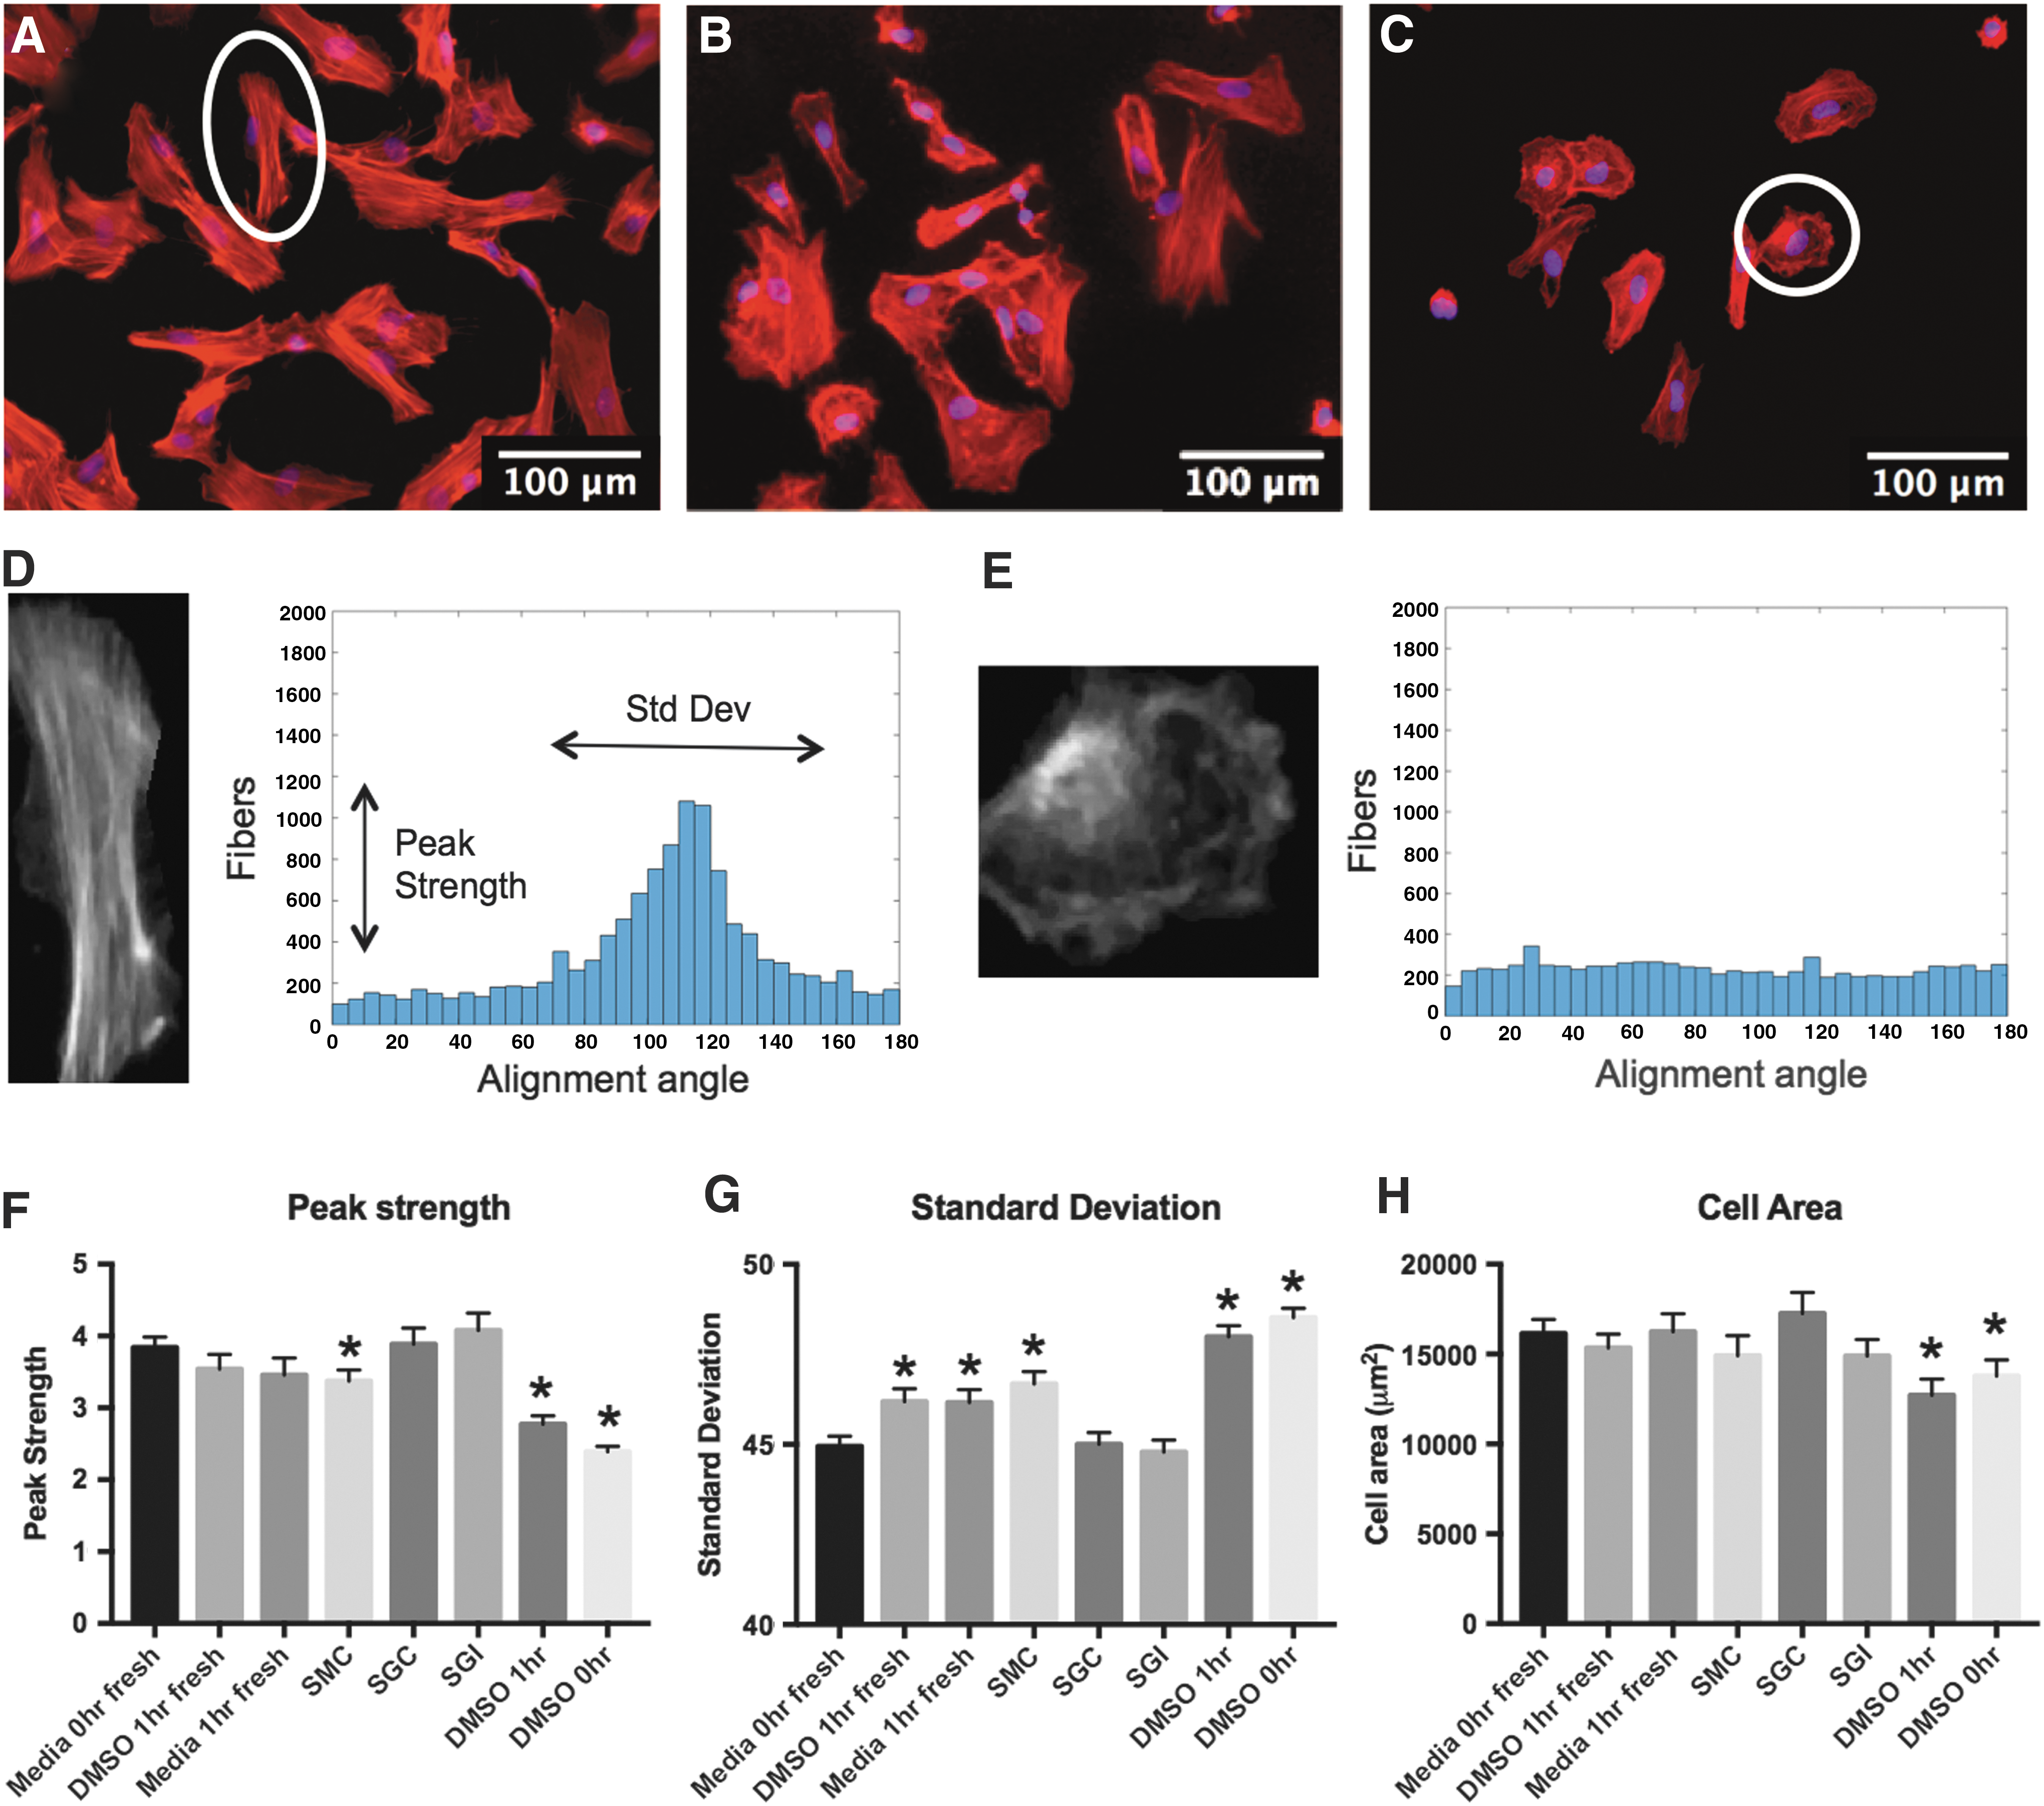
Actin expression and alignment quantification. Cells were stained for phalloidin to observe and quantify actin alignment in all samples, including fresh
DMSO alters epigenetic mechanisms linked to DNA hydroxymethylation
Visual inspection of DNA hydroxymethylation dot blotting (Fig. 4A, replicates in Supplementary Fig. S1) shows that as predicted, fresh nonfrozen cells display the lowest blot intensity and thus the lowest degree of hydroxymethylation. The darkest dots appear for SMC and DMSO 1-h (fresh and frozen) incubated samples. This observation indicates that extended incubation in these solutions increases DNA hydroxymethylation and that these epigenetic changes may be responsible for some of the negative functional behavior observed for these conditions. Quantification of these dot blots (Fig. 4B) shows that only SMC frozen samples exhibit statistically significantly higher DNA hydroxymethylation than fresh media 0-h control cells (P < 0.05). None of the other samples showed hydroxymethylation significantly higher than fresh controls.

DNA hydroxymethylation representing epigenetic changes to cells.
High-resolution analysis of the biological effects of freezing media using RNA-seq
To assess genome-wide expression changes that occur in cells frozen with different freezing methods, RNA-seq analysis of mRNAs was performed for fresh cells, cells frozen in DMSO, and cells frozen with experimental solutions. The expression patterns of genes that had a conservative average expression value across all eight sample groups were subjected to unbiased hierarchical clustering after filtering for expression values (RPKM >0.1; n = 14,542). The resulting heat map (generated using log2 transformed RPKM values) shows that DMSO samples cluster with fresh samples in the same clade, while all samples using the experimental solutions cluster together (Fig. 5A).

RNA sequencing for H9-MSCs immediately post-thaw. A heat map
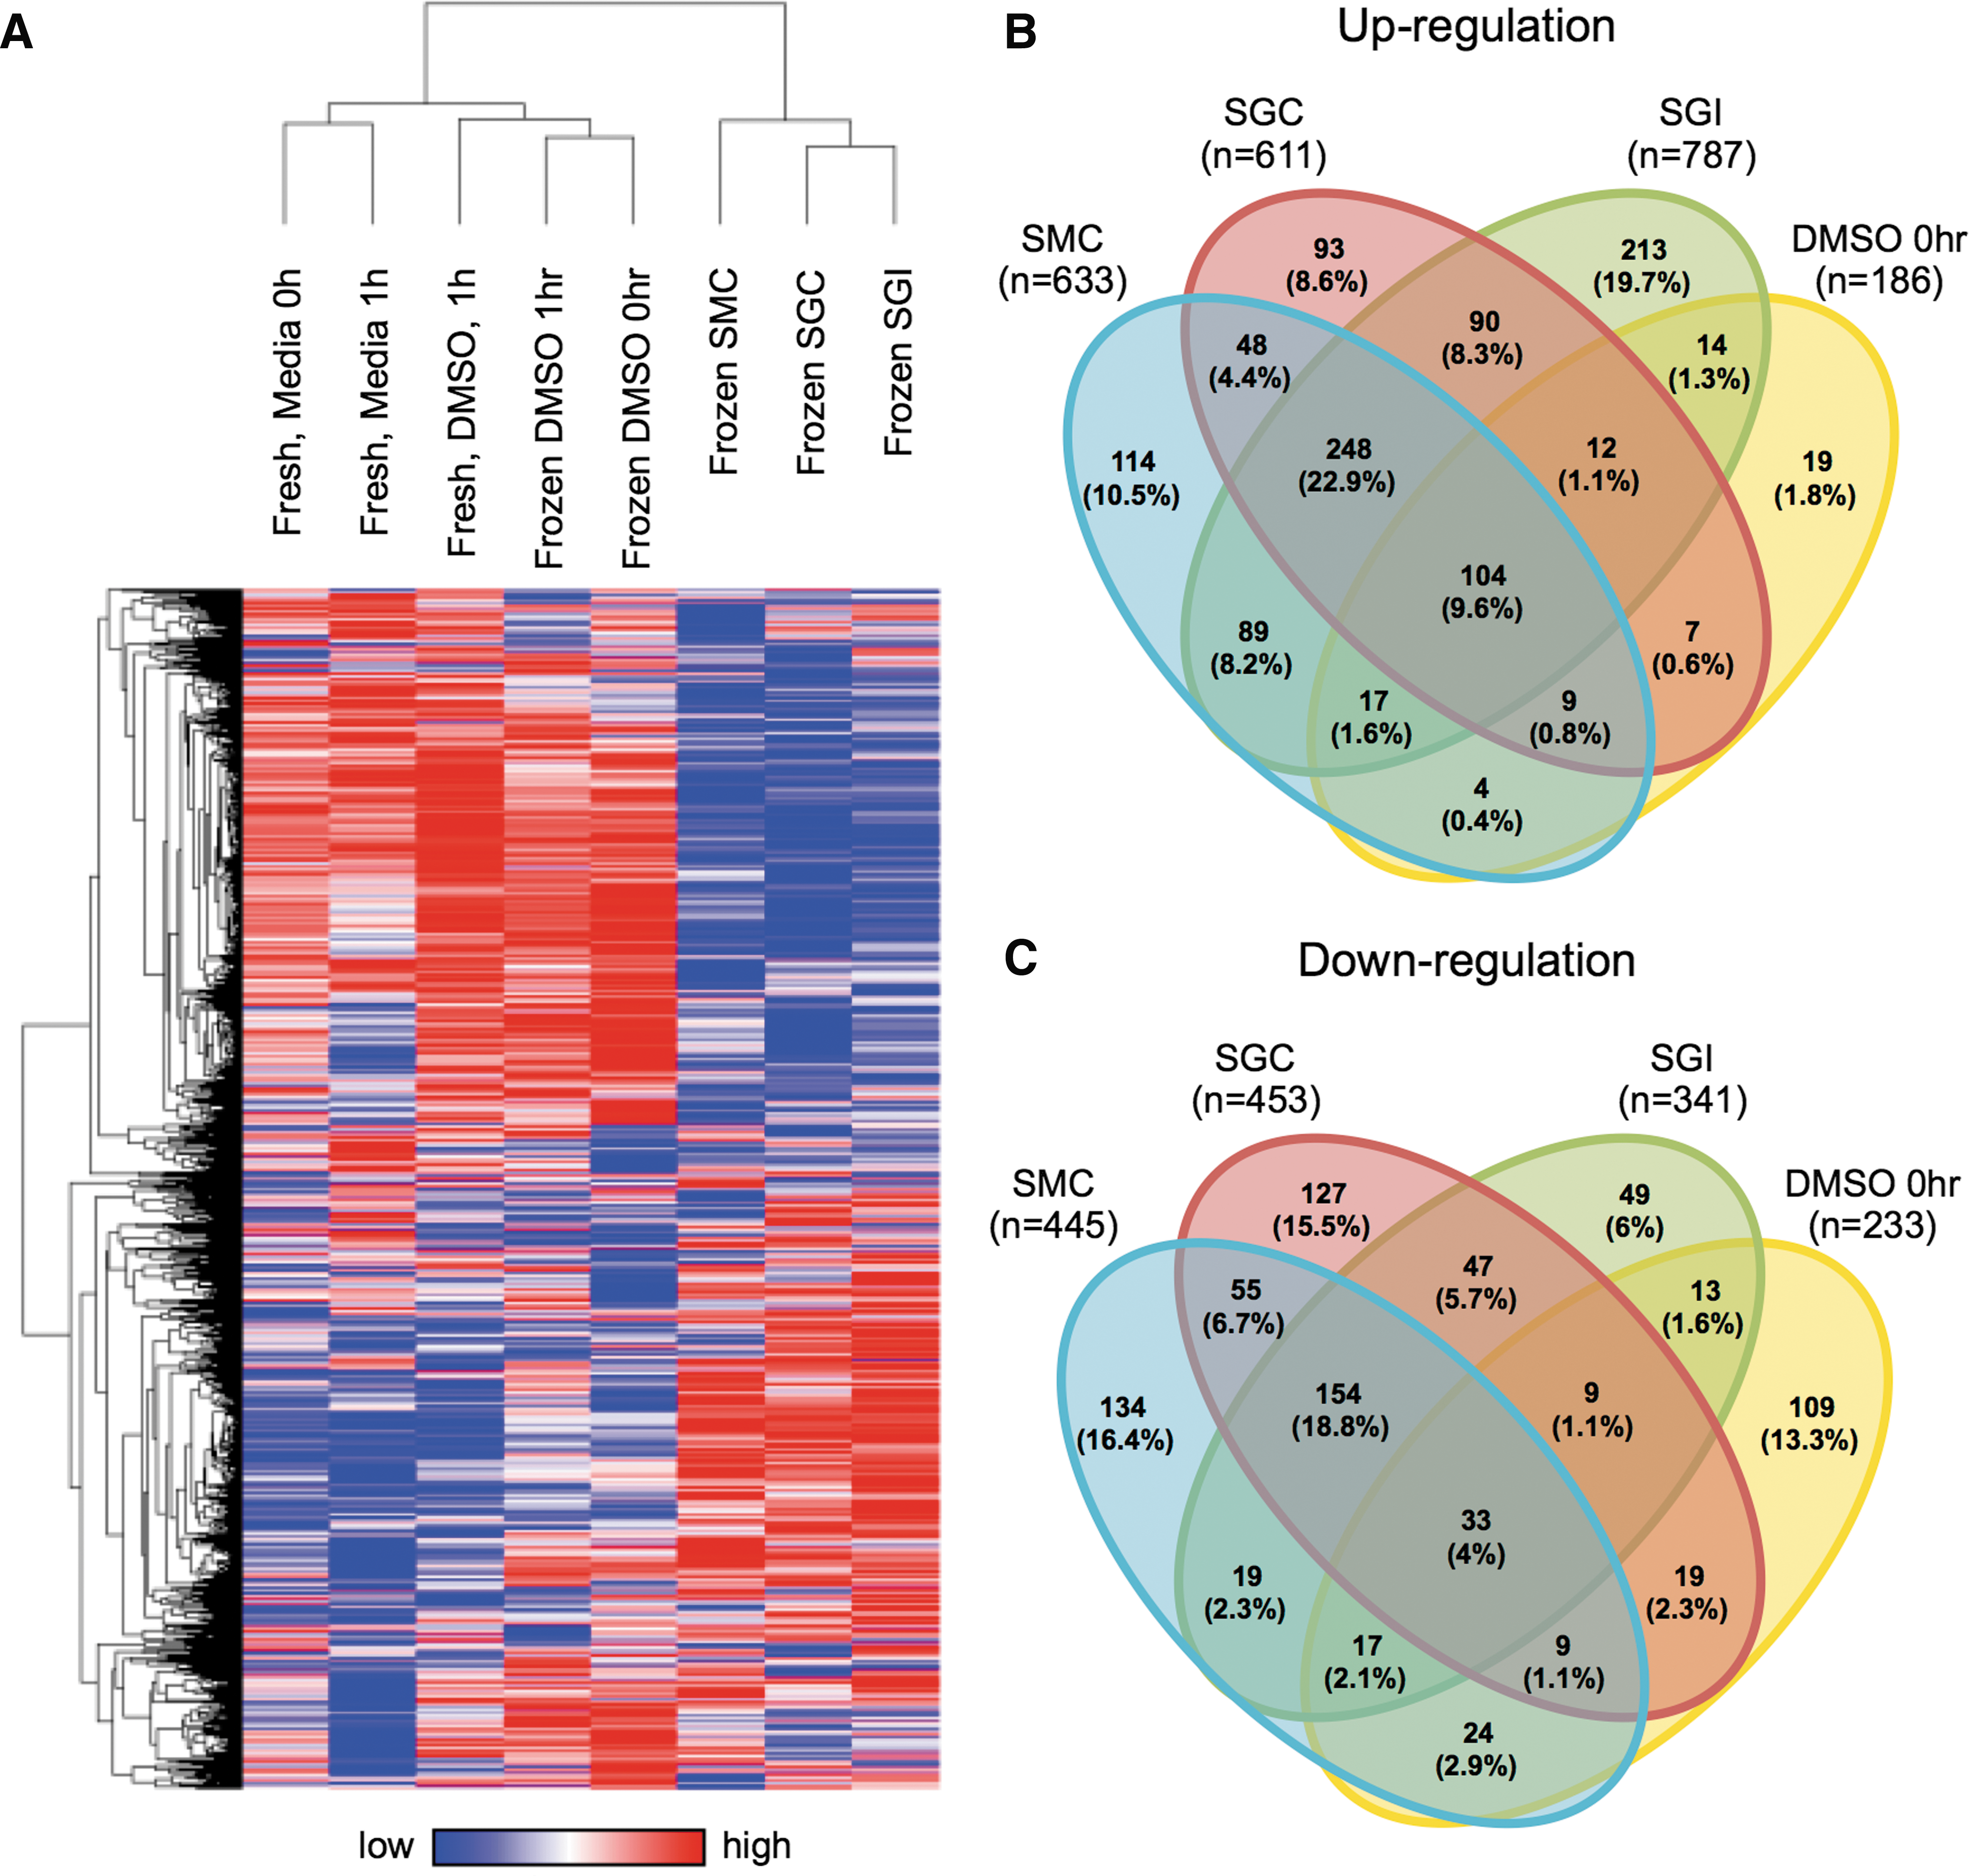
Figure 5B and C summarize the number of genes featured in the heat map in Fig. 5A that were upregulated or downregulated in samples treated with either DMSO or sugar-based antifreeze formulations (ie, SMC, SGC, SGI, and DMSO treatment groups) compared to fresh untreated controls (fold change >2). DMSO upregulates 186 genes, while the experimental groups enhance the expression of more than 600 genes (Fig. 5B). Similar patterns are observed with downregulated genes (Fig. 5C). This comparison demonstrates that DMSO alters the expression of fewer genes when compared to experimental samples.
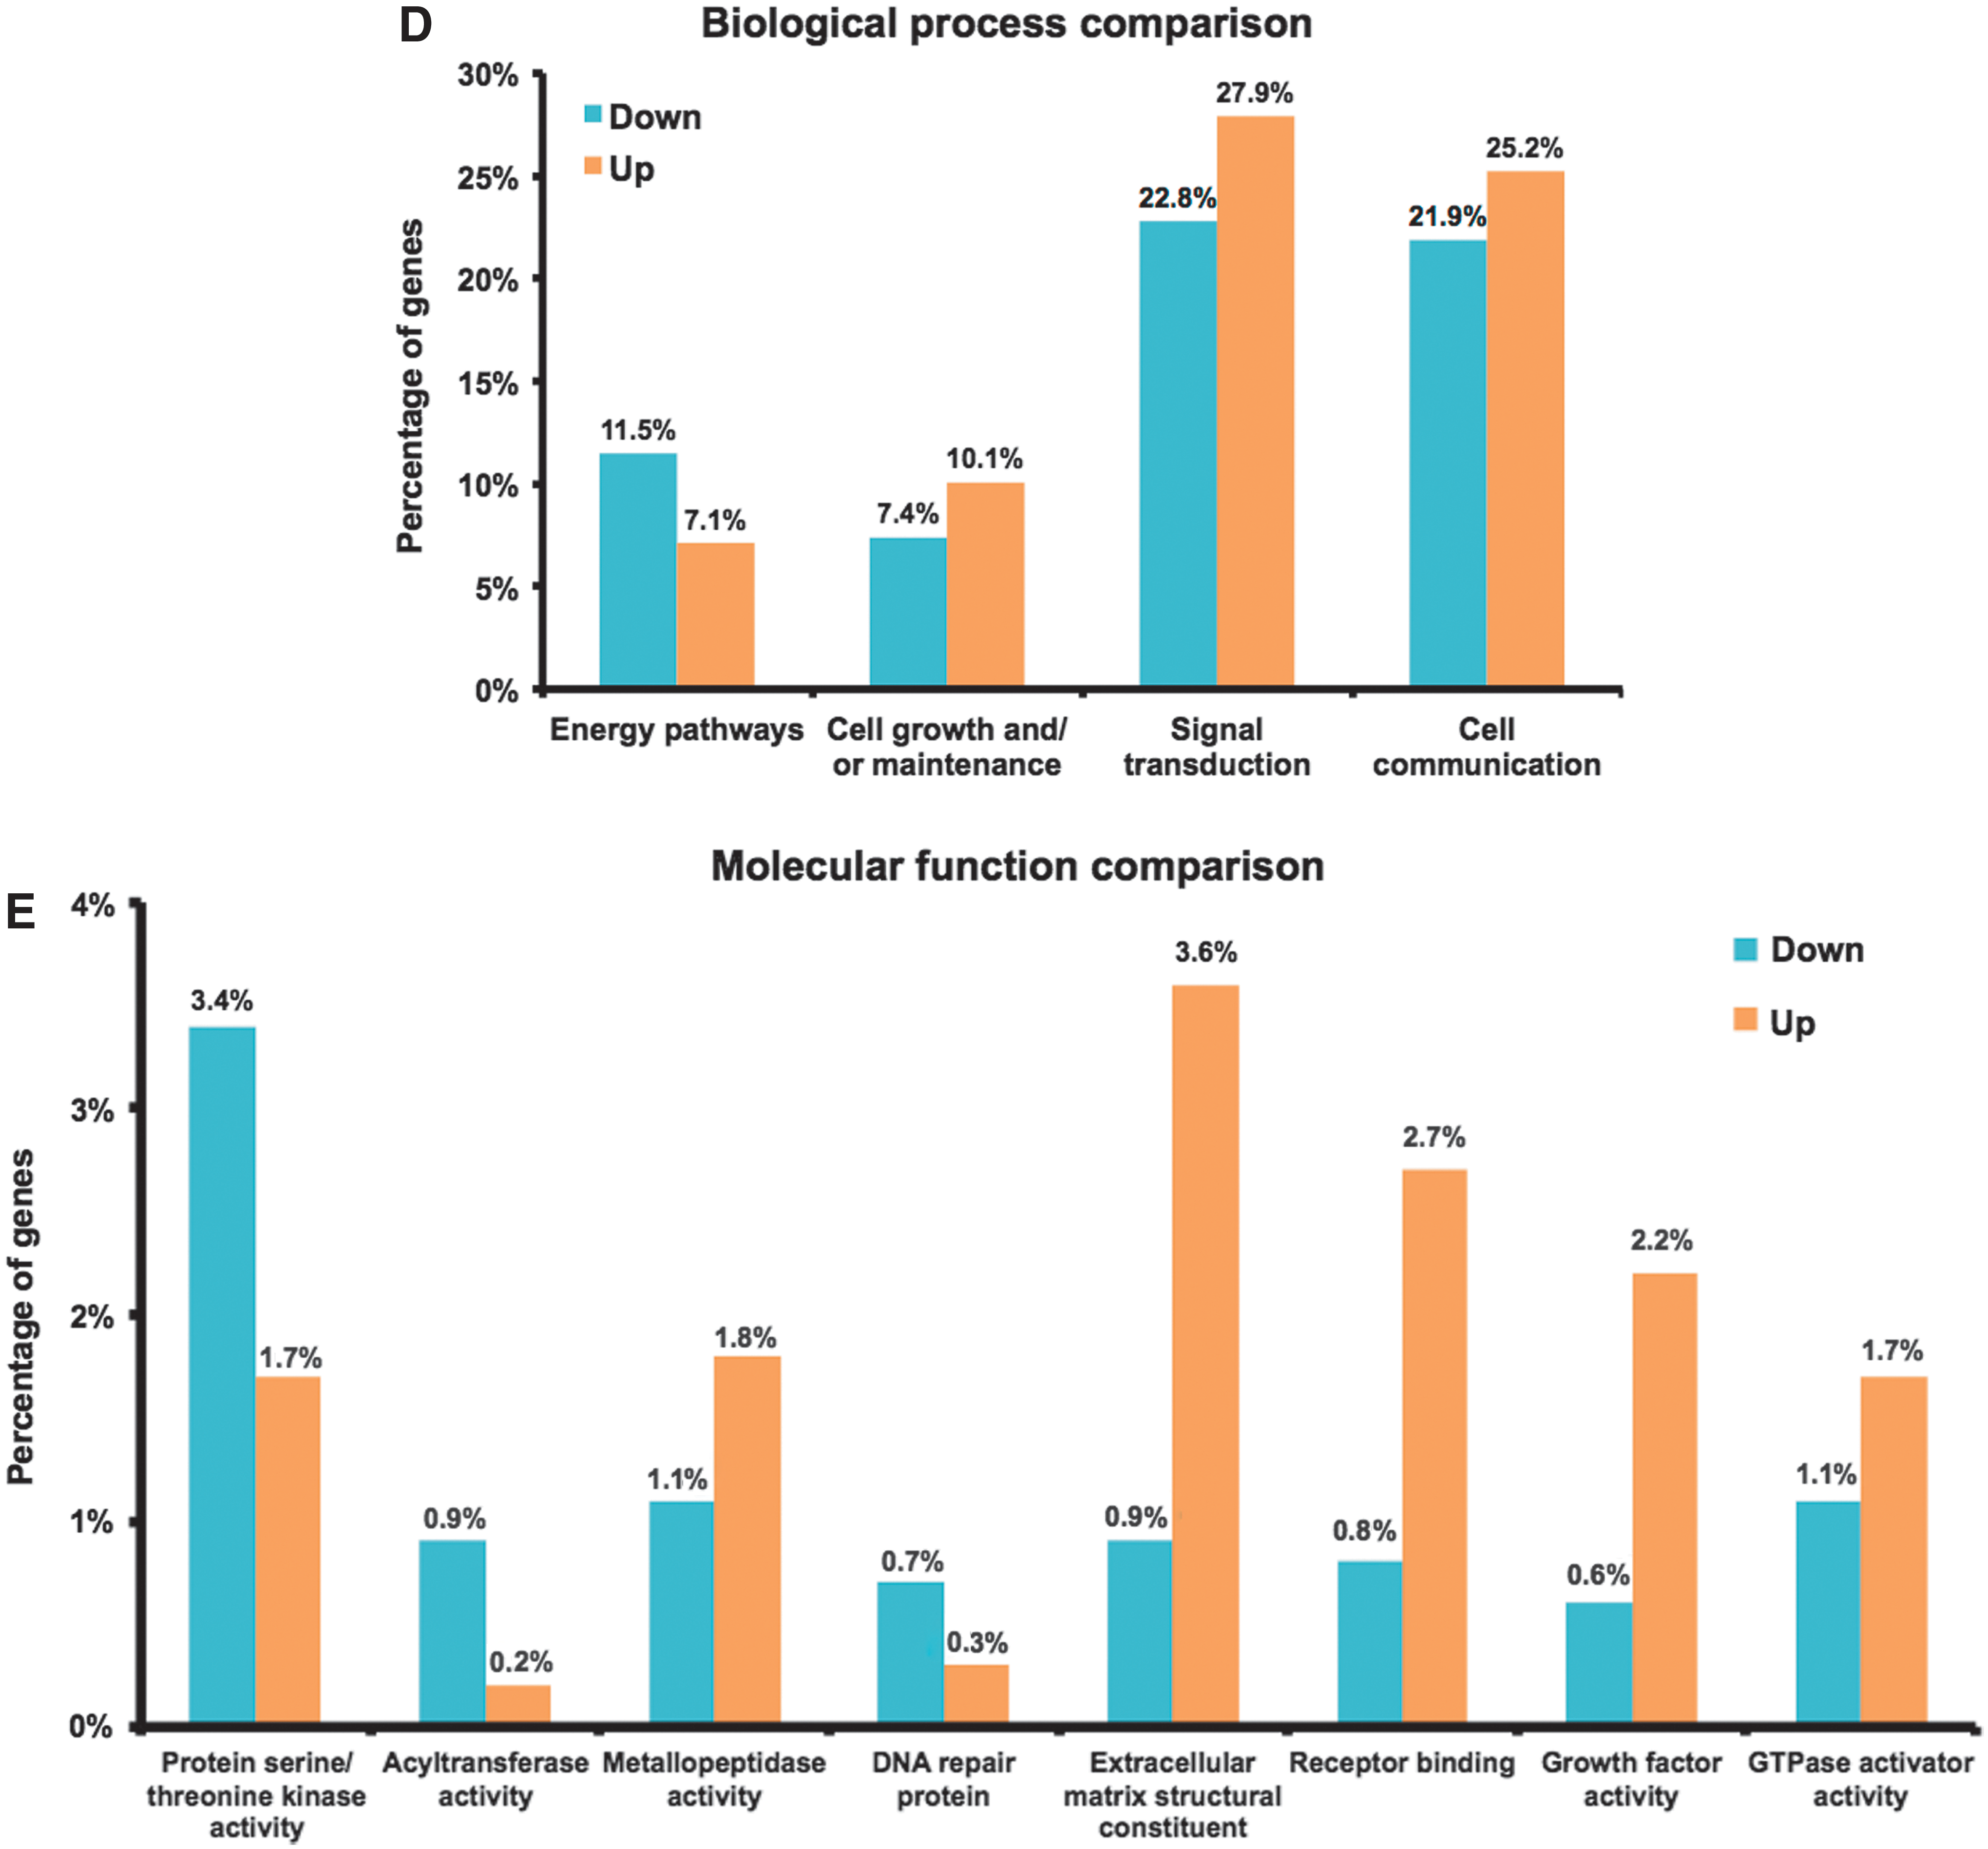
Specific families of genes showed biologically interesting changes in expression. All samples frozen in SMC, SGC, or SGI were averaged and compared to all DMSO samples, and gene ontology graphs revealed differences in the functions of different groups of genes. Specifically, Fig. 5D compares experimental samples versus DMSO and the analysis shows that many downregulated genes are linked to cell energy pathways, while upregulated genes are preferentially involved in cell growth/maintenance, signal transduction, and cell communication. In addition, Fig. 5E shows that cells frozen using experimental solutions exhibit upregulation of genes linked to a number of key molecular functions and pathways, including extracellular matrix deposition, receptor binding, and growth factor-related signaling pathways.
qRT-PCR-gene expression analysis
To complement RNA-seq data, we further analyzed specific genes within select gene categories using qRT-PCR. H9-MSCs subjected to different freezing approaches were assayed immediately post-thaw for the expression of genes related to trophic factor secretion such as hepatocyte growth factor (HGF), vascular endothelial growth factor (VEGF), fibroblast growth factor (FGF2), C-X-C motif chemokine ligand 12 (CXCL12) (SDF-1α), mesodermal lineage markers Twist-basic helix-loop-helix transcription factor 1 (TWIST1), TWIST2 (DERMO1), Msh homeobox 2 (MSX2), the antiapoptotic marker B cell lymphoma 2 (BCL2), surface markers for cell adhesion such as CD106 and CD54, the osmotic regulator marker galanin (GAL)-1, and stress response markers such as early growth response 1 (EGR1) and Nuclear factor (erythroid-derived 2)-like 2 (NFE2L2) (NRF2). The gene expression data for these genes are summarized in Fig. 6. These data show that the levels of HGF, an antiscarring and antiapoptotic factor, showed no differences between different freezing treatments, while fresh, nonfrozen cells showed the highest level of HGF expression.
Gene expression profiles for H9-MSCs immediately post-thaw. This panel included genes for growth factors, adhesion molecules, transcription factors, chemokines, and stress genes. Each reported value was compared to a GAPDH internal control.
Different freezing conditions did not appear to have any marked effects in the expression of VEGF, the mitogen FGF2, the mesodermal genes MSX2 and TWIST1, the osmotic gene GAL, or the antiapoptotic gene BCL2. However, TWIST2 was elevated in almost all of the frozen groups (SMC, SGI, and DMSO freezing for 1 h) except for SGC, which presented TWIST2 transcript levels comparable to fresh samples. Another notable change in gene expression was observed for CXCL12 in two treatment conditions (frozen SMC and DMSO 1 h). Expression of mRNAs for MSC surface markers CD106/vascular cell adhesion molecule 1 (VCAM1) and CD54/intracellular adhesion molecule 1 (ICAM1) was easily detected in H9-MSCs regardless of the antifreeze solution. Assessment of stress–response genes such as EGR1 and NFE2L2 showed; while expression of NFE2L2 did not differ among treatment groups, EGR1 levels were highly expressed in the fresh media 1-h group and were significantly lower in the fresh 1-h DMSO-incubated samples and in all frozen groups.
Discussion
The MSCs used in this investigation were evaluated for well-accepted minimal characterization criteria [6] post-thaw to determine if freezing in experimental solutions altered fundamental aspects of cellular identity. Cell surface marker expression and qualitative differentiation staining did not differ markedly between any fresh or frozen samples. We note that while MSCs are capable of in vivo differentiation [11], they are more likely to exert therapeutic effects by serving as immunomodulators [12,34 –36] and trophic mediators [10,37,38] by inducing responses in endogenous cells via paracrine signaling [39,40].
In addition, proliferation was not substantially reduced in cells frozen in experimental versus fresh cells. The doubling rate was slightly lower in SMC and SGC samples between 2 and 24 h post-thaw, and this may be reflective of the poor recovery (and increased dead cells present) in those samples post-thaw. The results of this in vitro study are consistent with the work by other groups that shows cryopreservation does not negatively impact MSC surface marker expression, differentiation, or proliferation [41 –44]. However, future studies may be necessary to do justice to the full biological potential of these cells, including rigorous quantitative assessments of osteogenic, adipogenic, and chondrogenic potential, as well as their immunomodulatory potential and other trophic functions.
The minimal criteria for defining MSCs established in 2006 [6] specified that MSCs should attach to a plastic surface. This investigation demonstrated that the exposure to DMSO (not the freezing process) results in progressive malfunction of the actin cytoskeleton, as well as the decoupling of membrane integrity from functional behavior (ie, attachment) of the cells. The toxicity of DMSO and resulting changes in cell metabolism, cytoskeleton, and membrane fluidity resulting from exposure to DMSO have been witnessed in a variety of cell types [45] and have been observed since the cryoprotective benefits of DMSO were determined in the 1970s. In contrast, this study demonstrates clearly that combinations of osmolytes commonly used in nature to stabilize biological systems [46] can be effective in preserving MSCs with minimal disruption of the cytoskeleton and maintain the ability of the cells to attach to culture surfaces efficiently.
Recent articles have expanded functional characterization of MSCs to include immunomodulatory functions [47]. Our study also included gene expression analysis by qRT-PCR of growth factors, adhesion molecules, transcription factors, chemokines, and stress genes, which are associated with the functionality and potency of MSCs discussed in articles by Galipeau et al. [47] or Samsonraj et al. [7]. Trophic factors such as HGF, VEGF, and FGF2, which share antiapoptotic properties [48], did not show significant differences between frozen samples. HGF, an important proliferation and migration regulating molecule [49], exhibited reduced expression in all samples compared to a fresh 0-h control, suggesting that procedure-related cellular challenges (eg, room temperature incubation and freezing) may reduce proliferative cell fitness. Furthermore, DMSO-free frozen cells do not show a reduction in angiogenic or antiapoptotic fitness in vitro immediately post-thaw compared to currently available alternatives such as DMSO. Interestingly, mesodermal lineage markers such as those described in Psaltis et al. [50], including TWIST-1, TWIST-2, and MSX-2, exhibit upregulated expression in frozen samples compared to fresh. Thus, experimental solutions retain mesodermal marker expression.
The chemokine CXCL12 (SDF-1α) is secreted by MSCs in response to tissue injury and/or inflammation [51]. For frozen SMC and DMSO 1-h conditions, the levels of CXCL12 were significantly higher. However, other stress response genes EGR1 and NFE2L2 were similar or reduced for all frozen samples compared to fresh media 0-h controls, indicating that experimental freezing did not significantly alter the stress state of the cell. The GAL gene plays a role in osmotic regulation in cells [52,53] and was found to be upregulated in MSCs subjected to experimental freezing conditions. Expression of the antiapoptotic marker BCL2 and cell surface adhesion molecules CD106 (VCAM1) and CD54 (ICAM1) showed similar trends. These patterns are a promising indication that transcription of genes responsible for protecting different areas of the cell (including osmotic regulation, apoptosis, and cell adhesion) during freezing is upregulated for experimental solutions, but not for DMSO.
Methylation and hydroxymethylation of CpG residues in DNA are an essential epigenetic control mechanism that contributes to regulation of gene expression and cellular functions [54]. Previous studies from our group and others have shown that DMSO is a strong inducer of this important epigenetic modification, through which methylated CpG residues on the N5-moiety of cytidine (5mC) are altered into a hydroxyl group (5hmC) [22,55]. Because 5hmC is an important epigenetic mark and because MSCs are important in clinical settings, this epigenomic alteration may affect the potential of MSCs for therapeutic use in the treatment of human diseases, especially since age-associated hydroxymethylation has been reported in MSCs [56]. In this study, DNA hydroxymethylation results indicated that as expected, fresh, nonfrozen control cells had the lowest levels of epigenetic alterations. One solution (ie, SMC) exhibited significantly higher hydroxymethylation than other solutions or in fresh, nonfrozen cells, suggesting that different freezing protocols can create epigenetic changes that must be further analyzed at a higher level of resolution. A combination of dot uniformity and the semiquantitative nature of the image analysis software used to measure the darkness of the dots may have caused error that resulted in differences that were not significant for other samples. This assay shows that using SGI and SGC did not result in significantly worse epigenetic changes than DMSO, while SMC may be a less suitable choice for freezing based on both this hydroxymethylation assay and recovery and attachment.
Heat maps obtained by hierarchical clustering analysis of RNA sequencing results indicate that expression patterns for DMSO samples and fresh samples differ from those determined for experimentally frozen samples. This unbiased high-resolution molecular analysis suggests that DMSO-free cryopreservation solutions alter gene expression. Previous findings have shown that cryopreservation had marked effects on the whole genome expression profile of MSCs, with significant changes in procoagulant tissue factor expression on thawed adipose-derived MSCs as well as altered immunomodulatory activities [57 –59]. In our study, we have demonstrated that genes related to cell growth and maintenance were affected in cryopreserved cells, confirming with previous studies which have shown that genes involved in the inhibition of cellular proliferation and induction of growth arrest were upregulated in the frozen–thawed MSCs [60]. Importantly, our RNA-seq data provide an informative illustration of pathways that appear to be affected in response to different treatments. It is to be noted that the strength of the analysis does not come from the individual value of a gene (RPKM values are reported in Supplementary Fig. S2 for comparison to qRT-PCR), but from the fact that multiple related genes linked to cell growth, differentiation, and/or function are coregulated, and that this coregulation occurs with different propensities as is reflected by the statistical probability values obtained by gene ontology analysis (eg, FunRich and DAVID 6.7). Judging from the beneficial biological effects we observed in retention of “stemness” and lineage potential of MSCs, the cytoprotective responses that are provoked by osmolyte-based formulations appear to be beneficial to cells. Indeed, gene ontology analysis reveals that genes induced by these DMSO-free formulations support cell survival.
Previous studies have shown that cryodamage to cells is transient, and cells revert to normal behavior within 24 h ex vivo [14]. To capture the immediate changes cells undergo in their transcriptome as a result of freezing, we chose to assay cells immediately post-thaw. There is a clinical need for cells to be fully functional immediately post-thaw for some applications in which cells are thawed and transfused at patient bedside. In this respect, it is important to capture the changes to cells at the point at which they would be introduced in vivo.
These studies provide a single cell type ex-vivo perspective on MSC health and functionality in response to cryopreservation in non-DMSO solutions. A single culture cell line of MSCs was used for these studies to support the iterative nature of algorithm optimization, and future studies are currently in progress to evaluate the freezing response of primary MSCs from human donors in non-DMSO cryopreservation solutions. To determine if cells frozen in these solutions are likely to be functional in an in-vivo setting, additional experiments testing their efficacy in a more complex microenvironment will be required. Future studies should evaluate their influence on other cell types by measuring their ability to inhibit t cell proliferation in ex-vivo coculture, and their ability to appropriately home and engraft in an in-vivo mouse model. The iterative optimization process described here could easily be applied to other cell types to identify cell-type-specific non-DMSO solutions that maximize cell recovery or optimize other post-thaw characteristics.
Conclusions
Current methods of preserving MSCs result in cells with poor post-thaw function. This investigation describes new osmolyte-based cryopreservation solutions. These novel solutions exhibit comparable post-thaw recovery and improved post-thaw attachment when compared to conventional methods of preservation containing DMSO. In addition, these solutions promote expression of cytoprotective genes, modulate the CpG epigenome, and retain the differentiation ability of MSCs, suggesting that osmolyte-based freezing solutions may provide a new paradigm for therapeutic cell preservation.
Footnotes
Acknowledgments
This work has been financially supported by NIH R21 EB016247 (A.H.), a dissertation fellowship from the U of MN (K.P.), a hematology workforce-training grant R25HL128372 (K.P., A.S.), as well as NIH R01 AR049069 (A.J.v.W.), F32 AR066508 (A.D.), and the philanthropic generosity of William and Karen Eby. We thank Dr. Peimann Hematti (University of Wisconsin) for providing induced MSCs (iMSCs) from human H9 embryonic stem cells and Dr. Allan Dietz (Mayo Clinic) for stimulating discussions.
Author Disclosure Statement
No competing financial interests exist.
References
Supplementary Material
Please find the following supplemental material available below.
For Open Access articles published under a Creative Commons License, all supplemental material carries the same license as the article it is associated with.
For non-Open Access articles published, all supplemental material carries a non-exclusive license, and permission requests for re-use of supplemental material or any part of supplemental material shall be sent directly to the copyright owner as specified in the copyright notice associated with the article.