
Abstract
The quest for physiologically active human hepatocyte-like cells for in vitro research and drug screening is high. The recent progress in the field of pluripotent stem cell (PSC)-derived hepatic cells within the last decade brings those cells closer to applications in translational medicine. However, the classical two-dimensional (2D) cell culture systems are of limited use, because relevant cell–cell interactions based on cell polarity, which is a major prerequisite for proper hepatic cell metabolisms, are not provided. In this study, we report a scalable 3D suspension culture system, in which PSC-derived hepatic cells can be maintained for up to 3 weeks with stable gene expression profiles and metabolic features in a suspension culture system ranging from a 1.5 mL up to a 15 mL. Adjustments of culture conditions and, most importantly, the size of the organoids resulted in the robust generation of hepatic organoids consisting of a quite homogenous cell population. Importantly, the generation of these hepatic organoids was highly reproducible and allowed, in contrast to hepatic PSC derivatives in 2D culture conditions, a sensitive assessment of acetaminophen-related toxicity, the most common source for drug-induced liver failure.
Introduction
T
To overcome these limitations, scientists suggested the first three-dimensional (3D) cell culture systems already in 1990 [7,8] and nowadays, various types of cell aggregates are investigated as “organoids.” Literally, this term describes organ-like cell aggregates that should represent a given tissue-specific cellular architecture and morphology. In contrast, the term “spheroids” usually describes (cystic) aggregates that are grown in 3D cultivation systems from primary cells such as intestinal stem cells or other organs' progenitor cells. A recent review article by Shamir and Ewald [9] discusses this controversy in terminology and concludes that a variety of cell aggregates are covered by the term organoids: “Various subfields use these terms either interchangeably or distinctly; for example, in the field of mammary gland biology, the term organoids refers to primary explants of epithelial ducts into 3D extracellular matrix (ECM) gels. Conversely, in studies of intestinal biology, organoids can refer to clonal derivatives of primary epithelial stem cells that are grown without mesenchyme or can refer to epithelial–mesenchymal cocultures that are derived from ESCs or induced pluripotent stem cells (PSCs).” Thus, we chose to term the 3D aggregates arisen from the hPSC-derived hepatic cells as “organoids” as well. The remarkable progress in organoid technology of PSC derivatives showed the generation of different organoids such as optical cup [10], pituitary epithelium [11], the intestine [12] and the cerebrum [13]. These findings clearly show the advantage of 3D cell culture, but reports lack complex structures such as endothelial structures [14,15].
The combination of PSC-derived hepatic cells in a 3D scalable suspension system may facilitate in vitro systems and could generate cells featuring the hepatocyte phenotype more distinct than the classical 2D culture system. So far, most studies show the maturation status of hepatic derivatives by their gene expression profile, albumin secretion or, in some cases, the metabolism rate of single depicted cytochrome complexes after stimulation [1,14,16]. In this study, we report the maturation of hepatic cells from pluripotent cells using a 3D culture system. First, the PSCs were differentiated into hepatic progenitors by a WNT signaling pathway modulating chemokine-based protocol [17] in 2D conditions. Subsequently, the cells were transferred to a 3D culture system for further propagation. By testing different media formulations and modulating the size of the organoids as well as the culture volume, we were able to generate organoids in a scalable manner reflecting a higher similarity to primary hepatocytes compared to 2D culture controls. By the choice of the organoid size, it is possible to generate a more complex structure, including cholangiocytic cells and stromal cells in case of large organoids (LOs). When we reduced the size (small organoids, SOs), we obtained a more homogenous hepatic organoid model, where the majority of the cells display a hepatic phenotype close to human hepatocytes. Finally, our hepatic derivatives show a similar sensitivity to acetaminophen as currently applied human hepatocyte cell lines (upcyte® hepatocytes).
Materials and Methods
Maintenance, hepatic differentiation, and organoid culture of human PSCs
Human ESCs (hESCs) of the line H9 were cultured and maintained as described previously [18]. Murine embryonic fibroblasts (MEF) were prepared from CF1 mice (Charles River) and cultured according to standard protocols. The use of hESCs and hiPSCs for in vitro differentiation was approved by the German federal authorities (RKI: AZ 3.04.02/0105). Human PSCs were cultured under standard ESC conditions and then passaged on BD Matrigel™ (BD Biosciences) with the CF1-MEF-conditioned medium. When cell density reached 70% confluence, the medium was changed to RPMI 1640 (Gibco) containing 0.5 mg/mL of bovine serum albumin (BSA), 5% knockout serum replacement (Invitrogen), 1%
Size control of hepatic organoids
Organoids from inoculated Erlenmeyer flasks were sieved after 48 h after inoculation, using a 75 μm nylon strainer (Klein und Wieler, Königswinter, Germany) to get rid of dead and single cells. A second subsequent sieving using a 350 μm nylon strainer (Klein und Wieler) was used to separate larger organoids (≥350 μm) from smaller organoids (≤350 μm) from the inoculated bulk population of organoids. Organoids separated in such a way were transferred back into Erlenmeyer flasks. To quantify the size control, the diameter of 40 randomly used LOs and SOs of each experiment was determined after photography using the cellP software (Olympus).
Immunocytochemistry
Cells were washed thrice with phosphate-buffered saline (PBS), fixed in 4% formaldehyde for 20 min at 4°C, washed thrice with PBS, and permeabilized with 0.2% Tween 20 (Roth #9127.1) plus 0.1% IGEPAL® CA-630 (Sigma #I8896) in Tris-buffered saline (TBS) for 20 min. The permeabilized cells were washed thrice with TBS, blocked with 3% BSA and 0.1% gelatin in TBS for 1 h, and washed once with TBS. Then, the cells were incubated with goat anti-human ALB (Bethyl A80-229A #25) in 1% BSA and 20% donkey serum in TBS overnight at 4°C. The next day cells were washed thrice with TBS and incubated with donkey anti-goat A488 (Jackson Immunoresearch #705-545-003) antibody with 1% BSA for 1 h. For the staining of CK7, CK19, SOX17, and FOXA2, cells were washed and fixed as described above. The cells were then blocked with 1% BSA and 5% donkey sera in TBS for 1 h followed by primary antibody staining diluted in TBS containing 1% BSA (CK7, #AB9021 1:00; CK19, #AB52625 1:200; SOX17, R&D #AF 1924; HNF3ß/FOXA2 Millipore #07-633). Cells were washed thrice with TBS and secondary antibody was diluted 1:300 for all secondary antibodies in TBS (CK7, Jackson Immunoresearch #711-545-152; CK19, Jackson Immunoresearch #171-165-152; SOX17, Jackson Immunoresearch #705-165-147; FOXA2, Jackson Immunoresearch #711-545-152). Cells were washed thrice with TBS and counterstained with 1 ng/mL of 4′,6-diamidino-2-phenylindole (DAPI; Invitrogen #D1306). Staining was analyzed using an Olympus IX71 microscope equipped with appropriate filters for fluorescence detection, and images were processed using the cellP software (Olympus).
Immunohistochemistry
Organoids were fixed in 4% formaldehyde for 2 h at 4°C, transferred to PBS, dehydrated, and embedded in paraffin. For analyses, 3 μm sections were performed. Sections were washed twice in xylene for 5 min, twice in 99% ethanol for 3 min, once in 75% and 50% ethanol, and finally transferred to PBS. Sections were demasked in 10 mM citrate buffer for 20 min at 96°C and slowly cooled to room temperature. For albumin staining, sections were washed thrice with PBS, blocked with 3% BSA and 0.1% gelatin in PBS for 1 h, and washed once with PBS. Then, the sections were incubated with goat anti-human ALB (Bethyl A80-229A #25) in 1% BSA and 20% donkey serum in PBS overnight at 4°C. The next day, cells were washed thrice with PBS, followed by peroxidase block with 3% H2O2 for 20 min. After three washing steps with PBS, sections were incubated with donkey anti-goat HRP (Dianova #705-035-003) antibody with 1.5% BSA for 1 h. The cells were washed thrice with PBS and stained with the DAB staining kit (Linaris #E108) according to the manufacturer's protocol and counterstained with hematoxylin (Sigma-Aldrich #9627). Staining was analyzed using an Olympus IX71 microscope. For cytokeratin and desmin staining, demasked and cooled sections were blocked with 1% BSA and 5% donkey sera in TBS for 1 h. Antibodies were diluted (CK7 #AB9021 1:00; CK19 #AB52625 1:100; Desmin #RB-9014-P1, KI-67 Thermo Scientific #MA5-14520) in TBS containing 1% BSA at 4°C overnight. Sections were washed thrice in TBS and secondary antibody (for CK7 and Desmin Dianova#711-545-152, for CK19 Dianova#711-165-152 or Life Technologies #A10039) was diluted 1:300 in TBS containing 1%BSA for 1 h. Sections were washed thrice with TBA, nucleus stained with DAPI (Sigma Aldrich #D9542) and embedded in ProLong gold antifade mountant (Thermo #P36930). For SOX17 and FOXA2 immunohistochemistry, demasked sections were washed once with TBS, incubated in goat-anti-human SOX17 (R&D #AF 1924) and rabbit-anti-HNF3ß/FOXA2 (Millipore #07-633) antibody in 1% BSA and 2% donkey serum in TBS for 1 h, and washed thrice with TBS, followed by incubation with donkey-anti-goat Cy3 (Jackson Immunoresearch #705-165-147) and donkey-anti-rabbit Alexa488 (Jackson Immunoresearch #711-545-152) antibody for 45 min. Cells were washed thrice with TBS, stained with 1 ng/mL DAPI (Invitrogen D1306) in TBS, and washed thrice with TBS and embedded in ProLong gold antifade mountant (Thermo #P36930). Staining was analyzed using an Olympus IX71 microscope equipped with appropriate filters for fluorescence detection, and images were processed using the cellP software (Olympus). For quantification of KI-67 staining, 10 randomly taken pictures were analyzed at each time point of each experimental group. The percentage of KI-67-positive nuclei over all DAPI-stained nuclei was quantified using ImageJ software.
PAS staining
Paraffin-embedded sections were deparaffinized and washed thrice with PBS. Sections were covered with 1% periodic acid (Sigma Aldrich #P7875) for 10 min, washed thrice, and covered with Schiff's reagent (Sigma Aldrich #3952016) for another 10 min until color reaction occurs. Staining was analyzed using an Olympus IX71 microscope using the cellP software (Olympus).
Gene expression analyses
For gene expression analyses, RNA was isolated from trypsinized cells or organoids using the PeqGOLD Total RNA Kit (Peqlab #12-6634-02) according to the manufacturer's protocol. For cDNA synthesis, the SuperScript™ First-Strand Synthesis System for reverse transcription–polymerase chain reaction (RT-PCR) (Invitrogen #11904-018) was used according to the manufacturer's protocol. Real-time quantitative RT-PCR (qRT-PCR) was performed using TaqMan gene expression assays (Applied Biosystems) for HNF4 (Hs00604438_m1), ALB (Hs01040595_g1), TTR (Hs00174914_m1), ABCC2 (Hs00166923_m1), CYP1A2 (Hs00167927_m1), CYP2C9 (Hs04260376_m1), CYP3A4 (Hs00604506_m1) CK19 (Hs00761767_s1), α-fetoprotein (AFP, HS01040595_G1), and TaqMan 2 × Master Mix (Applied Biosystems #4304437). The reactions were run on a Step One Plus Real-Time PCR System (Applied Biosystems). For all gene expression analyses, glyceraldehyde-3-phosphate dehydrogenase (GAPDH, HS00171403_M1) served as the endogenous control gene.
Cytochrome P450 enzymes activity
The metabolic capacity of cytochrome P450 (CYP) isoforms CYP1A2, CYP2C9, and CYP3A4 from hepatic differentiated cells and organoids was determined by the P450-Glo Assay (Promega; #V8771, V8791 and V9001) according to the manufacturer's protocol. In short, hepatic cells were cultivated and 72 h before P-450-Glo assay measurement, stimulated with 25 μM rifampicin (CYP3A4 and CYP2C9) or 100 μM omeprazole (CYP1A2) with daily media change or without stimulation for basal activity. On the day of measurement, cells were washed with PBS (CYP3A4 and CYP2C9) or the Krebs-Henseleit buffer (Sigma Aldrich #K3753) for CYP1A2. Cells were transferred to the Media/Krebs-Henseleit buffer containing the individual substrate and incubated for 3.5 h (CYP3A4 and CYP2C9) and 45 min (CYP1A2), respectively. For measurement, 50 μL supernatant and some amount of the individual luciferin detection reagent were transferred to a white 96-well plate (Nunc #236108) and incubated 20 min at room temperature. Measurement was performed using the Beckman coulter plate reader, single point measurement for 2 s and 0.5 s delay. Stimulated and unstimulated organoids were subsequent lysed for gene expression analyses.
Flow cytometry
For flow cytometry analyses, organoids were washed thrice in PBS and transferred into DMEM-LG containing 300 U/mL collagenase TypeIV (Gibco #17104019) and incubated for 30 min at 37°C. Organoids were washed thrice and transferred into 0.5 mL TripLE (Thermo #12604013) and incubated for 10 min at 37°C. The reaction was stopped by adding 0.5 mL DTI (Thermo #R002100). Cells were washed thrice in PBS and stained directly for 40 min against CD26 (eBioscience #12-0269-41; Isotype #12-4714) in PBS containing 1% FCS. For CK7 and CK19 staining, cells were fixed for 20 min at 4°C with 4% PFA, washed thrice, and permeabilized with 0.2% Tween 20 (Roth) plus 0.1% IGEPAL CA-630 (Sigma #I8896) in PBS for 20 min. Cells were washed twice and incubated 1 h at 4°C with the appropriate antibody (15 ng/mL for 200,000 cells each) in PBS containing 10% sera of the secondary antibody host. Cells were washed thrice in PBS and the secondary antibody (Dianova #711-136-152 for CK19 and Dianova #115-115-164 for CK7) was diluted in PBS containing 1%FCS with a concentration of 10 ng/mL b for 200,000 cells. Cells were washed thrice and analyzed with FACS Calibur (BD Bioscience) using FlowJowV10 software. For CD26 sorting, cells from the monolayer and organoids were digested and stained as described above. Cells were sorted using FACSAria (BD Bioscience) and analyzed using FlowJowV10 software.
Toxicity assays
Upcyte hepatocytes were plated 24 h prior on collagen typeI (Roche #11179179001)-coated 24-well plates (TPP #92424) in HCM media (Lonza #CC-3198). On the day of the experiments, eight organoids were transferred into each well of a 24-well plate containing 500 μL HCM media and the indicated concentration of acetaminophen. Cells were incubated 4 h at 37°C. WST-1 assay (Roche #05015944001) was performed subsequently according to the manufacturer's protocol. One hundred microliters of each attempt was transferred to a transparent 96-well plate (Nunc #236108) and analyzed using Beckman coulter plate reader.
Statistical analyses
Statistical analyses were performed using a one- or two-way analysis of variance (ANOVA). Tukey's method was employed as a post hoc test. The results shown were obtained by at least three measurements [mean ± standard deviation (SD)] from independent experiments. Differences were considered statistically significant at P-values below 0.05 and are marked with asterisks (*P < 0.05, **P < 0.01, ***P < 0.001, ****P < 0.0001). The size control experiments were shown as median with whisker 1-99 percentile (n = 40 each).
Results
Generation of human hepatic cells from PSCs as starting population
Human ES and iPS cells were differentiated as a monolayer under feeder-free conditions applying a cytokine-based protocol. The PSCs were first differentiated toward a foregut endoderm progenitor population [17] and then further maturated into hepatic cells reflecting a midgestational, fetal phenotype. Most conventional hepatic cells lines, such as hepatoma cell lines, exhibit rather rudimental metabolic function in vitro. Therefore, we compare our in vitro differentiated hepatic cells to the more stable and commercially available upcyte hepatocytes. These cells show an increased proliferation in vitro compared to primary hepatocytes. The metabolic activity of upcyte hepatocytes is similar to primary hepatocytes, but without the overexpression of oncogenes, which immortalize the cells [21 –23]. At the end of this differentiation protocol, the bulk population expresses mature hepatocyte markers such as Hepatocyte nucleus factor four alpha (HNF4a), Albumin (ALB), and ATP-binding cassette subfamily C member 2 (ABCC2) similar to the expression rate of the upcyte hepatocytes. Only the expression of Transthyretin (TTR) is significantly higher in the 2D hepatic cells than in the upcyte hepatocytes. Consistent with our previous findings [24], the 2D hepatic cells also express early hepatic markers such as cytochrome complex P450 subtype 1A1 (CYP1A1) or cytokeratin 19 (CK19) at higher levels than the upcyte hepatocytes. The most prominent fetal marker alpha fetoprotein (AFP) is also significantly higher expressed in the 2D hepatic cells compared to upcyte hepatocytes, suggesting that the cells exhibit a rather midgestational fetal liver cell phenotype (Fig. 1A).
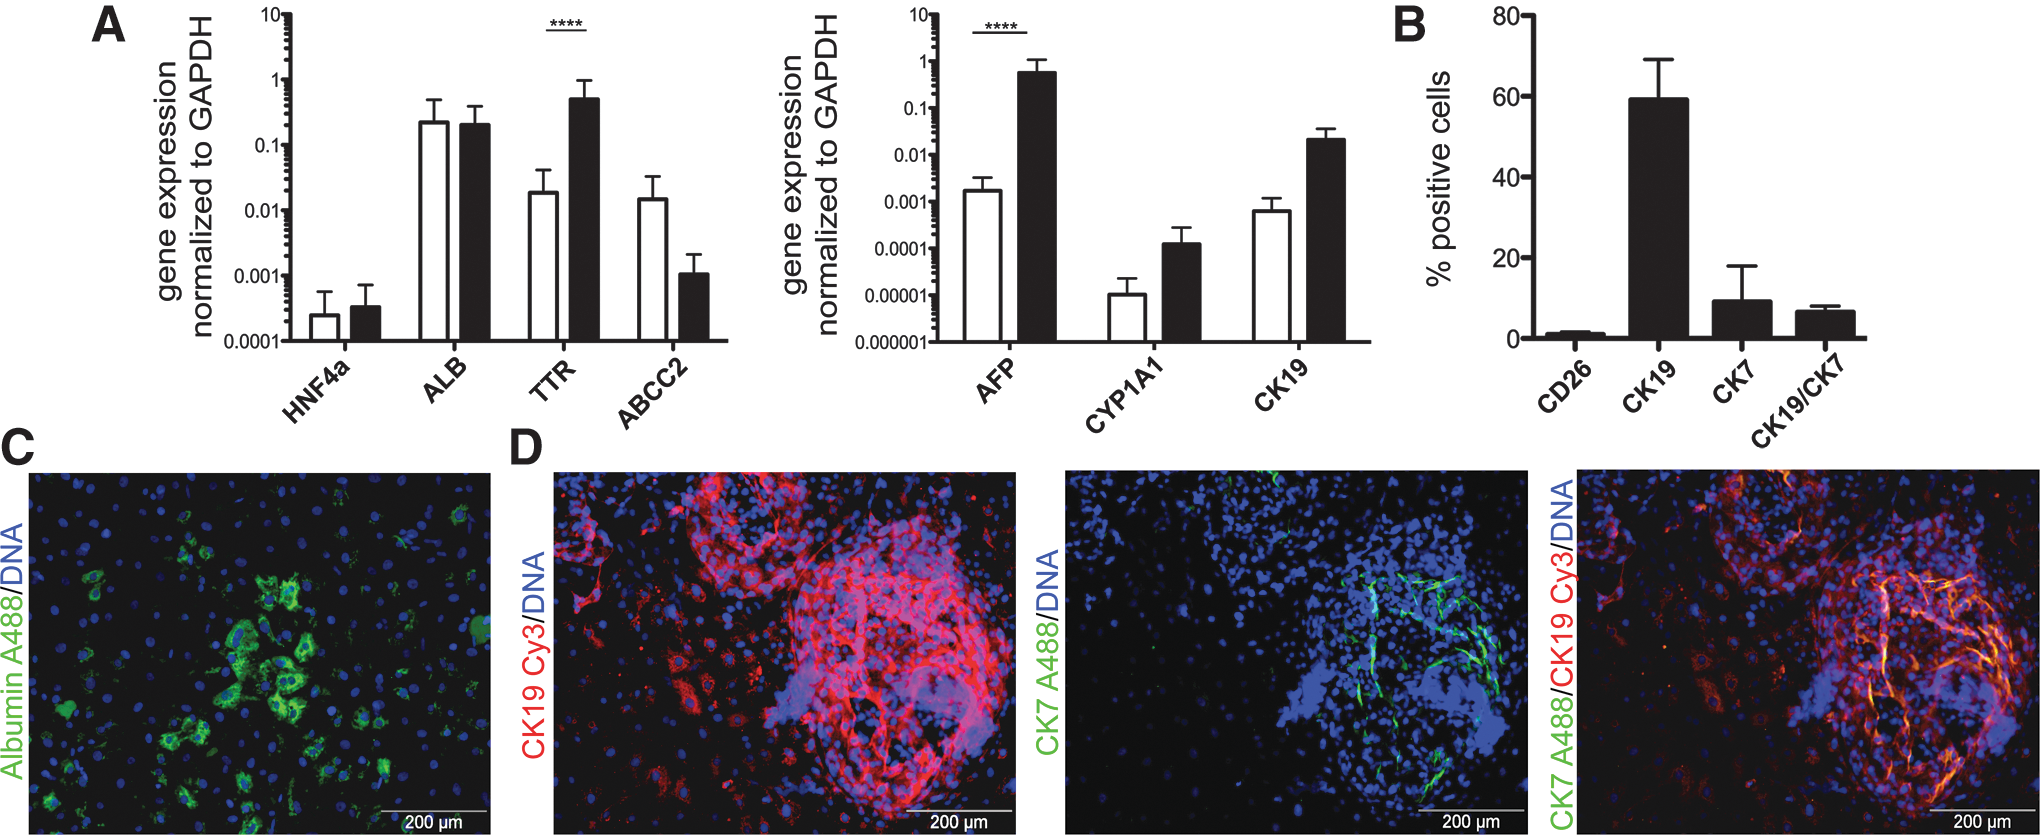
Pluripotent stem cell-derived 2D hepatic cells for subsequent organoid derivation. Pluripotent stem cells were hepatic differentiated applying a cytokine-based protocol under 2D conditions.
Quantification of the 2D hepatic cells by flow cytometry showed that 52.5% of these cells expressed CK19, and 6.5% of the 2D hepatic cells were double positive for CK19 and CK7, indicating a subset of cells having undergone differentiation toward the cholangiocytic lineage (Fig. 1B). This finding could be confirmed by immunocytochemistry staining of the 2D hepatic cells, where the cells exhibited typical hepatic marker such as albumin production. The distribution of albumin-expressing cells was not homogenous throughout the 2D hepatic cells, but rather appeared in small clusters with a diameter of ∼600 μm as shown by immunocytochemistry staining (Fig. 1C). Moreover, quite convoluted areas within the 2D hepatic cells stained positive for CK19 and CK7 (Fig. 1D), demonstrating a high degree of heterogeneity within the 2D hepatic cells comprising less mature hepatic cells as well as cholangiocytic cells. For a better determination of cholangiocytic differentiation, the expression of HNF1b, CK7, and SOX9 was investigated (Supplementary Fig. S1A; Supplementary Data are available online at
Formation of organoids subsequent to monolayer differentiation
To test whether 2D hepatic cells can be further propagated in a suspension culture, mechanically dissected fragments were transferred to a suspension culture (Fig. 2A). Organoid formation occurs spontaneously within 12 h from dissected 2D hepatic cells and the organoids were further incubated and analyzed for their hepatic characteristics.
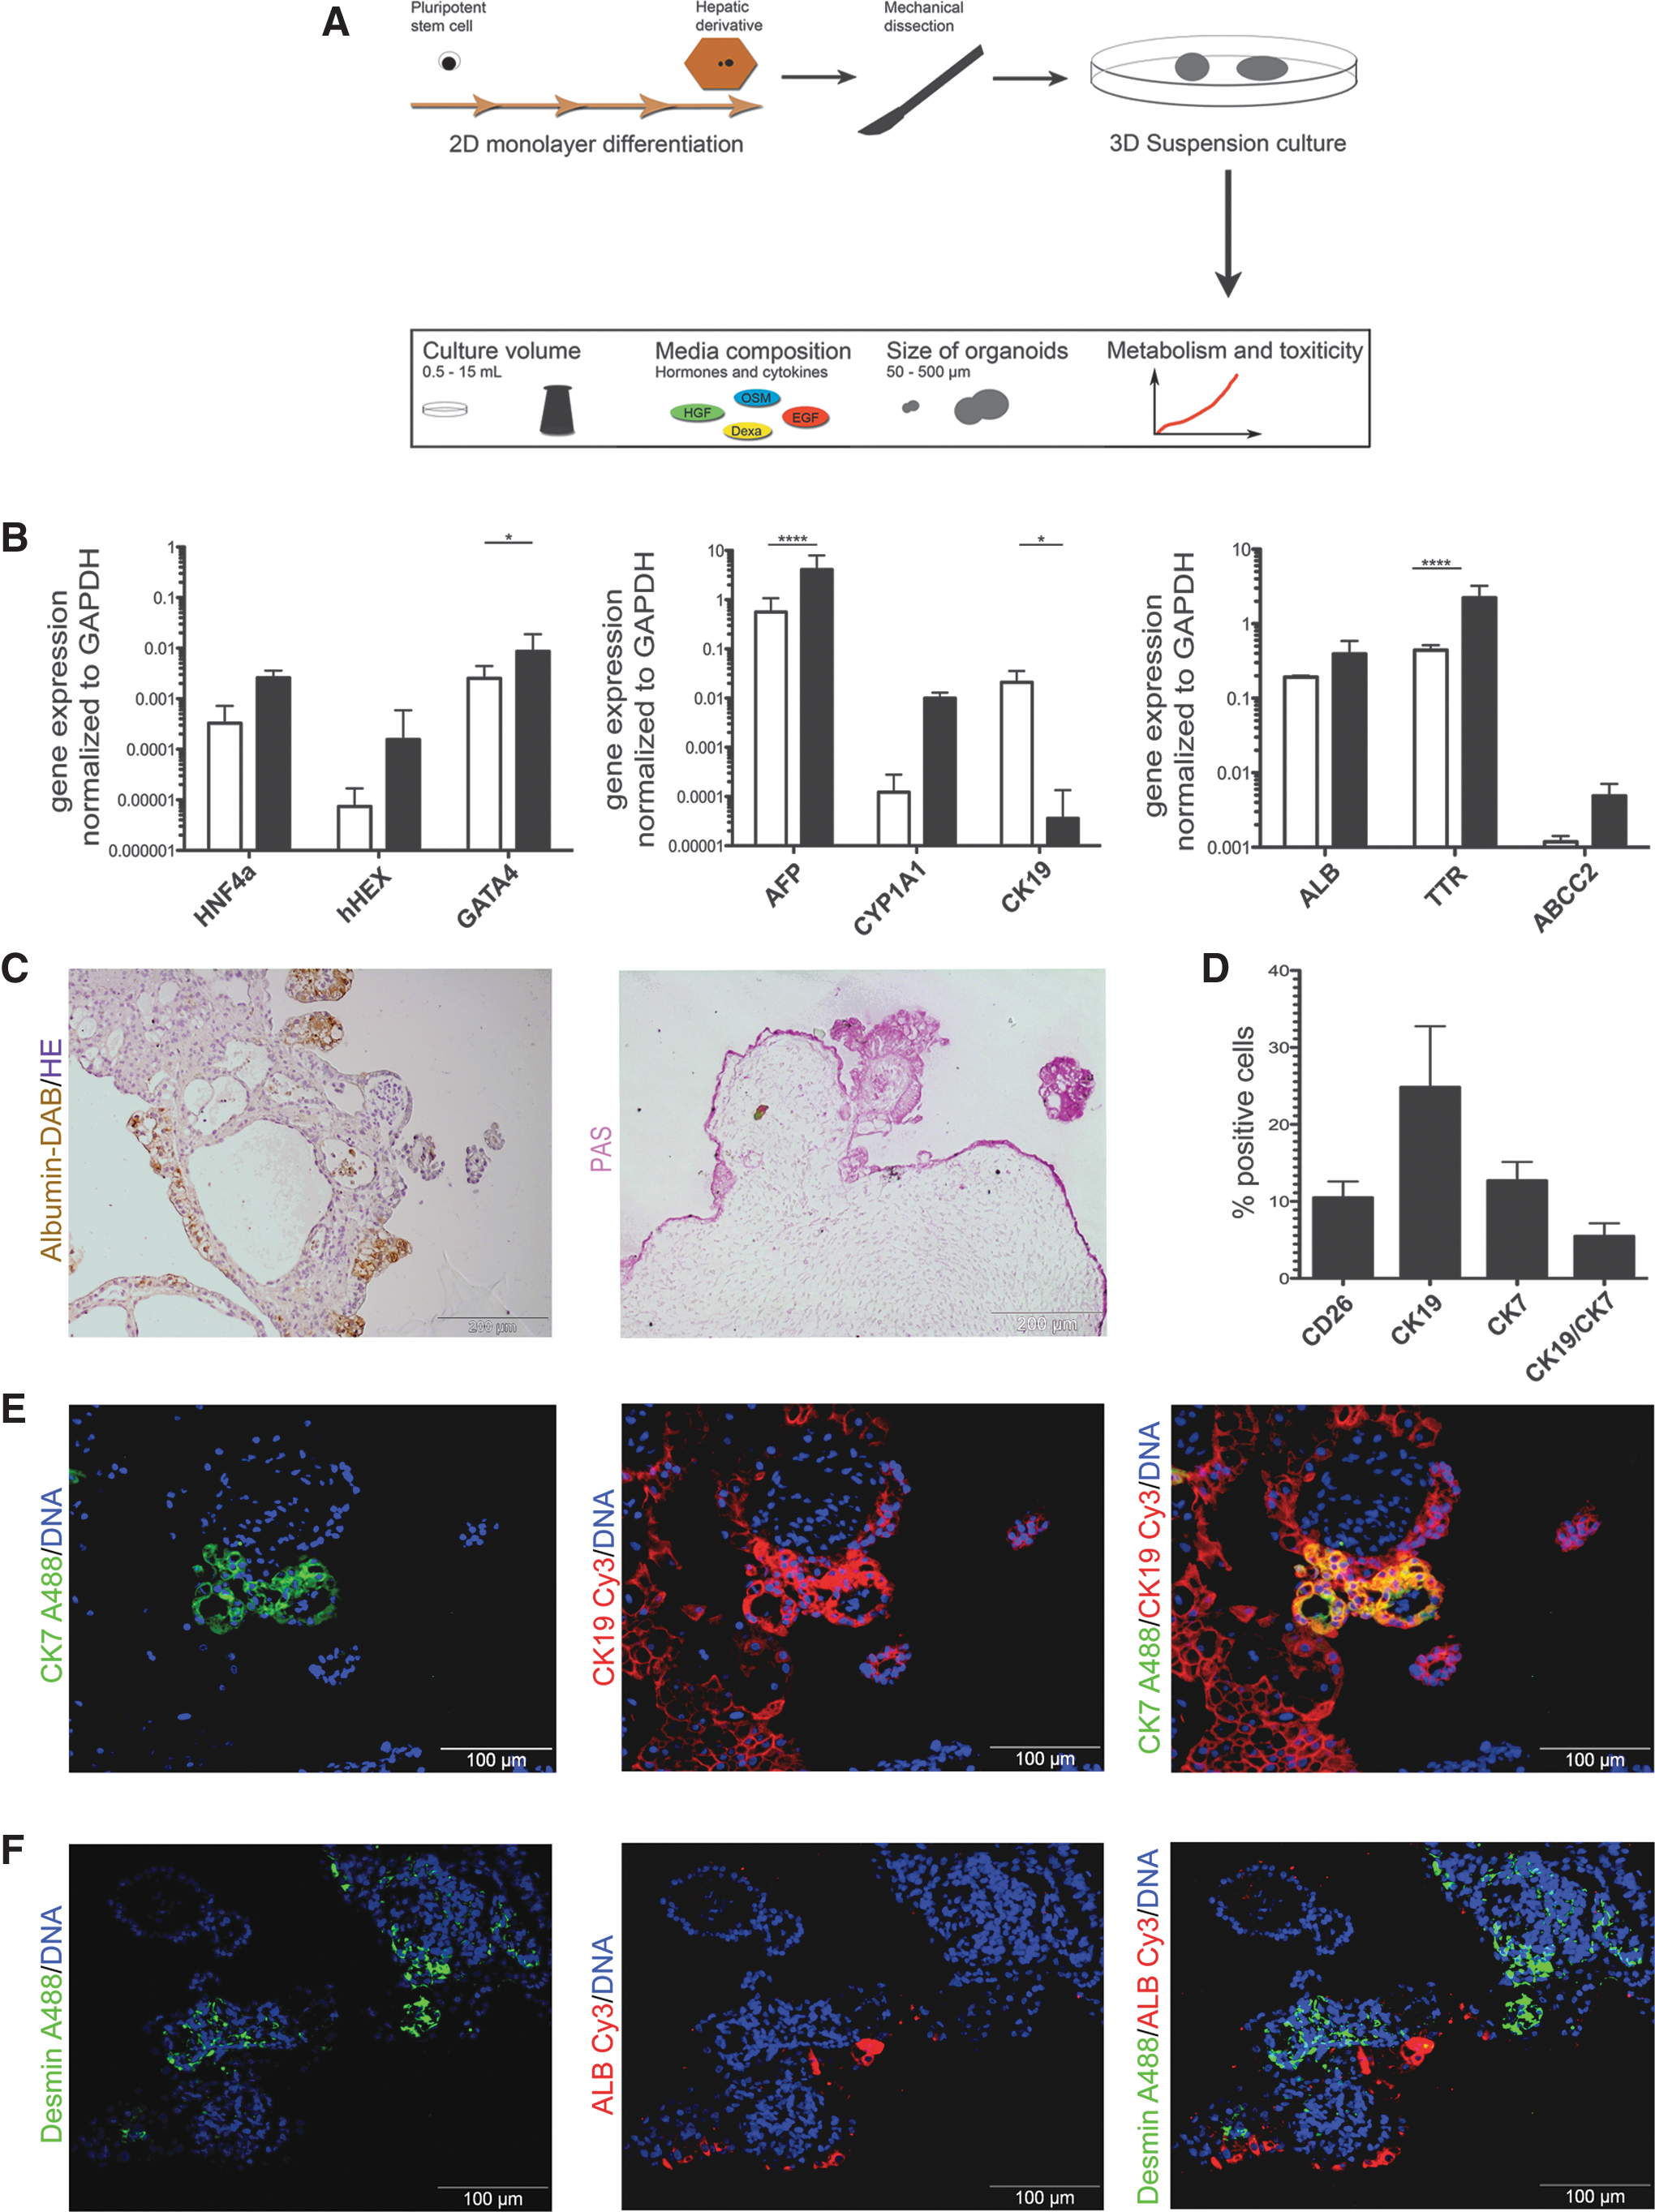
Hepatic organoids derived from 2D hepatic cells after 1 week of suspension culture.
We had the hypothesis that during 2D culture, rather immature hepatic cells were generated and these cells may undergo further hepatic differentiation upon organoid formation in suspension. Thus, the expression profile of key markers appearing during hepatic development was analyzed. The expression of the transcription factor GATA binding protein4 (GATA4), which is essential for the liver specification from the ventral foregut endoderm [25], was significantly increased after the organoid formation (Fig. 2B). Moreover, we could detect an increase of the hematopoietically expressed homeobox protein (hHEX), the expression of which is initially restricted to the definitive endoderm and then to the hepatoblast stage in liver development [26]. The transcription factor HNF4α, which is essential for hepatic specification from PSCs [27], also showed an increased expression in the organoid culture. The expression of the more fetal hepatoblast-related secretory protein AFP increased significantly, as well as of the adult secretory Protein TTR (Fig. 2B). Gene expression of other hepatic-related genes such as the hepatic transporter ABCC2, the metabolic enzyme CYP1A1, and the secretory protein ALB was elevated as well, but without reaching statistical significance in our sample size (n = 3) of independent biological experiments (Fig. 2B). However, the expression of the hepatoblast and cholangiocytic marker CK19 [28] decreased significantly.
Immunohistochemical staining of 1-week-cultured organoids depicted the distribution of nonhepatic and hepatic cells within the organoids. The albumin staining clearly shows the localization of hepatic cells preferentially at the exterior of the organoids (Fig. 2C), which was further confirmed by PAS staining (Fig. 2C). As described above, several areas of CK19 and CK7 double-positive cells within the 2D hepatic cells indicate that a subpopulation of cells underwent differentiation toward the cholangiocytic lineage. To investigate if these cholangiocytic regions were also detectable in the organoids, 1-week-old organoids were stained for CK7 and CK19 (Fig. 2E). These immunofluorescence analyses depicted cholangiocytic differentiation within the organoids, but only few of such cells could be detected at the exterior of the organoids. Importantly, the detected CK7/CK19 double-positive cholangiocytic cells were negative for albumin (Supplementary Fig. S1B), indicating that either a cholangiocytic or a hepatic maturation takes place.
To quantify the fractions of the hepatic and cholangiocytic cells, organoids were dissociated into single cells and analyzed for CK19, CK7, and the hepatic surface antigen dipeptidyl-peptidase 4 (CD26), which is expressed on the basolateral membrane of hepatocytes [29]. Flow cytometry analyses show that 7.90% ± 3.55% of the cells express CD26, whereas 27.1% ± 6.84% express CK19, and 7.01% ± 5.91% express CK7, respectively. Only 3.67% ± 2.58% are double positive for CK19 and CK7 (Fig. 2D). The decline of CK7 expression in the organoids compared to the 2D hepatic cells could also be confirmed by qRT-PCR (Supplementary Fig. S1A), while other investigated cholangiocyte-associated genes did not alter significantly. Because the organoids consisted of large areas, which do not express any of the investigated hepatic or cholangiocytic markers, we were interested if these cells arose from remnant mesendodermal progenitor cells yielding other sublineages' derivatives during the propagation of the organoids. Interestingly, these cells mostly form cystic structures surrounded by a homogenous cell population. To test if these structures represent a stromal cell population, organoid sections were stained for desmin, a common marker for stromal cells [30,31]. Immunohistochemical analyses demonstrated that cells between these cystic structures are positive for desmin, but not for the hepatic marker albumin (Fig. 2F). To gain insights into the formation of these cystic structures, we investigated a time series of the organoid formation at 24 h, 48 h, and 1 week after inoculation of the Erlenmeyer flasks. First, we analyzed the cell proliferation by KI-67 staining to understand to which extend the organoid composition might change during the cultivation period (Supplementary Fig. S1C). Within the LOs ∼40% of the cells were positive for KI-67 within the first 24 h. The amounts of KI-67-positive cells constantly decreased over time, but were still detectable after 1 week of 3D culture. Next, the expression of pluripotency-associated markers was analyzed by immunofluorescence analyses, where no expression of pluripotency-associated markers (OCT4, NANOG, and SOX2) was detectable (data not shown). However, at 48 h after organoid formation, we could detect a population positive for SOX17 and FOXA2 (Supplementary Fig. S1D) in the LOs, which was as well detectable after 1 week of organoid culture. Interestingly, the amount of endodermal progenitor cells was considerably higher in the organoids than the amount that was observed in the 2D hepatic cultivation system, in which only single cells expressed these markers.
Adjustment of suspension culture conditions for improved hepatic characteristics
Next, we sought to improve the organoids' homogeneity and obtain a more enriched fraction of hepatic cells. To this end, we tested modified culture conditions and the impact of the initial aggregate size at the start of the suspension culture. The initial set of experiments was performed under culture conditions that probably do not fully reflect the putative needs of the 3D organoid cultures. Therefore, we tested slightly modified culture conditions to enhance the hepatic characteristics of the 3D organoids. Moreover, we investigated the organoid culture setting in Erlenmeyer flasks.
To evaluate modifications of the culture medium, we first focused on the pleiotropic cytokine Oncostatin M (OSM). OSM stimulates the expression of hepatic differentiation markers and induces liver-specific functions such as ammonia clearance and glycogen synthesis, but can also enhance the growth of endothelial cells by the stimulation of vascular endothelial growth factor expression [32,33]. Considering the appearance of desmin-positive cells in the previous setting, we omitted Oncostatin M from the medium. The corticosteroid dexamethasone in addition with EGF and HGF induces gene expression in hepatic organoids [34], but can also inhibit the proliferation of hepatocytes [35]. Therefore, we also omitted dexamethasone from the medium to rather support the proliferation of hepatic cells. Repeating the qRT-PCR analyses, we were able to demonstrate that the expression of all analyzed genes did not alter significantly, except that of ALB, which increased 5.91-fold (Fig. 3A). To test if the amount of nonhepatic cells within the organoids could be modulated, we next tested the impact of the 2D hepatic cell-derived aggregate size, from which the organoids arise. Using smaller monolayer fragments (of ∼2 mm2) resulted in organoids with an average diameter of 100 μm. This procedure indeed reduced the presence of nonhepatic cells (Fig. 3C, D). Subsequently, all further organoids were generated by this strategy and were termed “small organoids”, whereas the organoids generated in our initial experiments were termed “large organoids”. Compared to LOs, the SOs showed a significant increase of the maturation markers such as ALB (63.13-fold) and TTR (14.59-fold). Other fetal-related markers such as AFP and CYP1A1 did not increase significantly under same conditions. One of the most important transcription factors for hepatic maturation, HNF4a, increased significantly by 5.8-fold in the SOs, suggesting an improved maturation toward hepatic cells (Fig. 3B). However, the expression of hHEX did not change significantly under these culture conditions when directly compared to LOs. These findings on the mRNA expression were substantiated by immunohistochemical staining for the hepatic marker albumin (Fig. 3C). The CK7/CK19 double-positive population decreased within the SOs, although it did not vanish completely (Fig. 3C). Comparable to the LOs, we were not able to detect a coexpression of the cholangiocytic marker CK7 together with albumin (Supplementary Fig. S1B), but a coexpression of the hepatoblast marker CK19 together with albumin.
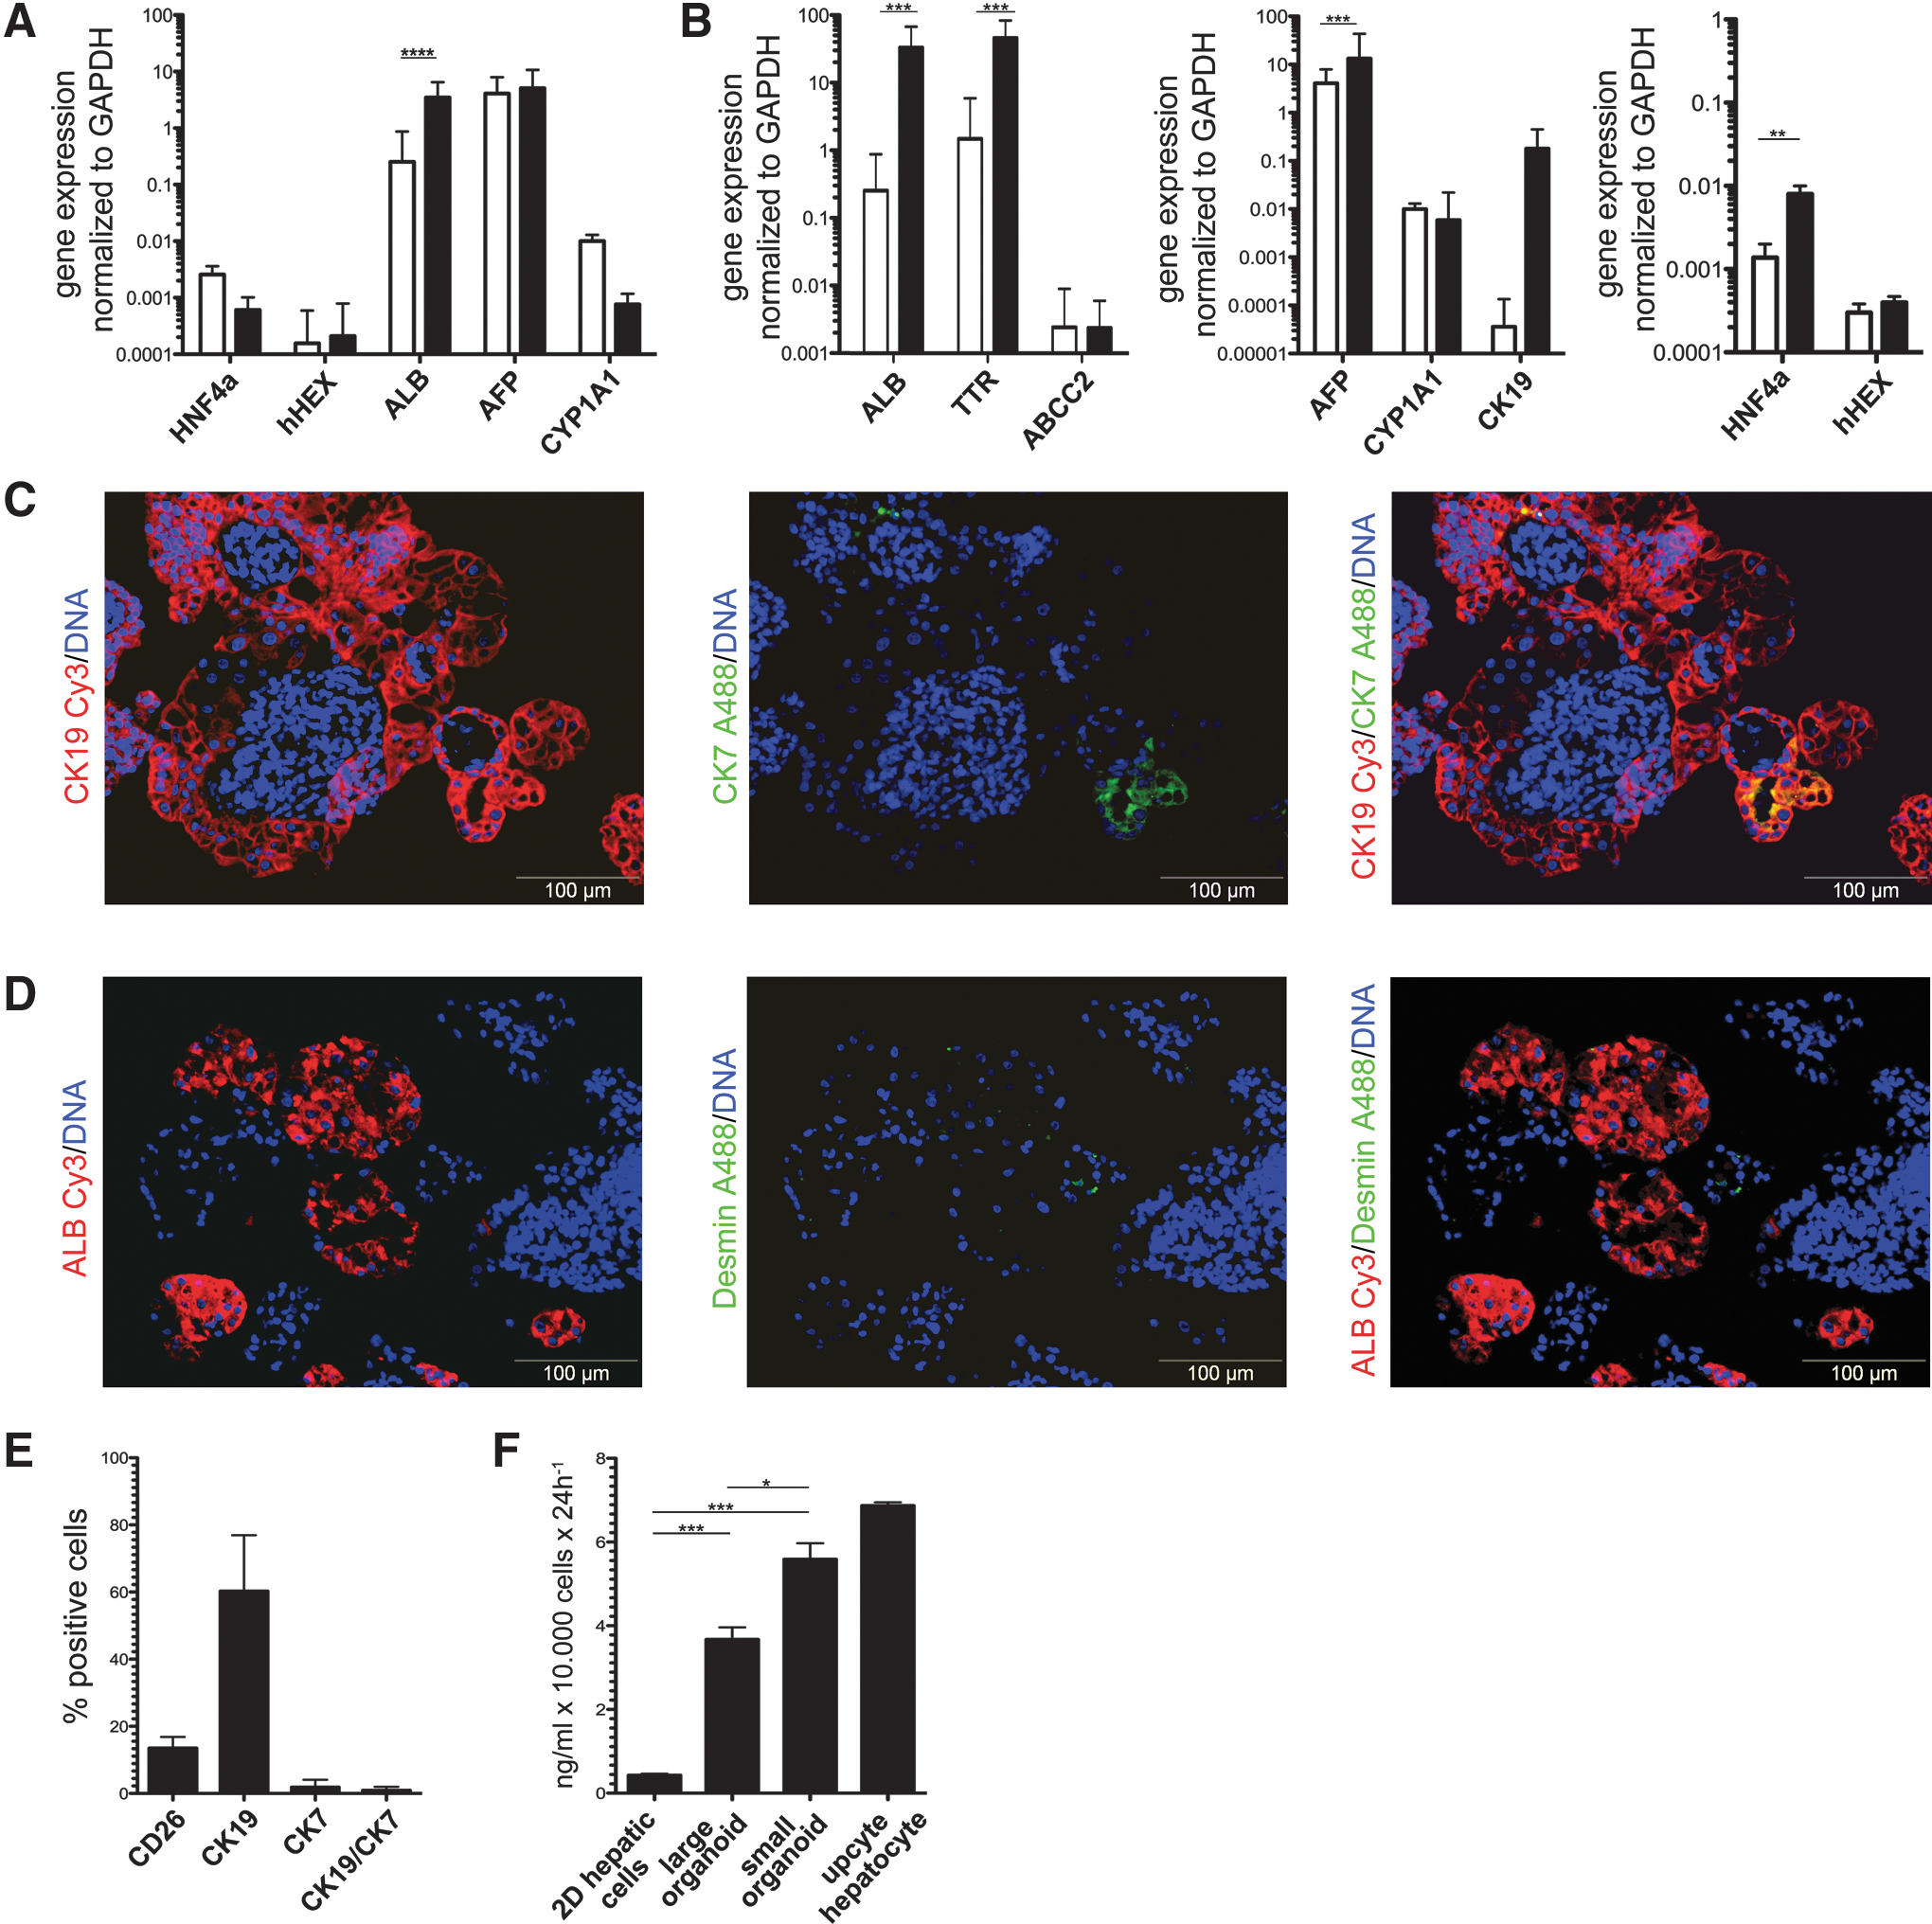
Formation of PSC-derived hepatic organoids under improved conditions.
The CK7 expression significantly decreased in the SOs (Supplementary Fig. S1A), whereas the transcription factors HNF1b and SOX9 show a slight, but not significant, decrease compared to LOs. Based on CD26, CK19, and CK7 expression, we quantified the amount of hepatic cells (CD26+), hepatoblast-like cells (CK19+), and cholangiocytic cells (CK19+/CK7+) within the SOs. Therefore, we dissected SOs into single cells and analyzed them by flow cytometry (Fig. 3E). Within SOs, the amount of mature hepatic cells, indicated by CD26, increased to 14.8% ± 4.365% (1.87-fold increase compared to LOs). Numbers of cells reflecting a hepatoblast-like phenotype, indicated by CK19 expression, increased to 58.23% ± 21.99% (2.15-fold compared to LOs) and cells reflecting a cholangiocytic phenotype, indicated by the expression of CK19 and CK7, decreased to 0.78% ± 0.745% (0.13-fold compared to LOs). Finally, we were interested if the hepatic cells in the SOs and the LOs reached a similar grade of maturation or if one condition was more preferable than the other. Therefore we performed an additional set of experiments, where we sorted CD26-positive cells, and analyzed gene expression profiles of key hepatic markers in the sorted hepatic cells on the LOs and SOs (Supplementary Fig. S2). In this study, we observed a 1.7-fod increase of CD26-positive cells in the SOs (24.7% vs. 14.5% in the LOs, Supplementary Fig. S2A). For all investigated markers (ALB, HNF4a, AFP, CK19, and CYP3A4), higher mRNA expression levels were observed in the SOs compared to the LOs (Supplementary Fig. S2B). The increase of the hepatic marker genes ALB, HNF4a, AFP, and CYP3A4 was in the range of one log scale, which could not be explained by the higher abundance of CD26-positive hepatic cells.
In the center of the organoids are still cells, which are negative for hepatic and cholangiocytic markers. Moreover, in SOs, no relevant desmin expression could be detected by immunohistochemical staining (Fig. 3D). Furthermore, we analyzed the SOs for pluripotency-associated markers (OCT4, NANOG, and SOX2), but were unable to find cells positive for these markers (data not shown). However, we could detect distinct areas, which were positive for the early endoderm-related markers SOX2 and FOXA2 (Supplementary Fig. S1D). We next analyzed the amount of KI-67-expressing cells 24 h, 48 h, and 1 week after inoculation in the 3D culture. The total amount of KI-67-positive cells was significantly lower after 24 h in SOs than in the LOs (7.86% ± 4.6% compared to 39.63% ± 15.91%; Supplementary Fig. S1C). Both, SOs and LOs, show a decline of KI-67-positive cells after 24 h, 48 h, and 1 week of 3D cultivation, but the KI-67 expression was always significantly higher in the LOs compared to the SOs over the observed time. We further investigated the albumin secretion as a marker for the maturity of hepatic cells. This parameter was significantly increased when the expression of LOs (8.23-fold higher) or SOs (11.44-fold higher) was compared to monolayer controls (Fig. 3F). This assay also revealed that the albumin expression was 1.4-fold higher in SOs compared Los, underlining that the size of the organoids has a direct impact on their hepatic characteristics.
Metabolic capabilities and sensitivity to toxicity assays
Because of the rapid decrease of nearly all hepatic features during in vitro cultivation of primary hepatocytes, one major challenge for the use of hepatic derivatives in drug screening assays is their loss of detoxification capacity during prolonged cultivation. For this purpose, we analyzed the basal metabolic activity and the metabolic activity after induction of the cytochrome P450 enzymes CYP3A4, CYP1A2, and CYP2C9 in metabolic assays, as well as the expression rate in upcyte hepatocytes, 2D hepatic cells, LOs, and SOs. For a better discrimination between SOs and Los, we included a size separation step 24 h after inoculation to achieve reproducible populations of SOs and Los, respectively (Fig. 4A). With these measures, no significant differences in size could be detected, neither within the SO group nor in the LO group. The metabolic capacity after induction of the respective cytochrome complex was always highest in the SOs. Moreover, the induction rate of the respective cytochrome complex was always highest in the SOs (Fig. 4B) compared to LOs, 2D hepatic cells, or upcyte hepatocytes. The only exception where the SOs did not show the highest activity was the basal metabolic capacity of CYP3A4, which was higher in the LOs (3.67%). Moreover, the 2D hepatic cells showed the lowest metabolic capacity, basal and induced, for all investigated cytochrome complexes. The 3D cultivation significantly increased the (induced) metabolic capacity for the most abundantly expressed CYP in adult liver CYP3A4 [36] in LOs (P < 0.0001) and SOs (P < 0.0001), compared to the 2D hepatic cells. Also, the induced metabolic capacity for CYP1A2, exclusively expressed in the liver [37], was significantly increased in the SOs (P < 0.0001), but not in the LOs (P > 0.05), in comparison to 2D hepatic cells.
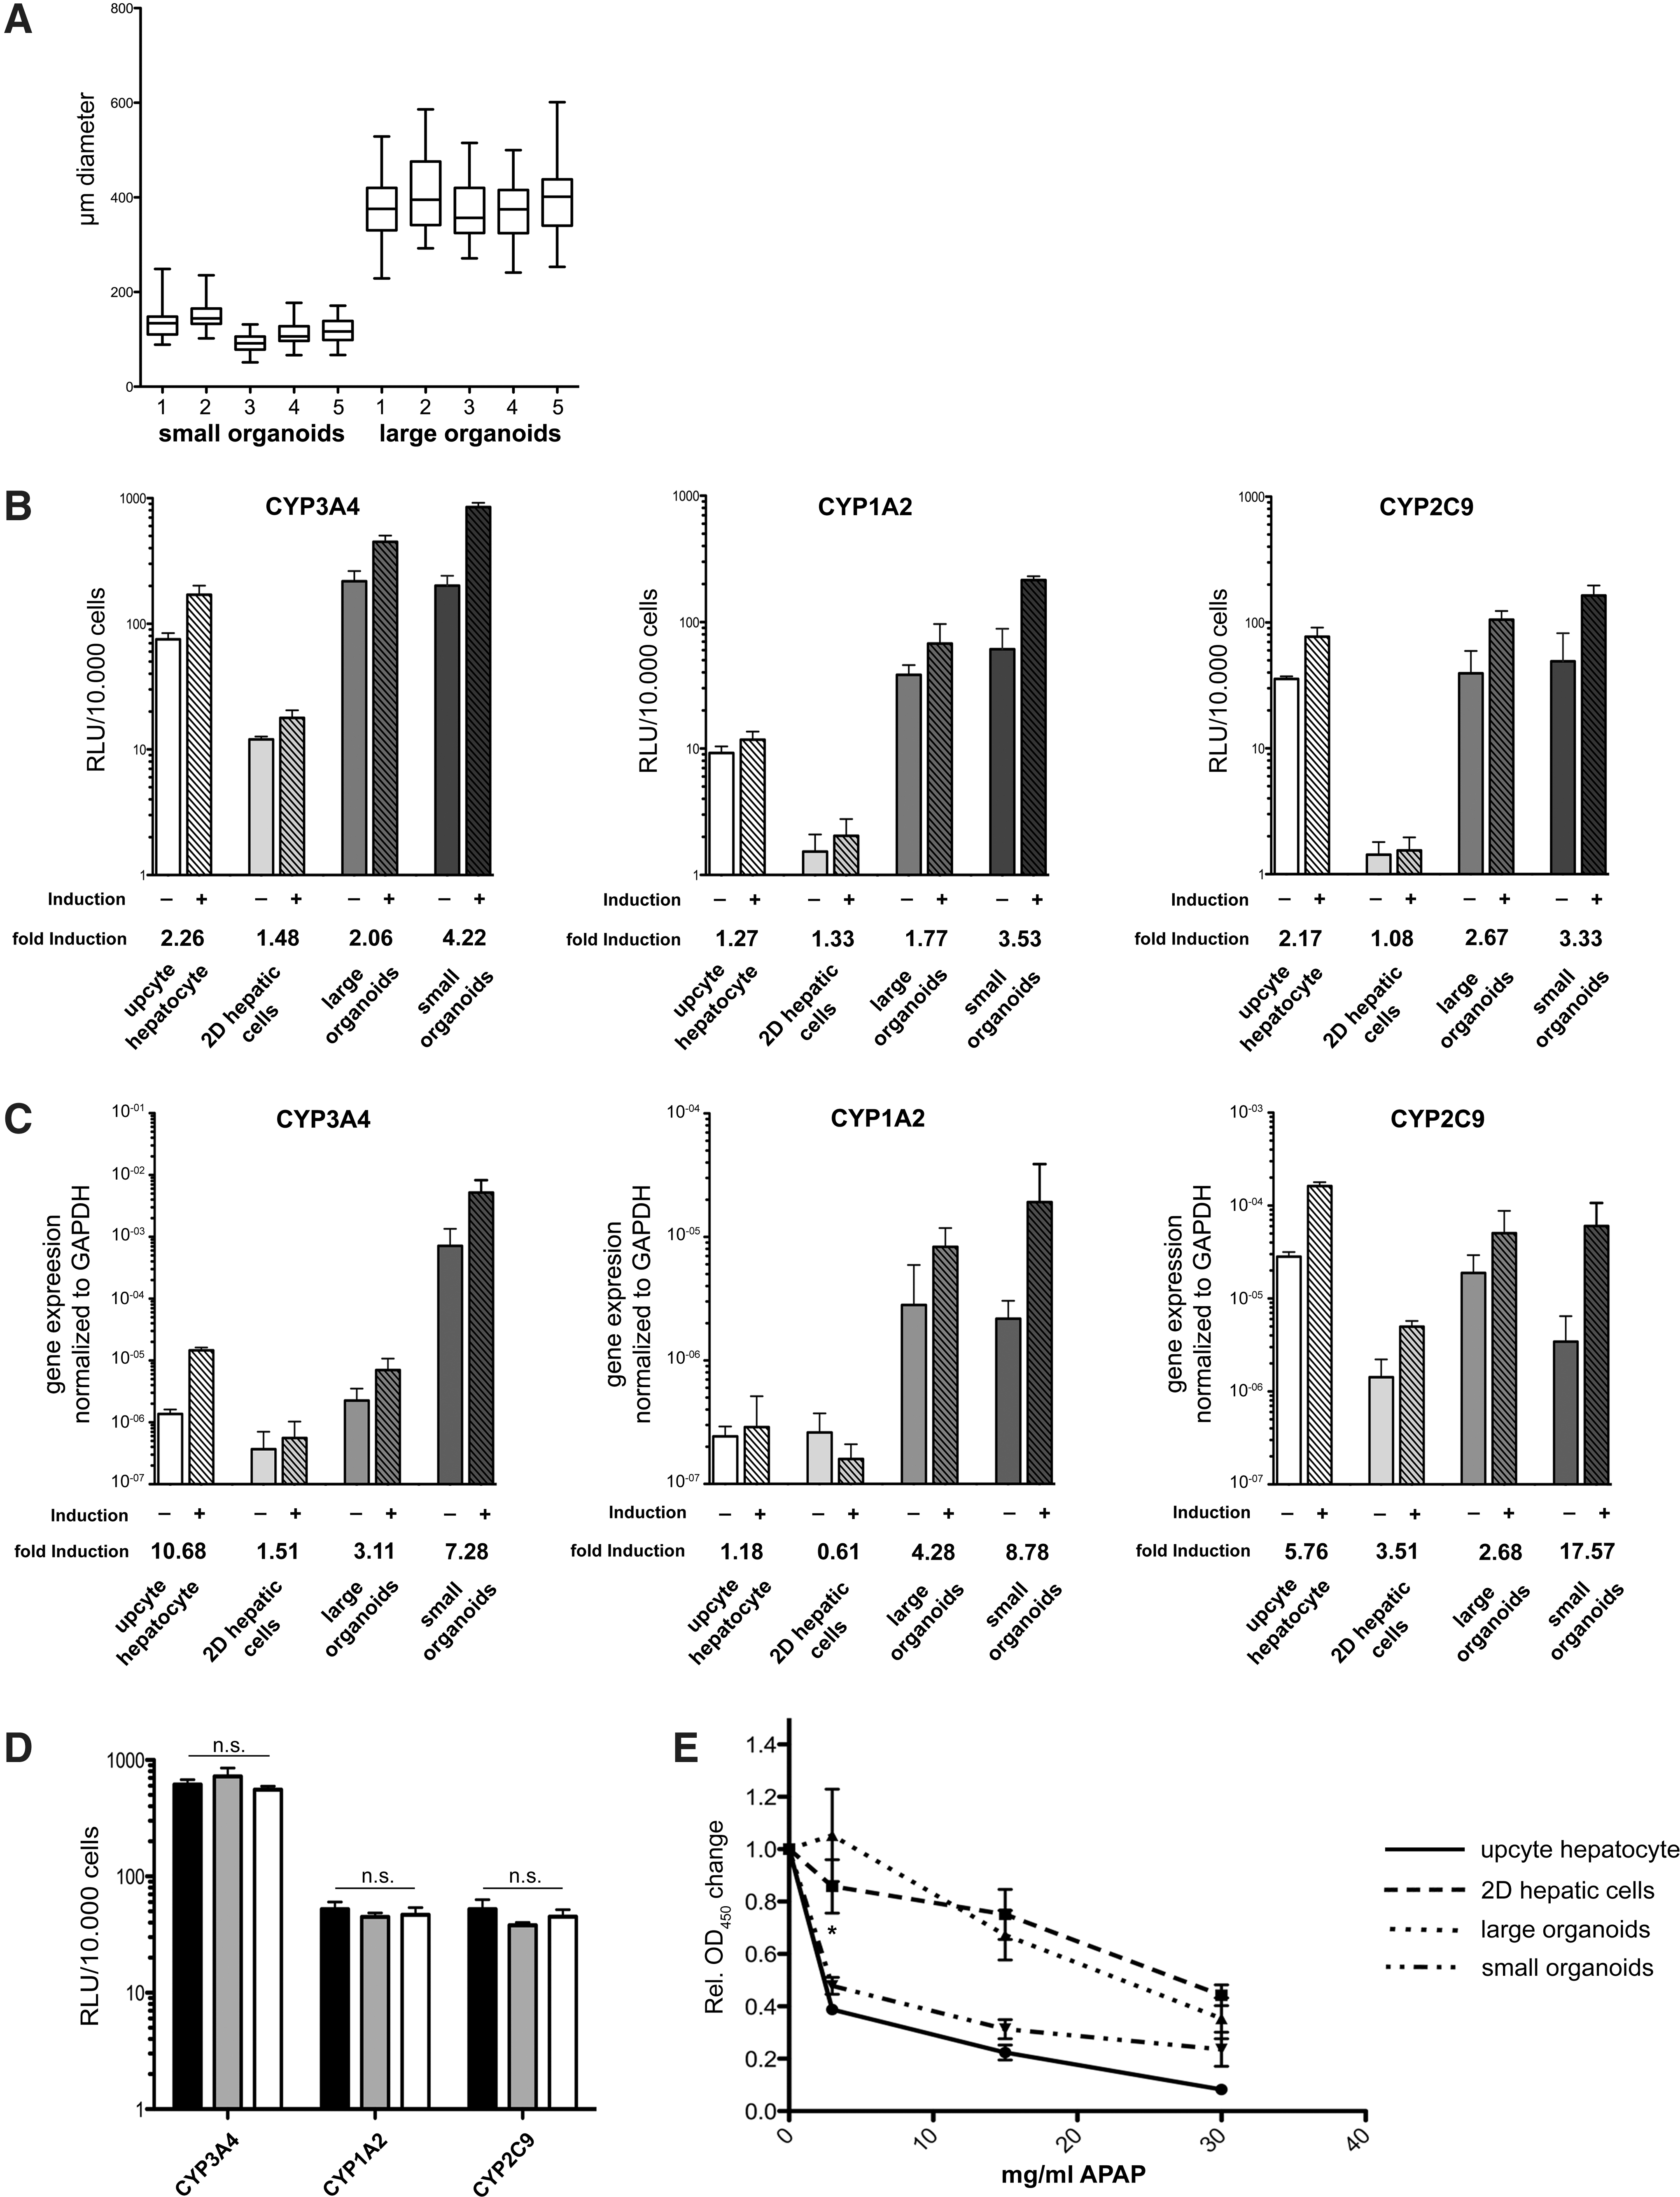
Size control of organoids and detoxification capacity of hepatic organoids.
One of the most important CYP for drug metabolism, CYP2C9 [38], was significantly increased in LOs (P < 0.01) and SOs (P < 0.0001), compared to the 2D hepatic cells. Similar results were obtained by qRT-PCR-based gene expression analyses (Fig. 4C). However, for CYP3A4, the upcyte hepatocytes show the highest induction rate, but the SOs show significantly higher induced expression (P < 0.0001) of CYP3A4 compared to the induced 2D hepatic cells. The LOs show a higher basal expression of CYP1A2 and CYP2C9, but a lower induced expression and lower induction rate than the SOs. However, the 2D hepatic cells show lowest basal and induced expression for all investigated CYPs compared to LOs and SOs. Importantly, the induced metabolic activity of all three analyzed cytochrome P450 complex enzymes were consistently maintained in SOs over the analyzed time period of 3 weeks (Fig. 4D). Thus, organoids were applied in a proof-of-concept experiment monitoring metabolization of acetaminophen into the well-characterized, hepatotoxic metabolite N-Acetyl-p-benzochinonimin. This transformation requires quite advanced hepatic metabolic capabilities, not present in conventional hepatoma cell lines such as HepG2. In our assays, we applied a different concentration of acetaminophen and assessed cell viability after 4 h, which is expected to decrease when the cells exhibited an advanced metabolic profile. Notably, SOs were significantly more sensitive to acetaminophen at low concentration (Fig. 4E) compared to LOs or the 2D hepatic cells. When applying a high concentration of acetaminophen, LOs showed equivalent sensitivity to acetaminophen comparable to SOs or upcyte hepatocytes, which served as positive control. In contrast, 2D hepatic cells exhibited minimal effects on the acetaminophen treatment, if any, even at higher concentrations (Fig. 4E). These findings indicate that the improved culture conditions developed in this study led to a cell population that reflects a more sensitive hepatic response to a relevant toxic challenge.
Discussion
The shortage of primary human hepatocytes and the unsatisfactory phenotypic characteristics of hepatoma cell lines illustrate the urgent need of cells displaying a preferably hepatic phenotype for in vitro models and for drug screening. The use of hepatic derivatives from PSCs gains center stage, but the conventional 2D cell culture fails to match the complex metabolic characteristics of mature primary hepatocytes. Because apical–basolateral polarity is a hallmark of hepatocyte biology and a prerequisite for physiological liver function [39], 3D culture systems are supposed to provide preferential cultivation conditions for PSC-derived hepatocyte-like cells. The generation of in vitro aggregates from isolated chicken hepatocytes by self-organization, exhibiting hepatic tissue architecture, was first demonstrated in 1960 [40]. This self-organization process of cells was attributable to cell–cell adherent receptors [41] and led to a spontaneous aggregation of cells. This was recently adapted to generate organoid-like structures for a variety of assembled cell units or tissue types, either directly from undifferentiated PSCs [13] or from differentiated PSC derivatives in Ref. [15]. Providing an alternative to conventional 2D settings, several studies reported the use of aggregates for scalable expansion of hPSCs [42,43], lineage-specific differentiation [19,44,45], and enhanced maturation of pluripotent cells to their specific somatic lineage for regenerative medicine applications [46,47] and drug screening [48]. Different methods to form organoids from different starting populations are published, exploiting either the use of primary cells/biopsies [49] or the mixture of different adult cell types [22] with PSCs [19] and/or differentiated PSCs [50]. Depending on their origin, the resulting organoids differ in their homogeneity with variant proliferation or maturation characteristics. In our study, we sectioned a monolayer of hepatocyte-like cells differentiated from hESCs for subsequent self-assembly into hepatic organoids. Using this approach, organoid-like structures were formed spontaneously within 12 h in suspension culture. During the subsequent 3 days of culture, cystic structures became apparent; besides these morphological changes, organoids remained unchanged throughout the investigated culture period of up to 3 weeks. From this observation, we hypothesized that substantial cell proliferation occurred rather at the beginning of organoid formation followed by a steady state, and we were able to confirm this interpretation by KI-67 staining in a time-course experiment of LOs and SOs (Supplementary Fig. S1C).
In contrast to organoids developed in our study, hepatic organoids generated from primary tissue-resident progenitor cells could be long-term passaged and maintained over months shown in other reports [12,49]. Our starting population may consist of predominantly more differentiated hepatocyte-like cells that are more reluctant to proliferation cues over a longer time period. In particular, we could show a proliferation in LOs within the first 48 h of cultivation, which afterward declined. Moreover, proliferation in SOs was rather low during all investigated time points as discussed in the recent literature [14,15,51]. The increased levels of hepatic gene expression, cytochrome activity, and albumin secretion in our organoid cultures indicate that the 2D hepatic cells matured after aggregation in suspension, which is in line with previous reports [14,16]. Accordingly, expression of fetal markers such as CK19 and CYP1A1 decreased during the maturation process.
However, the organoids' cells still display a mixture of fetal hepatoblast-like and more mature hepatocyte-like cell phenotype. The observed cystic structures arising during the first days of LO culture were predominantly formed by nonhepatic cells (Fig. 2). These structures were partly positive for desmin, indicating a stromal cell phenotype. We hypothesized that a mesendodermal stromal progenitor subpopulation originating from the monolayer cultivation was supported at 3D culture condition. We suggest that the expression of the early endoderm-associated markers SOX17 and FOXA2, together with the high amount of KI-67-positive cells (Supplementary Fig. S1C, D), rather demonstrates that endodermal progenitor cells receive selective advantage during the proliferation of such progenitors. It remains unclear, at present, why the 3D conditions were more permissive for the stromal cells to expand, but one could speculate that either pronounced physiological (eg, hypoxic) or morphomechanical (ie, cell–cell contacts in 3D) conditions in the center of the organoids were potential factors. Recent studies suggest that paracrine signals are responsible for the maturation of 3D cell aggregates [52]. Moreover, the formation of 3D structures depends on several factors of the cell itself like the stiffness and adhesion and cohesion molecules. In the end, those factors may decide about the final size and structure of the aggregate, which in turn is responsible for the oxygen consumption and therefore the proper development of the cells within the structure [53]. Interestingly, in Takebe's studies, the presence of nonhepatic cells, predominantly mesenchymal and endothelial cells, was reported to be rather supportive for hepatic organoid formation and function [14,51]. However, in the more heterogeneous larger organoids in our study, hepatic cells were detectable in the periphery of aggregates, only. Aiming for more homogenous organoids, we reduced the overall size of the initiating monolayer fragments. The resulting SOs exhibited an enhanced hepatic phenotype, which could be confirmed by gene expression, cytochrome activity, and flow cytometric analyses of mature hepatic and more fetal hepatoblast-related markers, as well as by albumin secretion. In brief, we could show a significant increase of several mature hepatic markers, such as ALB, TTR and HNF4a, by qRT-PCR (Fig. 3B). However, immunohistochemical analyses again exhibited the localization of hepatic cells predominantly at the exterior of the organoids, even if more cell layers stained positive for hepatic markers. Thus, we aimed to delineate if the enhanced hepatic maturation status of the organoids' cells is either attributable to improved hepatic differentiation or/and to a more preferential hepatic to nonhepatic cell ratio within the SOs. Our FACS data demonstrated that the percentage of hepatic cells, based on their CD26 expression, is twofold higher in the SOs than in the LOs, which indicates an enhanced hepatic to nonhepatic ratio in the organoids. On the other hand, gene expression analyses of the CD26+ cell fractions show a 10-fold higher expression of the hepatic markers ALB and AFP, which argues in favor of an additionally enhanced expression of hepatic gene expression profile in these cells. Furthermore, our data suggest that the proliferation of stromal-like cells was limited in SOs, which has likely supported formation of more mature hepatic cells. The latter finding might be explained by paracrine maturation factors, which reached higher concentration levels because of the improved ratio of hepatic to nonhepatic cells in the SOs compared to the LOs.
We also applied a more sensitive, N-acetyl-p-benzoquinoneimine (NAPQI)/acetaminophen (APAP)-based test for the metabolic capabilities of hepatocyte-like cells. If the cells within the SOs exhibited a more mature hepatic phenotype, they should show a higher sensitivity to the hepatotoxic metabolite NAPQI [54,55]. The hepatotoxic effect of APAP is caused by metabolization of NAPQI by CYP450 enzymes. There is still some controversy on the metabolic roles of CYP1A2 and CYP3A4 for NAPQI synthesis [56] in the recent literature, but it seems that CYP3A4 has the highest impact on the NAPQI formation at both the therapeutic concentration (50 μm) and the toxic concentration (1 mM) [57]. Other studies suggested that CYP1A2 does not increase the production of NAPQI in therapeutic doses of APAP [58], but CYP1A2 has a high impact on the bioactivation at high doses of APAP [59]. These observations reflect the complexity of APAP metabolism and clearly indicate the need of an appropriate hepatic phenotype of cells, which may catalyze APAP to the hepatotoxic metabolite NAPQI. Currently, it is very difficult to achieve such a metabolic phenotype in hepatic stem cell derivatives or in cultured hepatic/hepatoma cell lines. Only few reports used APAP to test stem cell-derived hepatic cells for proper metabolism [60 –62] or DILI response [63], but none of them in a PSC-derived hepatic organoid context. So far, the best-characterized model for in vitro toxicity of APAP described the use PSC-derived hepatic cells, which were cultivated as a monolayer [62]. Lu et al. showed a dose-dependent toxic effect in the commercially available iCell Hepatocytes and compared these results to primary human hepatocytes. However, they treated the cells for 24 h in low (0.025 mM) and high doses (25 mM) of APAP. They could observe that the PSC-derived hepatic cells exhibit only at high concentrations (≥10 mM) a comparable sensitivity to APAP as primary hepatocytes. At a low dose of APAP (2–5 mM), the PSC-derived hepatic cells failed to reach the sensitivity to APAP compared to primary hepatocytes. This could be explained by an impaired bioactivation of APAP in low concentration caused by an insufficient cytochrome P450 complex activity. In our study, the different hepatic derivatives, 2D hepatic cells, LOs, and SOs, were treated with different concentrations of APAP to demonstrate the hepatic metabolism of our organoids in correspondence to their maturation state in a dose-dependent manner. We could detect the highest sensitivity to APAP even in low concentrations in the LOs. Consistent with these findings, the highest CYP3A4 and CYP1A2 metabolism could be detected in the SOs. Similar to Lu et al., we could observe a gap in the sensitivity to APAP of the 2D hepatic cells and the LOs compared to upcyte hepatocytes. In a low concentration of APAP, the 2D hepatic cells exhibited a higher sensitivity than the LOs. This could be caused by the nonhepatic cell population within the LOs, which was not sensitive to APAP. When the concentration of APAP was increased, this difference vanished and we therefore assume that only at high APAP doses, significant levels of toxic metabolites were formed by the cytochrome P450 enzymes CYP3A4 and CYP1A2, which were much more active (Fig. 4). However, only the SOs were able to reflect the APAP sensitivity in low and high concentrations comparable to the upcyte hepatocytes, underlining the high maturity of the cells in terms of detoxification capacity. Keeping in mind that there are still nonhepatic cells within the SOs, the function of these hepatic cells might be already quite close to primary hepatocytes. Finally, the amount of cells that can be generated under these culture conditions could be markedly increased. We were able to increase the volume from 1.5 to 15 mL and the number of formed aggregates from six up to 200 organoids as a first step for upscaling these organoids for high-throughput drug screening. Following recent examples for upscaling directed hPSC differentiation into other mesendodermal lineages such as cardiomyocytes in >100 mL suspension culture scale in controlled bioreactors [19,45], a further scale-up to even higher culture volumes clearly seems feasible.
In conclusion, we demonstrated the generation and 3D cultivation of hepatic organoids derived from PSCs. By generating organoids with various sizes, different subtypes of organoids could be generated, which differ in their cellular composition and their metabolic function. Applying an in vitro drug treatment with acetaminophen, we could show a dose-dependent response of the organoids similar to primary hepatocytes, which argues for reflecting a highly mature hepatic phenotype, particularly in the SOs.
Footnotes
Acknowledgments
The authors are grateful to Susanne Alfken for supporting the hPSC cultivation and differentiation and to Andreas Kirschning and Ursula Rinas (Leibniz University Hannover) for providing cytokines. This work was funded by grants to Tobias Cantz through the German Research Foundation (DFG; Cluster of Excellence REBIRTH DFG EXC62/3 and Collaborative Research Center SFB738) and the state of Lower Saxony (R2N consortium). Robert Zweigerdt received funding through the German Research Foundation (DFG; Cluster of Excellence REBIRTH DFG EXC62/3 and ZW64/4-1), the German Ministry for Education and Science (BMBF; 13 N12606, and 13 N14086), StemBANCC (support from the Innovative Medicines Initiative joint undertaking under grant 115439-2, whose resources are composed of financial contribution from the European Union [FP7/2007-2013] and EFPIA companies' in-kind contributions), and TECHNOBEAT (European Union H2020 grant 668724).
Author Disclosure Statement
No competing financial interests exist.
References
Supplementary Material
Please find the following supplemental material available below.
For Open Access articles published under a Creative Commons License, all supplemental material carries the same license as the article it is associated with.
For non-Open Access articles published, all supplemental material carries a non-exclusive license, and permission requests for re-use of supplemental material or any part of supplemental material shall be sent directly to the copyright owner as specified in the copyright notice associated with the article.