
Abstract
Mitochondrial deoxyribonucleic acid (mtDNA) copy number is tightly regulated during pluripotency and differentiation. There is increased demand of cellular adenosine triphosphate (ATP) during differentiation for energy-intensive cell types such as hepatocytes and neurons to meet the cell's functional requirements. During hepatocyte differentiation, mtDNA copy number should be synchronously increased to generate sufficient ATP through oxidative phosphorylation. Unlike bone marrow mesenchymal cells, mtDNA copy number failed to increase by 28 days of differentiation of human amniotic epithelial cells (hAEC) into hepatocyte-like cells (HLC) despite their expression of some end-stage hepatic markers. This was due to higher levels of DNA methylation at exon 2 of POLGA, the mtDNA-specific replication factor. Treatment with a DNA demethylation agent, 5-azacytidine, resulted in increased mtDNA copy number, reduced DNA methylation at exon 2 of POLGA, and reduced hepatic gene expression. Depletion of mtDNA followed by subsequent differentiation did not increase mtDNA copy number, but reduced DNA methylation at exon 2 of POLGA and increased expression of hepatic and pluripotency genes. We encapsulated hAEC in barium alginate microcapsules and subsequently differentiated them into HLC. Encapsulation resulted in no net increase of mtDNA copy number but a significant reduction in DNA methylation of POLGA. RNAseq analysis showed that differentiated HLC express hepatocyte-specific genes but also increased expression of inflammatory interferon genes. Differentiation in encapsulated cells showed suppression of inflammatory genes as well as increased expression of genes associated with hepatocyte function pathways and networks. This study demonstrates that an increase in classical hepatic gene expression can be achieved in HLC through encapsulation, although they fail to effectively regulate mtDNA copy number.
Introduction
C
The functional capacity of HLC will be dictated by their ability to generate sufficient adenosine triphosphate (ATP) to meet the metabolic needs to undertake their specialized functions. Cellular ATP can be generated in the cytoplasm through glycolysis or in the mitochondria via oxidative phosphorylation (OXPHOS) [10]. Glycolysis produces two molecules of ATP from each molecule of glucose, whereas the by-products of glycolysis can be further β-oxidized and passed into the citric acid cycle and the electron transport chain (ETC) in the mitochondria to generate between 32 and 36 moles of ATP through OXPHOS [11]. The ETC consists of five complexes, each of which is encoded by both the mitochondrial deoxyribonucleic acid (mtDNA) and nuclear genomes except for complex II, which is only encoded by nuclear genes [12 –14].
The mitochondrial genome is located in the mitochondria. It is a circular double-stranded genome that is 16,569 bp in size [14]. MtDNA encodes 13 polypeptides of the ETC, 22 transfer RNAs, and 2 ribosomal RNAs. It also contains the D-loop, which is the site of interaction for the nuclear-encoded transcription and replication factors that initiate transcription and then replication of the mitochondrial genome [15].
Undifferentiated stem cells typically have low mtDNA copy number and generate ATP primarily through glycolysis [16]. As cells differentiate, they increase their mtDNA copy number and can transition from glycolysis to OXPHOS dependent on their functional requirements for ATP [17]. Indeed, the number of mtDNA copies per cell is dependent on cell type and the energy needs of the cell [12,17]. As mtDNA copy number is increased synchronously during differentiation, there is increased expression of lineage-specific genes and reduced gene expression of markers of pluripotency [18]. Synchronous increases in mtDNA copy number have previously been demonstrated in embryonic and neural stem cells when differentiated into mature neurons [16,19], however, it is not clear whether HLC follow a similar path. There is increasing evidence showing that changes in mitochondrial copy number provide the basis of cellular differentiation into various lineages [17,20].
Replication of mtDNA is dependent on nuclear-encoded replication factors that translocate to the mitochondria [15]. MtDNA replication is initiated by mitochondrial transcription factor A, while the mtDNA-specific DNA polymerase gamma (POLGA) recognizes the primer that drives mtDNA replication [15,21]. Transcription of POLGA is regulated by DNA methylation at exon 2 of POLGA [16]. In humans, increased levels of 5-methylcytosine (5mC) at exon 2 of POLGA suppress its transcription thus leading to decreased levels of mtDNA replication, as is the case for undifferentiated stem cells [19]. MtDNA copy number is regulated in a tissue-specific manner through which cells with high mtDNA copy number have low levels of DNA methylation at exon 2 of POLGA and high levels of expression of POLGA [16]. However, hypermethylation at exon 2 of POLGA results in low mtDNA copy number and low levels of expression of POLGA [19]. Thus, there is a positive inverse correlation of DNA methylation at exon 2 of POLGA and mtDNA copy number in stem cells and differentiated cells [19].
The ability to modulate mtDNA copy number during differentiation would provide better differentiation potential. DNA methylation is one way in which a cell regulates the interchange between its pluripotent and differentiated states [22]. During hepatic differentiation, pluripotent genes would be silenced by DNA methylation; whereas hepatocyte-specific genes are demethylated and become transcriptionally active [23,24]. Global DNA demethylation can be achieved by treatment with 5-azacytidine, which acts via DNMT1 to activate gene expression [25]. Alternatively, depleting a cell of its mtDNA, using agents such as dideoxycytidine (ddC) [26], can reset the cell to a quasipluripotent state [18], which would allow cells to fully differentiate toward HLC. Indeed, depleting mtDNA mimics levels observed in embryonic stem cells [19], which have low mtDNA copy number and are highly proliferative. This re-establishes the mtDNA set point, which enables cells to then increase their mtDNA copy number depending on their functional requirements as they undergo differentiation [17].
Encapsulation of HLC presents a novel way of cell delivery and also enhances the hepatic function of the differentiated HLC [6]. Encapsulation and subsequent differentiation of HLC create a 3D environment that enhances cell-to-cell interactions and increased extracellular matrix deposition, increased collagen deposition, enhanced integrin signaling, and increased metabolic functions such as lipid and drug metabolism [27]. Increased functional output requires increased ATP production and increased mtDNA copy number. However, this has not been evaluated in encapsulated HLC.
Since HLC have a high requirement for ATP to function optimally, they must attain sufficient mtDNA copy number [28]. hAEC are ideal candidates for HLC differentiation as they express the early progenitor markers A1AT, GATA4, and FOXA2 [5,6]. Previous studies have shown extensive protein expression of alpha fetoprotein, ornithine transcarbamylase, tryptophan 2,3- dioxygenase, and increased glycogen storage [5]. Furthermore, HLC have the capacity to uptake and metabolize cholesterol, uptake the hepatocyte-specific dye indocyanine green, and expressed increased free radical scavenging glutathione and oxidized glutathione, all key functional characteristics of hepatocytes [6]. Here we used HLC differentiation as a model to study regulation of mtDNA copy number and DNA methylation in differentiating hAECs. We have previously shown that HLC generated from hAEC are functional and can be encapsulated without loss of viability and function [6]. However, the state of mtDNA copy number and gene expression patterns in either primary hAEC or differentiated HLC is not known. We also investigated the effects of encapsulation on mtDNA copy number, DNA methylation at exon 2 of POLGA, and whole transcriptome expression during HLC differentiation.
Materials and Methods
Ethics
This study was approved by the Human Research Ethics Committees of Monash Medical Centre and Royal Women's Hospital in accordance with the amended Declaration of Helsinki (MH-HREC 2007). All donors provided written informed consent. Amniotic membranes were collected from healthy women with a normal singleton pregnancy delivered by cesarean section at term (n = 20).
Isolation of hAEC
hAEC were isolated, as previously described with minor modifications [29]. Under sterile conditions, amnion membranes were washed in DMEM/F12 medium twice followed by two washes in Dulbecco's phosphate-buffered saline (DPBS). The amniotic membranes were further washed three times in Hank's balanced salt solution (HBSS; Sigma Aldrich) and finally rinsed with 0.05% trypsin containing 0.05 mM EDTA (Gibco). Small pieces of amniotic membranes were distributed equally between two 50-mL Falcon tubes each containing 15 mL of 0.05% trypsin with a final volume being no more than 45 mL. The amniotic membranes were digested for 10 min at 37°C with occasional shaking. Initial digest of cells containing trypsin was discarded, which contained dead cells and debris. Amniotic membranes were transferred into two 50-mL Falcon tubes containing 25 mL of 0.05% trypsin and digested for 40 min at 37°C with occasional shaking. Amniotic membranes were transferred into a second set of 50-mL Falcon tubes containing 25 mL of 0.05% trypsin for a further 40 min at 37°C. Trypsin was neutralized with two volumes of 10% newborn calf serum (NCS) in DMEM/F12 (Gibco). Dissociated cells were centrifuged at 200 g for 10 min, resuspended in DMEM/F12, strained through a 100-μm filter, and washed several times. Red blood cells were lysed with hypotonic solution for 7–8 min at 37°C. The cells were washed several times in DMEM/F12. To enrich for stage-specific embryonic antigen, SSEA4, isolated cells were resuspended in HBSS at a concentration of 5 million/mL, gently cushioned onto 24 mL of 24% Percoll (Sigma Aldrich), and centrifuged for 8 min at 150 g at room temperature without braking. The cell pellet was collected and washed several times in DMEM/F12. Cell viability was assessed by trypan blue exclusion. Only primary hAEC were used in subsequent experiments in this study.
Differentiation of HLC
Cryopreserved hAEC were thawed and plated on rat tail type I collagen (Roche, Mannheim, Germany)-coated dishes in DMEM/F12 with 20% fetal bovine serum (FBS) and 10 ng/mL epidermal growth factor (EGF) for 3–5 days. To induce differentiation, hAEC were cultured in DMEM/F12 supplemented with 10% FBS, 10% HepG2 cell-conditioned medium, 10 ng/mL EGF, fibroblast growth factor-4 (Invitrogen, Camarillo, CA), hepatocyte growth factor (HGF; Invitrogen), and 0.1 μM insulin and dexamethasone (Sigma-Aldrich). Use of 10% FBS is required for culture and differentiation of primary hAEC, as shown in previous studies [4 –6,8,9]. After 2 weeks, cells were switched to DMEM/F12 supplemented with 10% FBS, 10% HepG2 cell-conditioned medium, 10 ng/mL HGF, and 0.1 μM dexamethasone. Medium was replenished on alternate days. Cultures were maintained for a further 2 weeks. For comparison, bone marrow mesenchymal stem cells (BM-MSC) were differentiated into HLC using the same protocol. HepG2 cells at passage 22 were grown in large flasks until 70% confluent. Fresh media were added and collected after 48 h. A large batch of conditioned media was collected, filtered, and frozen for further experiments to avoid batch variation for HepG2 conditioned media.
CYP3A4 activity
Differentiated HLC, encapsulated HLC, and HepG2 cells were treated with 20 μM rifampicin for 48 h to induce CYP3A4 activity. The enzymatic activity was measured using the P450-Glo assay (Promega, Madison, WI) with 3 μM luciferin-IPA as the substrate (CYP3A4 specific). An equal volume of detection reagent was added from the kit and readings were taken on a luminometer (BMG Labtech, Offenburg, Germany), as per the manufacturer's instructions.
Urea assay
Differentiated HLC, encapsulated HLC, and HepG2 cells were treated with 10 mM ammonium chloride for 18 h in serum-free DMEM/F12 media. Media were collected and urea measured using the QuantiChrom Urea Assay Kit (Bioassay Systems, Hayward, CA). Optical density readings were taken at 420 nm using a plate reader (BMG Labtech).
Immunocytochemistry
Differentiated HLC and decapsulated HLC were fixed in 100% methanol for 8 min. Nonspecific binding was blocked by CAS block (Invitrogen), and cells were incubated with rabbit anti-human albumin (1:500; Abcam, Cambridge, UK) at 4°C overnight. Cells were washed several times with phosphate-buffered saline (PBS) and incubated with the goat anti-rabbit Alexa Fluor-488 secondary antibody (1:1,000; Invitrogen) for 30 min at room temperature. Cells were washed and mounted in VECTASHIELD with DAPI (Vector Laboratories, Burlingame, CA).
MtDNA depletion
hAEC were cultured for 3–5 days until they achieved epithelial morphology. To deplete mtDNA, cells were then treated with 10 μM ddC supplemented with 50 μg/mL Uridine (Sigma-Aldrich) in DMEM/F12 with 10% FBS. The media were changed every 24 h for 3 and 7 days. On mtDNA depletion, cells were allowed to recover in HLC differentiation media for 7 and 14 days.
Encapsulation
Encapsulation of hAEC was performed on day 1 and 3 mtDNA-depleted hAEC. hAEC were encapsulated in barium alginate microcapsules, as described elsewhere [30]. Briefly, hAEC were trypsinized, washed three times in PBS, and mixed with 2.2% ultrapure alginate solution at a ratio of 1:6. The alginate solution was composed of 60:40 mixture of guluronic acid:mannuronic acid (UP MVG PRONOVA; FMC Biopolymer, Sandvika, Norway). Encapsulation was performed with an air-driven droplet generator (Steinau, Berlin, Germany) at a pressure of 80 kPa with an airflow rate of 6 L/min. The liquid microcapsules generated were solidified by incubation in a 20 mM barium chloride (BaCl2) precipitation bath for 2 min. The polycations contained in BaCl2 bind to alginate to form strong crosslinks with polycations producing rigid microcapsules. The microcapsules were washed three times in 0.9% saline to remove excess barium. The average diameter of the microcapsules was 600 μm with ∼1,000 hAEC in each capsule. Encapsulated cells were cultured in vitro for 14 and 28 days with media changed every alternate day. We evaluated their viability as described elsewhere [6].
Isolation of DNA
DNA was isolated using the Isolate II Genomic DNA Kit (Bioline), according to the manufacturer's instructions. DNA samples were treated with proteinase K solution (Bioline) at 65°C for 10 min and RNase solution (Qiagen) at room temperature for 10 min. DNA was eluted in elution buffer G in 100 μL volumes. The DNA concentration was determined using a NanoDrop 1000 spectrophotometer (Thermo Fisher).
Real-time PCR for mtDNA copy number
Real-time quantitative PCR was performed on a Rotor-Gene 3000 (Qiagen) for mtDNA and the nuclear-encoded β-globin gene. In a total volume of 20 μL, the reaction mixture consisted of 10 μL of 2× SensiMix SYBR® Hi-ROX (Bioline), 1 μL each of 5 μM forward and reverse primers (Supplementary Table S1; Supplementary Data are available online at
Immunoprecipitation of methylated/hydroxymethylated DNA
Immunoprecipitation of methylation/hydroxymethylation was performed as previously described [19,32]. A total of 5 μg genomic DNA was sonicated into fragments of 200 to 1,000 base pair using the Covaris Adaptive Focused Acoustics system. Sonicated DNA was divided into three tubes with 1.5 μg of DNA in a volume of 450 μL. DNA samples were denatured by incubating at 95°C for 10 min and immunoprecipitated with 1 μg of antibodies to 5mC and 5hmC (Active Motif, Carlsbad, CA) separately with 20 μL Protein G Dynabeads (Invitrogen) in 500 μL IP buffer (10 mM Na-Phosphate, pH 7.0, 140 mM NaCl and 0.05% Triton X-100) at 4°C for 16 h. Samples were washed three times with 1 mL cold IP buffer. DNA was eluted in 250 μ of Proteinase K solution (5 mM Tris, 1 mM EDTA, pH 8.0, 0.05% sodium dodecyl sulphate [SDS]) with 5 μL of Proteinase K (stock 20 μg/mL; Qiagen) by incubating at 50°C for 3 h on a 1,400 rpm shaker. The immunoprecipitated DNA was purified using PCR purification columns (Qiagen) and final DNA eluted in 50 μL of buffer EB. 5mC and 5hmC were compared to equal amounts of input DNA without the antibodies to 5mC and 5hmC.
Real-time PCR for MeDIP
Real-time PCR was performed on purified methylated DNA precipitation (MeDIP) samples using the Rotor-Gene 3000 across exon 2 of POLGA using primers and conditions listed in Supplementary Table S1 and as previously described [19,32]. Real-time PCR was performed in a total volume of 20 μL consisting of 2× SensiMix SYBR® Hi-ROX, 1 μL of 5 μM forward and reverse primers, 6 μL of H2O, and 2 μL of MeDIP product. 5mC and 5hmC samples were run along the input DNA samples in triplicate. Data were first normalized to input samples and enrichment levels were determined for 5mC and 5hmC, as described previously [19,32]. Data were expressed as fold change of 5mC relative to 5hmC.
Isolation of RNA
Total RNA was isolated from 2 million cells using the RNeasy Mini Kit (Qiagen), according to the manufacturer's instructions. DNase I treatment was performed on the RNA columns to remove any contaminating DNA. Ten units of DNase I (Qiagen) were diluted with 70 μL of buffer RDD, loaded into the RNA columns, and incubated at room temperature for 15 min. RNA was eluted with 50 μL of H2O and the concentration determined using the NanoDrop 1000 spectrophotometer (Thermo Fisher).
cDNA synthesis
Total RNA (2 μg) was converted to cDNA using the Superscript III First-Strand cDNA Kit (Life Technologies), according to the manufacturer's instructions. One microliter of RNaseH was added to synthesized cDNA and incubated for 20 min at 37°C. cDNA was diluted 1:4 with H2O for further use in real-time PCR.
Gene expression
Gene expression was performed on the Rotor-Gene 3000 (Qiagen; Corbett Research, Cambridge, UK) using gene-specific primers listed in Supplementary Table S1. Each sample was analyzed in triplicate in final volumes of 20 μL. PCR consisted of 10 μL of 2× SensiMix SYBR® Hi-ROX, 1 μL each of 5 μM gene-specific forward and reverse primers, 6 μL of H2O, and 2 μL of cDNA using primer conditions listed in Supplementary Table S1. Ornithine decarboxylase antizyme 1 (OAZ1) was used to normalize gene expression levels and data were expressed as relative fold change calculated using the ΔΔCT method [33]. The reference gene OAZ1 is among the top genes used as reference genes and is stably expressed during differentiation [34].
RNA-seq
RNA was extracted using the RNA Mini Kit (Qiagen). On column, DNase I digestion was performed to eliminate contaminating DNA. Quality control was performed on all RNA samples using the Agilent Bioanalyzer Nanochip (Agilent Technologies). cDNA libraries were prepared using the Illumina TruSeq stranded mRNA Kit (Illumina), according to the manufacturer's instructions. RNA libraries were sequenced using Illumina HiSeq 2000 (Illumina) with 100 base pair single end reads with 20 million reads per sample. Data were generated with Illumina CASAVA pipeline version 1.8.2 (Illumina). Data analysis was performed using the “R” package. HLC were compared with hAEC, encapsulated HLC with hAEC, and encapsulated HLC with HLC. RNAseq data have been deposited at
Ingenuity pathway analysis
Normalized gene expression data generated from RNA-seq were uploaded into Ingenuity Pathway Analysis software (IPA; Qiagen). Pathway and network analyses were performed using IPA by applying a minimum of twofold change in gene expression, P value of <0.05, and false discovery rate of <0.05 (q value). The selected genes were mapped against the inbuilt Kyoto Encyclopedia of Genes and Genomes (KEGG) pathway for selection of the top five canonical pathways and top five networks, which showed differential gene expression.
hAEC xenograft model
Female athymic nude mice (Animal Resources Centre, Australia), 6–8 weeks of age, were injected subcutaneously with 2 × 10⁶ hAEC in the right flank in 100 μL of 1:1 mixed cell suspension and Matrigel. Mice were monitored daily for tumor formation and general wellness. Experiments were approved in advance by the Animal Ethics Committee at Monash University (MMCA 2013/05) and were carried out in accordance with “Australian Code of Practice for the Care and Use of Animals for Scientific Purposes.”
Statistical analysis
Data are shown as mean ± standard error of the mean derived from a minimum of n = 4–6 hAEC cultures. Comparisons were made using one-way ANOVA using GraphPad Prism V6.01 (GraphPad, San Diego, CA). Significance was accorded when P < 0.05; significance given as *P < 0.05, **P < 0.01, ***P < 0.001, and ****P < 0.0001.
Results
Regulation of mtDNA copy number during differentiation of HLC
We have previously shown that hAEC differentiated using the same protocol express markers for mature hepatocytes and exhibit markers associated with functional drug metabolism [5,6]. We show that both HLC and encapsulated HLC have the functional capacity for CYP3A4 drug metabolism (Supplementary Fig. S1A). In addition, HLC and encapsulated HLC are able to break down ammonium chloride to produce urea. The functional CYP3A4 capacity of HLC was at 50% of HepG2 cells and the functional capacity of encapsulated HLC was at 80% of encapsulated HepG2 cells. Urea synthesis in HLC was at 35% relative to HepG2 cells and encapsulated HLC urea synthesis was at 80% relative to encapsulated HepG2 cells (Supplementary Fig. S1B). Although we could not detect secreted albumin, differentiated HLC and encapsulated HLC exhibited positive staining for albumin (Supplementary Fig. S1C). There is also evidence of morphological change from epithelial hAEC to the more distinct hexagonal shape of HLC with differentiation (Supplementary Fig. S1D).
As cells differentiate into specific lineages, they increase their mtDNA copy number in accordance with their energy requirements as mature cell types [16,35]. We evaluated whether hAEC also exhibited this capacity as they differentiated into mature hepatocytes. Undifferentiated hAEC had low numbers of mtDNA copy per cell (Fig. 1A), which is consistent with pluripotent and multipotent stem cells [19]. However, mtDNA copy number was significantly downregulated at 14 and 28 days of differentiation (Fig. 1A). In contrast, BM-MSC possessed ∼1,000 copies of mtDNA and, as they underwent differentiation, there were significant increases in mtDNA copy number (Fig. 1A).
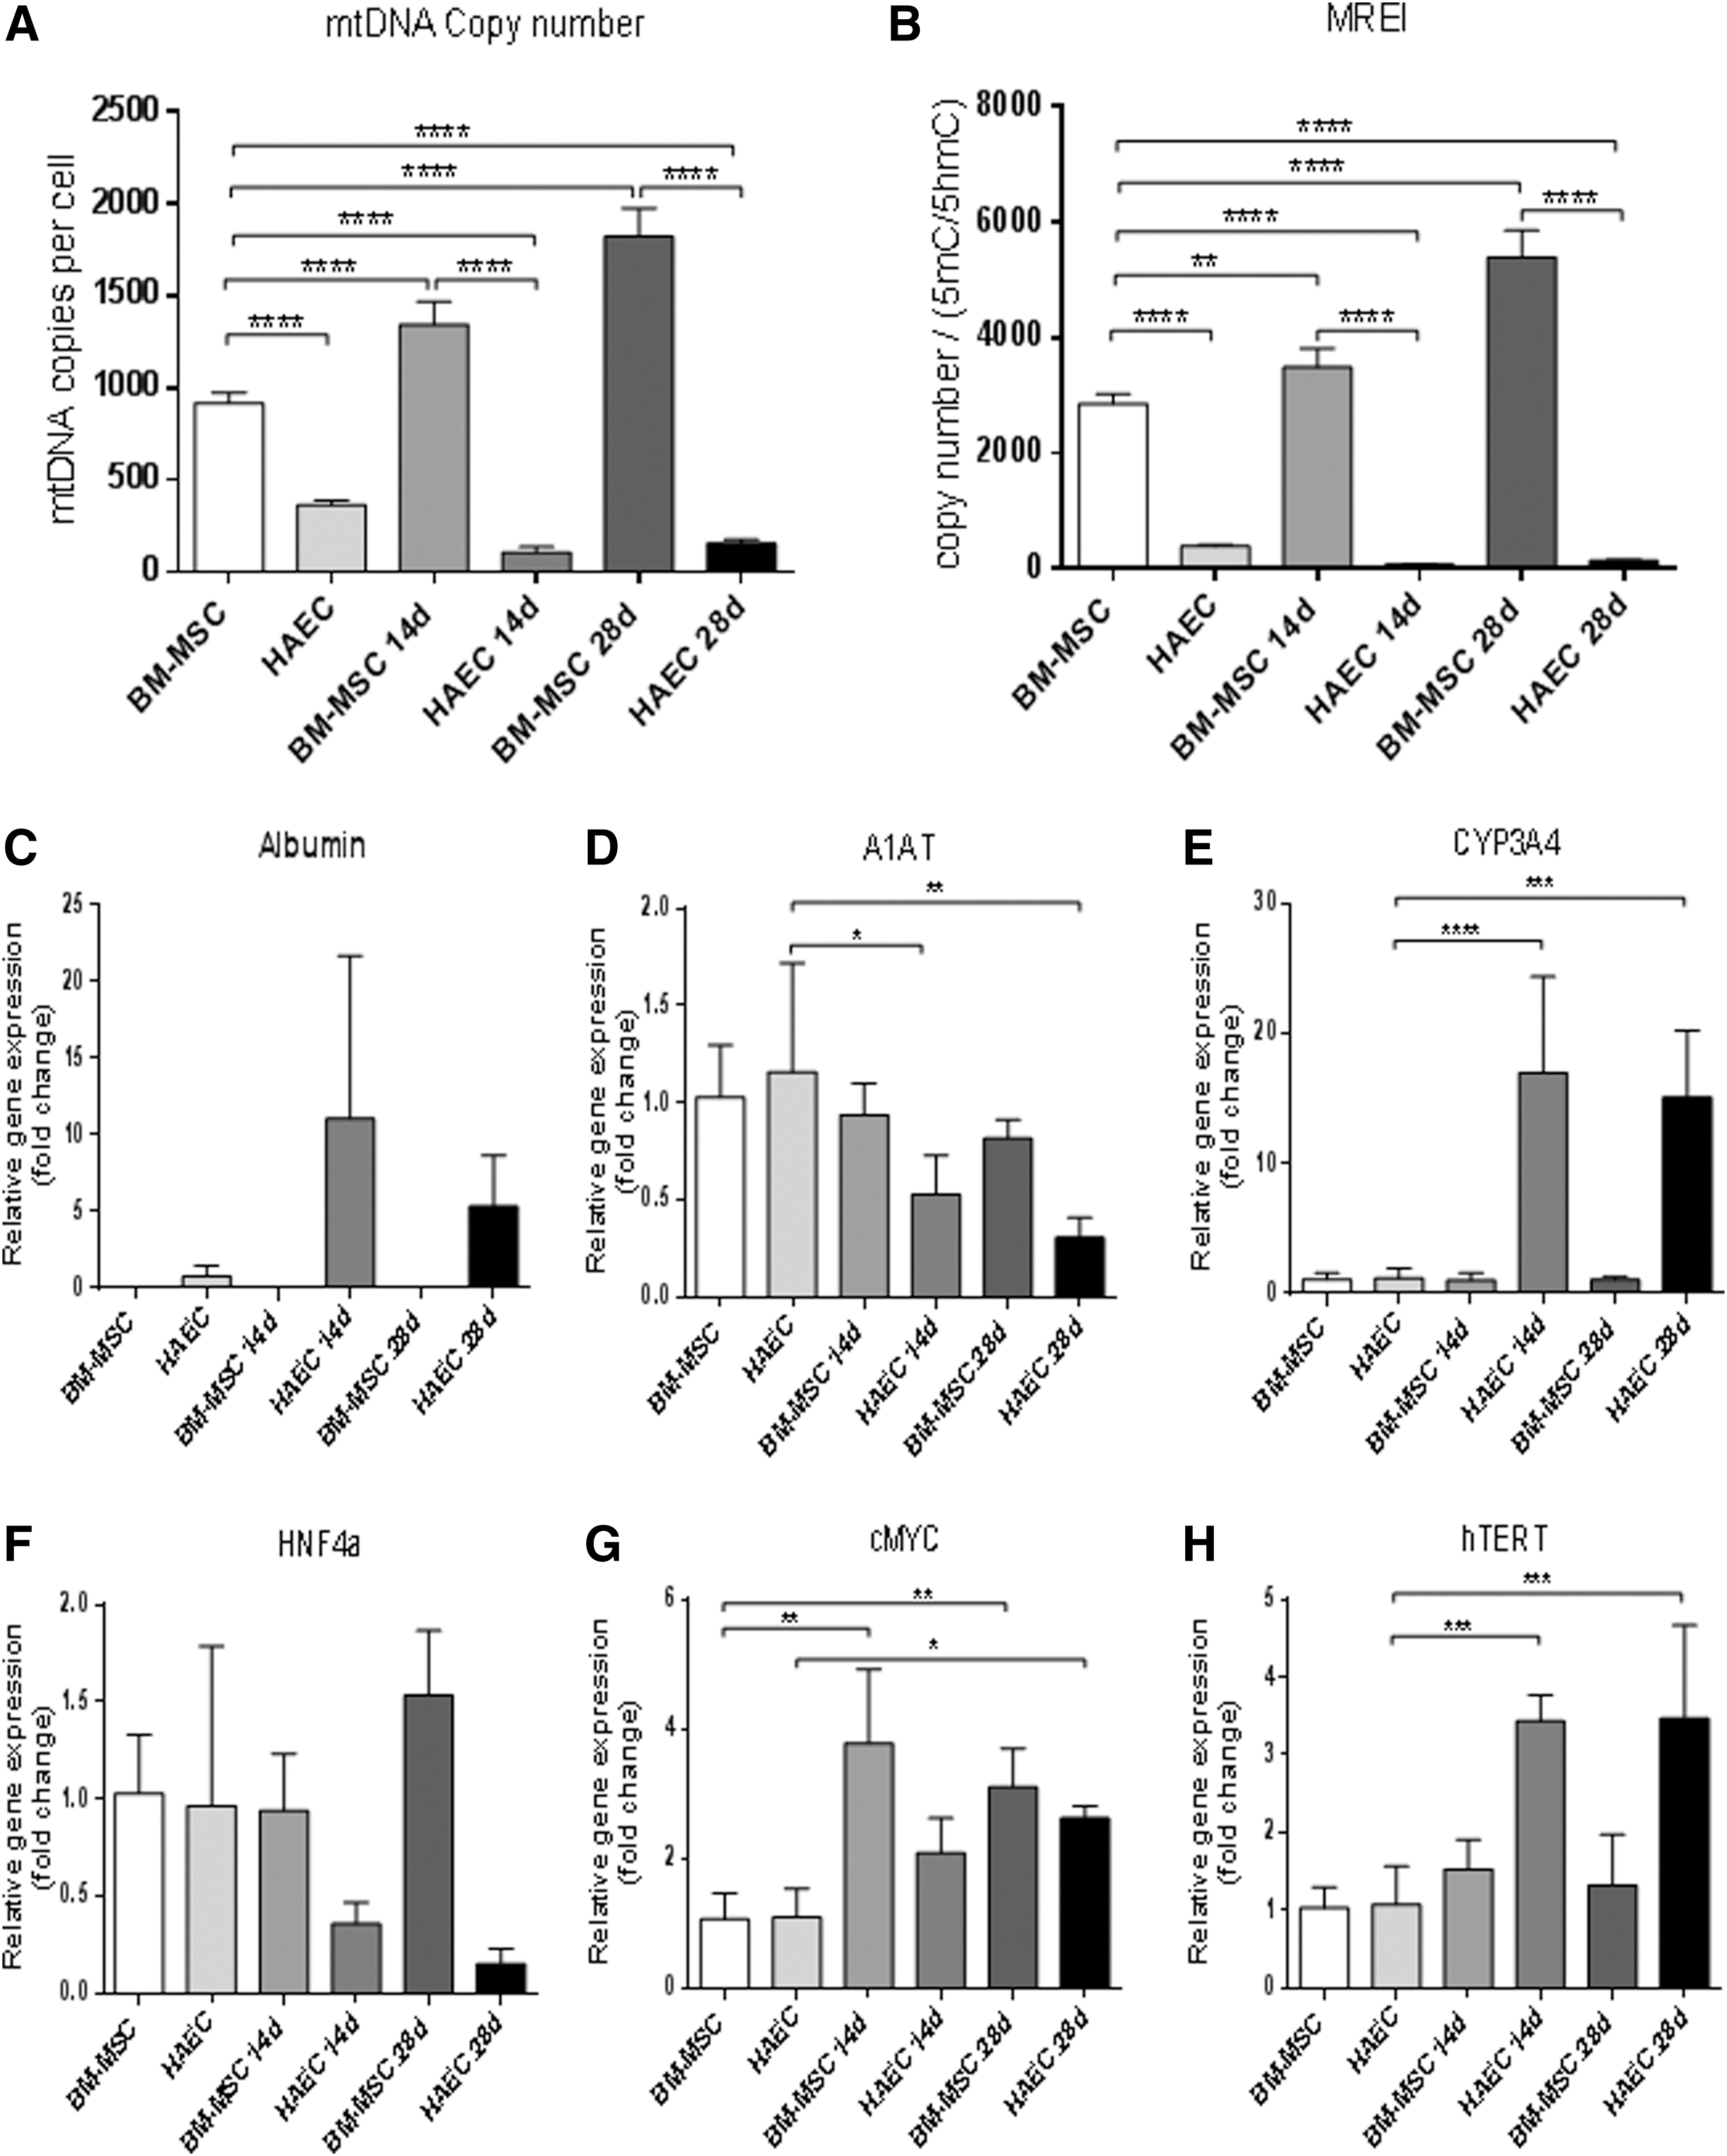
MtDNA copy number, mitochondrial replication efficiency index, and gene expression.
As mtDNA replication is primarily driven by POLGA, which is DNA methylated at exon 2 [19], we performed MeDIP to evaluate the levels of enrichment for 5mC and 5hmC in both BM-MSC and hAEC. We expressed mtDNA copy number relative to 5mC:5hmC to determine their respective levels of mtDNA replication efficiency. Undifferentiated hAEC had significantly lower levels of mtDNA replication efficiency than BM-MSC (Fig. 1B) due to their increased enrichment for 5mC at exon 2 of POLGA. During differentiation, mtDNA replication efficiency did not increase for hAEC and remained significantly lower at days 14 and 28 of differentiation (Fig. 1B). In contrast, mtDNA replication efficiency increased during differentiation of BM-MSC (Fig. 1B).
When we evaluated hepatocyte-specific gene expression, there was increased expression of albumin in day 28 hAEC-derived HLC, but albumin was not detected in day 28 BM-MSC (Fig. 1C). Expression of α1-AT in undifferentiated and day 14 and 28 differentiated BM-MSC remained unchanged. However, expression levels in hAEC were significantly lower in 14- and 28-day differentiated HLC compared to hAEC (Fig. 1D). Expression of the cytochrome enzyme CYP3A4 remained unchanged in BM-MSC, while hAEC-differentiated HLC showed significant increases at 14 and 28 days (Fig. 1E). Expression of the transcription factor HNF4α remained unchanged in BM-MSC, hAEC, and differentiated HLC. However, 14- and 28-day differentiated HLC showed lower levels of gene expression (Fig. 1F). Interestingly, both cMYC and hTERT were significantly higher in 14- and 28-day differentiated hAEC (Fig. 1G, H), which may have implications for the tumorigenic potential of hAEC.
The effects of DNA demethylation on hAEC mtDNA copy number and the potential to differentiate
To determine whether mtDNA copy number could be modulated in hAEC, as is the case for reprogrammed somatic cells [36] and tumor cells [19,36], we treated cells with the global DNA demethylation agent 5-azacytidine (5-aza). Enrichment of 5mC was reduced in undifferentiated hAEC, which was maintained throughout differentiation (Fig. 2A). This resulted in increased mtDNA copy number in undifferentiated hAEC, which was maintained at similar levels during differentiation and was reflected in respective levels of mtDNA replication efficiency (Fig. 2B). Assessment of gene expression patterns of hepatocyte-specific genes showed variable patterns. With differentiation, there were increased levels of expression for CYP3A4 (Fig. 2C), whereas levels of expression for α1 antitrypsin were significantly reduced (Fig. 2D), expression of albumin was lost (Fig. 2E), and there was no change for HNF4α (Fig. 2F). However, there were significant increases in expression of NANOG (Fig. 2G) and OCT4 in 5-aza-treated undifferentiated hAEC and differentiated HLC (Fig. 2H). Conversely, although there was no change in expression of SOX2 and hTERT in 5-aza-treated cells (Fig. 2I, J), there was a significant increase in expression of cMYC (Fig. 2K). Consequently, 5-aza treatment results in DNA demethylation at exon 2 of POLGA, increased mtDNA copy number, and increased expression of pluripotency genes.
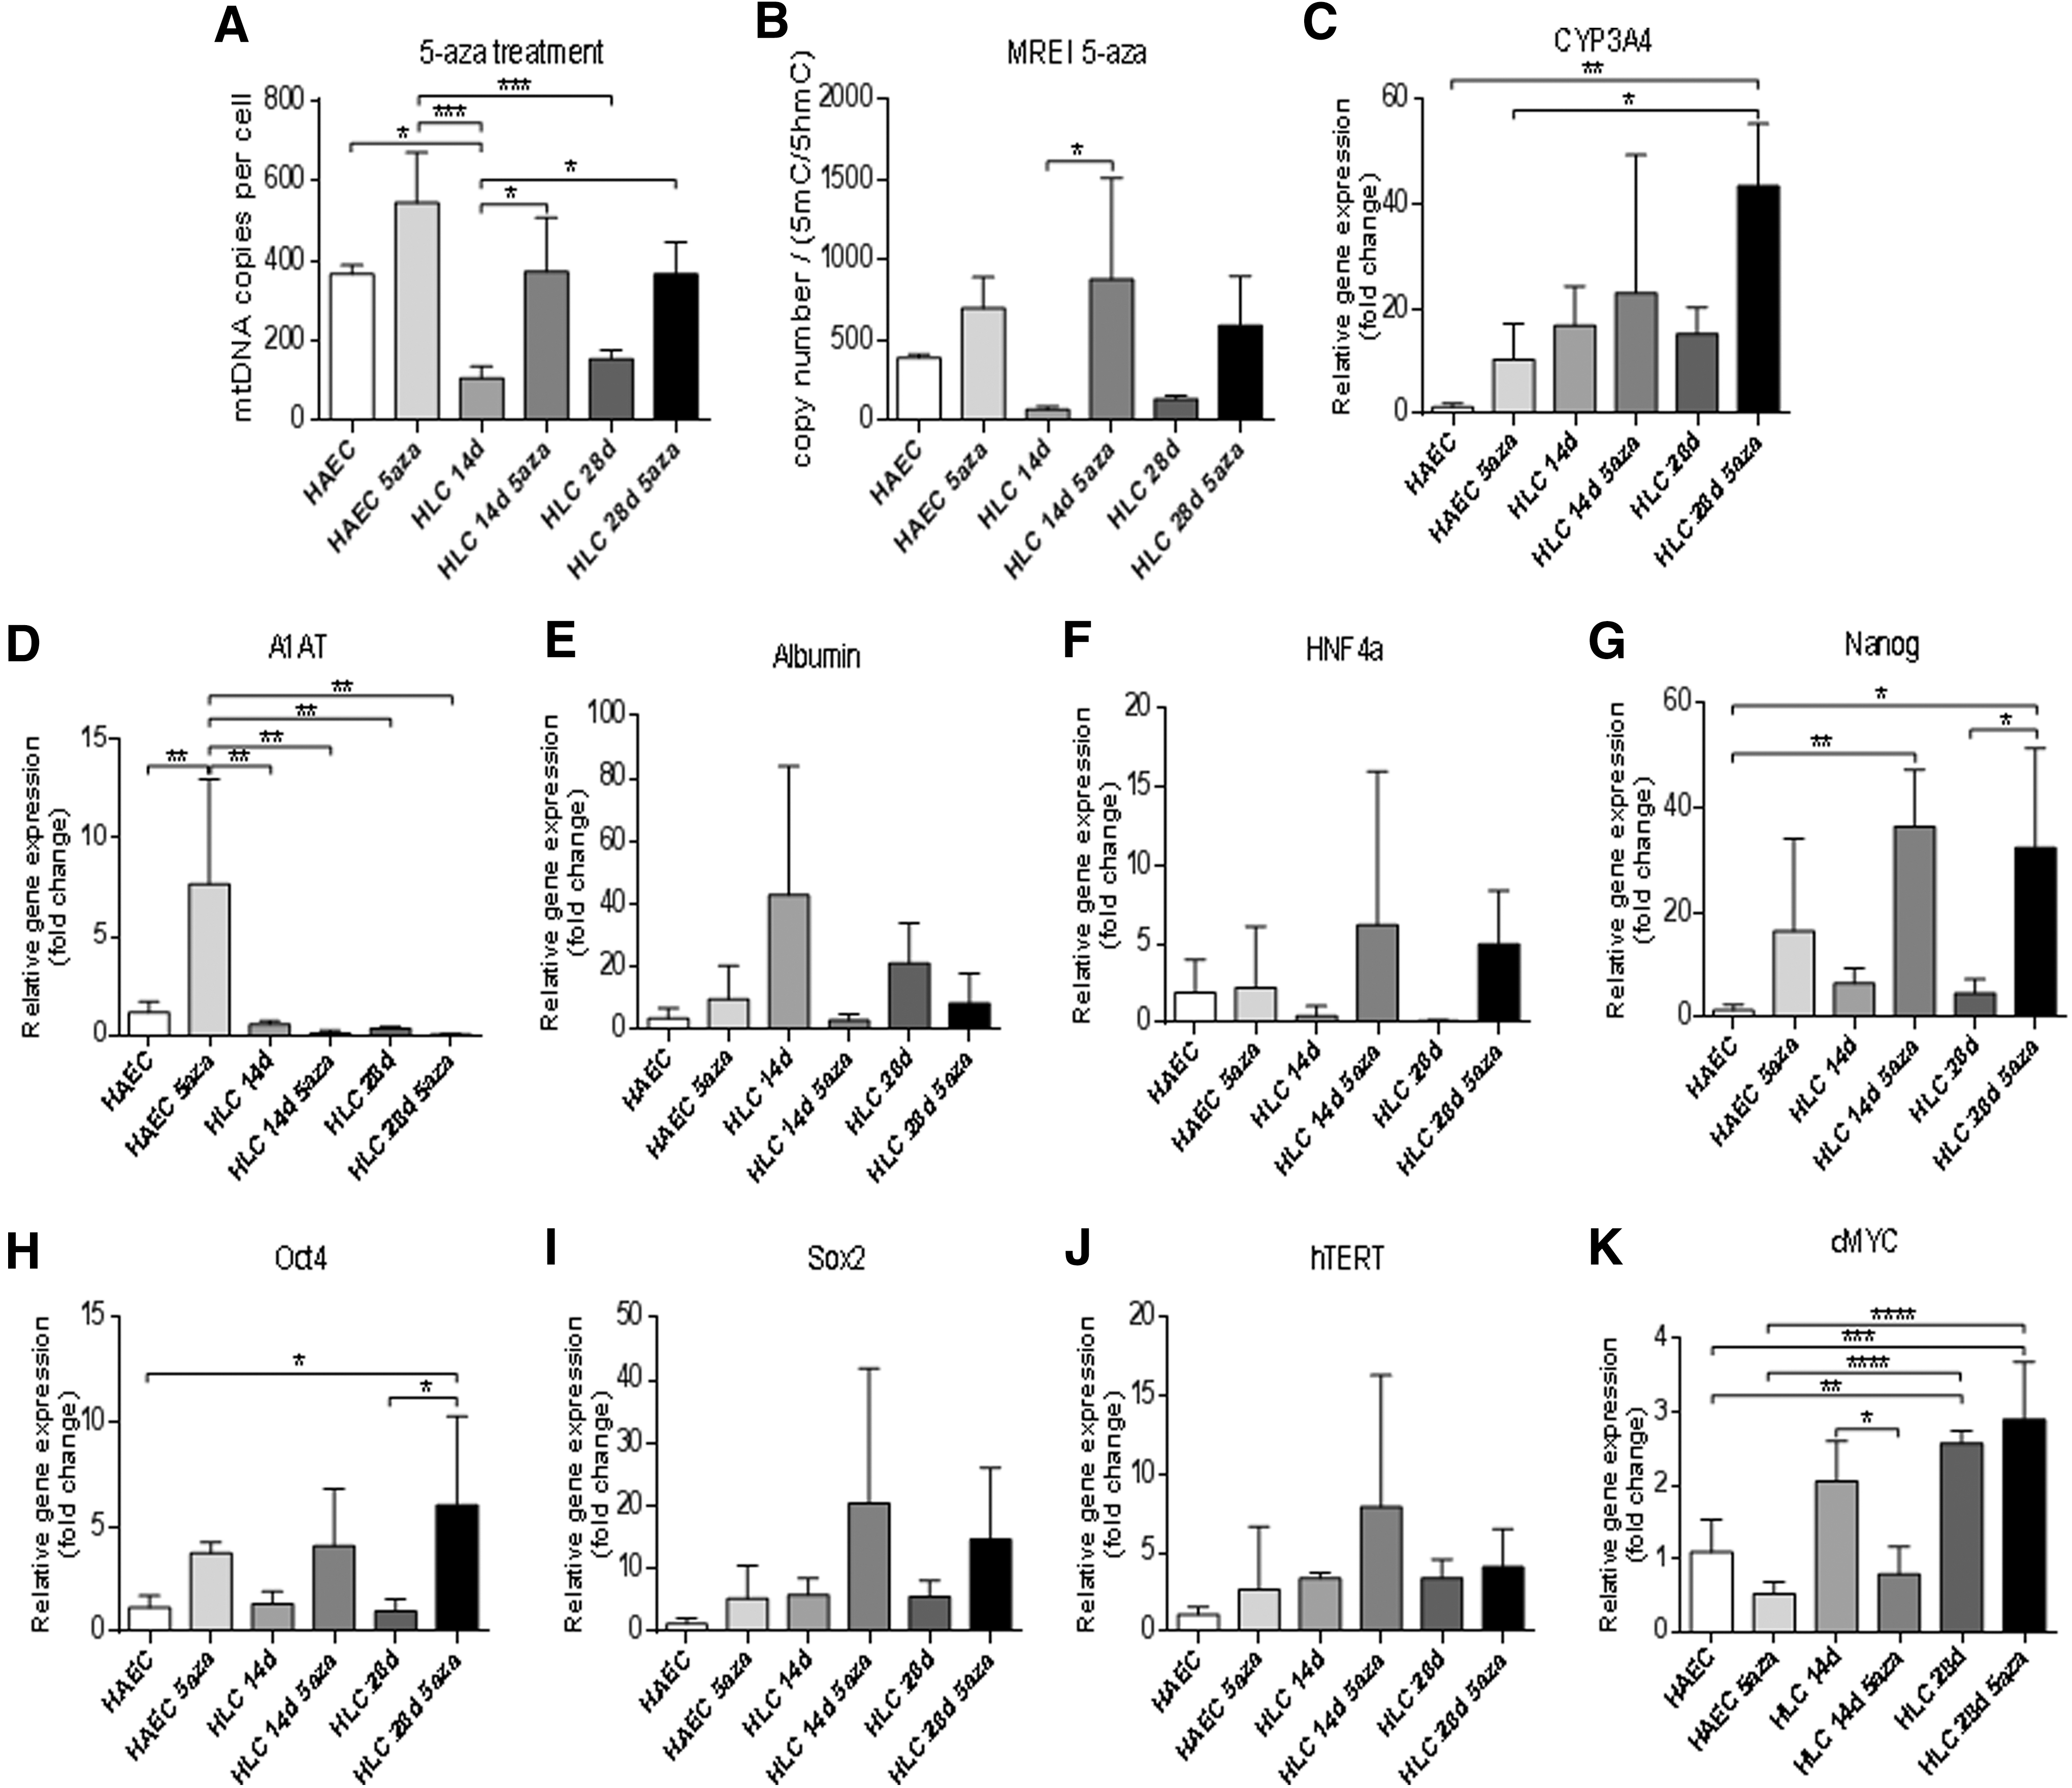
MtDNA copy number, mitochondrial replication efficiency index, and gene expression in 5-aza-treated cells.
The effects of mtDNA depletion on the differentiation potential of hAEC
Partial depletion of mtDNA can also reset cells to a more dedifferentiated state, which then allows differentiation to ensue [18,19]. To determine whether hAEC have the potential to respond in a similar manner, we treated hAEC with ddC to reduce their mtDNA content to 30% of their original mtDNA content (Fig. 3A). However, when mtDNA-depleted cells were allowed to recover in the absence of ddC in HLC differentiation media for 7 and 14 days, they unexpectedly failed to increase mtDNA copy number (Fig. 3A). When we evaluated DNA methylation at exon 2 of POLGA in day 3 mtDNA-depleted hAEC, 5mC enrichment was increased and, thus, replication efficiency remained unchanged compared to nondepleted hAEC (Fig. 3B). While the ratio of copy number to DNA methylation at exon 2 of POLGA was significantly lower at day 7 and 14 of recovery in differentiation media compared to nondepleted hAEC (Fig. 3B), the levels of enrichment for 5mC at 14 days of differentiation returned to levels similar to undifferentiated hAEC.
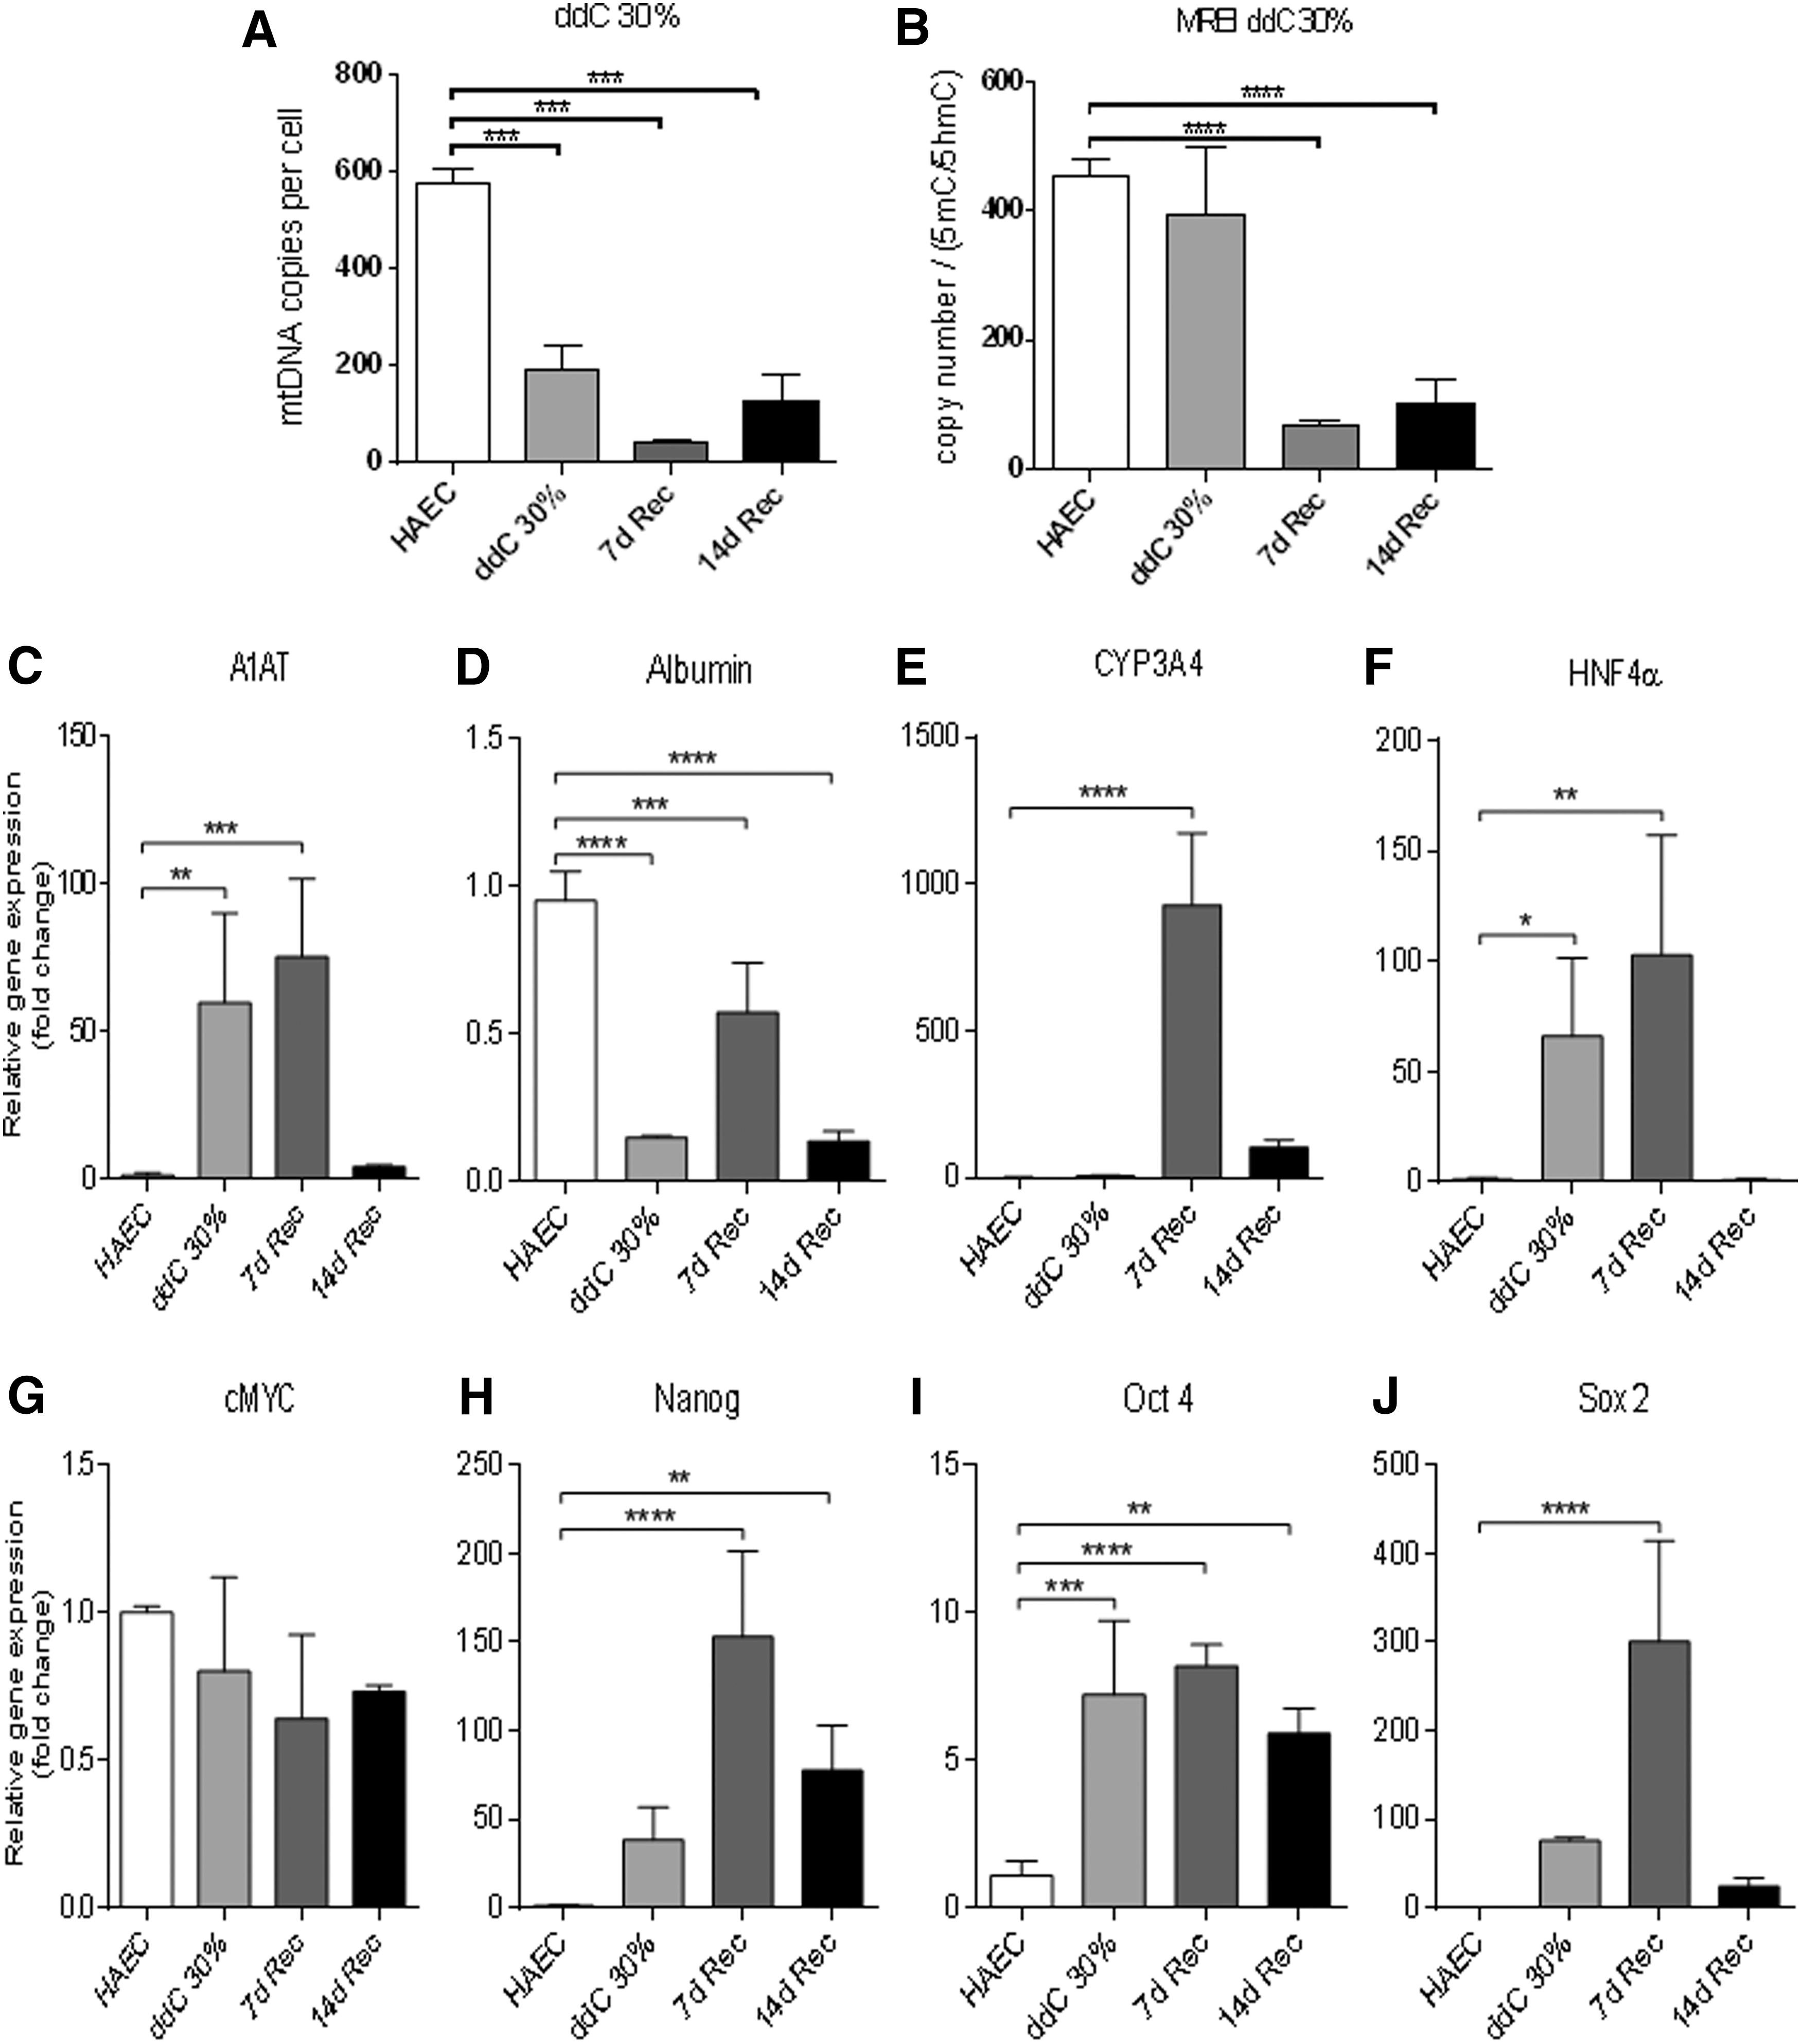
MtDNA copy number, mitochondrial replication efficiency index, and gene expression in hAEC depleted to 30% of their original mtDNA content.
The hepatocyte-specific gene α1-AT showed a significant increase in gene expression as a result of mtDNA depletion and at day 7 of differentiation but declined to similar levels to undifferentiated cells by day 14 of differentiation (Fig. 3C). Albumin gene expression was significantly decreased with mtDNA depletion but failed to increase during differentiation (Fig. 3D). CYP3A4 and HNF4α gene expression responded by increasing significantly at day 7 of differentiation, however, expression for these genes was reduced at day 14 (Fig. 3E, F). Although there was no change in expression of cMYC (Fig. 3G), there were significant increases in expression of the pluripotency genes in mtDNA-depleted hAEC and differentiated hAEC (Fig. 3H–J). Expression of NANOG and OCT4 was significantly increased in mtDNA-depleted hAEC at days 7 and 14 of differentiation (Fig. 3H, I). However, SOX2 expression was only significantly increased in mtDNA-depleted cells at 7 days of differentiation (Fig. 3J).
To determine if mtDNA depletion to lower levels would enhance differentiation potential, we depleted hAEC to ∼2% of its original content. mtDNA copy number did not increase following 7 and 14 days of differentiation and remained at <2% of its original content (Fig. 4A). Replication efficiency was significantly decreased in 2% ddC-depleted hAEC as well as 7- and 14-day recovered hAEC (Fig. 4B).
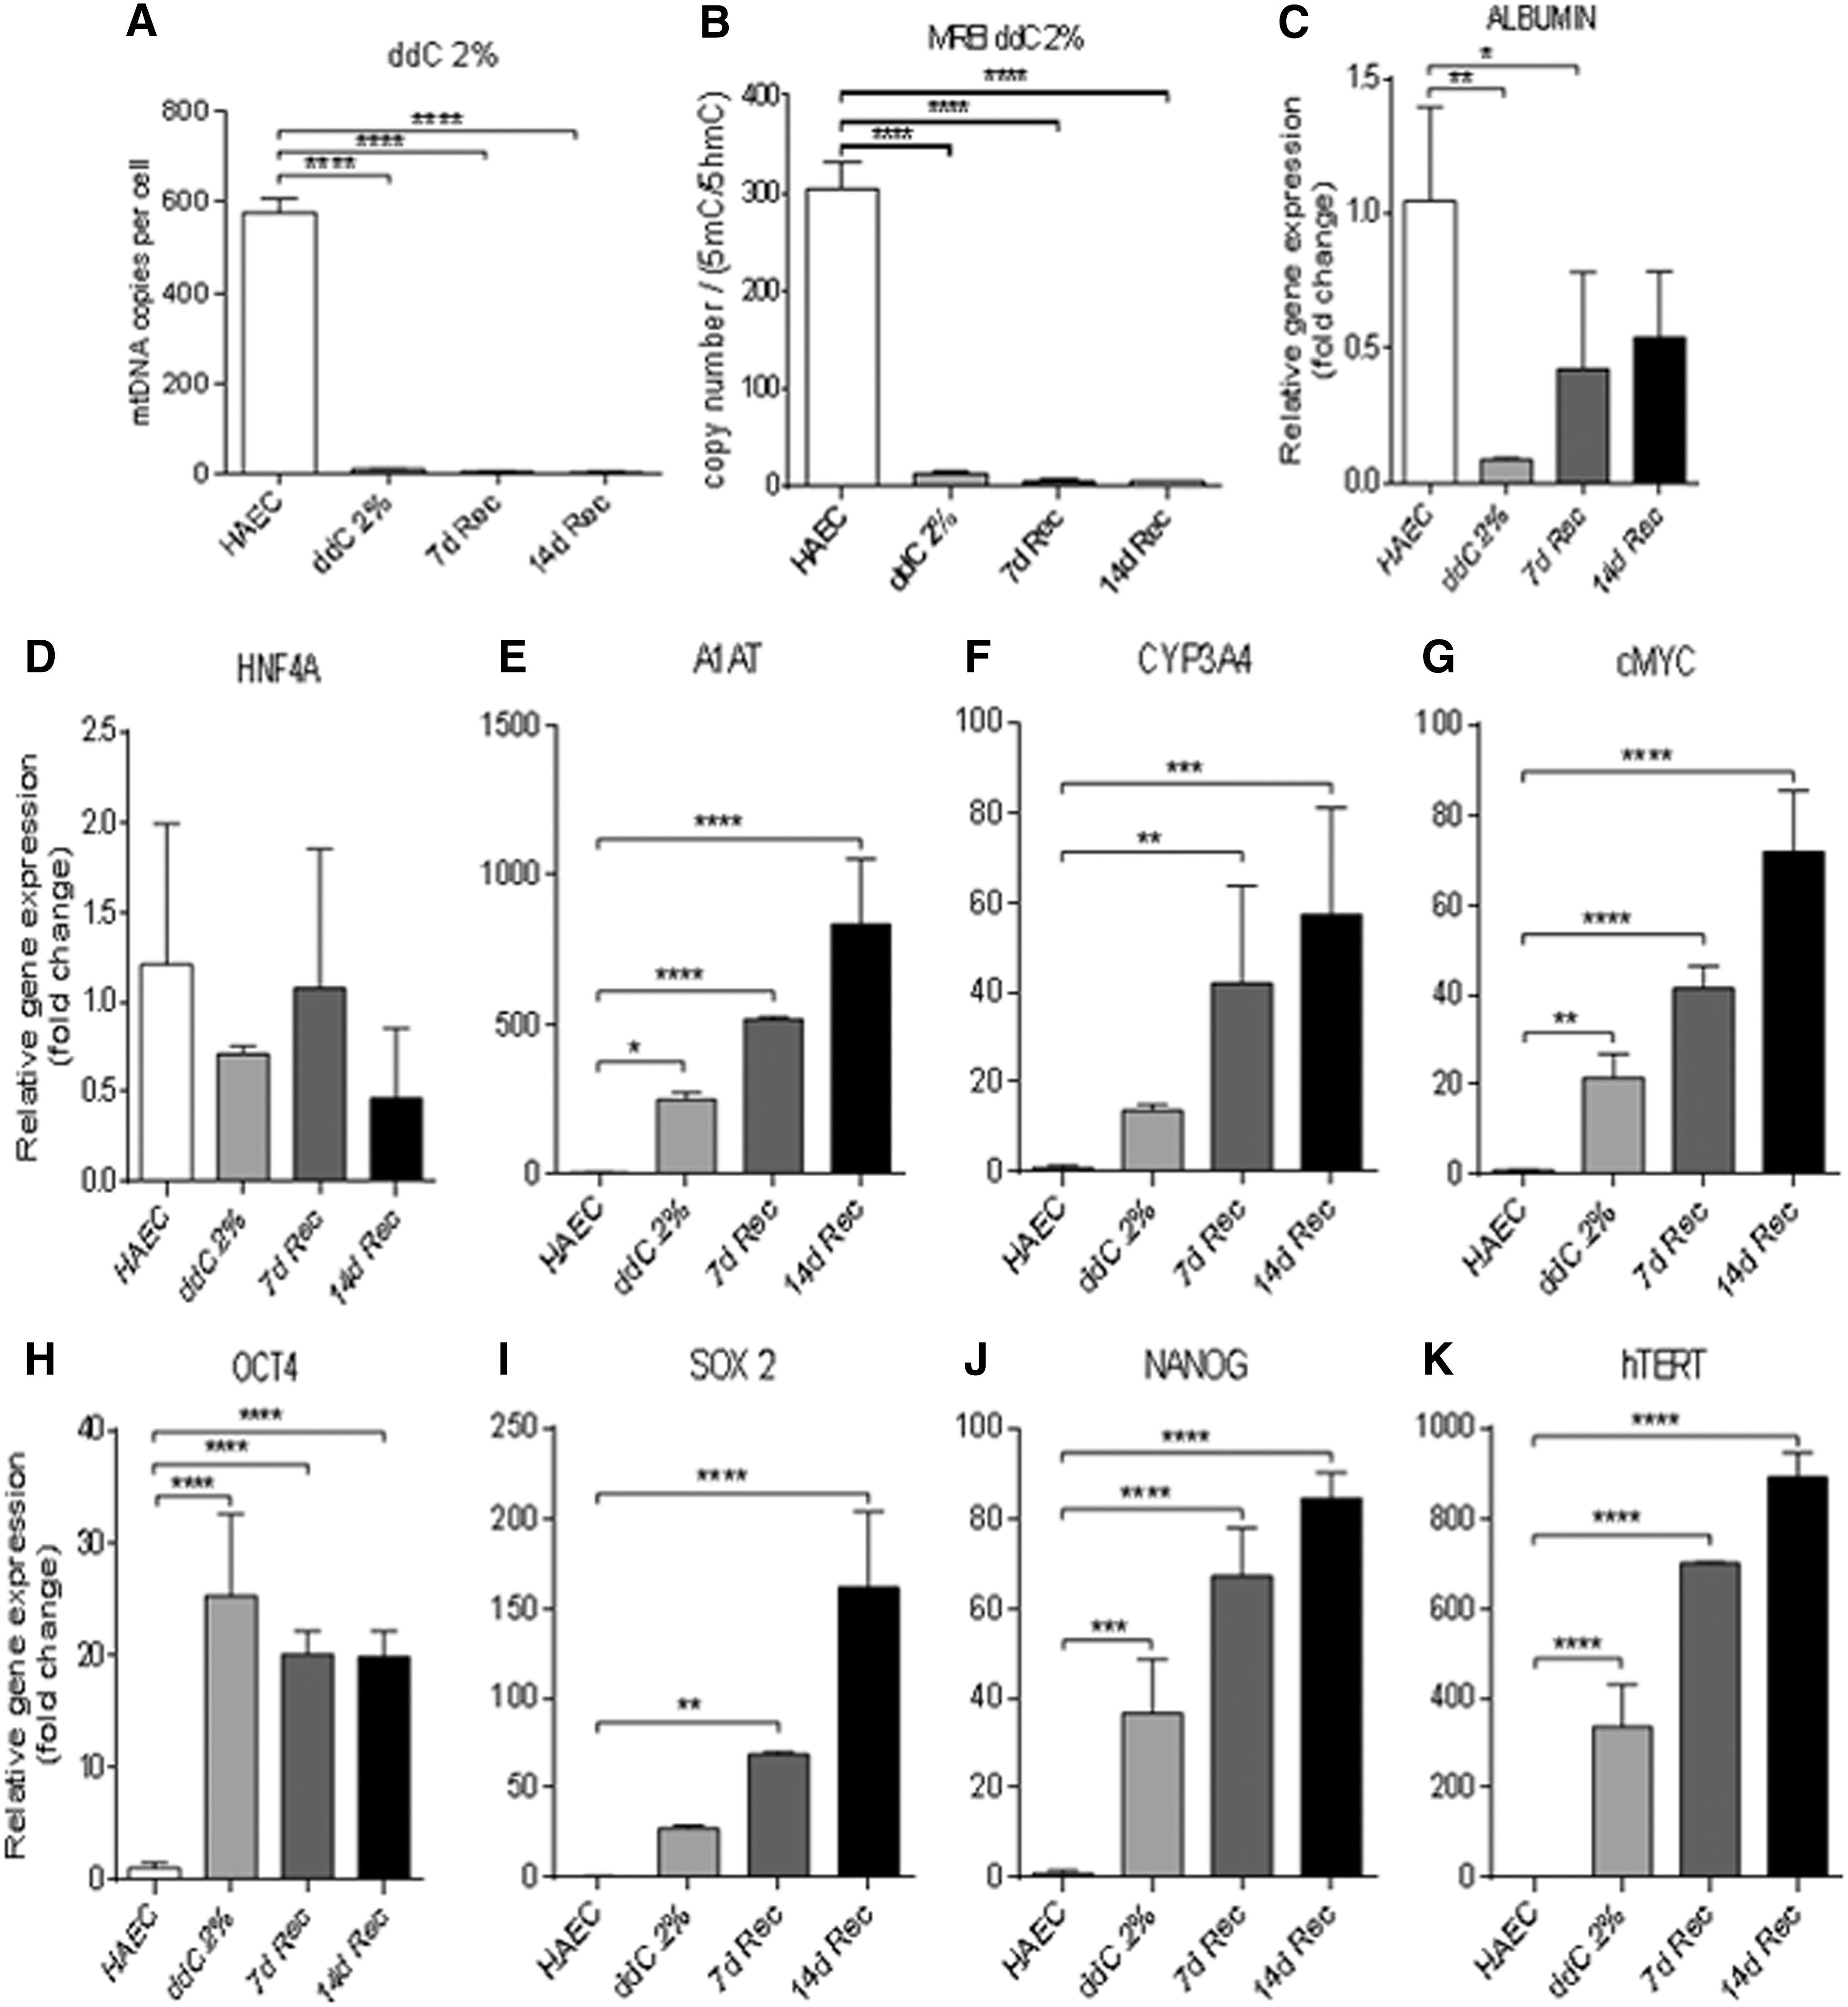
MtDNA copy number, mitochondrial replication efficiency index, and gene expression in 2% ddC-depleted cells.
Levels of gene expression for albumin decreased significantly in mtDNA-depleted hAEC and day 7 differentiated cells (Fig. 4C), while expression of HNF4α remained unchanged (Fig. 4D). However, gene expression for α1-AT (Fig. 4E) and CYP3A4 (Fig. 4F) significantly increased in mtDNA-depleted hAEC and there were further significant increases in gene expression at days 7 and 14 of differentiation. Similar profiles were observed for the oncogene cMYC (Fig. 4G) and the pluripotent genes OCT4 (Fig. 4H), SOX2 (Fig. 4I), NANOG (Fig. 4J), and hTERT (Fig. 4K), a marker of proliferation. Overall, hAEC failed to regulate their mtDNA copy number during HLC differentiation due to higher levels of DNA methylation at exon 2 of POLGA. This is also the case following 5-aza treatment and partial depletion of mtDNA.
The tumorigenic potential of mtDNA-depleted hAEC
As depleted and nondepleted hAEC expressed high levels of pluripotent genes, the oncogene cMYC, and the proliferation factor hTERT, and were unable to modulate mtDNA copy number effectively, as is the case for tumor cells [18,19], we determined the tumorigenic capacity of hAEC and hAEC depleted to 60%, 30%, and 5% of their original mtDNA content. We injected 2 million cells subcutaneously into athymic nude mice and monitored tumor development over 6 months. Neither mtDNA-depleted nor nondepleted cells formed tumors, indicating that hAEC do not have the capacity to fully differentiate or form tumors in a subcutaneous xenograft model.
Encapsulation of mtDNA-depleted hAEC
We encapsulated hAEC and hAEC depleted to 20% and 50% of their original mtDNA content to determine if a 3D environment would enhance their differentiation potential. Assessment of viability using carboxyfluorescein diacetate succinimidyl and propidium iodide staining showed that viability was maintained at 14 and 28 days postencapsulation (Fig. 5). Nondepleted encapsulated cells at days 14 and 28 had significantly reduced mtDNA copy number (Fig. 6A), which also exhibited significantly lower levels of 5mC enrichment (Fig. 6B). Whereas hAEC depleted to 20% of their original content showed decreased levels of mtDNA copy number at day 14, levels returned to those similar to undifferentiated hAEC on day 28 (Fig. 6C). In 20% mtDNA-depleted hAEC, there were high levels of enrichment for DNA methylation at exon 2 of POLGA, whereas 5mC enrichment reduced significantly in day 14 and 28 encapsulated cells (Fig. 6D). hAEC depleted to 50% of their original mtDNA content had significantly lower mtDNA copy number. Following encapsulation and differentiation, mtDNA copy number further decreased significantly by day 14 but returned to original levels by day 28 (Fig. 6E). However, these cells exhibited very low levels of DNA methylation at exon 2 of POLGA on day 14, while levels of enrichment increased by day 28 (Fig. 6F). Overall, mtDNA copy number was significantly reduced at day 14 of encapsulation but was increased at day 28 for both depleted and nondepleted hAEC. The ratios of 5mC:5hmC showed significant reductions in DNA methylation at exon 2 of POLGA with encapsulation for nondepleted and 20% depleted cells.
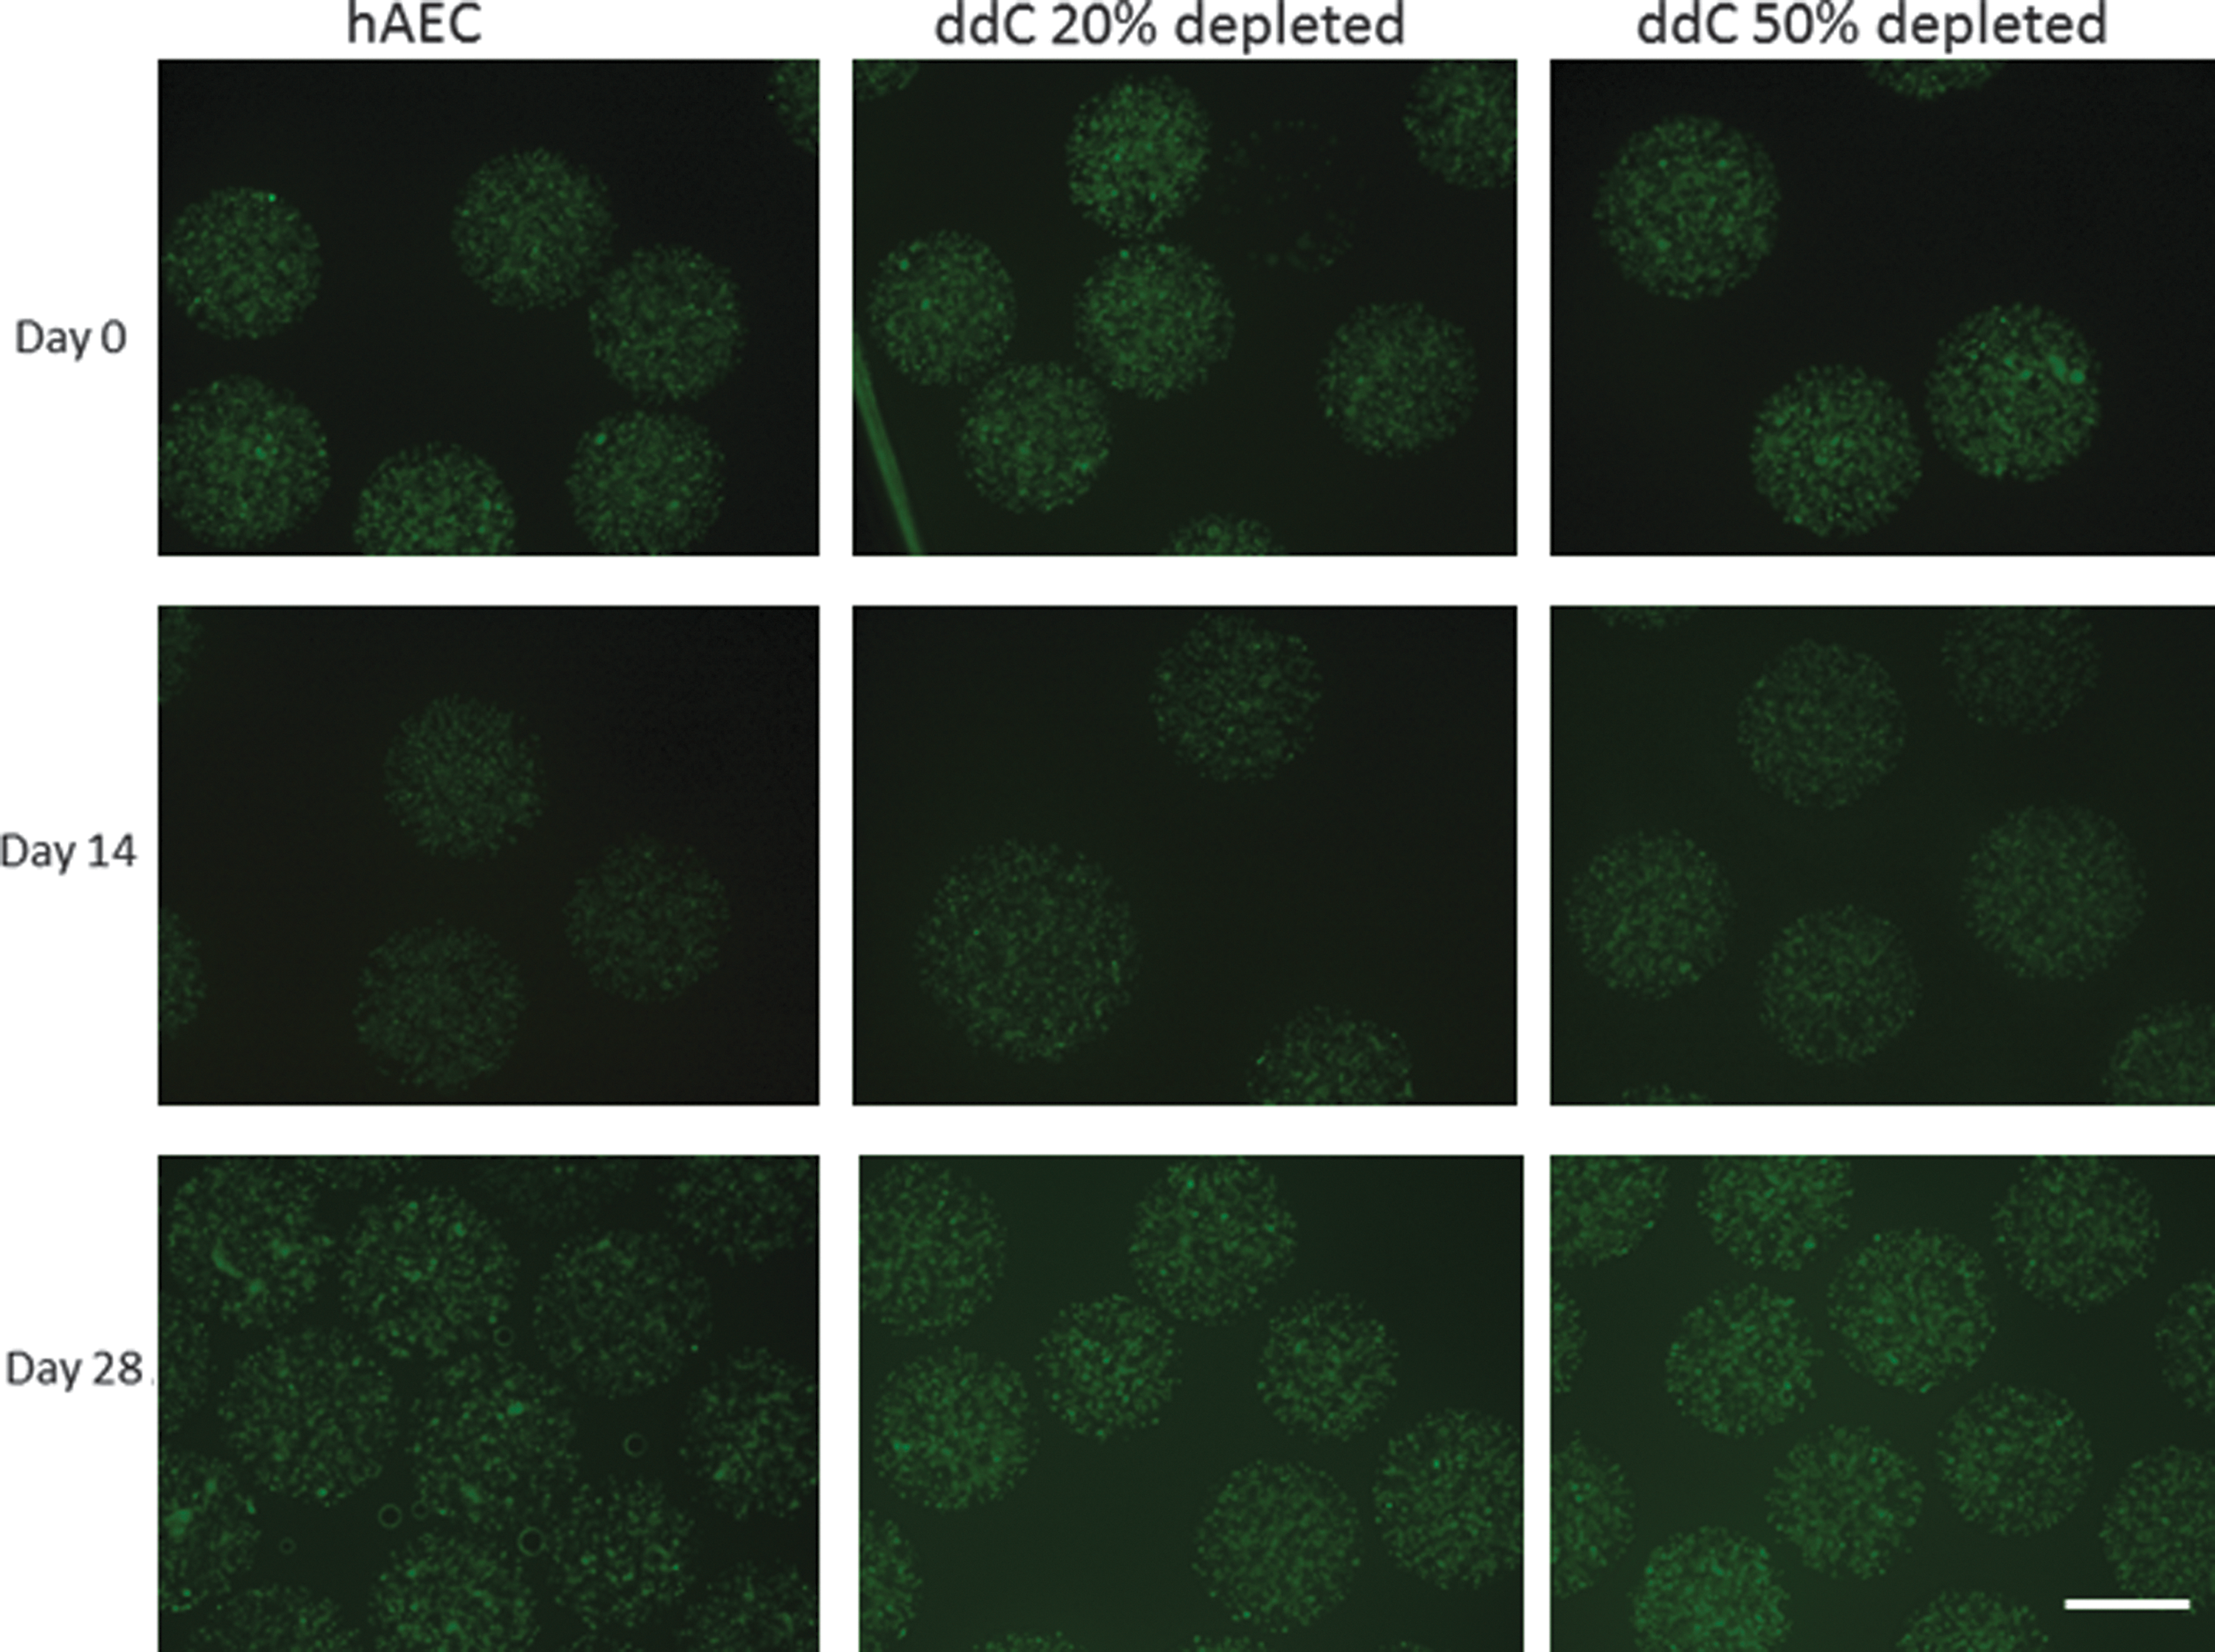
Viability stain of encapsulated HLC. Encapsulated HLC stained at 0, 14, and 28 days with CFDA/PI for hAEC, 20% and 50% ddC-depleted hAEC. Scale bar = 500 μM. CFDA, carboxyfluorescein diacetate succinimidyl; PI, propidium iodide. Color images available online at
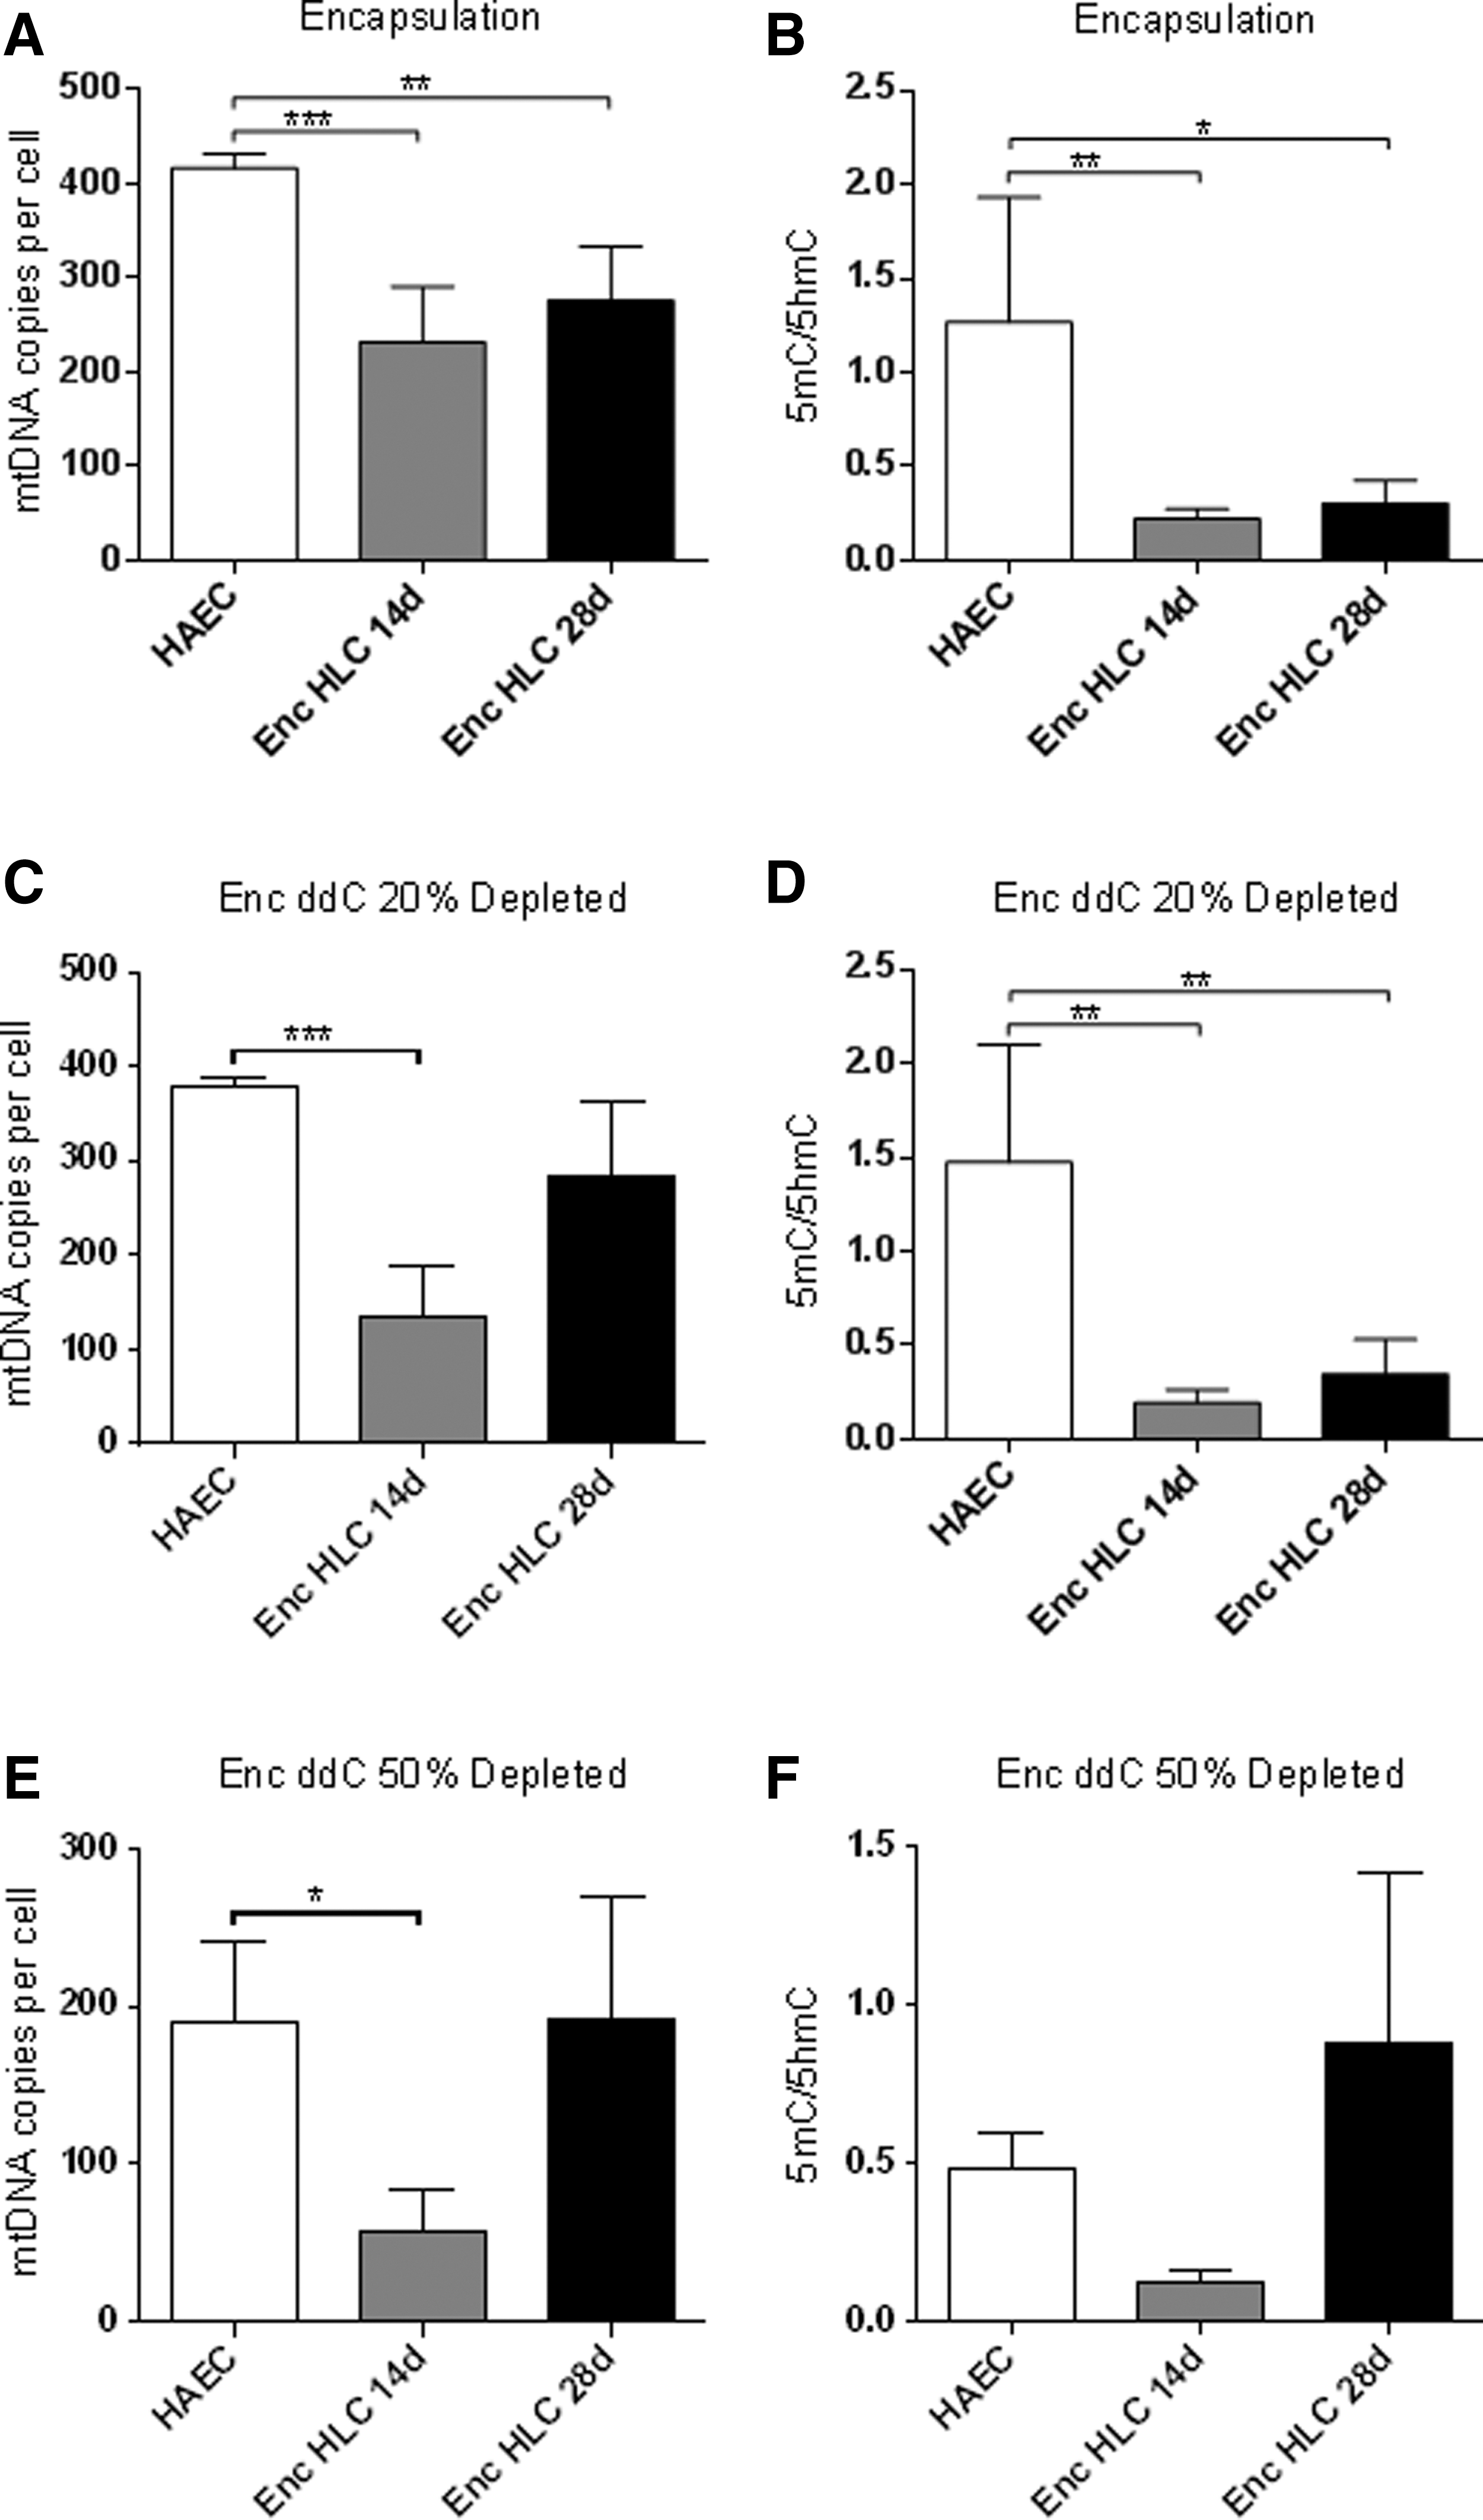
MtDNA copy number and the ratios of enrichment of 5mC and 5hmC at exon 2 of POLGA.
Changes in gene expression on day 28 2D differentiated HLC
To evaluate changes in gene expression due to HLC differentiation, we performed RNA-seq on undifferentiated and day 28 differentiated hAEC. There were 1,722 differentially regulated genes in day 28 HLC with 695 being upregulated and 1,027 being downregulated (Supplementary Fig. S2A), which demonstrated commitment to the hepatic lineage, including upregulation of members of membrane-anchored proteins and WNT genes (Supplementary Table S2), as observed in hepatic specification [37]. However, HLC were also immunogenic. This is demonstrated by changes to the ATM signaling pathway where, in day 28 HLC, c-JUN, which activates cell survival-associated genes, was upregulated while IκBα, which activates NF-κB signaling, was downregulated (Supplementary Table S2). More interestingly, the interferon signaling pathway was significantly upregulated in HLC with high levels of expression of IFIT and STAT genes (Supplementary Table S2).
Network analysis reinforced hepatic-lineage specification by indicating that day 28 differentiated HLC exhibited potential hepatic functions through the hepatic system development and the mineral metabolism networks being ranked in the top five affected networks (Supplementary Table S3). In particular, DHRS3 and CA12, which are involved in retinoic acid metabolism and carbon dioxide catabolism, were significantly higher in day 28 HLC compared to hAEC. Furthermore, the top candidate genes showed upregulation of hepatocyte-associated genes, including MIR612, which inhibits hepatocellular carcinoma proliferation, migration, and metastasis; KDR, which encodes vascular endothelial growth factor (VEGF) receptor II and mediates VEGF-induced proliferation and tubular morphology (Supplementary Table S4); and complement factor B, follistatin, and the cytochrome P450 enzyme CYP1B1. Differentiated day 28 HLC also resulted in downregulation of cell adhesion and migration-associated genes L1CAM and PODXL (Supplementary Table S5). Interestingly, genes associated with lipoprotein metabolism, LDLR and LIPG, were also significantly downregulated in day 28 differentiated HLC (Supplementary Table S5).
The effects of HLC differentiation and encapsulation on gene expression
To evaluate the changes in HLC differentiation due to encapsulation, we compared encapsulated HLC to hAEC. There were a total of 1,325 differentially regulated genes, 705 were upregulated and 620 downregulated (Supplementary Fig. S2B). In terms of hepatocyte differentiation and function, encapsulated HLC showed increased expression of extracellular matrix genes, collagen, and vascular endothelial growth factor that promote cell-to-cell interactions (Supplementary Table S6). In addition, activation of the stellate cell pathway, which involves upregulation of collagen and MMP genes, upregulated matrix metalloproteinase and tissue inhibitors of metalloproteinase (Supplementary Table S6). Interestingly, IL-1-mediated inhibition of RXR function was also markedly upregulated in encapsulated HLC, which included the ABC membrane transporters, aldehyde dehydrogenase genes, and IL-1α and IL-1R1 (Supplementary Table S6).
The top networks affected indicated upregulation of aldo-keto reductase AKR1B1, mitochondrial cytochrome c oxidase genes COX5B and COX7A1, micro-RNA 210, and ribosomal proteins RPL29, RPL38, and RPL39, which are involved in free radical scavenging and cell-to-cell signaling (Supplementary Table S7). More importantly, encapsulated HLC showed upregulation of cytochrome P450 genes CYP1B1, CYP2D6, and CYP2E1 in the drug metabolism network (Supplementary Table S7). Increased expression of CYP genes indicates the capacity of the encapsulated HLC to metabolize drugs [38,39]. These results show that, not only have encapsulated hAEC differentiated into HLC, the encapsulated HLC have the capacity to perform hepatocyte functions.
The top candidate genes affected in encapsulated HLC were associated with extracellular matrix signaling and hepatic-lineage specification. Encapsulated HLC showed increased expression of follistatin, which binds and activates the TGF-β superfamily and promotes collagen deposition (Supplementary Table S8). Genes involved in cell adhesion and extracellular matrix organization, COL18A1, COL27A1, and CD248, a cell adhesion transmembrane receptor, were also highly expressed in encapsulated HLC (Supplementary Table S8). Expression of the hepatocyte-associated gene forkhead box protein A3, FOXA3 also known as HNF3G, which is involved in activation of liver-specific transcripts of albumin and plays a role in liver differentiation, was also increased in encapsulated HLC. Encapsulated HLC down regulated genes associated with inflammation, specifically, TNFSF15, which mediates activation of NF-κB (Supplementary Table S9). Likewise, LIPG and SEMA3D, which are involved in lipid metabolism and cell differentiation, respectively, were also downregulated in encapsulated HLC (Supplementary Table S9).
The effects of 3D HLC differentiation on gene expression
Since hAEC are better able to differentiate into HLC when encapsulated through improved expression of hepatocyte-specific genes and related functions, we determined the effects of the 3D against the 2D environments for differentiation on gene expression by comparing encapsulated HLC with HLC. There were 286 differentially regulated genes with 210 upregulated and 76 downregulated (Supplementary Fig. S2C). Encapsulated HLC were less immunogenic in the 3D environment and showed enhanced hepatocyte function. Interferon signaling pathway, which included the major interferon genes IFI35, IFIT1, IFIT3, IFITM1, and IFITM3, and signal transducers and activators of transcription genes STAT1 and STAT2 were downregulated in encapsulated HLC (Supplementary Table S10). Phosphorylated homodimers of STAT1 translocate to the nucleus to activate type II interferon signaling, whereas phosphorylated heterodimers of STAT1 and STAT2 activate type I interferon signaling [40]. In addition, the pattern recognition pathway genes OAS1, OAS2, and OAS3 were also downregulated in 3D encapsulated HLC (Supplementary Table S10). Interestingly, hepatic functions were enhanced by activation of the FXR/RXR pathway with upregulation of the membrane transporter ABCC2, lipoprotein-associated genes APOE, LIPC, and LDLR, and iron transporters HPX and TF in 3D encapsulated HLC (Supplementary Table S10). Hepatic lineage commitment was driven by the upregulation of mitogen-activated protein kinase MAPK1 and NKX2-3, transcription factors involved in cell specification and maintenance of differentiation (Supplementary Table S10).
Encapsulated 3D HLC showed increased extracellular matrix deposition and a reduction in inflammatory response. Genes associated with enhanced hepatocyte function were upregulated in 3D encapsulated HLC, in particular, the urea cycle enzymes ASS1 and GOT1, epithelial cellular adhesion molecule EPCAM, and the family members of pro-protein convertase PCSK6 and PCSK1N (Supplementary Table S11). Interestingly, genes associated with the inflammatory response network, interferon and oligoadenylate synthetase genes, were downregulated in 3D encapsulated HLC (Supplementary Table S11). In addition, the lipid metabolism network was upregulated with increased expression of CYP3A5 in encapsulated HLC (Supplementary Table S11).
The top upregulated genes were associated with extracellular matrix interactions and hepatic lineage specification. There was increased expression of genes encoding collagen and cell-to-cell adhesion molecules, which enhance HLC functions [38,39]. Genes associated with extracellular matrix protein SERPINF2, which regulates cell–cell adhesion mediated by cadherins, and COL18A1, which is involved in cell adhesion and extracellular matrix organization, were upregulated in 3D encapsulated HLC (Supplementary Table S12). Genes involved in hepatic lineage specification included the serine protease converter of HGF, HGFAC, and FGFR4, which act in the cascade of mitogenesis and differentiation (Supplementary Table S12). Interestingly, upregulation of APOE, involved in catabolism of triglyceride-rich lipoproteins, indicates enhanced hepatic function (Supplementary Table S12).
3D encapsulated HLC were less immunogenic compared to HLC cultured in 2D. The key genes involved in interferon signaling, IFITM1, IFIT1, IFIT3, and IFI27, were all downregulated in 3D encapsulated HLC (Supplementary Table S13), which suggests that there is less immunogenic response from encapsulated HLC compared to nonencapsulated HLC. In addition, MX1 and OAS3, genes associated with viral infection, were also downregulated in 3D encapsulated HLC (Supplementary Table S13). Overall, these results indicate that 3D encapsulated HLC are less immunogenic and exhibit greater lineage commitment through higher levels of expression of hepatocyte-specific genes.
Discussion
As stem cells differentiate and commit to specific lineages, this is marked by reduced proliferation [24] and increased mtDNA copy number, especially in cells with a high requirement for OXPHOS-derived ATP [17,18]. Our data show that BM-MSC follow this process robustly, however, hAEC are unable to increase their mtDNA copy number, which stalls in a manner similar to tumor cells [18]. Furthermore, gene expression data and functional metabolic assays suggest that HLC were progressing toward a hepatocyte-like state. However, their metabolic capacity is considered to be low when compared with HepG2 cells. The inability of hAEC to modulate their mtDNA copy number is due to the higher ratio of 5mC:5hmC at exon 2 of POLGA. Consequently, this results in lower levels of expression of hepatocyte-specific genes, which is indicative of pseudodifferentiation where cells seek to establish a fully differentiated state but are trapped before completion of the process [41]. Furthermore, our data show that mtDNA copy number can be modulated by increased levels of 5hmC at exon 2 of POLGA, which resulted from the genome-wide effects of 5-aza demethylation that also induced the expression of both hepatic and pluripotency genes. Differentiated HLC promoted hepatic gene expression, however, expression of pluripotent genes was not suppressed.
Depletion of mtDNA copy number has been shown to reset the cell to a more naive state, which, in turn, can overcome the block in differentiation and enables cells to increase their mtDNA copy number, as shown in tumor cells [19,42]. However, our data show that depleting hAEC to 30% of their original mtDNA copy number followed by differentiation did not increase mtDNA copy number. Failure to increase mtDNA copy number was due to higher levels of 5mC at exon 2 of POLGA. Although there was increased gene expression for hepatic markers, pluripotency gene expression was also maintained postdifferentiation. These data suggest that 30% depletion of mtDNA copy number is not sufficient to dedifferentiate cells due to the higher levels of 5mC at exon 2 of POLGA.
We evaluated further depletion of mtDNA copy number to less than 2% by depletion with ddC for 7 days. Failure to replenish mtDNA copy number was again due to hypermethylation at exon 2 of POLGA. As reported previously [18,19], our results demonstrate that DNA methylation at exon 2 of POLGA is intricately linked to regulation of mtDNA copy number. Depletion of mtDNA also has implications for the tumorigenic capacity of these cells [18]. Indeed, cMYC, an oncogene involved in many cancers [43,44], was highly expressed in differentiated HLC after 7 days of mtDNA depletion. cMYC directly activates hTERT, which is expressed in rapidly proliferating and cancerous cells [45]. However, the coexpression of hTERT and cMYC in undifferentiated hAEC failed to initiate tumorigenesis in a subcutaneous xenograft model.
Our results further show that encapsulation of hAEC cannot modulate mtDNA copy number during differentiation and exon 2 of POLGA maintains its hypermethylated state. This is despite encapsulation of hAEC creating a 3D environment, which is permissive for gene expression of specific lineages and differentiation. Indeed, our RNA-seq data show increased evidence for hepatic differentiation with expression of GGT5, complement factor B, and CYP1B1, suggesting lineage commitment. Interestingly, differentiated encapsulated HLC expressed OASL, which activates cytokine-mediated signaling [46], suggesting HLC are more immunogenic. We previously found that differentiation of HLC increased T cell response in vitro [5]. However, there was downregulation of cell adhesion genes, which may be due to increased deposition of matrix secreted by HLC.
Downregulation of ATM signaling, which is implicated as a cell-cycle checkpoint, suggests that the cells had exited proliferation [47]. In addition, upregulation of CDK1 and Cyclin B inhibits G2/M transition, suggesting lineage commitment and differentiation. More importantly, upregulation of anchored membrane proteins and WNT genes complements differentiation of HLC. Differentiation of cells is initially driven by reorganization of the cytoplasmic machinery to adapt cell function [48]. Analysis of axonal guidance pathways showed upregulation of KALRN and SDC2, which control cytoskeletal reorganization indicative of HLC differentiation. Our data show that HLC down regulate genes involved in DNA replication machinery, particularly ORC and CDC45, indicative of their having exited the cell cycle. Prominent involvement of cell cycle and cellular assembly, hepatic system development, and lipid metabolism networks were all implicated in differentiated HLC. These data suggest that differentiated HLC express genes involved with pathways and networks of hepatic differentiation.
Encapsulation of HLC relative to naive hAEC shows marked upregulation of micro-RNA and collagen-associated genes. micro-RNA involved in encapsulated HLC regulated differentiation while collagen is secreted to establish the extracellular matrix. Cell-to-cell contact allows for deposition of collagen and cell-to-matrix interactions [49]. Encapsulation and differentiation are enhanced by increased expression of follistatin, which acts on the TGF-β superfamily that inhibits adipogenesis and myogenesis while it promotes epithelial cell differentiation [50]. Activation of stellate cells upregulates collagen-associated genes, which are important for deposition and interaction with the extracellular matrix [51]. Moreover, inhibition of RXR function by IL-1 activated membrane transporter genes, which are important for hepatic functions [52]. Involvement of the free radical scavenging and drug metabolism network in encapsulated HLC demonstrates two key aspects of hepatocytes. Drug metabolism leads to generation of free radical species, which needs to be absorbed by hepatocytes. This is done by increased glutathiones and oxidized glutathiones in differentiated HLC [6].
Our data show that differentiation is better achieved in 3D encapsulated cells compared to 2D differentiated cells. The encapsulated 3D environment allows cell-to-cell interactions as well as cell-to-matrix interactions. Cell-to-cell and cell-to-matrix interactions are important in establishing cell identity and cell polarity [53]. Out data show that 3D encapsulated HLC increased gene expression levels of collagen deposition, growth factors, and cell adhesion molecules. The functional capacity of encapsulated HLC is also enhanced through increased expression of drug and lipid metabolism networks. Additional functional capacity is enhanced by upregulation of RXR, which regulates the membrane transporter and lipid metabolism genes [52,54]. Despite the inability of HLC to modulate mtDNA copy number, the increased gene expression associated with hepatic function is modulated by increased expression of cell-to-cell and cell-to-matrix genes. The surprise finding was downregulation of inflammatory networks and pattern recognition pathways. Taken together, encapsulation of HLC not only drives differentiation but also enhances hepatic function and suppresses the inflammatory response. Thus, encapsulated HLC may serve as a good candidate for use in cell therapies for liver disease. Whereas differentiated HLC would be targeted by the host immune system by inducing a local inflammatory response, as induced by cytokines [55], encapsulated HLC may better serve the purpose of tissue function and repair through the secretion of hepatic factors. However, the local inflammatory response induced by cytokines most likely stimulates a response that could initiate repair but ensures that HLC do not contribute to a tumorigenic response. Indeed, this is likely to be partly modulated by the inability of HLC to increase their mtDNA copy number ensuring that they exhibit similar levels of mtDNA copy to other inflammatory cells arising from the spleen [16].
Conclusions
Our data show that hAEC can be differentiated into HLC by modulating gene expression and their functional capacity. However, they fail to modulate their mtDNA copy number during HLC differentiation. This, in turn, is controlled by DNA methylation at exon 2 of POLGA, which controls replication of mtDNA. MtDNA copy number can be modulated to an extent with DNA demethylation through the use of 5-aza, resulting in the expression of hepatic genes and also pluripotent genes. hAEC fail to replenish their mtDNA copy number after depletion of mtDNA. Interestingly, encapsulation of HLC results in enhanced hepatic gene expression and reduced inflammatory gene expression, although these cells are unable to modulate their mtDNA copy number. Our data show that there is an inherent block in replication of mtDNA copy number in hAEC during differentiation. However, encapsulation of HLC represents an alternative way of achieving differentiation that could augment tissue function and repair in a disease state.
Footnotes
Acknowledgment
We thank Dr. Wishva Herath for his expertise and advice in the generation of heatmaps from RNA-seq data.
Author Disclosure Statement
No competing financial interests exist.
References
Supplementary Material
Please find the following supplemental material available below.
For Open Access articles published under a Creative Commons License, all supplemental material carries the same license as the article it is associated with.
For non-Open Access articles published, all supplemental material carries a non-exclusive license, and permission requests for re-use of supplemental material or any part of supplemental material shall be sent directly to the copyright owner as specified in the copyright notice associated with the article.