
Abstract
The derivation of functional cardiomyocytes (CMs) from human embryonic stem cells (hESCs) represents a unique way of studying human cardiogenesis, including the development of CM subtypes. In this study, we investigated the development and organization of hESC-derived cardiomyocytes (hESC-CMs) and examined how the expression levels of CM subtypes correspond to human in vivo cardiogenesis. Beating clusters were used to determine cardiac differentiation, which was evaluated by the expression of cardiac genes GATA4 and TNNT2 and subcellular localization of GATA4 and NKX2.5. Sharp electrode recordings to determine action potentials (APs) further revealed spatial organization of intracluster CM subtypes (ie, complex clusters). Nodal-, atrial-, and ventricular-like AP morphologies were detected within distinct regions of complex clusters. The ability of different CM subtypes to self-organize was documented by immunohistochemical analyses and a differential spatial expression of β-III tubulin, myosin light chain 2v (MLC-2V), and α-smooth muscle actin (α-SMA). Furthermore, all hESC-CM subtypes formed expressed primary cilia, which are known to coordinate cellular signaling pathways during cardiomyogenesis and heart development. This study expands the foundation for studying regulatory pathways for spatial and temporal CM differentiation during human cardiogenesis.
Introduction
H
Previous studies detecting action potential (AP) morphologies in hESC-CM clusters suggested that different CM subtypes were found within the same culture dish, including nodal, atrial, and ventricular CMs [12,13]. However, the definition of CM subtypes as well as their intracluster organization is not well defined. AP morphology may depend on the seeding density of hESCs [14], and some studies have indicated that hESC-CMs continuously mature during culture, which may impact on AP subtypes [14,15].
The aim of the present study was to characterize different hESC-CM subtypes within individual clusters using a combined approach of immunohistochemistry (IHC), immunohistochemical (ICC), and electrophysiological methods. Furthermore, the presence of primary cilia, which critically regulate diverse signaling pathways during cardiomyogenesis, [10,16 –22], was evaluated on three different CM subtypes.
Materials and Methods
Propagation of hESCs
hESC lines used in the present study included LRB010 and LRB024 derived at the Laboratory of Reproductive Biology, University Hospital Copenhagen, Denmark [23]. The derivation and culture of hESCs from surplus donated embryos were approved by the Ethics Committee of the Capital Region in Denmark (H-KF-01-188/03). hESCs were cultured on a feeder layer of mitotically inactivated human foreskin fibroblasts (hFFs) [20] in a culture medium consisting of KnockOut™ DMEM, 15% KnockOut serum replacement, 0.1 mM β-mercaptoethanol, 1% nonessential amino acids (NEAA), 1% pennicillin/streptomyosin (Pen/Strep) 1% GlutaMAX (all from Gibco), 0.6% human serum albumin (CSL Behring), and 4 ng/mL basic fibroblast growth factor (bFGF; R&D Systems). The medium was changed every second or third day. Following treatment with Trypsin/EDTA, cells were passaged to new dishes at a ratio of 1:6 to 1:10 once per week.
Before differentiation, cells were passaged to Matrigel (BD Biosciences)-coated dishes for at least three passages. For feeder-free culture, the medium was supplemented with 50% hFF-conditioned medium consisting of IMDM (Gibco), 1% Pen/Strep, and 10% fetal bovine serum (FBS). hESCs were maintained in a humidified incubator at 37°C with 5% CO2 and 6.9% O2.
Differentiation of hESCs into CMs
CM differentiation was achieved by embryoid body (EB) formation as previously described with modifications [24 –26]. The day before differentiation (day −1), 0.9 × 10⁶ hESCs were seeded in a Matrigel-coated T25 flask. Twenty-four hours later (at day 0), EB formation was initiated (Fig. 1A) by seeding 5,000 hESCs in each well of a 96-well, untreated V-bottom plate (Thermo Scientific). EBs were allowed to form for 48 h in medium supplemented with 5 μM ROCK inhibitor (Y-27632; StemCell Technologies) and without bFGF. On day 2, oxygen tension was increased to atmospheric levels (≈21% O2) and the medium changed to 20% FBS differentiation medium (KnockOut DMEM with 20% FBS, 0.1 mM β-mercaptoethanol, 1% NEAA, 1% Pen/Strep, and 1% GlutaMAX, all from Gibco). At day 6, EBs were gently aspirated and replated to a 96-well U-bottom plate (Nuclon Delta surface; Thermo Scientific) after washing. From day 9 and onward, cells were inspected every 3–4 days using an EVOS® digital inverted microscope to assess the presence of beating cell clusters (ie, CM clusters). On day 16, the FBS content was lowered to 5% for the remaining period of differentiation. For AP recordings, isolated CM clusters were replated to gelatin-coated Petri dishes.

Characteristics of the cell culture during differentiation of hESCs to cardiomyocytes.
Real-time quantitative RT-PCR
Three to six samples of cells and CM clusters were collected at various time points throughout the differentiation process. Samples were analyzed by real-time quantitative polymerase chain reaction (qPCR), as previously described [27]. Briefly, total mRNA was extracted and purified using the RNeasy mini kit (Qiagen) with additional on-column DNase treatment. cDNA was synthesized from extracted RNA using the Omniscript RT kit (Qiagen) according to the manufacturer's instructions. qPCR samples were prepared using the SYBR Green I Master kit (Roche) with primers designed for the following genes: GABRB3, POU5F1, DKK1, GATA4, and TNNT2 (TAG Copenhagen) (Supplementary Table S1; Supplementary Data are available online at
Fixation, embedding, and sectioning of CM clusters for immunohistochemistry
CM clusters isolated by cutting carefully around the beating tissue using 23 gauge needles were embedded in 4% agar and fixed in Bouin's solution. Sections were prepared for histology, immunofluorescence microscopy, and bright-field immunohistochemistry (IHC) by cutting 5-μm sections using standard histological methods. Sections from two human embryos, including the early developing heart, were processed in parallel [obtained from The Human foetal Biobank, Institute of Cellular and Molecular Medicine (ICMM) at the University of Copenhagen].
Bright-field immunohistochemistry
Sections were treated and endogenous peroxidase quenched using hydrogen peroxide and nonspecific binding was inhibited by incubation with blocking buffer (ChemMate antibody diluent S2022; Dako-Cytomation, Glostrup, Denmark) or 0.2% casein (C-7078; Sigma). Subsequently, primary antibodies diluted in blocking buffer were incubated overnight (4°C) (Supplementary Table S1). The REAL EnVision Detection System (Peroxidase/DAB+rabbit-/mouse, code K5007; DakoCytomation) was used for detecting primary antibodies using manufacturer's instructions. Sections were counterstained with Mayer's hematoxylin.
Immunofluorescence microscopy analysis
Sections for IHC were exposed to heat-mediated antigen retrieval for optimization of IHC reactions and to Dako REAL™ Antibody Diluent for inhibition of unspecific binding of antibodies as described [14]. For ICC analyses, CM clusters were fixed in either ice-cold MeOH or 4% PFA, and PFA-fixed cells were subsequently permeabilized with 2% Triton X-100 in phosphate-buffered saline (PBS) and blocked with 2% bovine serum albumin in PBS, as previously described [24]. For both ICC and IHC analyses, cluster samples were left in primary antibodies overnight. DAPI and secondary Alexa Flour® antibodies were added and the samples were mounted to coverslips with Dako Fluoromount. Images were captured on a fully motorized Olympus BX63 upright microscope with a DP72 color, 12.8-megapixel 4,140 × 3,096-resolution camera, and differential interference contrast. Specifications for all antibodies can be found in Supplementary Table S1.
AP recordings
APs were measured with sharp electrodes using an Axon 700B amplifier (Molecular Devices) in the current clamp configuration and with compensated pipette capacitance. Data were digitized at 20 kHz and filtered at 10 kHz by a Digidata 1440 digitizer (Molecular Devices) and recorded using pClamp 10 software (Molecular Devices). The resistance of the electrodes was 20–50 MΩ when filled with a 3 M KCl solution. CM clusters were bathed in Tyrode's solution (37°C) comprising 140 mM NaCl, 5.4 mM KCl, 1 mM MgCl2, 1.8 mM CaCl2, 10 mM HEPES, 10 mM glucose, and pH 7.4. The AP measurements were performed on spontaneously beating clusters, resulting in variation of the rate during recordings. CM subtypes were determined by the spatial temporal shape of the APs [28,29]. The nodal-like AP was characterized by having an evident phase 4 and a slower upstroke velocity than ventricular- and atrial-like subtypes. Ventricular-like APs exhibit a plateau phase and atrial-like APs have more triangular APs and less of a plateau phase. From these general AP characteristics, the following criteria were used to distinguish between AP subtypes; embryonic nodal-like APs: APD20/APD70 > 0.35 and upstroke velocity <25 V/s, embryonic atrial-like APs: APD20/APD70 < 0.35 and upstroke velocity >25 V/s, and embryonic ventricular-like APs: APD20/APD70 > 0.35 and upstroke velocity >25 V/s. APs were mapped in different regions of complex clusters with visible compartmentalization and in simple spherical clusters. Each visually distinctive area was recorded between one and five times. APs were analyzed using pClamp 10 and Labchart 8 (AD Instruments), and AP durations were measured from a starting point of 50% of the upstroke. APs with amplitudes less than 30 mV were not included in the analysis. A mean was calculated from all values generated for each visually distinctive area.
Flow cytometry
Flow cytometry was performed with the monoclonal antibody, signal regulatory protein alpha (SIRPA), a CM-specific marker, or with the mitochondrial dye tetramethylrhodamine methyl ester (TMRM). The differentiated ESCs were dissociated using TrypLE™ Express (12605010; Thermo Fisher Scientific) and incubated with either PE/Cy7-conjugated SIRPA monoclonal antibody (Cat. No. 323807; BioLegend) or TMRM dye (Cat. No. T668; Thermo Fisher Scientific). After 45 min and 30 min of incubation, respectively, cells were washed three times with cold DPBS and resuspended in 1% paraformaldehyde at a density of 1 × 10⁶ cells/mL. Subsequently, they were analyzed by the FACSArray Bioanalyzer (BD). Unlabeled samples were used as controls for gating. Data were analyzed using the FlowJo software (version 10.0).
Results
Characterization of CM cluster formation
Formation of CMs was assessed by the morphology of differentiating cells, the efficacy of CM cluster formation, and the pace of contraction, as well as the expression profile of genes for pluripotency and cardiomyogenesis during differentiation (Fig. 1A). By day 2, EBs of similar size had formed (Fig. 1B). Cells developed with an overall similar morphology from well to well during early differentiation, while the morphology of fully differentiated CM clusters varied considerably (Fig. 1B). Some clusters had a spherical appearance with only one contracting area (ie, simple clusters), while others had a more complex organization with delayed, but coordinated, contractions in visually distinct, but connected, areas (ie, complex clusters).
CM clusters emerged from day 9 onward, with most new CM clusters observed before day 16. However, new CM clusters continued to develop throughout the 30-day culture period. The relative cumulative percentage of wells with CM clusters per setup is shown in Fig. 1C showing that after 30 days, 17%–53% of all wells in a setup showed beating structures. Of the two hESC-lines used, LRB010 generally showed a higher efficiency than the LRB024. The fraction of CMs in all cells from a well with a beating cluster was estimated to be 5% using the CM-specific surface marker SIRPA and to be 10% when using the mitochondrial dye TMRM (Fig. 1D).
The spontaneous beating rate increased during the culture period (P < 0.05) for cell line LRB010 (Fig. 1E), while the rate nonsignificantly decreased for LRB024 (P = 0.07).
The hESC pluripotency consensus genes GABRB3 and POUF51 were both expressed in hESC cultures before differentiation and significantly declined as differentiation progressed (both P < 0.01, 8- and 6-fold, respectively) (Fig. 1F). The expression of the CM progenitor gene DKK1 (encoding Dickkopf-related protein 1) and the early CM transcription factor gene GATA4 (encoding GATA-binding protein 4) increased significantly during differentiation (P < 0.01) [30]. GATA4 expression was increased more than 64-fold at day 9 compared with the expression level at EB formation (Fig. 1F) and subsequently decreased to a stable level being around 16-fold higher than at EB formation. Expression of the CM-specific gene TNNT2 (encoding troponin T) increased 32-fold from EB formation to day 30 (P < 0.01, Fig. 1F), with some fluctuations primarily reflecting one outlier. GATA4 (P < 0.01) and TNNT2 (P < 0.01) expression was significantly higher in beating clusters compared with nonbeating clusters, whereas GABRB3, POU5F1, and DKK1 remained similar.
Properties of hESC-derived cardiomyocytes
The CM phenotype of beating clusters was evaluated by the expression of known CM markers and by the ability to generate APs with known electrophysiological characteristics. Furthermore, the presence of primary cilia was evaluated.
CM transcription factors, GATA4 and NKX2.5, costained in the nucleus of individual CM cells (Fig. 2A). By ICC analysis, the CMs also stained positive for α-actinin, a structural component of the smooth muscle and skeletal sarcomeres. At high magnification, localization of α-actinin in lines representing the z-lines is visible not only between the single CMs but also as a sheet covering multiple adjacent cells, demonstrating some level of organization within the CM clusters (Fig. 2B). Furthermore, the primary cilium-specific protein ARL13B was expressed in hESC-derived clusters of CMs positive for GATA4 (Fig. 2C).

Characteristics of CMs derived from hESCs. Immunofluorescence analysis of a CM cluster derived from hESCs 30 days after EB formation.
AP recordings from 19 areas in 14 CM clusters were included in this study. For each recording, the AP subtype was determined. Representative traces for the three AP subtypes found within one complex cluster are presented in Fig. 3C and D. The distributions of the CM subtypes based on APs are presented in Fig. 3E. Relevant AP parameters for each of the three CM subtypes are listed in Table 1, and in Fig. 3B, selected AP parameters are visualized. The APs proved shorter than typical APs of adult human CMs and were more comparable with APs of 7–9 week embryos [31]. We found the following distribution of AP subtypes: 47% nodal-like, 32% atrial-like, and 21% ventricular-like, specifically we found two clusters with all three subtypes, one cluster with both atrial- and ventricular-like APs, and one cluster with both sinus- and ventricular-like APs.
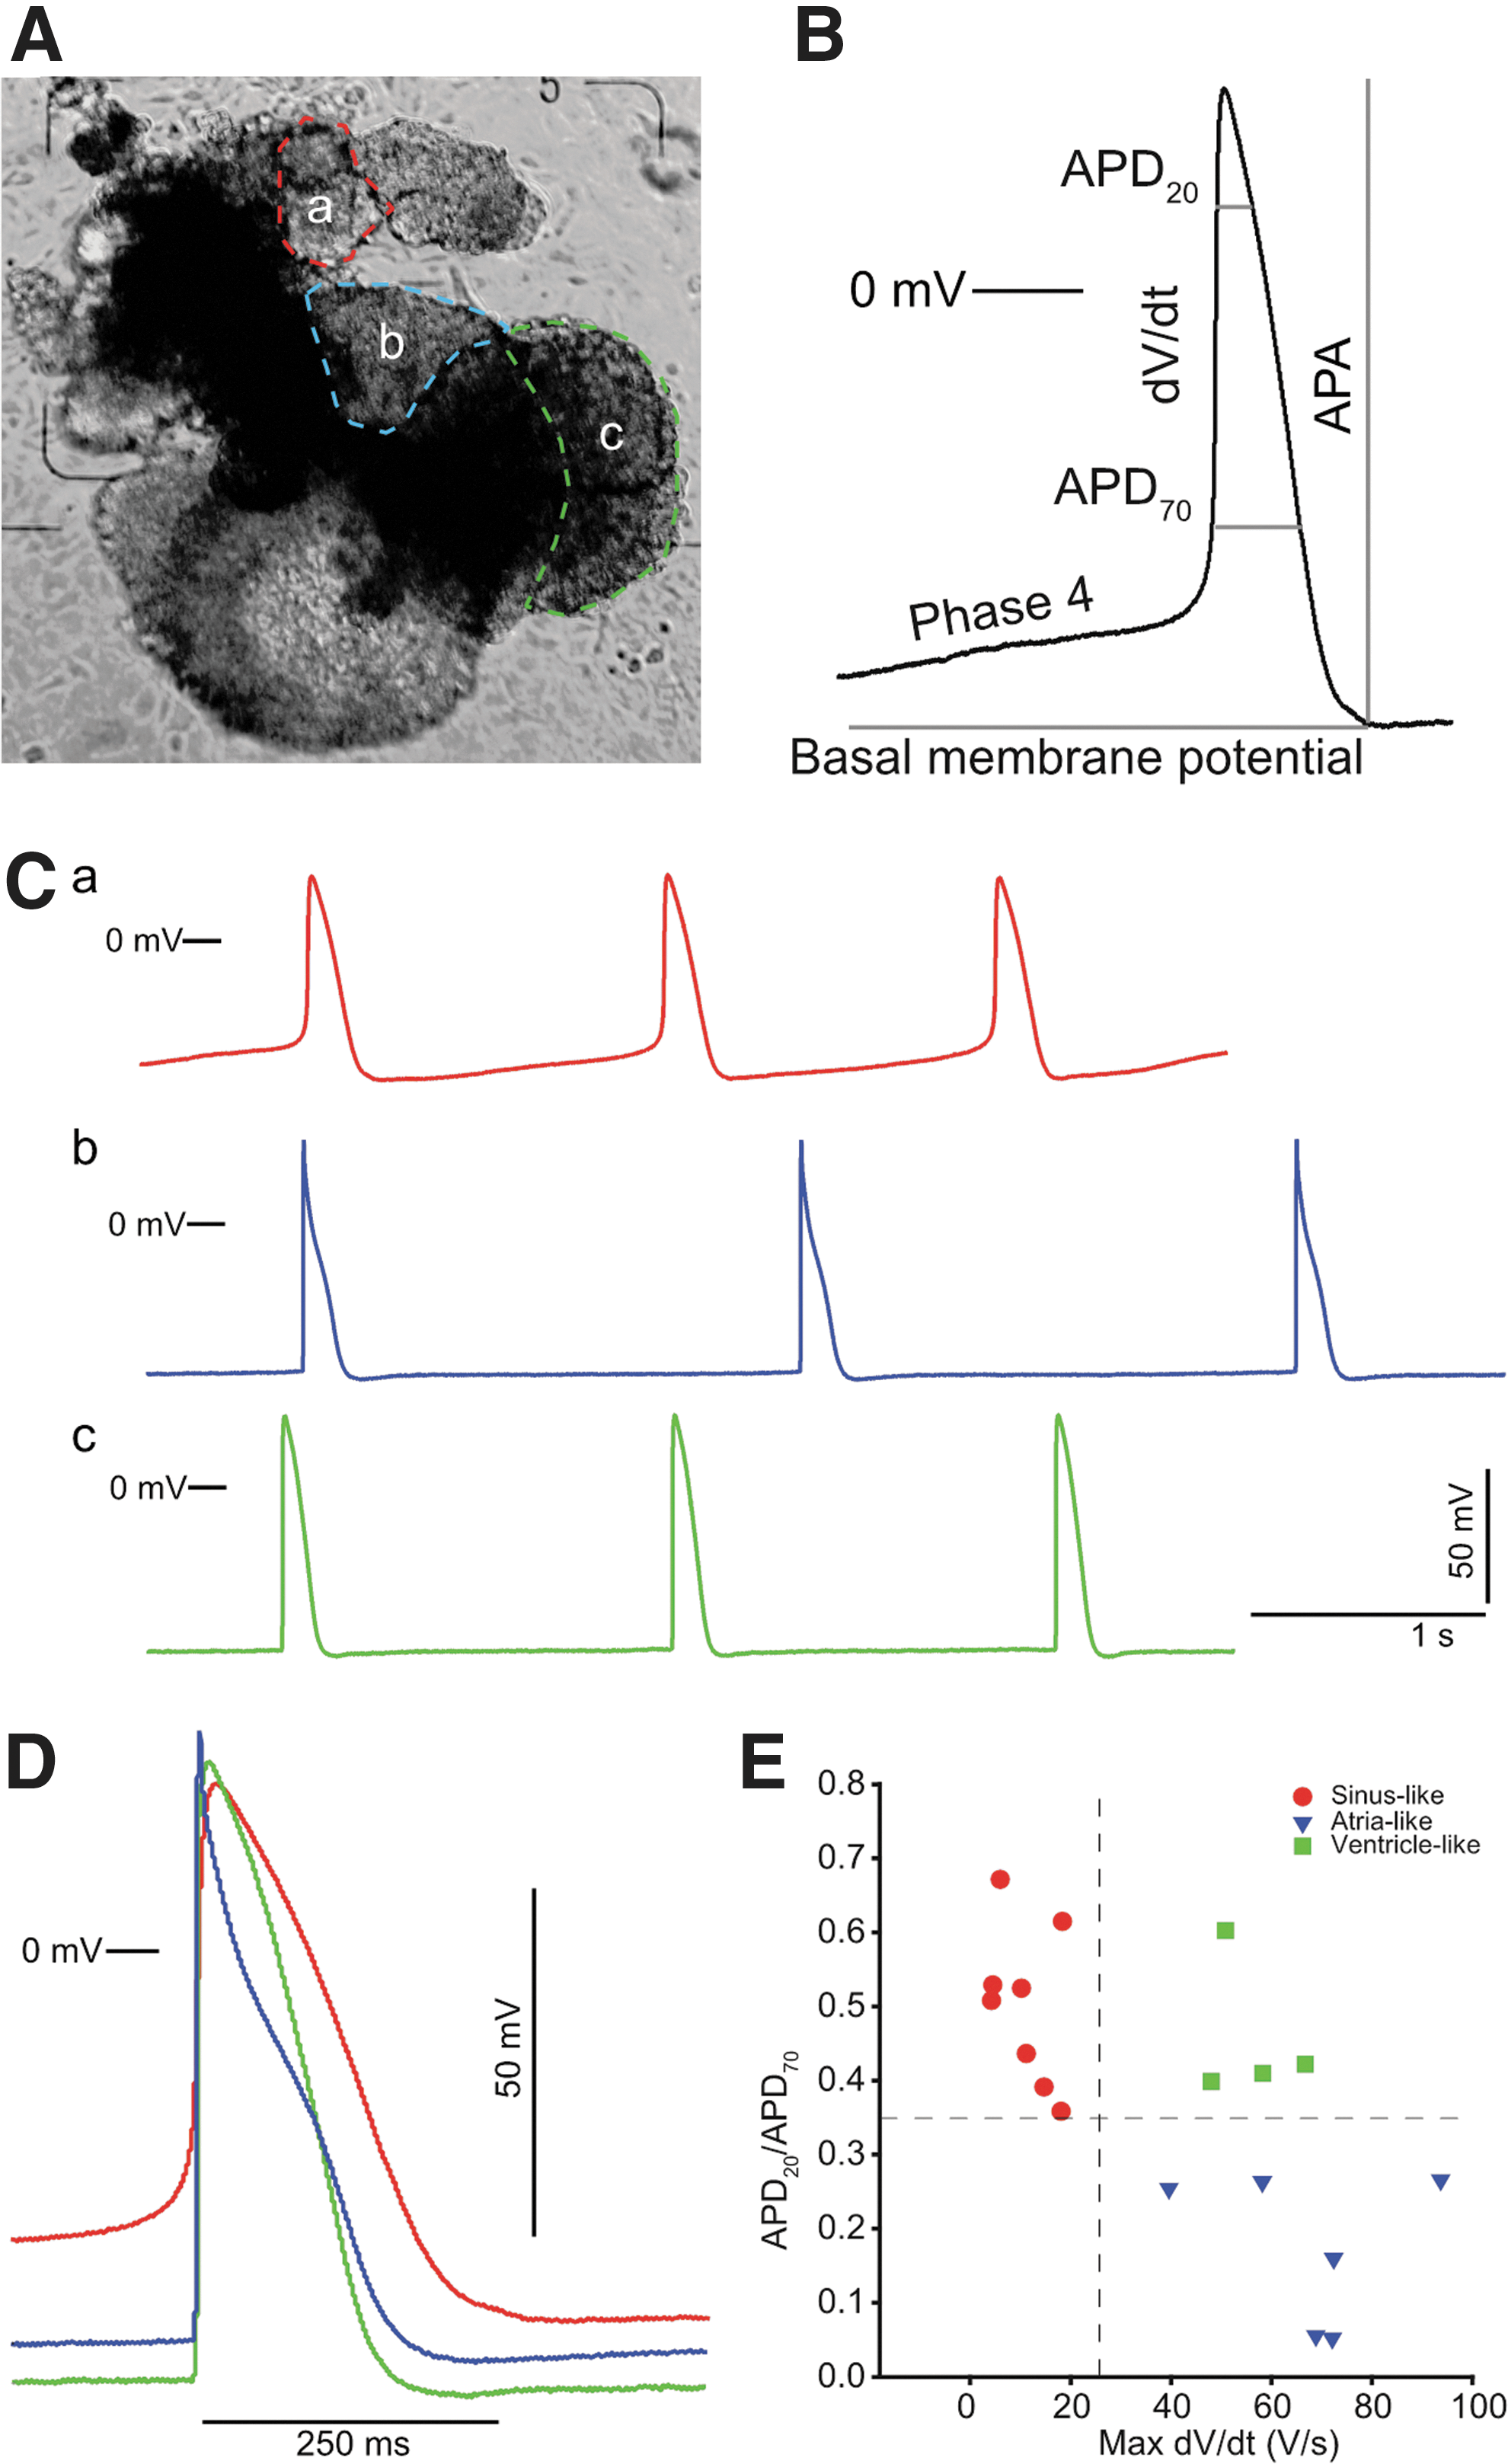
Examples of AP recordings from a complex CM cluster. Several recordings were made using a sharp electrode in different regions of a beating CM cluster after differentiation from hESCs.
Parameters were selected to exemplify the differences between embryonic nodal-, ventricular-, or atrial-like APs. APs were categorized into being embryonic nodal-like, embryonic ventricular-like, or embryonic atrial-like based on the following criteria: nodal-like: having an APD20/APD70 ratio >0.35 and dV/dT max <25 V/s; atrial-like: APD20/APD70 ratio <0.35 and dV/dT max >25 V/s; and ventricular-like: APD20/APD70 ratio >0.35 and dV/dT max >25 V/s.
AP, action potential; APA, AP amplitude; APD20, action potential duration after 20% repolarization; APD70, action potential duration after 70% repolarization; BMP, basal membrane potential; Cycle length, the duration between APs; Max dV/dT, maximum upstroke velocity; Phase 4, the slope of phase 4.
Following the identification of ventricular-, nodal-, and atrial-like CM subtypes, and the spatial localization of these subtypes within seven simple and seven complex clusters, the clusters were evaluated. Whereas little variation in AP subtypes was observed within simple clusters, four of seven clusters with complex structures displayed a high level of subtype variation as evidenced by their AP morphology (Fig. 3). In two of the complex clusters, APs were found in regions without phase 4 depolarization, indicating that neighboring CMs paced these regions. This is exemplified in the cluster in Fig. 3A, where distinct regions with phase 4 depolarizations (nodal-like) were observed as well as distinct regions with no autonomous rhythmic activity, having atrial-like or ventricular-like APs. APs were recorded at several locations in each of the different beating areas (Fig. 3A) as well as in nonbeating areas. The APs within each distinct area were similar, with only a rate-dependent difference in AP duration. Representative recordings from three distinct areas of a single cluster are shown in Fig. 3C and an overlay of the three different AP subtypes is shown in Fig. 3D.
Spatial arrangement of CM subtypes based on protein distribution
The spatial arrangement of CM subtypes was further examined by IHC analyses with antibodies raised against subtype-specific proteins (Fig. 4A, B). The myosin light chain 2a (MLC-2A) is only present in atrium cells; myosin light chain 2v (MLC-2V) is exclusively expressed in ventricular cells; β-III tubulin is a neuron-specific protein; and α-smooth muscle actin (α-SMA) identifies CM progenitor cells [32 –37].

Immunohistochemical staining of hESC-derived CM clusters.
In simple CM clusters, α-SMA and MLC-2V were expressed in most cells, although some variation in expression intensity was observed as judged by IHC analysis (Fig. 4A). Thus, α-SMA seemed to be most prominently expressed at the center of the clusters, whereas MLC-2V expression was most prominent in cells lining the periphery. In contrast, β-III tubulin expression was confined to distinct and minor populations of cells at different areas of the clusters, including the central area close to α-SMA-positive cells surrounding a tubular-like structure (Fig. 4A). No MLC-2A expression was observed in simple clusters.
IHC analysis of complex CM clusters revealed a higher expression level as well as a more intricate expression pattern compared with the simple clusters (Fig. 4B). In the complex clusters, MLC-2A-positive cells were localized in two regions partly overlapping with densely α-SMA-positive areas, and MLC-2V was expressed in most areas of the clusters, although at different intensities. β-III tubulin displayed an expression pattern similar to that observed in the simple clusters with positive cells located in several areas consisting of a few cells.
Immunofluorescence microscopy was also used to study expression patterns of α-SMA and MLC-2V in complex clusters. Atrial and ventricular CM subtype markers each were intensively expressed in defined groups of cells that often were adjacent to groups of cells positive for one of the other CM markers (Fig. 4C). Finally, the primary cilium-specific protein, acetylated tubulin, was expressed in cells expressing either α-SMA or MLC-2V (Fig. 4D, E), demonstrating that primary cilia are expressed in atrial and ventricular CM subtypes. Assuming that β III tubulin expression reflected nodal CMs, primary cilia were also expressed on nodal CMs (Fig. 4).
Localization of CM subtype-specific proteins in human embryonic tissue
To validate antibody specificity and localization patterns in the CM clusters, IHC analysis was carried out in two human embryos (Fig. 5). The tissue was from a transverse section of the torso region, including heart tissue, of a human embryo 7 + 0 weeks postconception (w-pc) and the other was an embryo (4 + 2 w-pc) where outflow tract tissue was present. β-III tubulin expression was confined to the vagus nerve and to several small regions of the upper part of the atrium, potentially representing the sinoatrial area (Fig. 5A). MLC-2V was expressed in the ventricular myocardium with less intensity in the atrium (7 + 0 w-pc) and outflow tract tissue (4 + 2 w-pc) (Fig. 5B, E). α-SMA-positive cells were located throughout both outflow tract tissue (4 + 2 w-pc) and heart tissue of the 7 + 0 w-pc embryo (Fig. 5C, F). Furthermore, densely α-SMA-positive areas were located in regions of the atria and in smooth muscle tissue. No MLC-2A expression was detected in the embryonic tissue (Fig. 5D, G).

Transverse sections through the thorax region of two human embryos, 7 weeks p.c. (
Discussion
This study describes how distinct hESC-derived CM subtypes develop and become spatially organized into specific cellular compartments during culture. At least three different CM subtypes simultaneously developed based on differential expression of cardiac markers and AP morphologies. We showed the presence of primary cilia on hESC-CMs on three discrete CM subtypes. Additionally, the presence of β-III tubulin-positive cell populations both within hESC-CMs and in human embryonic atrial tissue has not been reported before and warrants further investigations to evaluate whether these cells represent nodal CMs. Furthermore, we confirm and expand previous findings that hESC-CMs express cardiac transcription factors, GATA4 and NKX2.5, and have sarcomere organization as well as CM electrophysiological characteristics [36]. Collectively, these results contribute with new insights of the intricate process of human CM specification.
The organization of hESC-CMs into spatially discrete areas has, to our knowledge, not previously been reported in detail. In a recent study, Zhu et al. grouped APs into two or three subtypes based on their shape, captured using automated optical mapping of APs, and found CM clusters with areas of two or three different AP subpopulations [38]. In line with these observations, we suggest that the hESC-CM APs can be divided into three subtypes; nodal-, atrial-, and ventricular-like due to differences in the APD20/APD70 ratio and the AP upstroke velocity. An early repolarization indicated by a low APD20/APD70 ratio is characteristic for embryonal atrial CMs [31], whereas embryonal ventricular or nodal cells that do not have an early repolarization and nodal cells are known for their slow AP upstroke due to depolarization mainly carried by Ca2+ influx. α-SMA and MLC-2V were associated with atrial and ventricular cells, respectively, which was confirmed by the observed atrial- or ventricular-like AP subtypes. The colocalization between β-III tubulin expression and nodal cells warrants further investigations to determine whether β-III tubulin is a new marker of nodal cells. Furthermore, the presence of complex clusters with separate regions of nodal-like autonomous rhythmic activity and adjacent regions of nonautonomous paced atrial- and ventricular-like APs (Fig. 3) suggests an organized differentiation in complex clusters. Similarly, one region of a CM cluster would stop beating upon physical separation from an adjacent region, suggesting that the region was paced by the adjacent region (not shown), confirming a previous murine study [39].
Immunofluorescence microscopy and IHC analysis revealed that β-III tubulin, MLC-2V, α-SMA, and MLC-2A were expressed in restricted areas in complex hESC-CM clusters (Fig. 4A–C), suggesting the presence of at least three different CM cell populations, which were spatially organized; first, a nodal cell population of β-III tubulin-positive cells; second, an immature CM population of α-SMA-positive cells; and third, a more mature and/or ventricular CM population positive for MLC-2V. Since MLC-2A staining was only observed in one of three clusters, it was not possible to clearly define an atrial subtype based on the present IHC analysis alone. Therefore, the present study confirms and expands a previously study where it was reported that hiPSC-derived CMs self-organize into spatially confined areas following culture in a geometric confinement [40]. The CMs (CTNT, MHC, and α-actinin-positive cells) arranged centrally with cardiac fibroblasts (α-SMA positive) in the periphery of the cultures.
Within simple clusters, the characteristics of APs varied little, while the difference between clusters was considerable, as previously reported [12,28,38,41]. In the present study, the combined data on APs and IHC showed that β-III tubulin was present in all simple CM clusters (Fig. 4A) examined and it is suggested that the β-III tubulin activity is associated with the spontaneous beating ability. The β-III tubulin staining in hESC-CMs and the staining in human embryonic upper-atrial tissue (7 + 0 w-pc) were similar with small groups of cells present in specific areas (Figs. 4A–D and 5A). This observation indicated that β-III tubulin expression may be associated with the pacemaking cell population, although we were unable to determine whether the β-III tubulin-positive cells represent the actual nodal CMs or neurons in close contact with nodal CMs, which has been described for murine pluripotent cell-derived CM-neuron connections [42]. Recent data have now shown that several key transcription factors, including SHOX2 and TBX3, specify the nodal lineage as NKX2-5-negative progenitors [6]. Furthermore, a differentiation protocol involving stage-specific activation of the bone morphogenic protein and retinoic acid signaling pathways combined with inhibition of fibroblast growth factor signaling specifically induces the formation of NKX2-5-negative cells. This allowed a detailed characterization of these nodal cells and showed that at best, β-III tubulin is one among several markers for the nodal CMs both in vivo and in connection with hESC/induced pluripotent stem cells (iPSC) [6]. In adult human heart tissue, MLC-2V and MLC-2A are specific for ventricular and atrial tissues, respectively, but the embryonic spatiotemporal distribution is unclear [34,37]. One study found both MLC-2A and MLC-2V mRNA expression in human developing hearts with MLC-2V-specific expression in ventricular tissue, while MLC-2A was found in both atria and ventricles (7, 12, and 15 w-pc) [34]. Two other studies, including human fetal heart tissue, concluded that MLC-2A and MLC-2V were both expressed, but independently regulated [43,44].
In the present study, MLC-2V was shown to be variably expressed in a large proportion of cells in hESC-CMs (Fig. 4A–C), while both atria and ventricles showed expression in human embryonic tissue as well as in outflow tract tissue (Fig. 5B, E). This suggests that the CM subtype may not be well defined at this stage of development and may depend on the level of MLC-2V expression. Expression of MLC-2A was only detected in one of three CM clusters (Fig. 4A–C) and was not observed in embryonic tissue (Fig. 5D, G), suggesting that the MLC-2A is turned on at a later developmental stage than the embryonic tissue examined. However, this contrasts with a recent finding that found MLC-2A expression to disappear over time in cultures of iPSC CMs [8], suggesting that regulation of MLC-2A expression is still unclear in CM specification.
The distribution of α-SMA in human hearts has, to our knowledge, not been examined before. In mice, α-SMA is the actin form found during the first stages of CM specification and is substituted by α-SKA and α-CAA. In human CMs, α-SMA has been used in studies of hiPSC differentiation to identify immature CMs [32,45]. We found that α-SMA was expressed in most cells of hESC-CMs with varying intensities of expression and overlapping with both MLC-2V (Fig. 4A–C) and MLC-2A-positive cells (Fig. 4B). A similar distribution was found in human embryonic tissue that also expressed α-SMA in most heart cells, but had a higher intensity in specific areas around the valves (Fig. 5C, F). Our results therefore support and expand previous findings with results from human embryonic tissue. Collectively, the intensity of a-SMA expression showed a characteristic pattern that might define distinct cardiac tissues.
The present study demonstrated the presence of primary cilia on hESC-CMs (Figs. 2A and 4E), as previously reported [13]. Furthermore, cilia were found on all three hESC-CM subtypes (Fig. 4D, E) [13], confirming the important functions of cilia during cardiogenesis [10,46,47). Defects in primary cilia are linked to a number of congenital heart diseases [17,18,20,47,48]. Our group has previously established that primary cilia are formed on undifferentiated hESCs and that they are associated with several developmentally important signaling pathways, such as in TGF-β, Hedgehog, PDGFRα, and WNT pathways, which critically regulate heart development [10,27,49,50]. Furthermore, we previously showed that formation of primary cilia is required for in vitro cardiomyogenesis of P19.CL6 mouse stem cells and that differentiation of hESCs and P19.CL6 cells into CMs was associated with ciliary coordination of TGF-β and Hedgehog signaling [16,17]. Therefore, further studies are warranted to evaluate whether similar signaling pathways operate in hESC-CMs that potentially may help to understand human development of specific CM tissues.
Staining against α-actinin revealed sarcomere organization in CMs and, together with nucleus localization of both GATA4 and NKX2.5, confirms that the differentiated cells are CMs [36,51]. The CMs further have cardiac-like AP characteristics (Fig. 3) in agreement with earlier reports on stem cell-derived CMs [28,52]. The AP shape may reflect the immature state of the CM, similarly to what has been described for CMs differentiating from pluripotent cells [50,53]. The number of CMs in the cultures was estimated to be 5%–10% of all cells in a culture. When the beating aggregates were carefully dissected out, the majority of cells were CMs based on the markers GATA4, NKX2.5, and MLC-2V.
The observed gene expression profiles during cell culture confirmed gradual differentiation from pluripotent hESCs to CMs (Fig. 1F). Cells at day zero expressed pluripotency genes, and cells at day 30 expressed primarily cardiac genes. Beating tissue had a higher expression of GATA4 and TNNT2 compared with nonbeating tissue, which confirms and expands a previous study suggesting that the presence of beating tissue indicates increased CM specification [54].
In this study, we found differences in the temporal differentiation process, both when using different stem cell lines (ie, LRB010 and LRB 024) and when using the same stem cell line at different time points (ie, LRB010) with differences in the GATA4 gene. In contrast, expression of TNNT2 and of stem cell markers, GABRB3 and POU5F1, was comparable between experiments. This highlights that although hESC cultures are presumably similar based on pluripotency markers, they may express differences in CM differentiation ability, as previously reported [12,23,41,55].
The differentiation protocol used in this study was less efficient compared with recently published methods to derive CMs, which were not available when the present studies were conducted [6 –8], but the presence of complex cluster allowed the present studies to be conducted—to what extent the reduced oxygen tension during differentiation was of importance was not systematically evaluated. In this study, we have selected five markers to differentiate between CM subtypes, but many other markers could also have been used to distinguish between subtypes (eg, TBX3, IRX4, IRX5, HAND1, COUP-TFII, and NPPA [56,57]). In a recent study, Chen et al. found MLC2a to be unspecific for hiPSC-derived atrial CMs that costained cells with MLC2v-, SLN-, and SHOX2 promoter activity, which were claimed to be ventricular-, atrial-, and nodal-like cells, respectively. They also found expression of MLC2a in both MLC2v- and SLN-positive cells by RT-PCR (7). However, it is not clear whether the MLC2a staining in their study actually overlaps the MLC2v staining. Differences between our study and their study could be explained by the developmental stage as MLC2v and MLC2a are ventricle and atria specific in adult CMs, respectively, and we found no MLC2a expression in the embryonal heart. Furthermore, to confirm whether beta-III tubulin is useful as a nodal-like cell marker, future studies should investigate coexpression with SHOX2.
Collectively, this study demonstrates that distinct hESC-derived CM subtypes develop and become spatially organized into specific cellular compartments during culture. Three distinct CM subtypes possess primary cilia that may be of importance for CM differentiation and maturation and the observed early specialization in distinct areas of beating clusters.
Footnotes
Acknowledgments
The authors thank technician Marjo Westerdahl for help with cultures of hESCs. This work was supported by the Faculty of Health Sciences, University of Copenhagen (M.L.V., K.K.), the University of Copenhagen Excellence Programme for Interdisciplinary Research (2016 funds) (S.T.C.), and the Danish Council for Independent Research (1331-00254) (S.T.C.).
Author Disclosure Statement
No competing financial interests exist.
References
Supplementary Material
Please find the following supplemental material available below.
For Open Access articles published under a Creative Commons License, all supplemental material carries the same license as the article it is associated with.
For non-Open Access articles published, all supplemental material carries a non-exclusive license, and permission requests for re-use of supplemental material or any part of supplemental material shall be sent directly to the copyright owner as specified in the copyright notice associated with the article.