
Abstract
In the quest to unravel its functional significance, neuroglobin (Ngb), a brain-specific neuroprotective protein, has recently been proposed as an actor in neurodevelopment. As neural stem cells (NSCs) are fundamental during brain development, the present study aimed at investigating the role of Ngb in the growth and proliferation of NSCs by comparing an Ngb-floxed (Ngbfl-)NSC line, equivalent to the wild-type cellular situation, with an in-house created Ngb knockout (NgbKO-)NSC line. NgbKO-NSCs were characterized by an increased growth and proliferation capacity in vitro, supported by RNA sequencing and western blot results reporting the downregulation of Cdkn1a and the upregulation of Cdk6, both enhancing the cell cycle. Based on additional gene ontology enrichment and pathway analyses, we hypothesize that the loss of Ngb affects multiple cellular signaling pathways with the most important being the Akt-Tp53 axis.
Introduction
A
Although the molecular mechanism behind Ngb's neuroprotective character still remains to be elucidated, various hypotheses have been proposed. These molecular actions include enhancing O2 supply to the mitochondria of metabolically active neurons, preventing apoptosis, and scavenging reactive oxygen and nitrogen species and, thereby, reducing oxidative stress [2].
More recently, Ngb gained growing interest in the field of neurodevelopment. While early stages of mouse brain development are characterized by low-level Ngb mRNA and protein expression, Ngb levels steadily rise from the late prenatal days to brain maturing newborns and even further to young adults, presenting the protein as a potential key player during brain development [9,10]. In addition, Ngb coexpression with Sox-3 and Sox-4, involved in the preservation of progenitor neuronal cells, in the neurogenic subventricular zone in adult rat brain supports a potential role of Ngb in neural stem cell (NSC) migration, proliferation, and neurogenesis [11 –13].
Recent molecular evidence even states an interaction of Ngb with phosphatase and tensin homolog (Pten) and Akt which leads to prominent effects in the Pten/PI3K/Akt signaling cascade suggesting a role of Ngb in neuritogenesis and neuronal development in general [14].
NSCs are of great value to investigate the role of Ngb in different stages of neurodevelopment. In the present study, we first generated an Ngb-floxed (Ngbfl) mouse model by introducing loxP sites into the introns flanking exon 2 and 3 of the Ngb locus. From this mouse model, we cultured embryonic brain-derived NSCs (Ngbfl-NSCs), followed by in vitro Cre-lox recombination to obtain an Ngb knockout (NgbKO-)NSC line. A comparative in vitro study combined with transcriptome analysis of both Ngbfl-NSC and NgbKO-NSC lines was performed and validated on the protein level, thereby identifying Ngb-associated up- and downregulation of cell cycle proteins.
Materials and Methods
Mice
The Ngb knockout model was created using Cre-lox recombination. The development of the Ngb-floxed mouse model, containing two loxP recombination sites flanking critical regions of the Ngb gene, was performed by GenOway under the project no. genOway/EV/MOE-1-NGB/120307.
In brief, using 129Sv/Pas embryonic stem (ES) cell DNA, a targeting vector consisting of 8.9 kb of mouse genomic DNA (gDNA) containing the entire Ngb gene locus supplemented with a loxP site in intron 1 and a validated FRT-neomycin-FRT-loxP cassette in intron 3 was constructed in our laboratory. Next, after transfection using standard electroporation procedures, the linearized targeting construct was introduced into the mouse genome by homologous recombination in 129Sv/Pas ES cells (GenOway). Recombinant clones resistant to G418 were validated by genomic PCR and Southern blot.
To obtain chimeric mice, positive selected recombinant ES cells were injected into C57BL/6 recipient blastocysts, isolated from pregnant C57BL/6 females. Thereafter, chimeric mice were mated with C57BL/6 mice and subsequently with C57BL/6 Flp mice (GenOway) to allow germ line excision of the neomycin selection cassette. Speed congenic backcrossing to C57BL/6 was performed. The Max-Bax single nucleotide polymorphism panel (Charles River) was used to screen animals with the highest percentage of recipient versus donor strain DNA. After 5 crossings, the background was 99.73% C57BL/6. These mice are defined as Ngb-floxed mice (Ngbfl).
All mice were bred in the animal facility of the University of Antwerp. Animals were housed in a temperature controlled room with day–night cycle (12/12) and free access to food and water. All experiments were conducted in compliance with the guidelines from Directive 2010/63/EU of the European Parliament on the protection of animals used for scientific purposes, and all experiments were approved by the Ethics Committee of the University of Antwerp.
NSC cultures
NSCs were cultured from the embryonic brain of a male Ngbfl embryo of 14–16 days postcoitus following a protocol previously described [15] with minor modifications [16]. Briefly, the embryonic brain was enzymatically dissociated using a 0.2% collagenase A (Roche)/DNase-I (1000 Kunitz/50 mL; Sigma) solution in phosphate-buffered saline (PBS) for 2 h at 37°C in a shaking water bath.
The cell population obtained was then resuspended in 10 mL neural expansion medium (NEM), consisting of Neurobasal A medium (Invitrogen) supplemented with 10 ng/mL epidermal growth factor (EGF; ImmunoTools), 10 ng/mL human fibroblast growth factor-2 (hFGF-2; ImmunoTools), 100 U/mL penicillin (Invitrogen), 100 mg/mL streptomycin (Invitrogen), 0.5 μg/mL amphotericin B (Invitrogen), and 1% modified N2 supplement. The modified N2 supplement consisted of DMEM/F12 medium (Gibco) supplemented with 7.5 mg/mL bovine serum albumin (BSA; Invitrogen), 2.5 mg/mL insulin (Sigma), 2 mg/mL apo-transferrin (Sigma), 0.518 μg/mL sodium selenite (Sigma), 1.6 mg/mL putrescine (Sigma), and 2 μg/mL progesterone (Sigma).
Cells were plated in a T25 culture flask to obtain a neurosphere (NSPH) population. Next, NSPHs were dissociated using accutase (Sigma), and cells were plated in 10 mL NEM on fibronectin-coated (5 μg/mL in PBS; R&D Systems) T25 culture flasks to allow outgrowth of an adherently growing NSC culture. Following 24 h of culture, nonadherent cells were removed, and 10 mL fresh NEM was added to the cultures. After 7 days, cultured cells were harvested following accutase (Sigma) treatment for 5 min at 37°C and seeded in a new fibronectin-coated T25 flask in 10 mL NEM (passage 1).
For routine cell culture, NEM was replaced every 3–4 days, and NSC cultures were split 1:5 every 7 days. Cell cultures were incubated at 37°C and 5% CO2. NSCs derived from Ngbfl mice are defined as Ngbfl-NSCs.
mRNA lipofection of NSC cultures
mRNA encoding the Cre recombinase protein was prepared as described previously [17,18], and mRNA lipofection was performed following the protocol of Reekmans et al. [16].
Directly before mRNA lipofection, fresh mRNA (5 μg)/Lipofectamine™ 2000 (10 μL) mixtures were prepared in 600 μL Opti-MEM medium (Invitrogen), according to the manufacturer's instructions. Next, subconfluent (70%) T25 flask cultures of NSCs were washed twice with PBS, and fresh NEM without antibiotics (10 mL) and mRNA lipoplexes (600 μL) were added to the cultures. After 4 h, medium was refreshed to remove remaining lipoplexes. Confluent cultures were harvested, partially used to extract gDNA to verify Cre-mediated excision, and seeded in T25 flasks. Ngbfl-NSCs which underwent excision of the Ngb-floxed locus were considered as Ngb knockout (KO) cells and defined as NgbKO-NSCs.
gDNA extraction and genotyping
gDNA extraction was performed using the Wizard SV Genomic DNA Purification System (Promega) according to the manufacturer's instructions. To identify the presence of two Ngb-floxed alleles, a polymerase chain reaction (PCR) was performed using 50 ng forward primer Fin1loxP (5′-TCATTCCCCCAGATTCTGAT-3′), annealing upstream of the distal loxP site, and 50 ng reverse primer Rin1loxP (5′-AAACGGGCAATAGCATCAAG-3′), annealing downstream of the distal loxP site. In the presence of loxP sites, an amplified product of 279 bp is expected. Intermediate and final targeting vectors were used as negative controls.
PCR was performed using Taq DNA polymerase (Life Technologies) according to the manufacturer's instructions following a 2 min incubation on 94°C before proceeding to 35 cycles of 94°C for 30 s, 55°C for 30 s, and 72°C for 1 min, ending with an incubation of 10 min on 72°C. Lengths of amplicons were compared to a GeneRuler 1 kb DNA ladder (ThermoFisher Scientific) on a 1.5% agarose gel.
To evaluate the excision of the Ngb-floxed locus, a PCR was performed targeting the full Ngb-floxed locus by Fin1loxP (5′-TCATTCCCCCAGATTCTGAT-3′) and reverse primers annealing exon 4, Rex4 (5′-ACCACAGCTCCGTAGAGTCG). Successful Cre-lox recombination results in the excision of the Ngb-floxed locus and an amplified product of approximately 960 bp.
PCR was performed using the Expand Long Template Kit (Roche) according to the manufacturer's instructions following a 2 min incubation on 94°C before proceeding to 35 cycles of 94°C for 30 s, 56°C for 1 min, and 68°C for 5 min, ending with an incubation of 10 min on 68°C.
To assess the gender of the NSC line used in this study, isolated gDNA was used in a mouse sex genotype PCR, which was carried out as described in literature [19]. Lengths of amplicons were compared to a GeneRuler 1 kb DNA ladder (Thermo Fisher Scientific) on a 1% agarose gel.
mRNA extraction
Cell pellets of NgbKO-NSCs and Ngbfl-NSCs of three consecutive passages were treated with TriReagent (Sigma) for 10 min at room temperature. In addition chloroform (Merck) was added, and after 10 min samples were centrifuged at 13,400 g for 15 min at 4°C. The upper RNA containing transparent layer was collected and processed with the PureLink RNA Mini Kit (Ambion) according to the manufacturer's instructions, including an on-column DNase I digestion using the PureLink DNase Set (Life Technologies). RNA concentration and integrity were analyzed using the Qubit RNA HS Assay (Life Technologies) and Bioanalyzer total RNA Nano Chip (Agilent), respectively.
Real-time quantitative PCR
First strand cDNA synthesis was performed on 1 μg total RNA with the SuperScript III Reverse Transcriptase (Invitrogen) according to the manufacturer's instructions.
For validation of Ngb expression levels, qRT-PCR was carried out on the ABI Prism 7500 Fast and 7000 Sequence Detection Systems (Applied Biosystems). Each real-time PCR comprised the amount of cDNA equivalent to 25 ng of total RNA in a 10 μL reaction containing SYBR Green (GoTaq Real-Time Master Mix, Promega) with 0.33 μM of each primer targeting Ngb (Ngb-qPCR-For: 5′-GCTCAGCTCCTTCTCGACAG-3′;Ngb-qPCR-Rev: 5′-CAACAGGCAGATCAACAGAC-3′) or Rplp0 (Rplp0-qPCR-For: 5′-AGGGCGACCTGGAAGTCC-3′; Rplp0-qPCR-Rev: 5′- GCATCTGCTTGGAGCCCA-3′). The parameters for amplification were 95°C for 15 s, 58°C for 30 s, and 72°C for 30 s, measuring the fluorescence during the last step of each cycle.
The standard-curve approach by measuring Ct values was used to calculate mRNA levels. Assay performance was calculated by a serial dilution of a standard-plasmid containing the amplicon sequence. Quantification of Ngb was carried out using the absolute quantification method with serial dilutions of a known standard to calculate copy numbers per μg RNA.
Astrocyte and neuronal differentiation of NSCs
For differentiation of NSCs to astrocytes, NSCs were plated in 1 mL Neurobasal A medium (Invitrogen) supplemented with 1% modified N2 supplement and 1% fetal calf serum (Gibco) in a density of 15,000 cells/cm3 on fibronectin-coated (5 μg/mL in PBS; R&D Systems) cover slips. For neuronal differentiation, NSCs were plated in 1 mL Neurobasal A medium (Invitrogen) supplemented with 1% fetal calf serum (Gibco), 2% B-27 (Gibco), and 2 ng/mL human fibroblast growth factor-2 (hFGF-2; ImmunoTools) in a density of 10,000 cells/cm3 on poly-L-ornithine (15 μg/mL in PBS; Sigma)/laminin (10 μg/mL in PBS; Sigma)-coated cover slips. Cells were cultured for 11 days, and half of the medium was replaced every 2–3 days.
Glucose deprivation induced cell death under normoxia and anoxia
Following seeding of cells in triplicate in a six-well plate with a density of 1 × 10⁵ cells per well, medium was refreshed after 24 h, and cells were incubated with glucose deprived medium, under normoxic or anoxic (5% CO, 95% N2) conditions for 24 or 48 h. Anoxia was achieved using a humidified Bactron IV anaerobic chamber (Shel Lab) as described [20]. Confirmation of the stability of O2 tension in the gas phase at <0.1% O2 was obtained by a Greisinger GMH 3691 air oximeter (Metresys). After normoxia or anoxia, cells were harvested, counted manually in a Neubauer chamber, and cell viability was measured by flow cytometry. Normalization was carried out using values of the starting point (100%).
Flow cytometry
Cell viability of at least 1 × 10⁴ cells per sample was evaluated on an Epics XL-MCL analytical flow cytometer (Beckman Coulter) using GelRed® (1 × final concentration, Biotium). Flow cytometric data were analyzed using FlowJo software (LLC).
Growth curve analysis
Cells were plated in a six-well culture dish in triplicate in a density of 5 × 10⁴ cells/well. After accutase (Sigma) treatment, cells were counted manually in a Neubauer chamber. The number of cells was recorded daily over a 4-day period. Normalization was carried out using values of the starting point (100%).
Immunofluorescence microscopy
Immunofluorescent staining of undifferentiated and differentiated NSCs was performed using following antibodies: a polyclonal rabbit anti-glial fibrillary acidic protein antibody (anti-GFAP, 1/1,000; Abcam ab7779) in combination with an FITC-labelled goat anti-rabbit secondary antibody (1/200; Jackson ImmunoResearch 111-096-045) and a monoclonal mouse anti-mouse neuron-specific beta-3 tubulin antibody (anti-TuJ1, 1/200; R&D Systems MAB1195) in combination with an AlexaFluor 555-labelled goat anti-mouse secondary antibody (1/200; Invitrogen A21425) for differentiation experiments and with a phycoerythrin (PE)-labelled anti-Ki67 antibody (1/20, BD 556027) for anti-Ki67 staining.
Cell cultures grown on cover slips were washed with Tris-buffered saline (TBS), fixated with 4% paraformaldehyde in TBS for 20 min at room temperature (RT), washed again with TBS, and incubated with 0.1% Triton X-100 (Sigma) in TBS for 30 min. Next, cover slips were incubated for 1 h at RT with goat serum (1/5; Jackson ImmunoResearch) in TBS for anti-GFAP staining or with goat serum (1/5; Jackson ImmunoResearch) and AffiniPure Fab Fragment Goat anti-Mouse IgG (H+L) (1/100; Jackson ImmunoResearch) in TBS for anti-TuJ1 and anti-GFAP double staining or for 1 h at 37°C with 3% BSA and AffiniPure Fab Fragment Goat anti-Mouse IgG (H+L) (1/250; Jackson ImmunoResearch) for anti-Ki67 staining.
After washing with TBS, cover slips were incubated overnight at 4°C with primary antibody in 10% milk powder. For anti-GFAP and anti-TuJ1 staining, cover slips were washed with TBS and incubated for 1 h at RT with secondary antibodies. After washing with TBS, cover slips were incubated for 10 min at RT with 4′, 6-diamidino-2-phenylindole (DAPI, 1/1,000; Sigma) in TBS. After a final washing step with demineralized water, cover slips were mounted with ProLong® Gold antifade reagent (Life Technologies).
Visualization of immunostained cells was performed using a standard fluorescence microscope (Olympus BX51) equipped with an Olympus DP71 digital camera. Olympus Cell-F Software was used for image acquisition and processing. Images for Ki67 staining were analyzed with TissueQuest software (TissueGnostics).
Assay for cell cycle distribution
Cells were plated in a density of 5,500 cells/cm2 in NEM and cultured for 5 days until 80%–90% confluency was reached. Cell cycle distribution was evaluated using Cycletest™ Plus DNA Kit (BD Biosciences) on an Epics XL-MCL analytic flow cytometer (Beckman Coulter) and analyzed with FlowJo (LLC).
RNA-sequencing library preparation and Illumina sequencing
Total extracted RNA from NgbKO-NSCs and Ngbfl-NSCs was used for RNA-Seq library preparation. Libraries were generated by StarSEQ (Mainz, Germany) using the Illumina TruSeq RNA Sample Preparation Kit v.2 (Illumina). Each library was prepared using 825 ng of total RNA. Sequencing was performed on an Illumina HiSeq 2500 instrument in rapid mode using a paired-end, 100-bp read length sequencing strategy. RNA-Seq data are available at the European Nucleotide Archive under accession number PRJEB20351.
Data processing and RNA-Seq mapping procedure
The FASTX–Toolkit (
Quality assessment of the Illumina RNA-Seq reads was performed using the FastQC software (
Differential gene expression analysis
To identify differentially expressed genes (DEGs) in the dataset, the number of total exon reads for each gene and for both conditions were extracted from the RNA-Seq mapping together with the corresponding official gene symbols.
Based on these read-count data, we performed a differential gene expression analysis using the DESeq Bioconductor package version 1.18.0 [21] within R version R-3.1.2 (
Functional enrichment and pathway analysis
Gene Ontology (GO) enrichment analysis was performed separately for up- and downregulated genes using the WEB-based Gene SeT AnaLysis Toolkit (WebGestalt) [22,23].
The whole mouse genome was set as reference. To determine statistically enriched terms, the hypergeometric method combined with a more conservative Bonferroni P value correction (P < 0.01) was used for statistical testing. Furthermore only statistically enriched terms that comprised at least four genes of the input dataset were selected. To conduct Ingenuity Pathway Analysis (IPA) (Qiagen;
RT2 profiler PCR array
As a validation of the results extracted from RNA-Seq and to identify potential differently expressed cell cycle genes, RT2 profiler cell cycle PCR arrays (Qiagen) were applied according to manufacturer's instructions. Potential up- and downregulated genes were selected using the online provided tools (Qiagen).
Principle component and hierarchical clustering analyses
To confirm that the cells used in this study can be clearly termed as NSCs, principle component analyses (PCAs) and hierarchical cluster analyses (HCAs) were performed using our own and additional public available transcriptome datasets from different cell types of the mouse brain (astrocytes, neurons, NSCs, NSPHs, oligodendrocytes, and oligodendrocyte progenitor cells). The following RNA-Seq datasets were included in the analysis and downloaded as FASTQ-Files from the Sequence Read Archive of NCBI: SRX861703, SRX2588589, SRX380380, SRX380382, SRX380384, SRX380386, SRX539543, SRX591754, and SRX1620324.
Trimming, quality filtering, and mapping of the reads were done within the CLC Genomics Workbench version 9.0 (CLC Bio Qiagen, Aarhus, Denmark) using the same parameters as already described. All subsequent analysis and calculations were done in R (v.3.4.2). PCA and HCA were carried out on the log-transformed normalized counts using the rlogTransformation function of the DESeq2 package (v.1.18.1). PCA was further calculated using the plotPCA function of DESeq2 with default settings and visualized using the ggplot2 package (v.2.2.1). HCA was performed based on a Pearson correlation distance of a subset of known marker genes for NSCs, astrocytes, and cells of the neuronal and oligodendroglial lineage using the cor and hclust commands in R and drawn using the heatmap.2 function of the gplots package (v.3.0.1).
The following marker genes were included in the analysis: NSC-markers Abcg2, Ascl1, Fabp7, Hes1, Nes, Pax6, Slc1a3, Sox2, Sox3, Sox9, and Vim; astrocyte-specific markers Acsbg1, Aldh1l1, GFAP, and Gli3; neuronal lineage markers Dcx, Dlx2, Eomes, Gad1, Map2, Rbfox3, Syt1, Syp, Tbr1, and Tubb3; and oligodendroglial lineage markers Mbp, Mobp, Mag, Mog, Olig2, Plp1, and Sox10 [24 –31].
Western blot
NSCs were harvested by accutase treatment (Sigma) and incubated on ice for 5 min with N-PER™ Reagent (ThermoFisher Scientific) supplemented with cOmplete™ Mini Protease Inhibitor Cocktail (Roche) following the manufacturer's instructions and centrifuged at 10,000 g for 10 min to obtain whole protein extracts. Total protein concentration was determined using the Pierce™ BCA Protein Assay Kit (Thermo Fisher Scientific). The protein extracts (50 μg for Cdkn1a, Akt, P-AktSER, and P-AktTHR and 130 μg for Cdk6) and the PageRuler™ Plus Prestained Protein Ladder (Thermo Fisher Scientific) were subjected to 12.5% SDS-PAGE and transferred to a Immobilon®-P PVDF membrane (Millipore).
The membrane was blocked for 1 h at RT with 5% milk powder in TBS and incubated overnight at 4°C with primary antibody [monoclonal mouse anti-β-Actin (1/10,000; Sigma A1978), monoclonal rabbit anti-Cdkn1a (1/1,000; Abcam ab109199), or monoclonal mouse anti-Cdk6 (1/2,000; Cell Signaling #3136)] in 5% milk powder and 0.1% Tween-20 (Sigma) in TBS or with primary antibody [monoclonal rabbit anti-Akt (1/1,000; Cell Signaling #4691), monoclonal rabbit anti-P-AktSER (1/2,000; Cell Signaling #4060), polyclonal rabbit anti-P-AktTHR (1/1,000; Cell Signaling #9275)] in 5% BSA (Sigma) and 0.1% Tween-20 (Sigma) in TBS.
After washing with TBS, the membrane was incubated for 1 h at RT with secondary antibody [Horseradish Peroxidase (HRP)-conjugated polyclonal goat anti-mouse antibody (1/1,000; Dako P0447) or HRP-conjugated polyclonal goat anti-rabbit antibody (1/2,000; Dako P0448)] in TBS. After washing with TBS, Luminata Forte Western HRP Substrate (Millipore) was added to the membrane, and targeted proteins were visualized using a G:BOX (Syngene) imager and analyzed using GeneSnap and ImageJ.
Statistical analysis
Levels of Ngb copy number (Fig. 1C) were analyzed using independent samples t-test using GraphPad Prism 6.0.
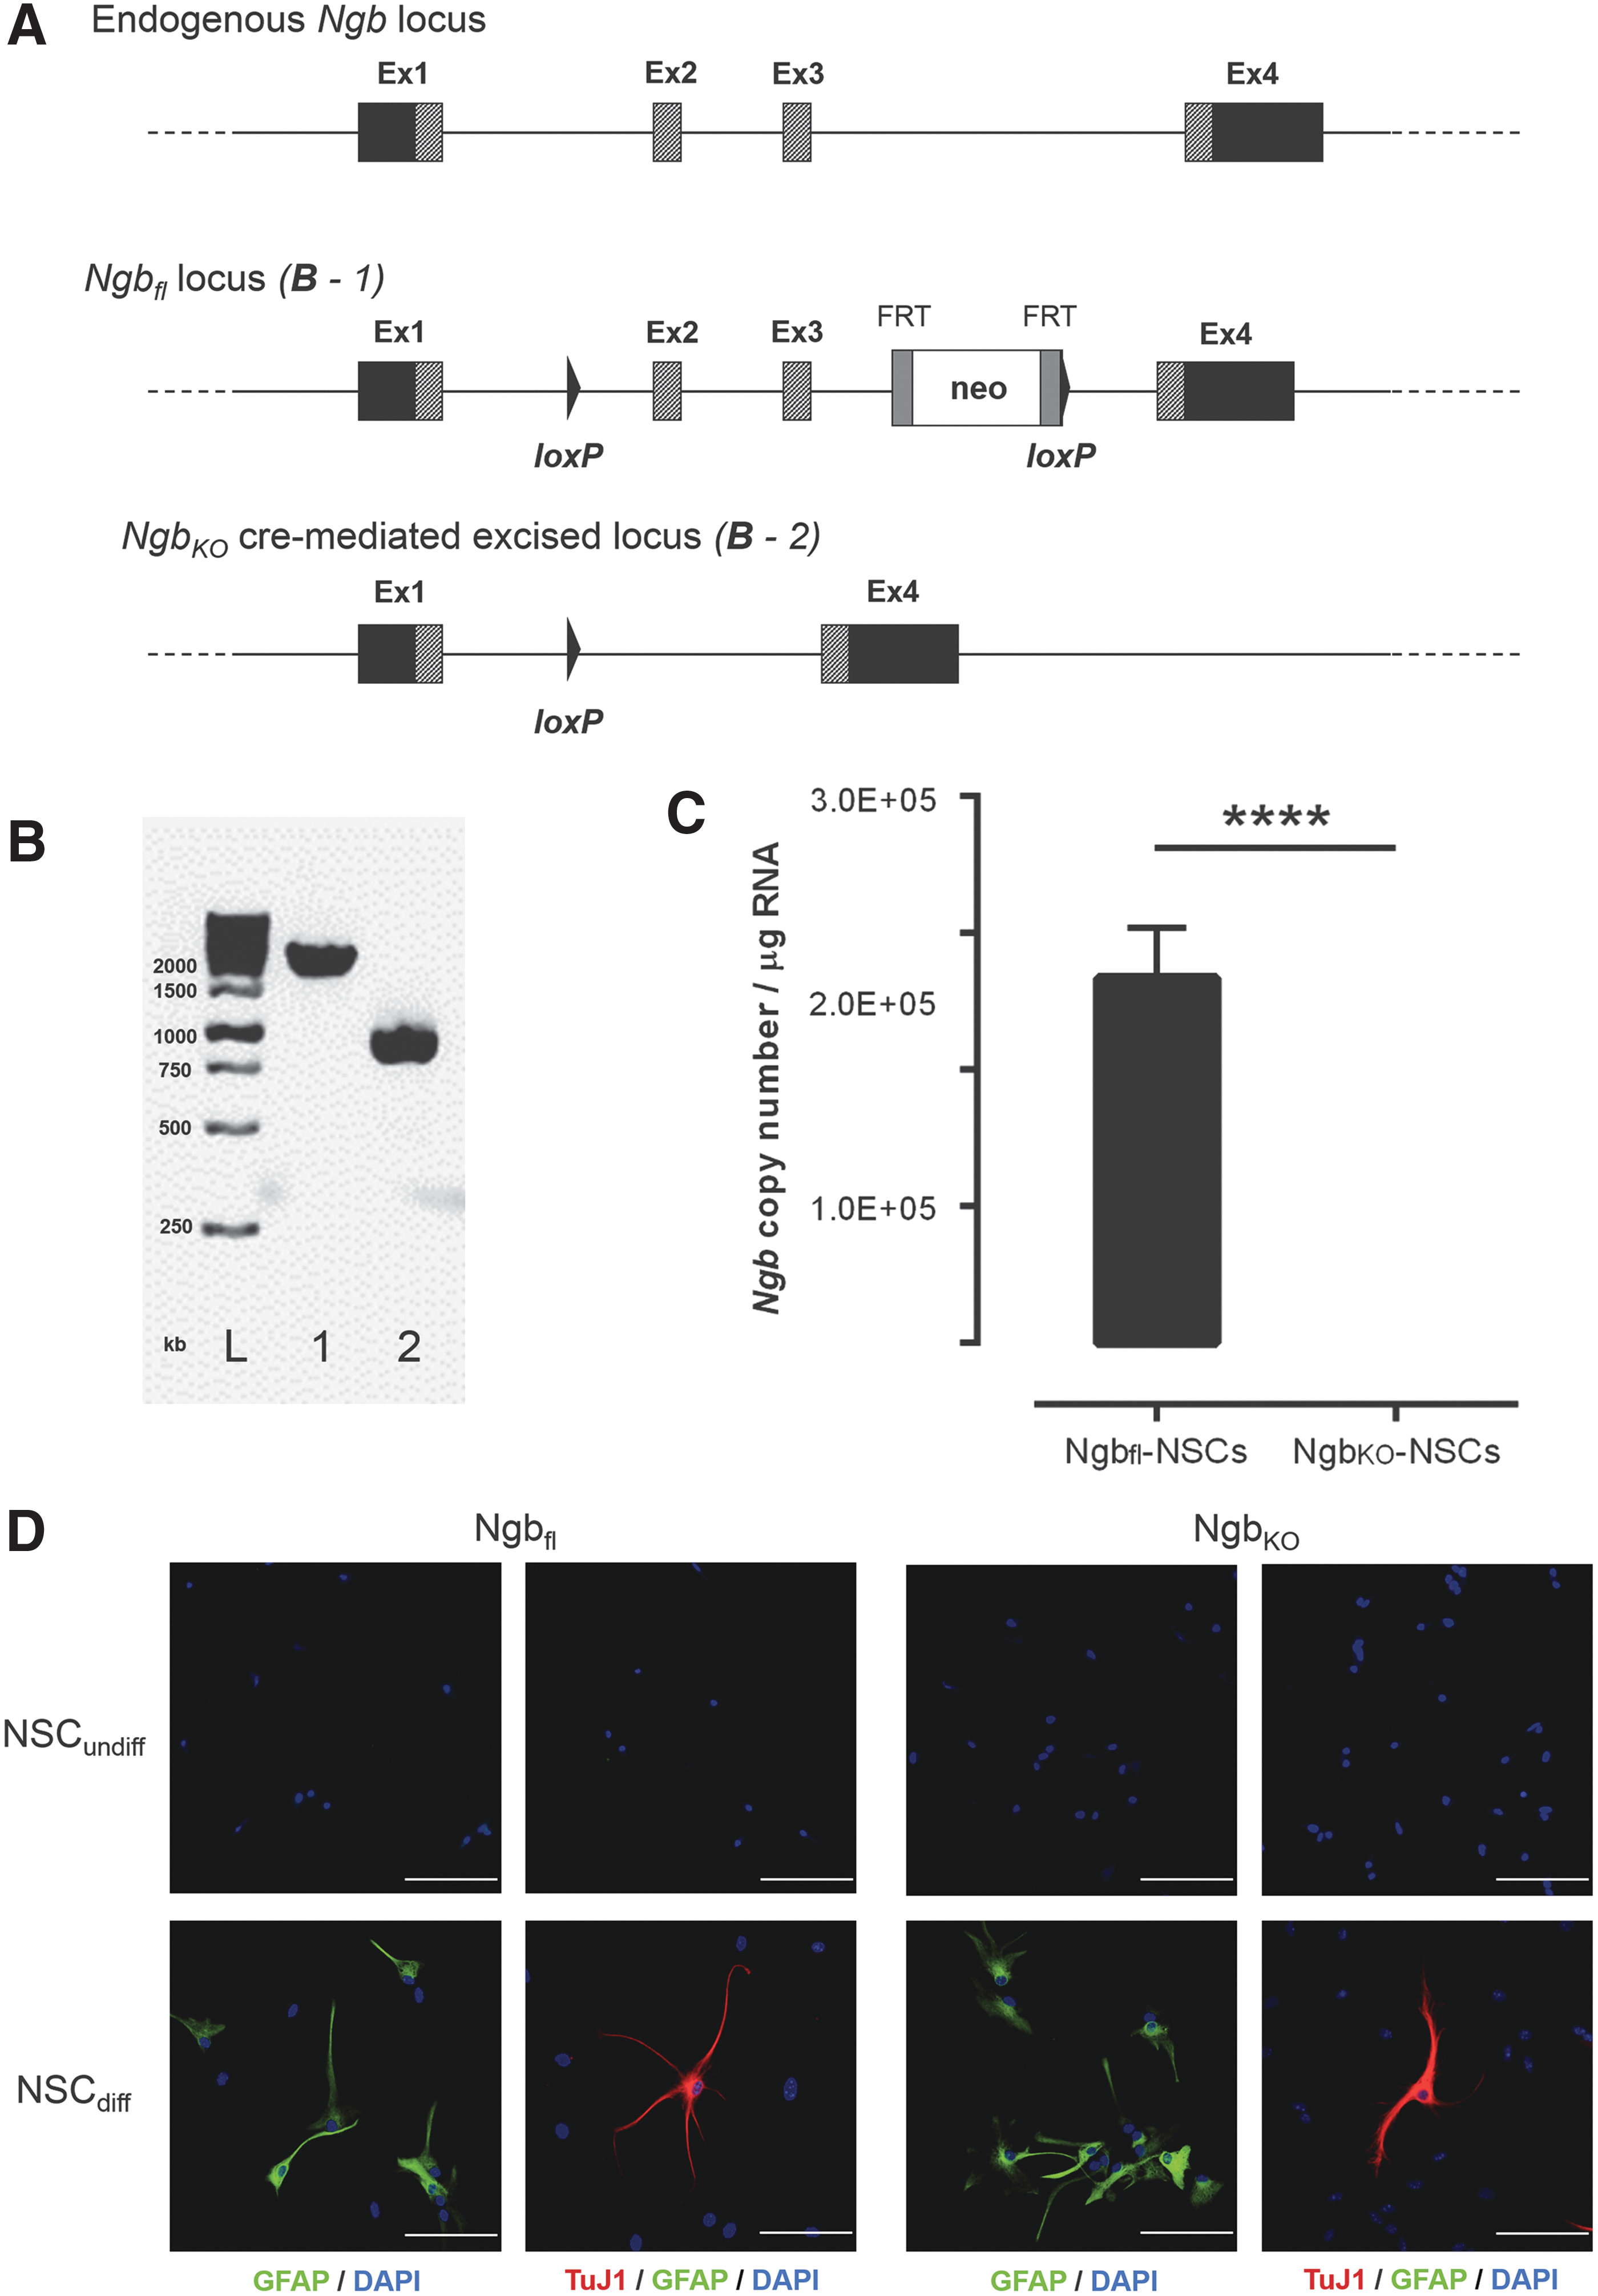
Schematic presentation, validation, and characterization of the Ngb knockout model.
The effect of oxygen treatment and genotype on the percentage of growth was modeled using multiple linear regression (Fig. 3). The percentage surviving cells, after normalization, were entered as dependent variable. Genotype, time, and oxygen were entered as independent variables. Since the change over time followed an approximate linear pattern, time was entered as a continuous variable. The multiple regression model was fitted by stepwise backward elimination, starting from a full model with all interaction terms, and eliminating nonsignificant terms in each step.
The difference in the growth pattern (Fig. 4A) was analyzed using a two-way ANOVA model; the difference in mean growth between the two genotypes at each separate day was analyzed using independent samples t-tests.
For the Ki67 immunostaining (Fig. 4B), the relationship between the Ki67 labeling index and the genotype of NSCs was modeled with a linear mixed model, adding a random intercept term to account for the nonindependence between observations within the same cover slip. Linear mixed models were fitted using the lme4 package in the statistical package R, version 3.1.0 (
Cell cycle distribution (Fig. 4C) was analyzed by Mann–Whitney U tests in GraphPad Prism 6.0.
Western blot assays (Fig. 5B, C) were normalized to β-Actin expression where after the signal in NgbKO-NSC extracts was normalized to the signal of Ngbfl-NSC extracts. Therefore, Wilcoxon signed-rank tests were used to analyze the normalized data. In general P < 0.05 indicated statistical significance.
For transcriptomics, statistics on RNA-Seq data processing, DEGs, IPA, PCA, and HCA was described in the respective sections. Expression levels obtained by the RT2 profiler array were analyzed by independent samples t-tests. In general P < 0.05 indicated statistical significance.
Results
Generation of an Ngbfl- and an NgbKO-NSC line from a new mouse model
A new mouse model was created, in which Ngb was targeted by introducing loxP sites into the introns flanking exon 2 and 3 of the Ngb locus (the Ngbfl locus, see Fig. 1A). Since exons 2 and 3 encode the heme pocket together with two histidine codons known to be essential for the correct folding and activity of the Ngb protein, targeting this region leads to a loss of function of Ngb after Cre-lox recombination [1,32].
Ngbfl-NSCs were isolated from the brain of an Ngbfl embryo and lipofected with Cre recombinase-encoding mRNA to obtain the NgbKO-NSC line. PCR analysis on gDNA extracts from Ngbfl- and NgbKO-NSCs clearly showed the absence of the Ngbfl allele in the latter, confirming the desired excision of exon 2 and 3 by Cre-lox recombination (Fig. 1B). As qRT-PCR analysis showed an Ngb copy number of 2.67E+05 ± 0.37E+05 per μg RNA of Ngbfl-NSCs while Ngb expression was absent in NgbKO-NSCs (P < 0.0001), the latter was considered as a valid Ngb knockout cell line (Fig. 1C).
Characterization of Ngbfl- and NgbKO-NSC lines
To demonstrate that cultured Ngbfl- and NgbKO-NSCs have the capacity to differentiate into both glial (GFAP+ astrocytes) and neuronal (TuJ1+ neurons) cell lineages, in vitro differentiation was performed (Fig. 1D). While undifferentiated Ngbfl- and NgbKO-NSCs were not immunoreactive for GFAP or TuJ1, in vitro differentiated Ngbfl- and NgbKO-NSCs clearly showed the morphological presence of astrocytes and neurons. Astrocyte-differentiated Ngbfl- and NgbKO-NSCs were both immunoreactive for GFAP, but not for TuJ1, while neuronally-differentiated Ngbfl- and NgbKO-NSCs were immunoreactive for TuJ1 but not for GFAP.
In addition, to confirm the cellular identity of our NSC preparations, we characterized the transcriptional profile of undifferentiated Ngbfl- and NgbKO-NSCs in comparison to expression profiles of NSC populations, astrocytes, oligodendrocytes, and their progenitor cells, as well as mature neurons using public RNA-Seq datasets. All RNA-Seq data were mapped to the mouse reference genome, and reads were counted and normalized. RNA-Seq profiles of the sampled datasets were then compared using two different approaches: a PCA and an unsupervised HCA.
The PCA (Fig. 2A) showed that the two NSC lines grouped with NSCs and NSPHs obtained in three other independent studies. This can be interpreted as strong indication of a true NSC identity of Ngbfl- and NgbKO-NSCs. Second, an unsupervised HCA was performed based on a subset of published marker genes for NSCs, astrocytes, neurons, and oligodendrocytes (Fig. 2B). Based on the expression of established marker genes, Ngbfl- and NgbKO-NSCs again showed a consistent grouping with the NSCs and NSPHs from other published studies. Furthermore, the HCA showed that established markers for radial glia-like NSCs (eg, Sox2, Fabp7, Slc1a3, Olig2, and Vim [15]) were clearly enriched as strongly expressed genes in Ngbfl- and NgbKO-NSCs.

Principle component
Furthermore, the analysis also implied that the Ngbfl- and NgbKO-NSCs did not undergo further differentiation since genes such as Eomes/Tbr2, Dcx, and Dlx2, which are known to be markers for intermediate progenitors or neuronal differentiation [26,33 –36] were only very weakly expressed.
Overall, these data demonstrate that loss of Ngb expression does not influence (stem) cell identity and differentiation capacity of NSCs.
NSC mortality following glucose deprivation under normoxia and anoxia was not affected by the absence of Ngb
Ngbfl- and NgbKO-NSCs were subjected to glucose deprivation under normoxia (GD) and under hypoxia (OGD) for 24 and 48 h. The effect of oxygen treatment and genotype on the percentage of growth was modeled using multiple linear regression. The final model included significant interaction terms between genotype and oxygen (P < 0.001) and between time and oxygen (P < 2E-16), but no significant interaction between genotype and time (P = 0.42). This means that OGD, but not GD, significantly reduced cell survival over time resulting in almost total mortality after 48 h without noticeable differences between Ngbfl- and NgbKO-NSC lines (Fig. 3).

Glucose deprivation of Ngbfl-NSCs and NgbKO-NSCs under normoxia or hypoxia. Relative growth of Ngbfl-NSCs and NgbKO-NSCs after 0, 24, and 48 h of glucose deprivation under normoxia (GD) or hypoxia (OGD) conditions. The growth at start was used to normalize (100%). Data are depicted as mean (n = 3) ± SD. The progress in time is significantly different depending on oxygen treatment (P < 2E-16) but within an oxygen treatment there is no difference between the genotypes (P = 0.42).
NgbKO-NSCs display enhanced cell proliferation compared to Ngbfl-NSCs
As glucose-deprived NgbKO-NSCs displayed some degree of increased proliferation, although not significant, under normoxia compared to Ngbfl-NSCs after 24 h (115% ± 20% Ngbfl-NSCs vs. 139% ± 23% NgbKO-NSCs; Fig. 3, GD condition) and after 48 h (149% ± 26% Ngbfl-NSCs vs. 186% ± 13% NgbKO-NSCs; Fig. 3, GD condition), a deregulation of the growth pattern in NgbKO-NSCs was suggested.
A growth curve analysis of both NSC lines indeed revealed a significantly different growth pattern in NgbKO-NSCs compared to Ngbfl-NSCs (P < 0.001) characterized by consistently significant higher cell numbers at each of the 4 days in NgbKO-NSCs (P < 0.01) (Fig. 4A). Analysis of the proliferation capacity by anti-Ki67 staining confirmed the significantly higher proliferation potential of NgbKO-NSCs compared to Ngbfl-NSCs (P < 0.001) with 57.6% ± 5.4% Ki67-labelled NgbKO-NSCs and only 24.6% ± 6.7% Ki67-labelled Ngbfl-NSCs (Fig. 4B).

Growth and cell cycle distribution analysis of Ngbfl-NSCs and NgbKO-NSCs.
In addition, we assessed cell cycle distribution over G0/G1, S, and G2/M phases in Ngbfl- and NgbKO-NSC lines to evaluate changes in the length of a specific cell cycle phase. However, loss of Ngb did not alter cell cycle phase distribution (P = 0.4 for G0/G1 phase, P = 0.2 for S phase, and P = 0.7 for G2/M phase) (Fig. 4C).
NgbKO-NSCs showed altered expression of cell cycle genes
Illumina RNA sequencing based on total extracted RNA from Ngbfl-NSCs and NgbKO-NSCs obtained 42–45 million raw sequence reads for each cDNA library. RNA-Seq data are available at the European Nucleotide Archive under accession number PRJEB20351. Using the CLC Genomic Workbench (version 7.5) for mapping against the mouse reference genome (build GRCm38), 71.8%–77.5% of the trimmed and quality filtered reads uniquely mapped to the genome. Using DESeq to identify differential expressed genes with an adjusted P value threshold of P < 0.05, the NgbKO-NSCs demonstrated 55 upregulated genes and 116 downregulated genes with fold changes of at least 5.6 compared to the Ngbfl-NSCs.
The most significantly upregulated genes included insulin-like growth factor 2 mRNA binding protein 3 (Igf2bp3), zinc finger DBF-type containing 2 (Zdbf2), cartilage oligomeric matrix protein (Comp), fibronectin type III domain containing 3C1 (Fndc3c1), and dorsal inhibitory axon guidance protein (Draxin) (Table 1). The most significantly downregulated genes, ranked by adjusted P value, were as follows: annexin A3 (Anxa3), DNA-damage-inducible transcript 4-like (Ddit4l), six3 opposite strand transcript 1 (Six3os1), transferrin (Trf), and interferon-induced protein with tetratricopeptide repeats 3 (Ifit3) (Table 1).
Genes with upregulated expression in NgbKO-NSCs are shown on the left; downregulated genes in NgbKO-NSCs are shown on the right. Genes were ranked by adjusted P value.
Inf, infinity; NSC, neural stem cell; DEG, differentially expressed gene.
In agreement with the observed augmented growth and proliferation in NgbKO-NSCs compared to Ngbfl-NSCs, a clear upregulation of the cyclin dependent kinase 6 (Cdk6) and an intense downregulation of the cyclin-dependent kinase inhibitor p21 (Cdkn1a), both important cell cycling genes, could be revealed (P < 0.01) in NgbKO-NSCs (Table 1).
Quantification and validation of up- and downregulated cell cycle genes by an RT2 profiler PCR array confirmed enhanced cell growth by showing significant upregulation of Cdk6 in NgbKO-NSCs compared to Ngbfl-NSCs (P < 0.05). In addition, Cdc7 and Ccna1 were upregulated, although not significantly. Also confirming the RNA-Seq data, Cdkn1a proved significantly downregulated in NgbKO-NSCs compared to Ngbfl-NSCs (P < 0.05) (Fig. 5A).

Expression levels of cell cycle genes in Ngbfl-NSCs and NgbKO-NSCs.
To confirm the altered expression of Cdk6 and Cdkn1a on protein level, western blot experiments were carried out (Fig. 5B, C). Total protein extracts of NgbKO-NSCs showed a clear and significant decrease of Cdkn1a expression (P < 0.05) and a moderate, but significant increase of Cdk6 expression compared to the NgbKO-NSC extracts (P < 0.05) (Fig. 5B, C), thus supporting the RNA-Seq and RT2 profiler transcript analyses.
Developmental processes were upregulated in NgbKO-NSCs
Using the WebGestalt tool, a GO enrichment analysis based on functional annotations for each DEG yielded 29 significantly overrepresented biological processes for upregulated DEGs and 21 for downregulated DEGs (P < 0.01) (Supplementary Tables S1 and S2; Supplementary Data are available online at
For upregulated DEGs, the predominant overrepresented terms were related to developmental processes like “anatomical structure development” (P < 0.01), “neurogenesis” (P < 0.01), and “cell-, tissue-, organ-, or nervous system development” (P < 0.01). In contrast, the GO enrichment indicated that downregulated genes in the NgbKO-NSCs were mainly associated with biological terms that are predominantly involved in inflammatory- or immune response-related processes. Terms like “innate immune response” (P < 0.01), “response to stress” (P < 0.001), “response to interferon alpha” (P < 0.01), or “beta” (P < 0.01) were significantly enriched.
Ingenuity pathway analysis suggested an interplay between Ngb and signaling pathways
To investigate if the observed DEGs are associated with common canonical pathways based on known interactions among them, an Ingenuity Pathway Analysis (IPA) was carried out.
IPA revealed 13 statistically significant canonical pathways (P < 0.01), most of them involved in cellular signaling processes (Table 2). Among those, the Tp53 signaling pathway was the most significant one, characterized by a common feature of multiple ingenuity canonical pathways as follows: a decrease of Cdkn1a expression in NgbKO-NSCs compared to Ngbfl-NSCs, which could be confirmed on the protein level (Fig. 5B, C), and an increase in Akt3 expression in NgbKO-NSCs. To explore the altered expression of Akt or phosphorylated (P)-Akt on the protein level, western blot experiments were carried out. No significant alterations in the overall Akt, P-AktSER, or P-AktTHR levels could be demonstrated so far (Supplementary Fig. S1).
IPA identified 13 canonical pathways in NgbKO-NSCs. For calling significance, the Fisher's exact test was set to a P value threshold of 0.01. Arrows indicate the direction of regulation for each gene.
EGF, epidermal growth factor; IPA, ingenuity pathway analysis.
Discussion
The development of NSC lines from NgbKO and Ngb-proficient mice is of great value for unravelling a potential effect of Ngb expression on NSC growth characteristics and pathways. As low or high expression levels of Ngb may point to distinct functions of Ngb in specific brain regions [9], it is important to note that this study primarily addresses Ngb function in low-level expressing cells, taking into account the relatively weak expression of the Ngb transcript in NSCs (2.67E+05 ± 0.37E+05 copy numbers per μg RNA in Ngbfl-NSCs). As qRT-PCR analysis confirmed the absence of the Ngb transcript in NgbKO-NSCs (P < 0.0001) and analysis on the genome level confirmed the absence of the Ngb-floxed construct in NgbKO-NSCs, this NSC line was considered a valid Ngb knockout.
The adherent NSC cultures obtained in this study displayed a uniform morphology and phenotypical properties such as the transcriptional expression of Sox2, Fabp7, Slc1a3, Olig2, and Vim, which are well-established markers for radial glia-like NSCs [15]. This is in line with many literature reports suggesting that NSCs are closely related to radial glial lineages, thus describing a close relationship and common characteristics between astrocytes and NSCs [25,28,37]. The ability of Ngbfl- and NgbKO-NSCs to differentiate in vitro into astrocytes and neurons further support their NSC identity.
To investigate if the reported neuroprotective character of Ngb would express itself in the NSC cultures, the effect of glucose deprivation on NSCs was monitored in the presence and absence of Ngb under normoxic and anoxic conditions. As previous in vitro studies using the human neuroblastoma cell line SH-SY5Y had shown upregulation of Ngb under OGD and even prolonged cell survival after Ngb overexpression under these conditions, we hypothesized NgbKO-NSCs to undergo increased mortality during OGD [38].
Although the shift from GD to OGD led to higher mortality rates in both cell lineages, no significant quantitative difference in cell death was monitored between Ngbfl-NSCs and NgbKO-NSCs. As NgbKO-NSCs did not display an increased mortality rate compared to Ngbfl-NSCs, our results do not support the hypothesis that Ngb, under steady-state expression levels in NSC, may promote protection against OGD-induced cell death. However, this conclusion may be cell type dependent and primarily relevant for cells with low Ngb expression levels. Furthermore, Ngb's mode of action might be different in overexpression setups compared to wild-type and our Ngb knockout cellular systems.
The main focus of the present study was to address a potential role of Ngb in neurodevelopment. To this end, growth patterns and proliferation of the different NSC lines were studied. Growth curve analyses clearly revealed the enhanced growth potential of NgbKO-NSCs compared to Ngbfl-NSCs. In addition, anti-Ki67 immunostaining, a cell marker present in active cells in late G1, S, G2, and M phase of the cell cycle, confirmed this higher proliferation capacity of NgbKO-NSCs by an increase in the occurrence of Ki67+ nuclei of 33% in NgbKO-NSCs compared to Ngbfl-NSCs. However, no alterations in cell cycle phase distribution could be demonstrated.
To identify the molecular basis of this enhanced cell growth, transcriptome analyses were performed, anticipating that differential mRNA regulation should reflect the molecular phenotype in NgbKO-NSCs versus Ngbfl-NSCs. Both, a broad RNA-Seq analysis and a targeted RT2 profiler cell cycle array revealed downregulation of the cyclin-dependent kinase inhibitor Cdkn1a and a pronounced upregulation of cyclin-dependent kinase Cdk6 in NgbKO-NSCs, and both results were confirmed on the protein level.
Cdkn1a is a negative regulator of cell cycle progression from G1 to S phase and acts by inhibition of Cdks (eg, Cdk6). Cdk6 in turn facilitates the G1/S transition. In consequence, an upregulation of Cdk6 plus a downregulation of Cdkn1a may concertedly promote the progression of the cell cycle in NSCs lacking Ngb, meaning that Ngb expression in wild-type cells should control cell cycle progression by a yet unknown mechanism.
We note however that both, Cdk6 and Cdkn1a, are targets of Tp53-mediated gene regulation [39,40]. Tp53 signaling was indeed identified as enriched in our RNA-Seq pathway analysis. In addition, the pathway analysis also implicated the involvement of Akt signaling, based on the significant upregulation in NgbKO-NSCs of serine/threonine-protein kinase Akt3. Both pathways may in fact cross talk, since Akt signaling works upstream of Tp53 [41]. Although we could not yet directly prove an influence of Ngb expression on the overall Akt, P-AktSER, or P-AktTHR levels in our NSC system, we note that Akt has recently been identified as a possible interaction partner of Ngb in neuroblastoma cells [14]. Moreover, recent studies in cancer cell models reported a regulation of the Akt pathway by Ngb [42,43].
Guided by these interesting hypotheses, it will require extensive additional mechanistic studies to investigate the potentially subtle molecular role of Ngb in these signaling processes.
In conclusion, the current study addressed the biological role of Ngb in weakly expressing cells such as NSC. Loss of Ngb expression resulted in downregulation of Cdkn1a and upregulation of Cdk6, which led to an enhanced cell cycle progression and increased proliferation potential of NgbKO-NSCs. Clearly, however, further functional investigation of the underlying molecular mechanisms is needed, as we postulate that Ngb's mode of action may involve various signaling pathways.
Footnotes
Acknowledgments
Prof. F. Lardon and Dr. C. Deben of the Center for Oncological Research (CORE) are thanked for helpful suggestions and the use of the humidified Bactron IV anaerobic chamber. Dr. E. Geuens is thanked for the use of the Syngene imager. E. L. and A. Q. are PhD fellows of the Fund for Scientific Research (FWO). W.V.L was a PhD fellow of the Agency for Innovation by Science and Technology (IWT, Belgium). The Fund for Scientific Research (FWO) supported this work in general (G.0687.13). T. H. acknowledges funding by the Deutsche Forschungsgemeinschaft (Ha2103/3-4) and the Johannes Gutenberg University Center for Computational Sciences (CSM/SRFN).
Author Disclosure Statement
No competing financial interests exist.
References
Supplementary Material
Please find the following supplemental material available below.
For Open Access articles published under a Creative Commons License, all supplemental material carries the same license as the article it is associated with.
For non-Open Access articles published, all supplemental material carries a non-exclusive license, and permission requests for re-use of supplemental material or any part of supplemental material shall be sent directly to the copyright owner as specified in the copyright notice associated with the article.