




Abstract
Hepatic stellate cells (HSCs) are mesenchymal stem cells (MSCs) of the liver. They are unique among MSCs, since HSCs remain in a quiescent, retinoid-storing state in the normal liver but become activated after liver injury and contribute to tissue repair. The epigenetic mechanisms accompanying the transition of HSCs from a quiescent to an activated state are in the focus of the present study. We investigated the methylome and transcriptome during this process and observed profound changes. While the promoter methylation correlated negatively with gene expression, the gene-body methylation revealed no clear correlation. Most genes with altered expression were associated with cell differentiation. Among them, Wilms tumor 1 (Wt1) and Deltex4 (Dtx4) genes were identified as epigenetically regulated. Since HSCs were reported to derive from multipotent Wt1-positive cells and many differentially expressed genes were associated with cell differentiation during their activation, epigenetic alterations are presumably required to enable HSC development.
Introduction
I
Beside this, HSCs can also contribute to liver regeneration, either by paracrine control of oval cells, for example, by hepatocyte growth factor secretion [6] or by directly differentiating into hepatocytes and cholangiocytes [7 –9]. Moreover, HSCs express mesenchymal stem cell (MSC) markers such as CD29, CD105, CD146, nestin, and platelet-derived growth factor receptors and are able to differentiate into osteocytes and adipocytes as well as support hematopoietic stem cells in culture [10 –12]. As a consequence, HSCs were described as liver-resident MSCs [12] that occupy a characteristic stem cell niche in the space of Dissé [13,14].
Cell fate decisions require substantial reorganization of gene expression [15]. This is mainly regulated via epigenetic mechanisms, that is, “epigenetic reprogramming” [16]. Epigenetic mechanisms are generally defined as heritable changes in gene expression that occur without alteration of the DNA sequence and comprise DNA methylation, histone modifications, and noncoding RNAs [17]. The impact of DNA methylation on gene expression depends on the genomic region of the modification. DNA methylation in promoter regions is associated with gene silencing, whereas DNA methylation in intragenic regions characterizes transcriptionally active genes [18,19]. Epigenetic reprogramming is essential for mammalian embryonic development and takes place in the preimplantation embryo as well as in primordial germ cells [20,21]. After fertilization, the paternal and maternal pronuclei undergo massive DNA demethylation, and while development proceeds, DNA remethylation is initiated to gain cell-type-specific gene expression patterns [20].
Several studies suggest that DNA methylation changes are a prerequisite for HSC activation. The activation process of HSCs can be examined in vitro, since primary HSCs plated on plastic and cultured with 10% fetal calf serum (FCS) activate within few days. During this process a global decrease in DNA methylation by about 60% is observed [22] in reminiscence of the process seen in embryonic development [20,21]. On the contrary, the treatment of quiescent HSCs with the DNA methylation inhibitor 5-aza-2’-deoxycytidine was reported to impair the activation [23]. In addition, diverse gene-specific DNA methylation changes occur during HSC activation and DNA demethylation of the PTEN and SMAD7 promoters were found [23,24]. Profound changes in global 5-hydroxymethylcytosine (5hmC) and genome-wide distribution of 5-methylcytosine and 5hmC were described in different models of HSC activation and fibrosis, but without examining their influence on gene transcription [25].
On the contrary, several gene expression arrays were performed for activating HSCs, irrespective of a possible epigenetic regulation. Profound gene expression changes were identified between quiescent and in vitro as well as in vivo activated HSCs in mice, rats, and humans [26 –28]. Differentially expressed genes were mainly assigned to cellular functions such as wound healing and fibrogenesis [27].
In an attempt to relate epigenetic mechanisms to gene expression changes, Coll et al. reported a negative correlation between the expression of certain micro RNAs and their predicted target genes during culture-induced activation of human HSCs [29]. Another study examined DNA methylation and histone modification changes in quiescent and activated human primary HSCs and uncovered 416 promoter regions with similar dynamics in DNA methylation and gene expression [30]. Since this study was restricted to promoter regions, the picture of DNA methylation influencing HSC activation remained still incomplete. In a recent study, we found that intragenic as well as promoter DNA methylation dynamics coincide with an altered expression of the corresponding genes [22]. To complete this analysis, gene expression arrays of culture-activated primary rat HSCs were performed and combined with genome-wide DNA methylation analysis. We found a notable number of genes showing concurrent changes in DNA methylation and gene expression. These genes were mostly involved in cellular processes such as differentiation, stress, migration, or secretion and not only limited to wound healing and fibrosis.
Materials and Methods
Cell isolation and culture
HSCs were isolated from Wistar rats (>500 g) obtained from the Heinrich Heine University Düsseldorf, Germany. The animal experiments were approved by the Landesamt für Natur, Umwelt und Verbraucherschutz, Recklinghausen, Germany (Ref. No.: 84-02.04.2012.A214). The rats were anesthetized and perfused with collagenase and pronase E, to digest the liver tissue as described [31]. Enrichment of the lipid-storing stellate cells was carried out by density gradient centrifugation using 28% Nycodenz (Nycomed Pharma, Oslo, Norway). After isolation, HSCs were cultured on plastic in Dulbecco's modified Eagle medium (DMEM; Gibco; Thermo Fisher Scientific, Waltham, MA) supplemented with 10% FCS and 1% antibiotic/antimycotic solution (Gibco; Thermo Fisher Scientific). After 4 h incubation at 37°C and 5% CO2, HSCs attached to the plastic surface were washed and harvested for day 0 samples. For harvesting cells at later time points, the HSCs were cultured for the indicated time periods in the presence of 10% FCS on plastic dishes. HSCs received fresh medium every 2 to 3 days and were harvested on days 1, 3, and 7. Sinusoidal endothelial cells (SEC) and liver macrophages (Kupffer cells/KC) were also isolated from rat liver by collagenase CLS type I (Biochrom, Berlin, Germany) and pronase E (Merck) perfusion. The resulting cell suspension was subjected to density gradient centrifugation (20.5% Nycodenz). SEC and KC were then separated from each other by centrifugal elutriation [32]. SEC were cultured in endothelial cell growth medium (PromoCell, Heidelberg, Germany) on collagen type 1-coated culture dishes (Becton Dickinson Labware, Bedford, UK) and KC were maintained on plastic dishes using DMEM supplemented with 10% FCS and 1% antibiotic/antimycotic solution. Parenchymal cells (PC) were isolated after perfusion and digestion of rat liver by collagenase CLS type II (Biochrom) followed by centrifugation at 44g [33]. Bone marrow MSCs (bmMSCs) were obtained by flushing out long bones of rats. Hematopoietic cells were removed by washing and the remaining adherent bmMSCs were cultured on collagen type 1-coated plastic dishes in MSC expansion medium (No. CCM004; StemXVivo Mesenchymal Stem Cell Expansion Medium; R&D Systems).
Immunofluorescence analysis
In addition to their typical cell morphology showing membrane-coated lipid droplets encircling the cell nucleus, the purity of cultured rat HSCs was determined by ultraviolet-light excitation, since vitamin A stored by freshly isolated HSCs (quiescent) emitted fluorescence light. Moreover, the presence of molecular markers characteristic for quiescent (Sparcl1) or activated (αSma) HSCs were analyzed by immunofluorescence at indicated time points. For this, HSCs cultured on plastic were washed with phosphate-buffered saline (PBS) and fixed with ice-cold methanol for 5 min (αSma) or 4% formalin for 10 min (Sparcl1). After blocking of unspecific binding by 10% FCS for 1 h at room temperature, primary antibodies against Sparcl1 (1:50; sc-514275; Santa Cruz Biotechnology, Dallas, TX) or αSma (1:100; M0851; Dako/Agilent, Santa Clara, CA) diluted in 2% FCS in PBS supplemented with 0.2% Saponin (Sigma-Aldrich, Taufkirchen, Germany) were added overnight at 4°C. The primary antibodies were then removed by washing with PBS and the cells were incubated with anti-mouse secondary antibodies labeled with Cy3 (1:200; AP192C; Millipore, Darmstadt, Germany) in the presence of 2% FCS for 2 h at room temperature. The cells were finally washed and covered by Fluoromount G (Southern Biotech, Birmingham, AL) containing 4’,6-diamidino-2-phenylindole (DAPI) using glass cover slips.
Gene expression arrays
Total RNA was extracted from HSCs cultured for 4 h (freshly isolated, day 0), 1 day (quiescent), 3 days (early activated), and 7 days (activated) using the RNeasy Mini Kit (Qiagen, Hilden, Germany). The RNA quality was determined by separation of total RNA on agarose gels and NanoDrop analysis (Thermo Fisher Scientific). The Affymetrix GeneChip Rat Gene 2.0 ST gene expression analysis (Affymetrix, Santa Clara, CA) was performed by the Genomic Core Facility of the EMBL in Heidelberg (Germany). Raw data were analyzed with Affymetrix Expression Console Software (version 1.4.1) and Affymetrix Transcriptome Analysis Software (version 3.0). The gene expression arrays were performed with three independent HSC preparations. The raw data of the arrays can be obtained from the ArrayExpress database (
Quantitative PCR analysis
The results of the gene expression arrays were verified for genes that exhibited significant gene expression changes of at least a twofold. Selected genes were verified for HSCs cultured for 1, 3, and 7 days by quantitative PCR (qPCR). Freshly isolated HSCs were excluded from this analysis, because these samples showed a differential expression of housekeeping genes in comparison with samples from cultured HSCs, leading to difficulties in normalizing the obtained data [34]. The RevertAid H Minus First Strand cDNA Synthesis Kit (Thermo Fisher Scientific) was used to convert 400 ng of total RNA per 20 μL reaction buffer into complementary DNA (cDNA). Random hexamer and oligo (dT)18 primers were both implicated in the reaction in equal amounts. Subsequently, qPCR was performed with the TOptical Cycler (Analytik Jena AG, Jena, Germany) and the samples were measured in triplicates.
Maxima SYBR Green qPCR Master Mix (Thermo Fisher Scientific) was used for the PCR reaction, which contained 5 ng cDNA and 0.6 μM of the appropriate primer pair. The sequences of all expression primers are listed in Supplementary Table S1. The PCR program started with an initial denaturation at 95°C for 10 min followed by 45 cycles, including 20 s for denaturation at 95°C, 20 s for primer annealing at 58°C, and 30 s for elongation at 72°C. To evaluate the product quality, a melting curve analysis was performed after amplification. Analysis of the raw data was done by the 2(−ΔΔCt)-method using the expression of the housekeeping gene ribosomal protein S6 (Rps6) for normalization. The expression of HSCs at day 1 was set to 100%.
Genome-wide DNA methylation
Analysis of the genome-wide DNA methylation was based on an improved version of Reduced Representation Bisulfite Sequencing (RRBS) method [35]. Sequencing and data processing were part of the Methyl-MiniSeq service provided by Zymo Research (Leiden, Netherlands). Further analysis of the data was done with Microsoft Office Excel. The DNA of freshly isolated (day 0) and 3 days cultured HSCs was purified with DNeasy Blood and Tissue Kit (Qiagen) and analyzed as described [22]. This analysis was expanded for cytosine-guanine (CpG)-rich regions in exons and introns. Methyl-MiniSeq was performed with a single representative HSC preparation and verified for selected genomic regions by bisulfite conversion and sequencing. The quality of the DNA methylation array was evaluated as described [22].
Bisulfite conversion and bisulfite sequencing
To verify the Methyl-MiniSeq results, the DNA methylation changes of selected genes were analyzed in three independent HSC preparations using direct bisulfite sequencing. DNA was obtained from HSCs cultured on plastic for 4 h (day 0) or 3 days. ZR-Duet™ DNA/RNA Mini Prep Kit (Zymo Research, Freiburg, Germany) was used for DNA isolation. Bisulfite conversion was performed with the EpiTect Bisulfite Kit (Qiagen). Converted DNA was afterward subjected to bisulfite PCR using Maxima Hot Start PCR Master Mix (Thermo Fisher Scientific). Every PCR was performed with 31.25 ng bisulfite-converted DNA and 0.6 μM of an appropriate bisulfite PCR-specific primer pair (Supplementary Table S2).
Quality and specificity of the amplificates were evaluated on agarose gels, and the products were purified with the Wizard SC Gel and PCR Clean up System (Promega, Madison, WI). DNA sequencing was performed by a local facility of the Heinrich Heine University in Düsseldorf (Biologisch-Medizinisches Forschungszentrum). Sequencing results were further analyzed by the software BioEdit Sequence Alignment Editor (version 7.2.5). The methylation level of single cytosines was estimated using Mquant [36]. In particular, we subtracted the thymine value of the cytosine in a given CpG context from the mean thymine value of 10 surrounding thymine nucleotides. The division of the resulting value by the mean thymine value led to the relative DNA methylation level.
Gene ontology term analysis
Gene ontology (GO) term analysis was performed for differentially expressed and methylated genes. We used the term enrichment service of AmiGO 2.0, Panther Classification System 10.0 (
Western blot analysis
Western blot analysis was performed to evaluate the occurrence of Wt1, Dtx4, Notch1, and Notch3 at protein level. For each detection, 40 μg of whole protein lysates were separated by 12% or 8% sodium dodecyl sulfate polyacrylamide gels and blotted on nitrocellulose membranes. We used primary antibodies for Wt1 (MAB 4234; Millipore), Dtx4 (No. 25222-1-AP; Proteintech, Rosemont, IL), Notch1 (sc-6014; Santa Cruz), and Notch3 (No. 55114-1-AP; Proteintech). The detection was carried out using horseradish peroxidase (HRP)-coupled secondary antibodies goat-anti-mouse or goat-anti-rabbit, respectively (BioRad, München, Germany), and WesternBright Quantum HRP substrate (Advansta, Menlo Park, CA). Visualization and documentation were performed with ChemiDoc Imaging System (BioRad). The intensities of western blot protein bands were analyzed using the multiplex band analysis tool of the AlphaView software (ProteinSimple, San Jose, CA).
Statistical analysis
Values from 3 to 5 independent experiments were expressed as means, and their variation was indicated as standard error of mean. The significance of differences was determined with Student's t-test or analysis of variance and P values of <0.05 were considered significant.
Results
Gene expression changes during HSC activation
HSCs were isolated from rats and characterized with respect to their typical cell morphology with lipid vesicles containing fluorescent vitamin A and gene expression with Sparc-like 1 (Sparcl1) in their quiescent and α-smooth muscle actin (αSma) in their activated state (Supplementary Figs. S2 and S3). Genome-wide gene expression changes during culture-induced activation of rat primary HSCs were determined using the Affymetrix GeneChip Rat Gene 2.0 ST expression array. In total 30,429 genes were investigated. Demanding a gene expression change of at least twofold and a significance level of P < 0.05, 1,042 genes were upregulated between days 0 and 1 of HSC activation (Fig. 1A). During this time, the expression of 528 genes was significantly downregulated by more than twofold. The number of affected genes in HSCs decreased with time in culture. Between days 1 and 3, 709 genes showed increased expression, whereas 381 genes were downregulated (Fig. 1A). Later during activation between days 3 and 7, 215 genes were upregulated and 71 genes were downregulated. These results demonstrated that the majority of differentially expressed genes are upregulated between days 0 and 3, whereas a substantial lower number of genes were downregulated during early HSC activation.
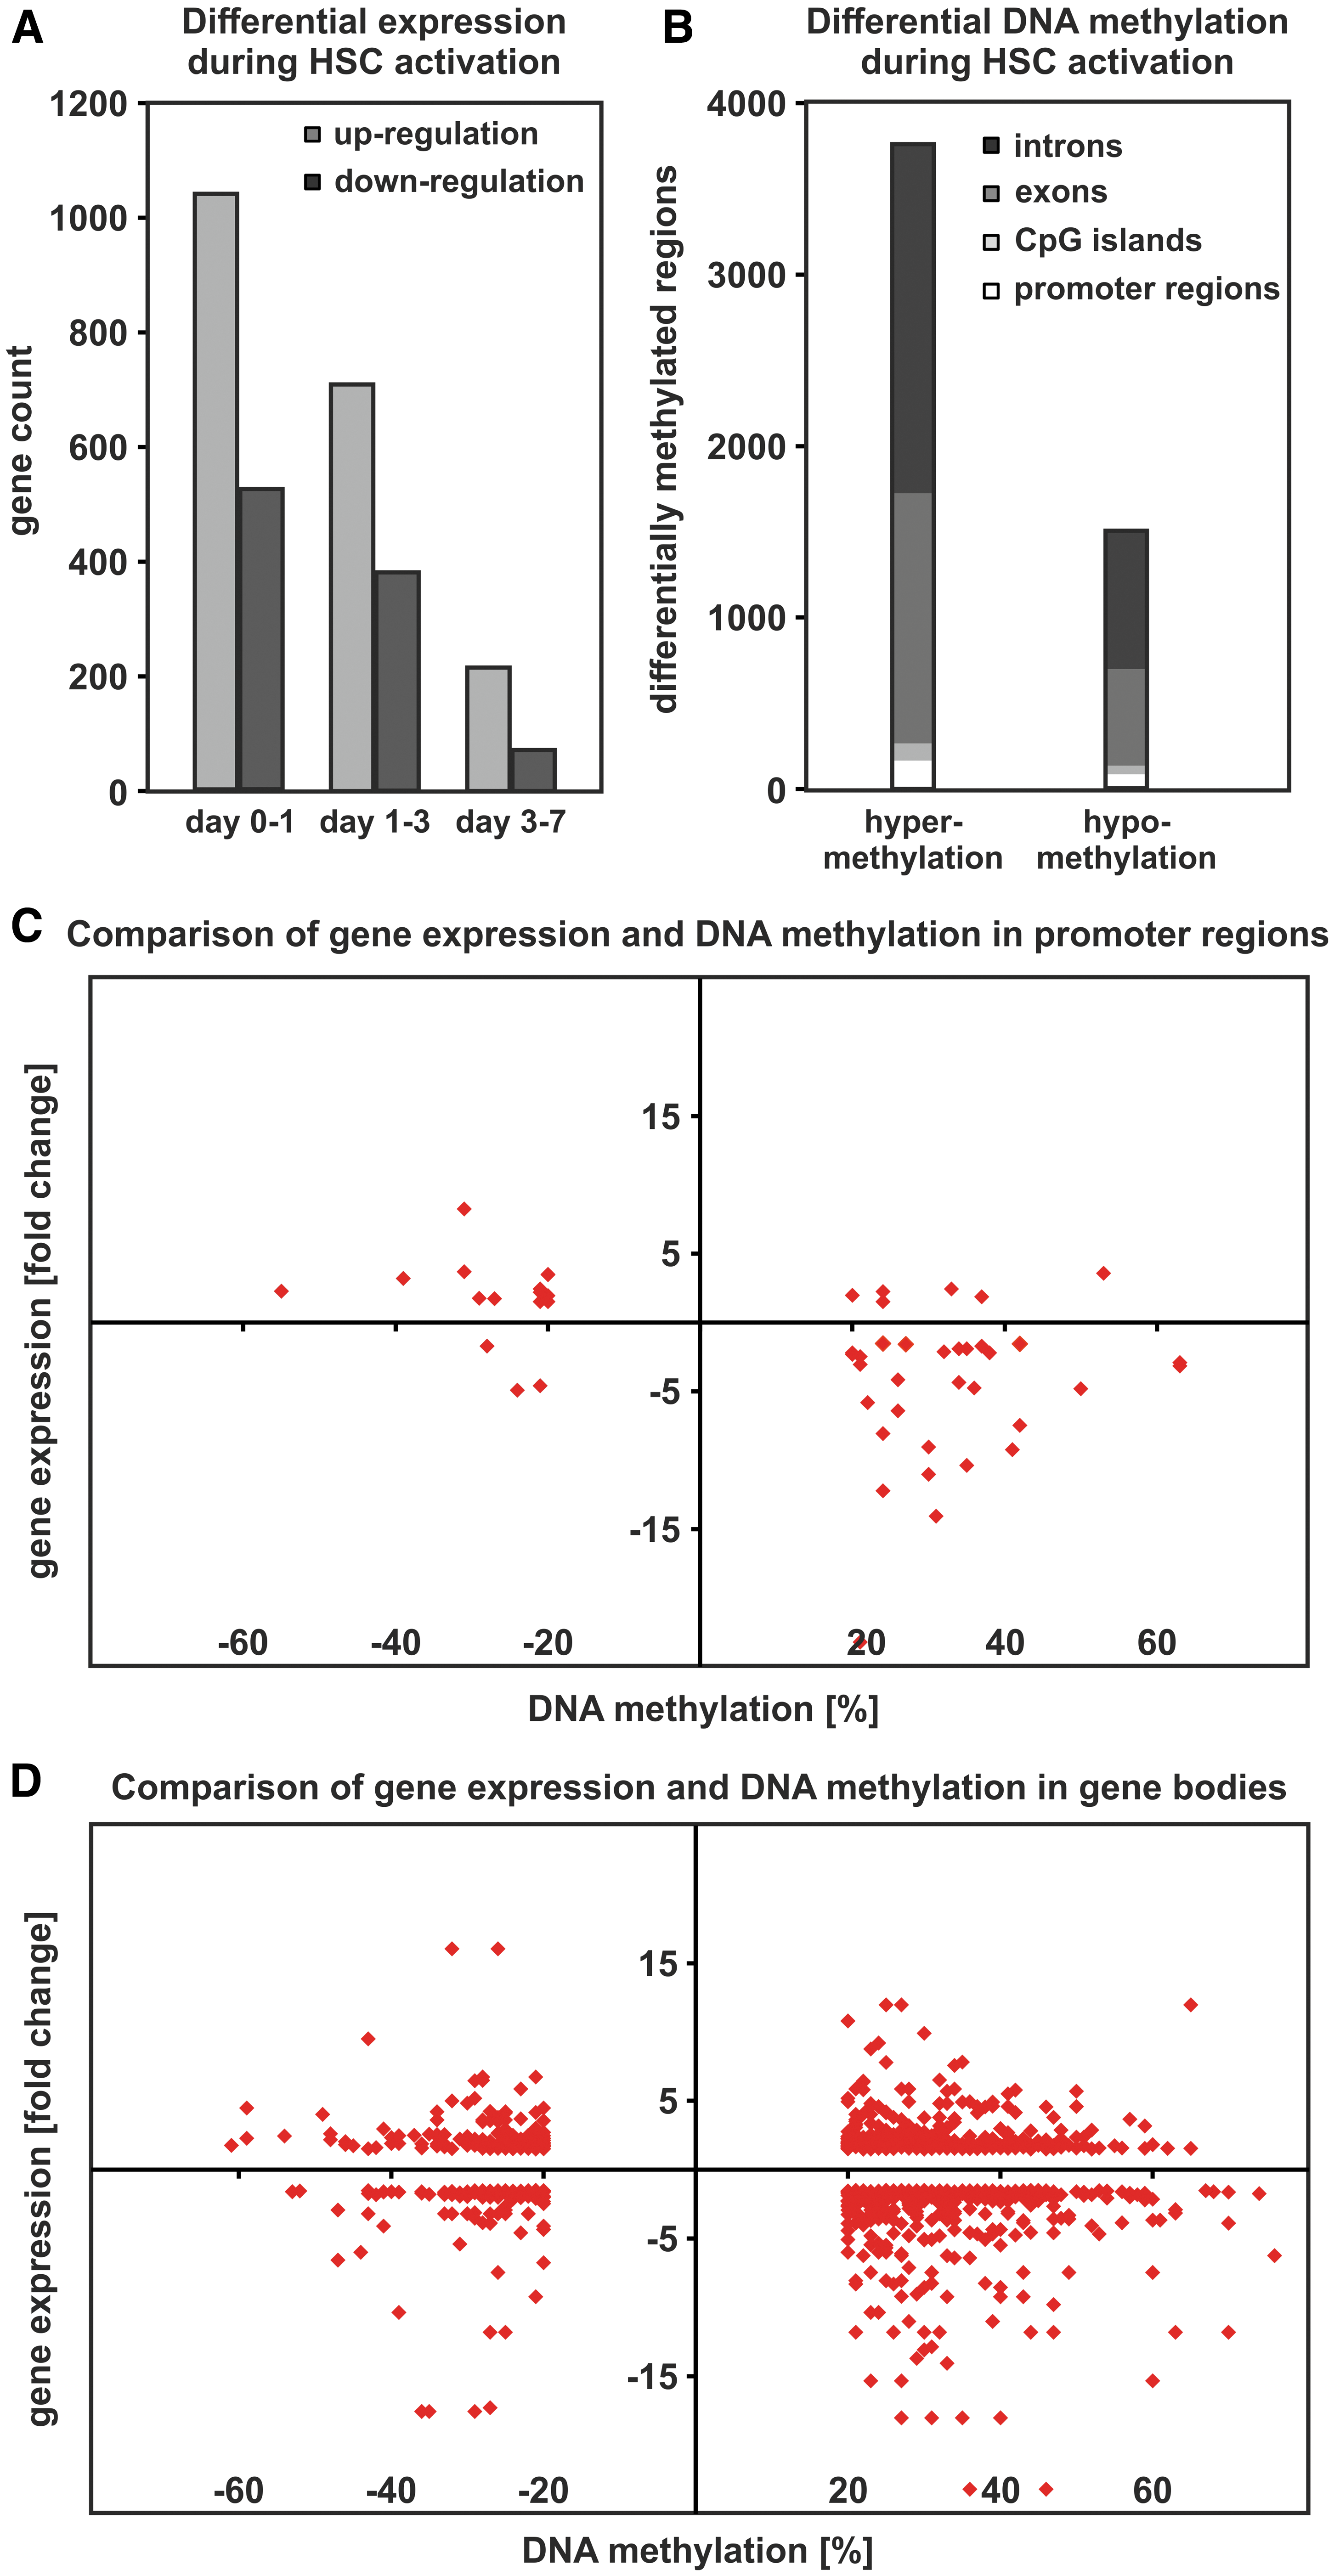
DNA methylation and gene expression changes during culture-induced HSC activation.
Hierarchical clustering of the differentially expressed genes showed that the genes can be clustered into groups (Fig. 2). Beside genes with a steady decrease or increase in gene expression, there were gene groups that exhibited a transient increase of expression at day 3. Within the group of genes with increasing expression, several genes are known to be involved in developmental processes (eg, bone morphogenetic protein 4/Bmp4), regeneration (eg, growth arrest-specific protein 6) and Wnt signaling (eg, cadherin-3) [37 –39]. In addition, genes influencing the immune system were found in this group (eg, lipopolysaccharide binding protein, CD84) [40]. Genes that underwent a transient upregulation were often involved in regulation and performance of the cell cycle (eg, kinetochore protein Nuf2, methyl methanesulfonate-sensitivity protein 22-like) [41,42], indicating that cell proliferation is an important process during the early phase of activation. Taken together, culture-induced HSC activation was accompanied by numerous gene expression changes, and the majority of differentially expressed genes were upregulated.
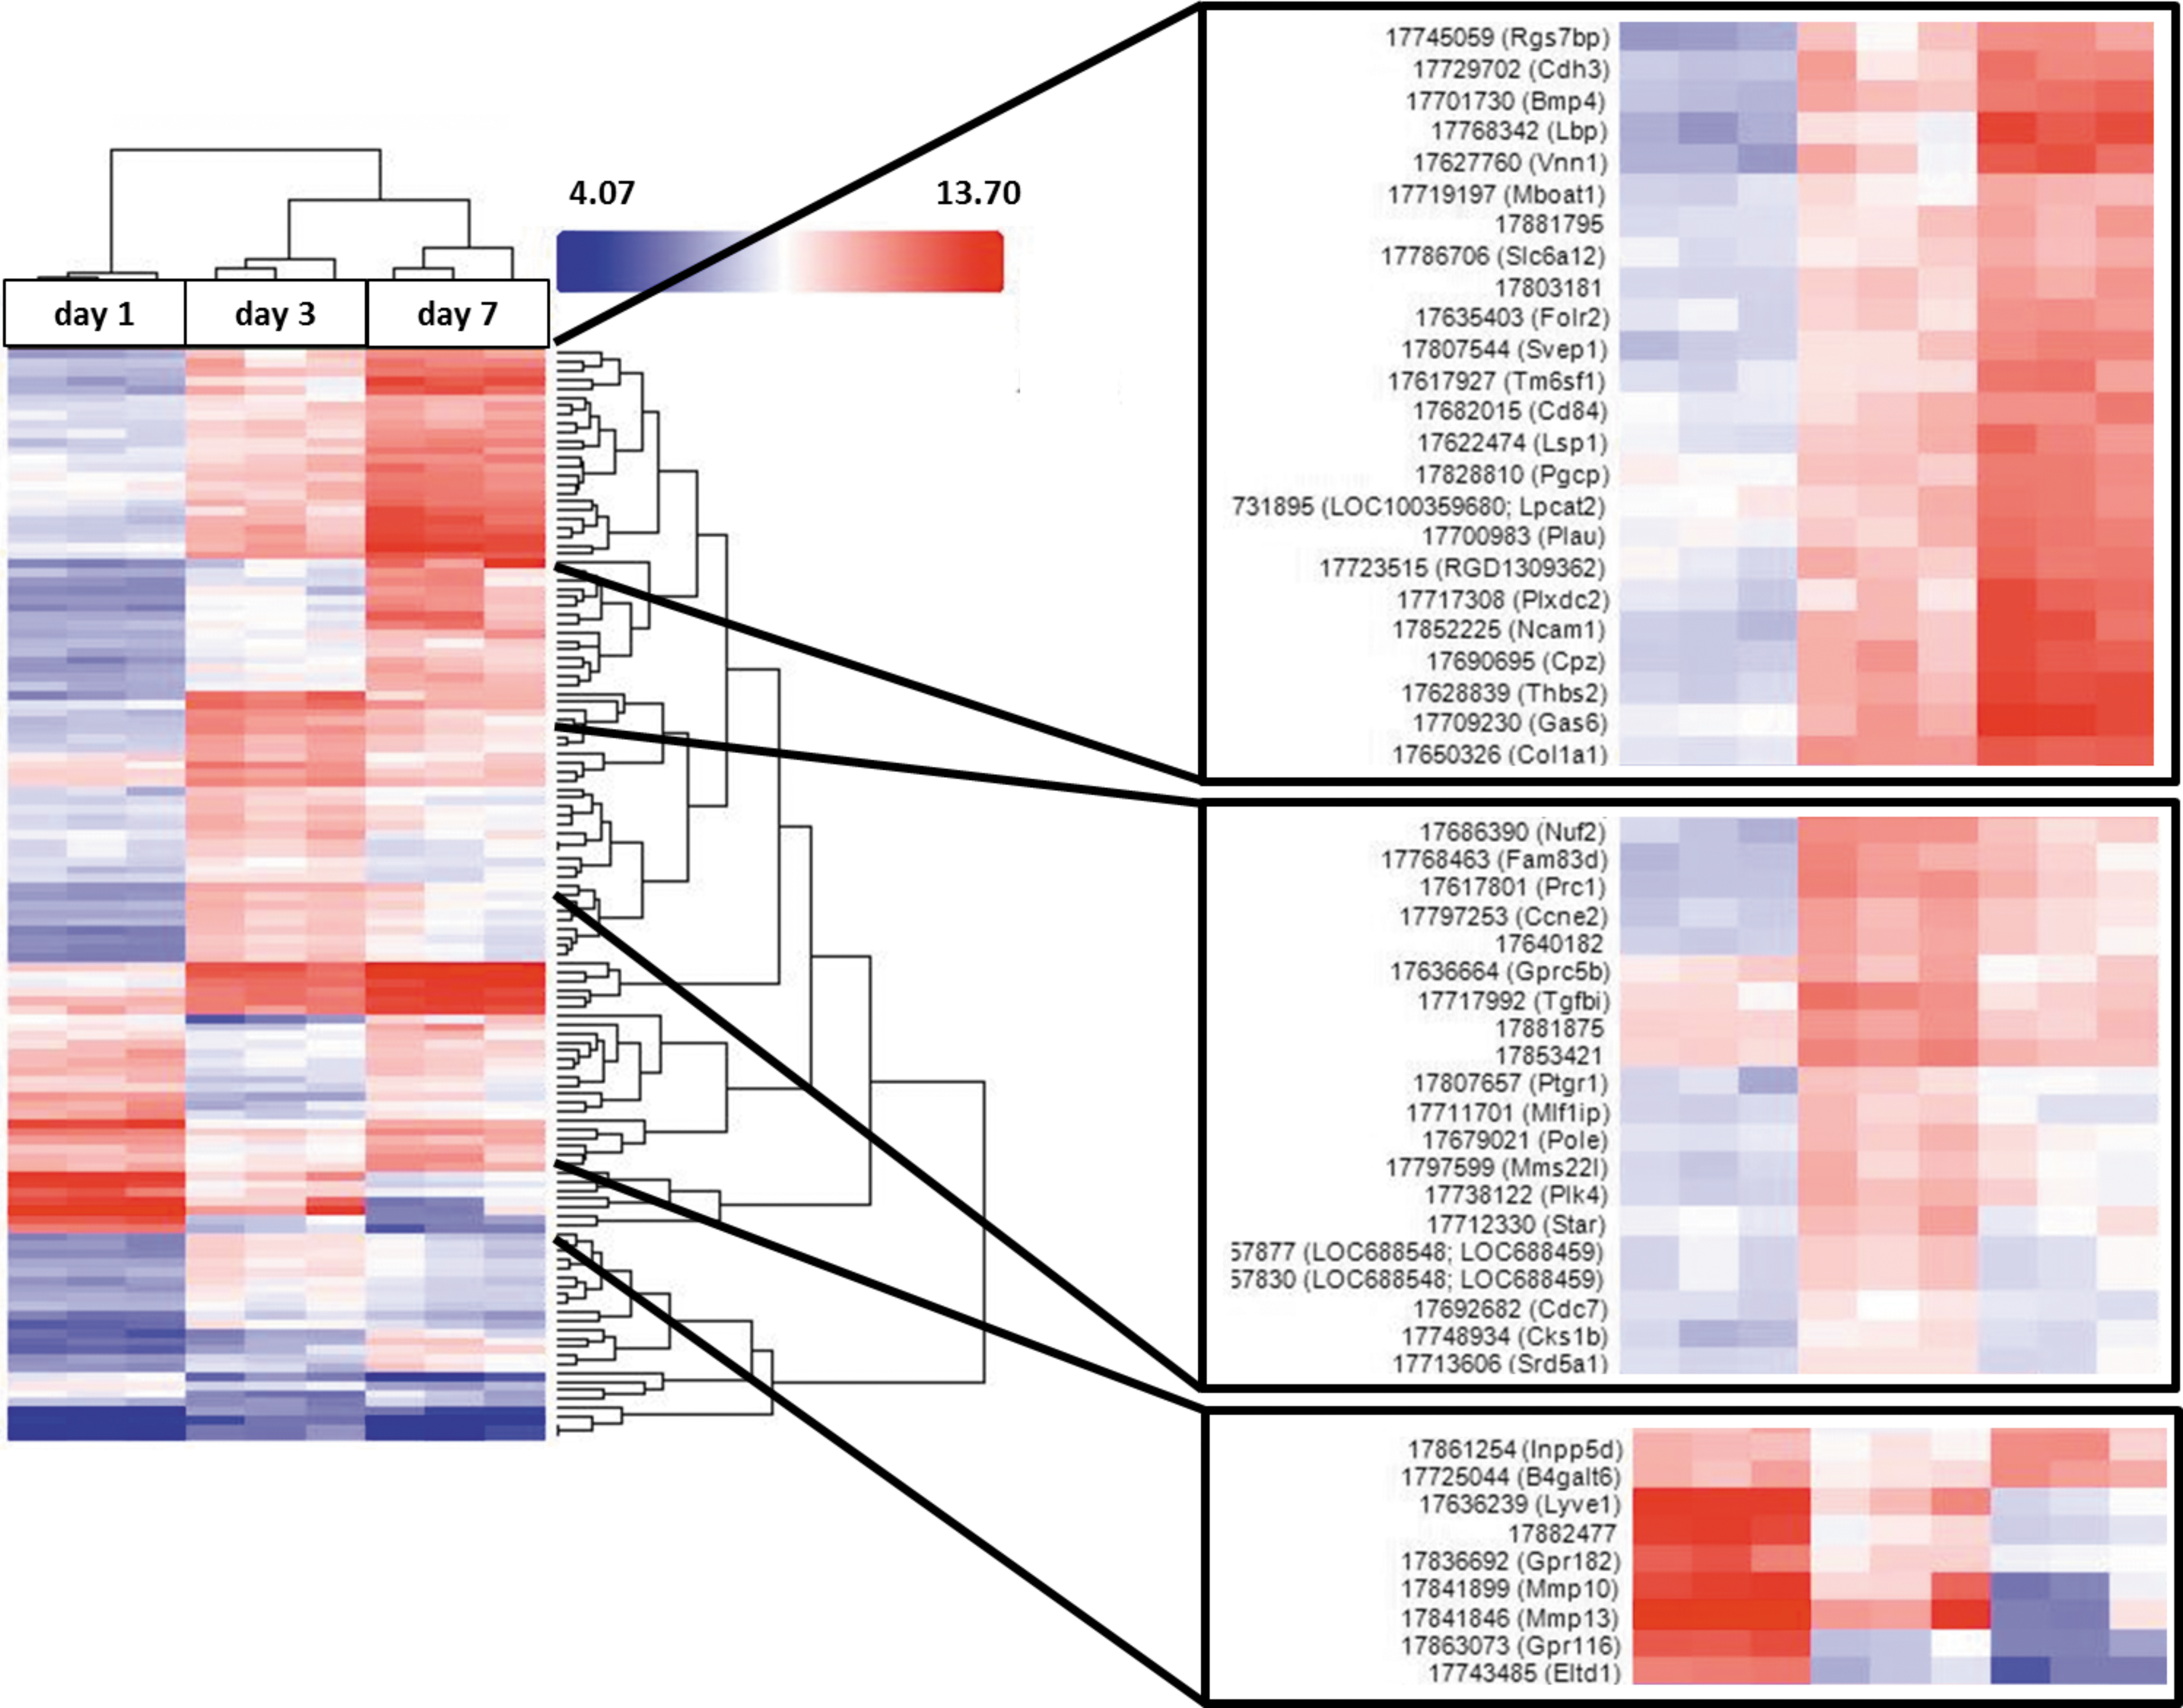
Hierarchical clustering of differentially expressed genes at days 1, 3, and 7 of HSC activation. The cluster was generated using Affymetrix Transcriptome Analysis Console, including all differentially expressed genes with a significantly (P < 0.05) altered expression of at least twofold (blue indicates low expression; red indicates high expression; n = 3 for each time point). Three groups of genes were magnified, illustrating groups of genes with a steady increase in gene expression (upper box), with temporarily increased expression at day 3 (middle box) and steadily decreased expression (lower box).
DNA methylation changes during HSC activation
Since gene expression can be regulated by DNA methylation, the dynamics of DNA methylation during culture-induced HSC activation were investigated. The first results of this analysis were reported in a recent publication [22], but for the present study the analysis was extended to intronic and exonic regions of the genome. All differentially methylated regions (DMRs) with a significant DNA methylation change of at least 20% that occurred between days 0 and 3 of culture-induced HSC activation were included. Between days 0 and 3 of HSC activation, we identified 248 DMR in promoter regions as well as 5,017 DMR within gene bodies, showing that the majority of DNA methylation changes took place in intronic and exonic regions of the genome (Fig. 1B). Interestingly, more than two-thirds of the DMR showed hypermethylation rather than hypomethylation. In promoter regions, hypermethylation was detected at 163 different positions, whereas hypomethylation was only detected at 85 positions. In gene bodies, 3,592 regions exhibited elevated and 1,425 regions showed diminished DNA methylation (Fig. 1B).
Concurrent changes in DNA methylation and gene expression
The next step of the analysis was to combine the data of differentially methylated and differentially expressed genes. Out of the genes with DNA methylation changes in promoter regions, 51 exhibited a concurrent change in gene expression (Fig. 1C). According to the well-established view that promoter methylation is associated with reduced gene expression, 57% of the genes showed increasing DNA methylation in promoter regions associated with decreasing gene expression. Another 25% of the genes showed the opposite relationship and exhibited decreasing DNA methylation associated with elevated gene expression. The remaining genes either showed a simultaneous increase (12%) or decrease (6%) of DNA methylation and gene expression. Furthermore, we identified 988 genes with a congruent change in gene expression and DNA methylation in the gene body, but failed to find a clear pattern of correlation (Fig. 1D). Although 34% of the genes exhibited DNA hypermethylation and gene expression increase, only 12% of the genes underwent a hypomethylation accompanied by a decreased expression. However, 38% of the genes were characterized by increasing DNA methylation and decreasing expression.
GO term analysis of differentially expressed and methylated genes
To gain more insight into the functional relevance of the observed changes, GO term enrichment analysis was performed. Important cellular processes were found to be represented by the differentially expressed genes. Both, up- and downregulated genes were enriched in the GO terms “response to stress,” “cell differentiation,” “cell migration,” as well as “regulation of secretion” (Table 1). Regarding the GO terms “extracellular matrix (ECM) organization,” “cell cycle,” and “wound healing,” only the set of upregulated genes were enriched. On the contrary, the GO term “immune system processes” was only found in the group of downregulated genes.
GO term analysis was performed with AmiGO 2.0. The table displays the number of genes that can be assigned to a certain GO term as well as the fold enrichment of a GO term in the analyzed data set in comparison to its occurrence in the rat genome. GO term analysis was performed by comparison of gene expression arrays of HSC at days 1 and 3 (n = 3). DNA methylation arrays of HSC samples at days 0 and 3 of culture were subjected to GO term analysis using one representative data set. The P value gives information about the significance of the fold enrichment value.
ECM, extracellular matrix; GO, gene ontology.
The GO term analysis for the DMRs revealed that they were associated with genes involved in GO terms such as “cell differentiation,” “response to stress,” “immune system processes,” “cell migration,” “regulation of protein secretion,” “wound healing” and “ECM organization” (Table 1). Out of 3,180 differentially methylated genes analyzed for GO term enrichment, 820 could be assigned to the GO term “cell differentiation,” resembling the highest number among the above-mentioned GO terms.
Epigenetic regulation of selected genes
DNA methylation and gene expression data obtained from the genome-wide arrays were validated for selected genes with qPCR and bisulfite sequencing. For all genes examined, the results of the arrays were confirmed (Table 2). We could show that intragenic DNA methylation correlated positively with gene expression during HSC activation. The Sparcl1 gene revealed decreased DNA methylation of almost 40% in an intron (Supplementary Fig. S4H), congruently the gene expression decreased to 15% from days 1 to 7 of HSC activation (Supplementary Fig. S4G). On the contrary, the genes Wt1, Bmp4, and extracellular sulfatase 2 (Sulf2) were hypermethylated in intragenic regions and displayed increased expression. Sulf2 had an increasing DNA methylation of 30% (Supplementary Fig. S4J), while its expression increased by about 30-fold in relationship to quiescent HSCs (Supplementary Fig. S4I). The intron of Bmp4 underwent DNA hypermethylation of 28% (Supplementary Fig. S4B), and the Bmp4 gene displayed elevated expression by more than 60-fold (Supplementary Fig. S4A). Wt1 underwent a comparable DNA hypermethylation of 28% and its expression strongly increased, showing the highest expression in activated HSCs in comparison to other liver cell types (Fig. 3A, B). Elevated expression of Wt1 was also detected on protein level at days 3 and 7 of HSC activation in vitro (Fig. 3C, D). We identified two genes, neuropilin 2 (Nrp2) and tyrosine-kinase receptor 1 (Tie1) that exhibited increasing DNA methylation in the gene body (Supplementary Fig. S4F, L) and decreasing gene expression (Supplementary Fig. S4E, K), contradicting the general view that gene-body methylation is associated with elevated transcription.
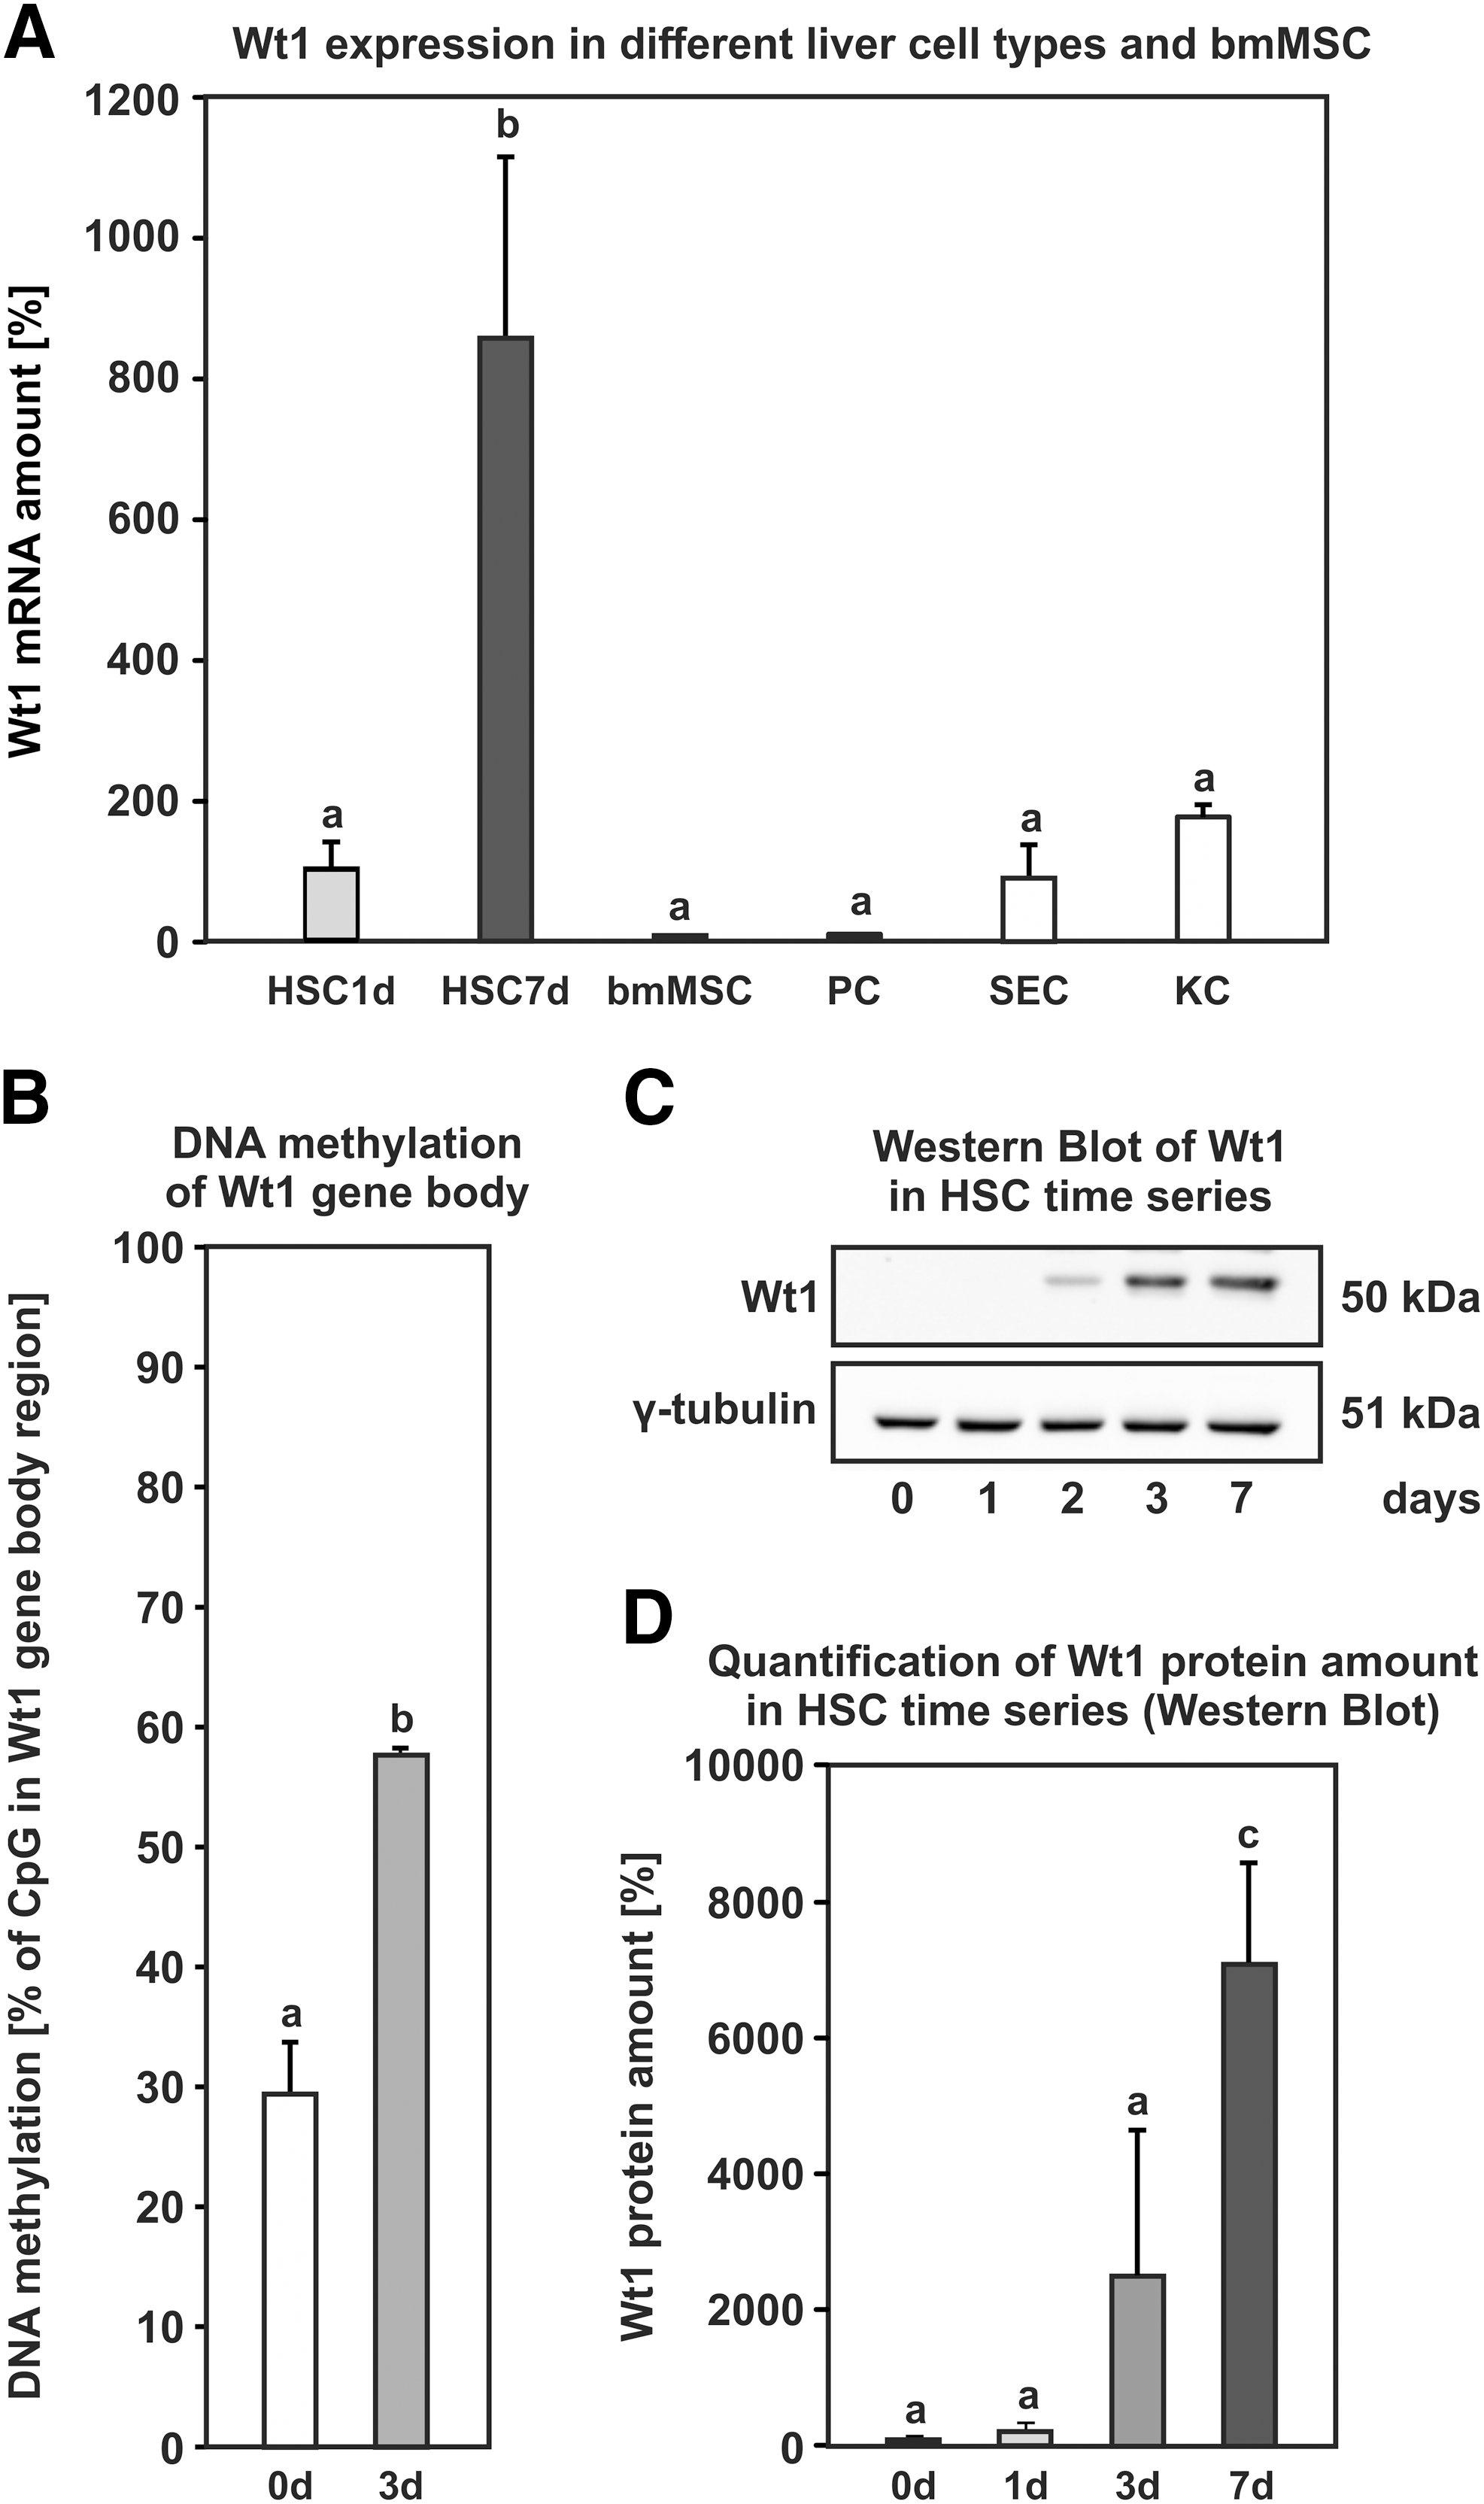
Epigenetic regulation of Wt1 expression.
Dynamic DNA methylation was detected with EpiQuest Methyl-MiniSeq DNA methylation assay, which was performed once for representative HSC preparations, and verified with bisulfite sequencing for selected genes (n = 3; HSC days 0 and 3). Gene expression changes were detected by the Affymetrix GeneChip Rat Gene 2.0 ST (n = 3) and verified by qPCR (n = 3–5; HSC days 1 and 3). Detailed illustration of the bisulfite sequencing and gene expression data are displayed in Supplementary Fig. S4.
DMR, differentially methylated region; HSC, hepatic stellate cell; qPCR, quantitative PCR.
In contrast to gene-body methylation, promoter methylation was negatively correlated with gene expression. The promoter for the lymphatic vessel endothelial hyaluronic acid receptor 1 (Lyve1) exhibited increased promoter methylation by 38% (Supplementary Fig. S4D), and the gene expression was reduced accordingly to almost zero (Supplementary Fig. S4C). The promoter of Dtx4 showed decreased DNA methylation by 21% during HSC activation with a concomitant increase in gene expression by more than threefold (Fig. 4A, B). The increase in gene expression is reflected by elevated protein amount on days 3 and 7 of HSC activation as determined by western blot analysis (Fig. 4C, D). As described for Wt1, activating HSCs was the cell type with the most prominent Dtx4 expression in the liver, and Dtx4 was also found to be expressed in bone marrow-derived MSCs from rats (Fig. 4A). Since Dtx4 is a known regulator of Notch signaling, we determined the expression of the different Notch isoforms during HSC activation (Fig. 5A). Notch1 and Notch4 showed decreased expression during HSC activation, while Notch3 exhibited a strong increase at messenger RNA (mRNA) level and Notch2 remained unaffected (Fig. 5A). The results for Notch1 and Notch3 were validated at protein level by western blot analysis. The membrane-bound forms of Notch1 and Notch3 receptors at ∼120 kDa were found to be regulated in a similar way as observed by qPCR (Fig. 5B–D).
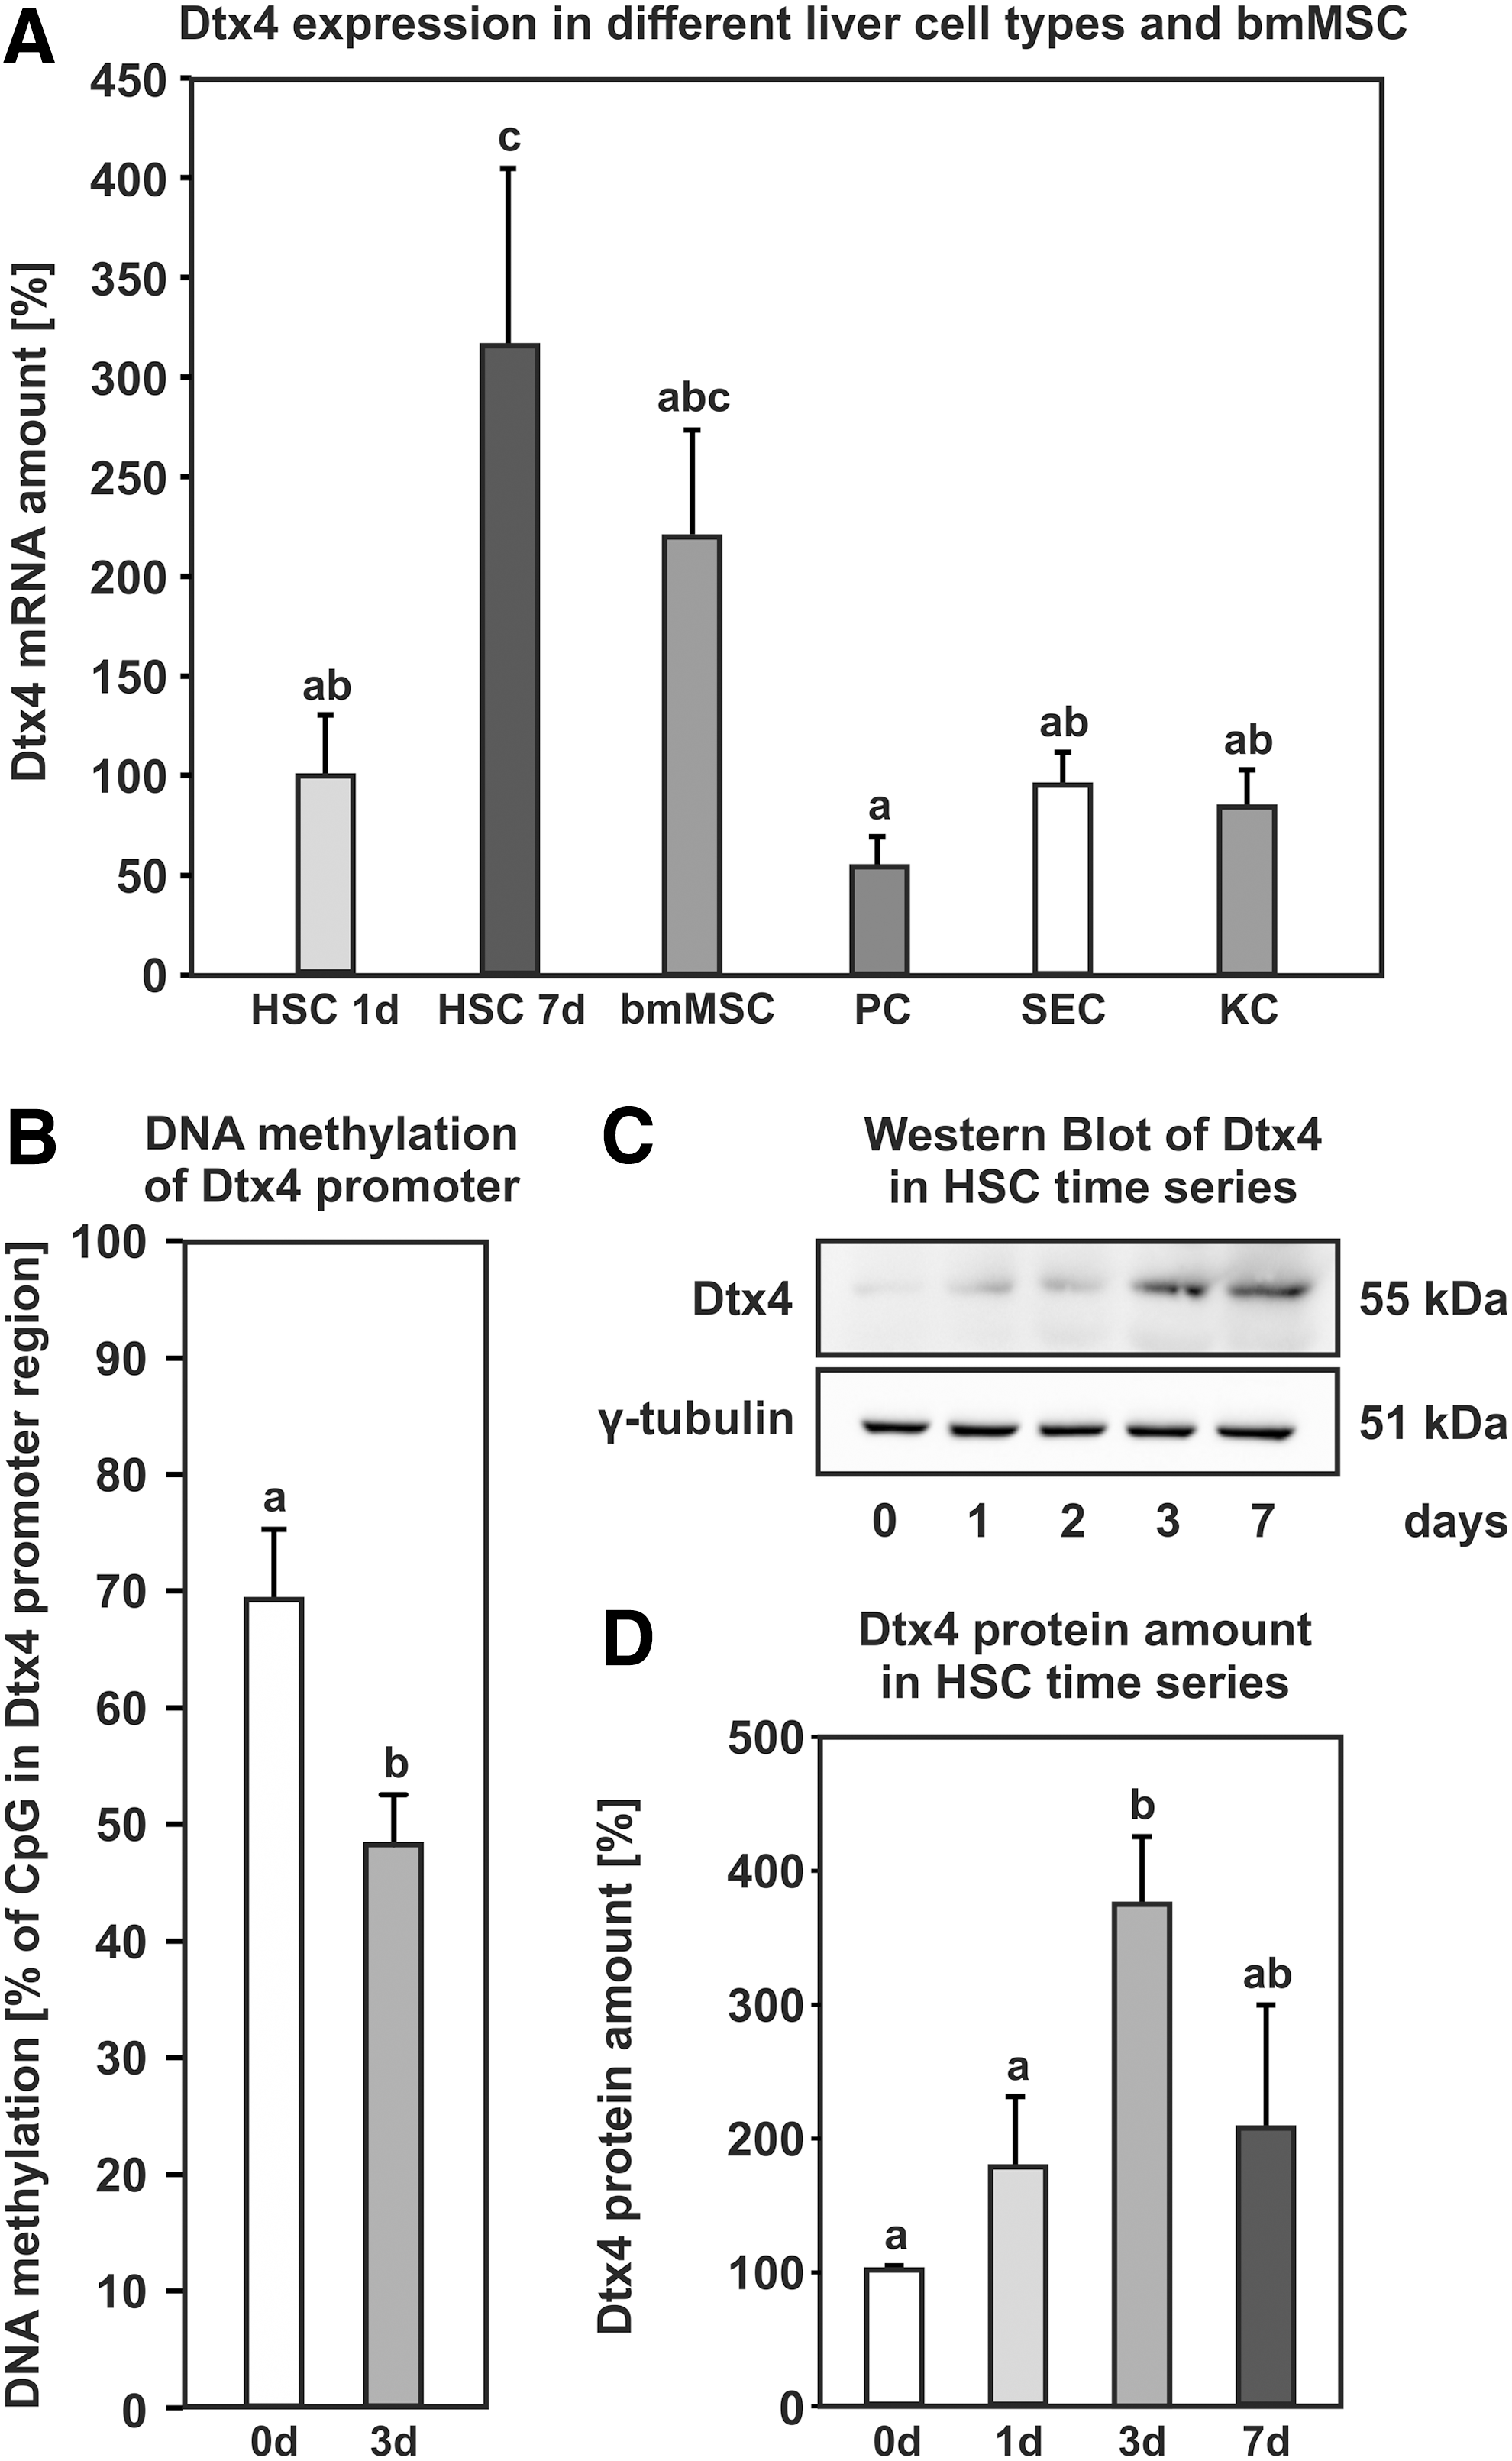
Epigenetic regulation of Dtx4 expression.
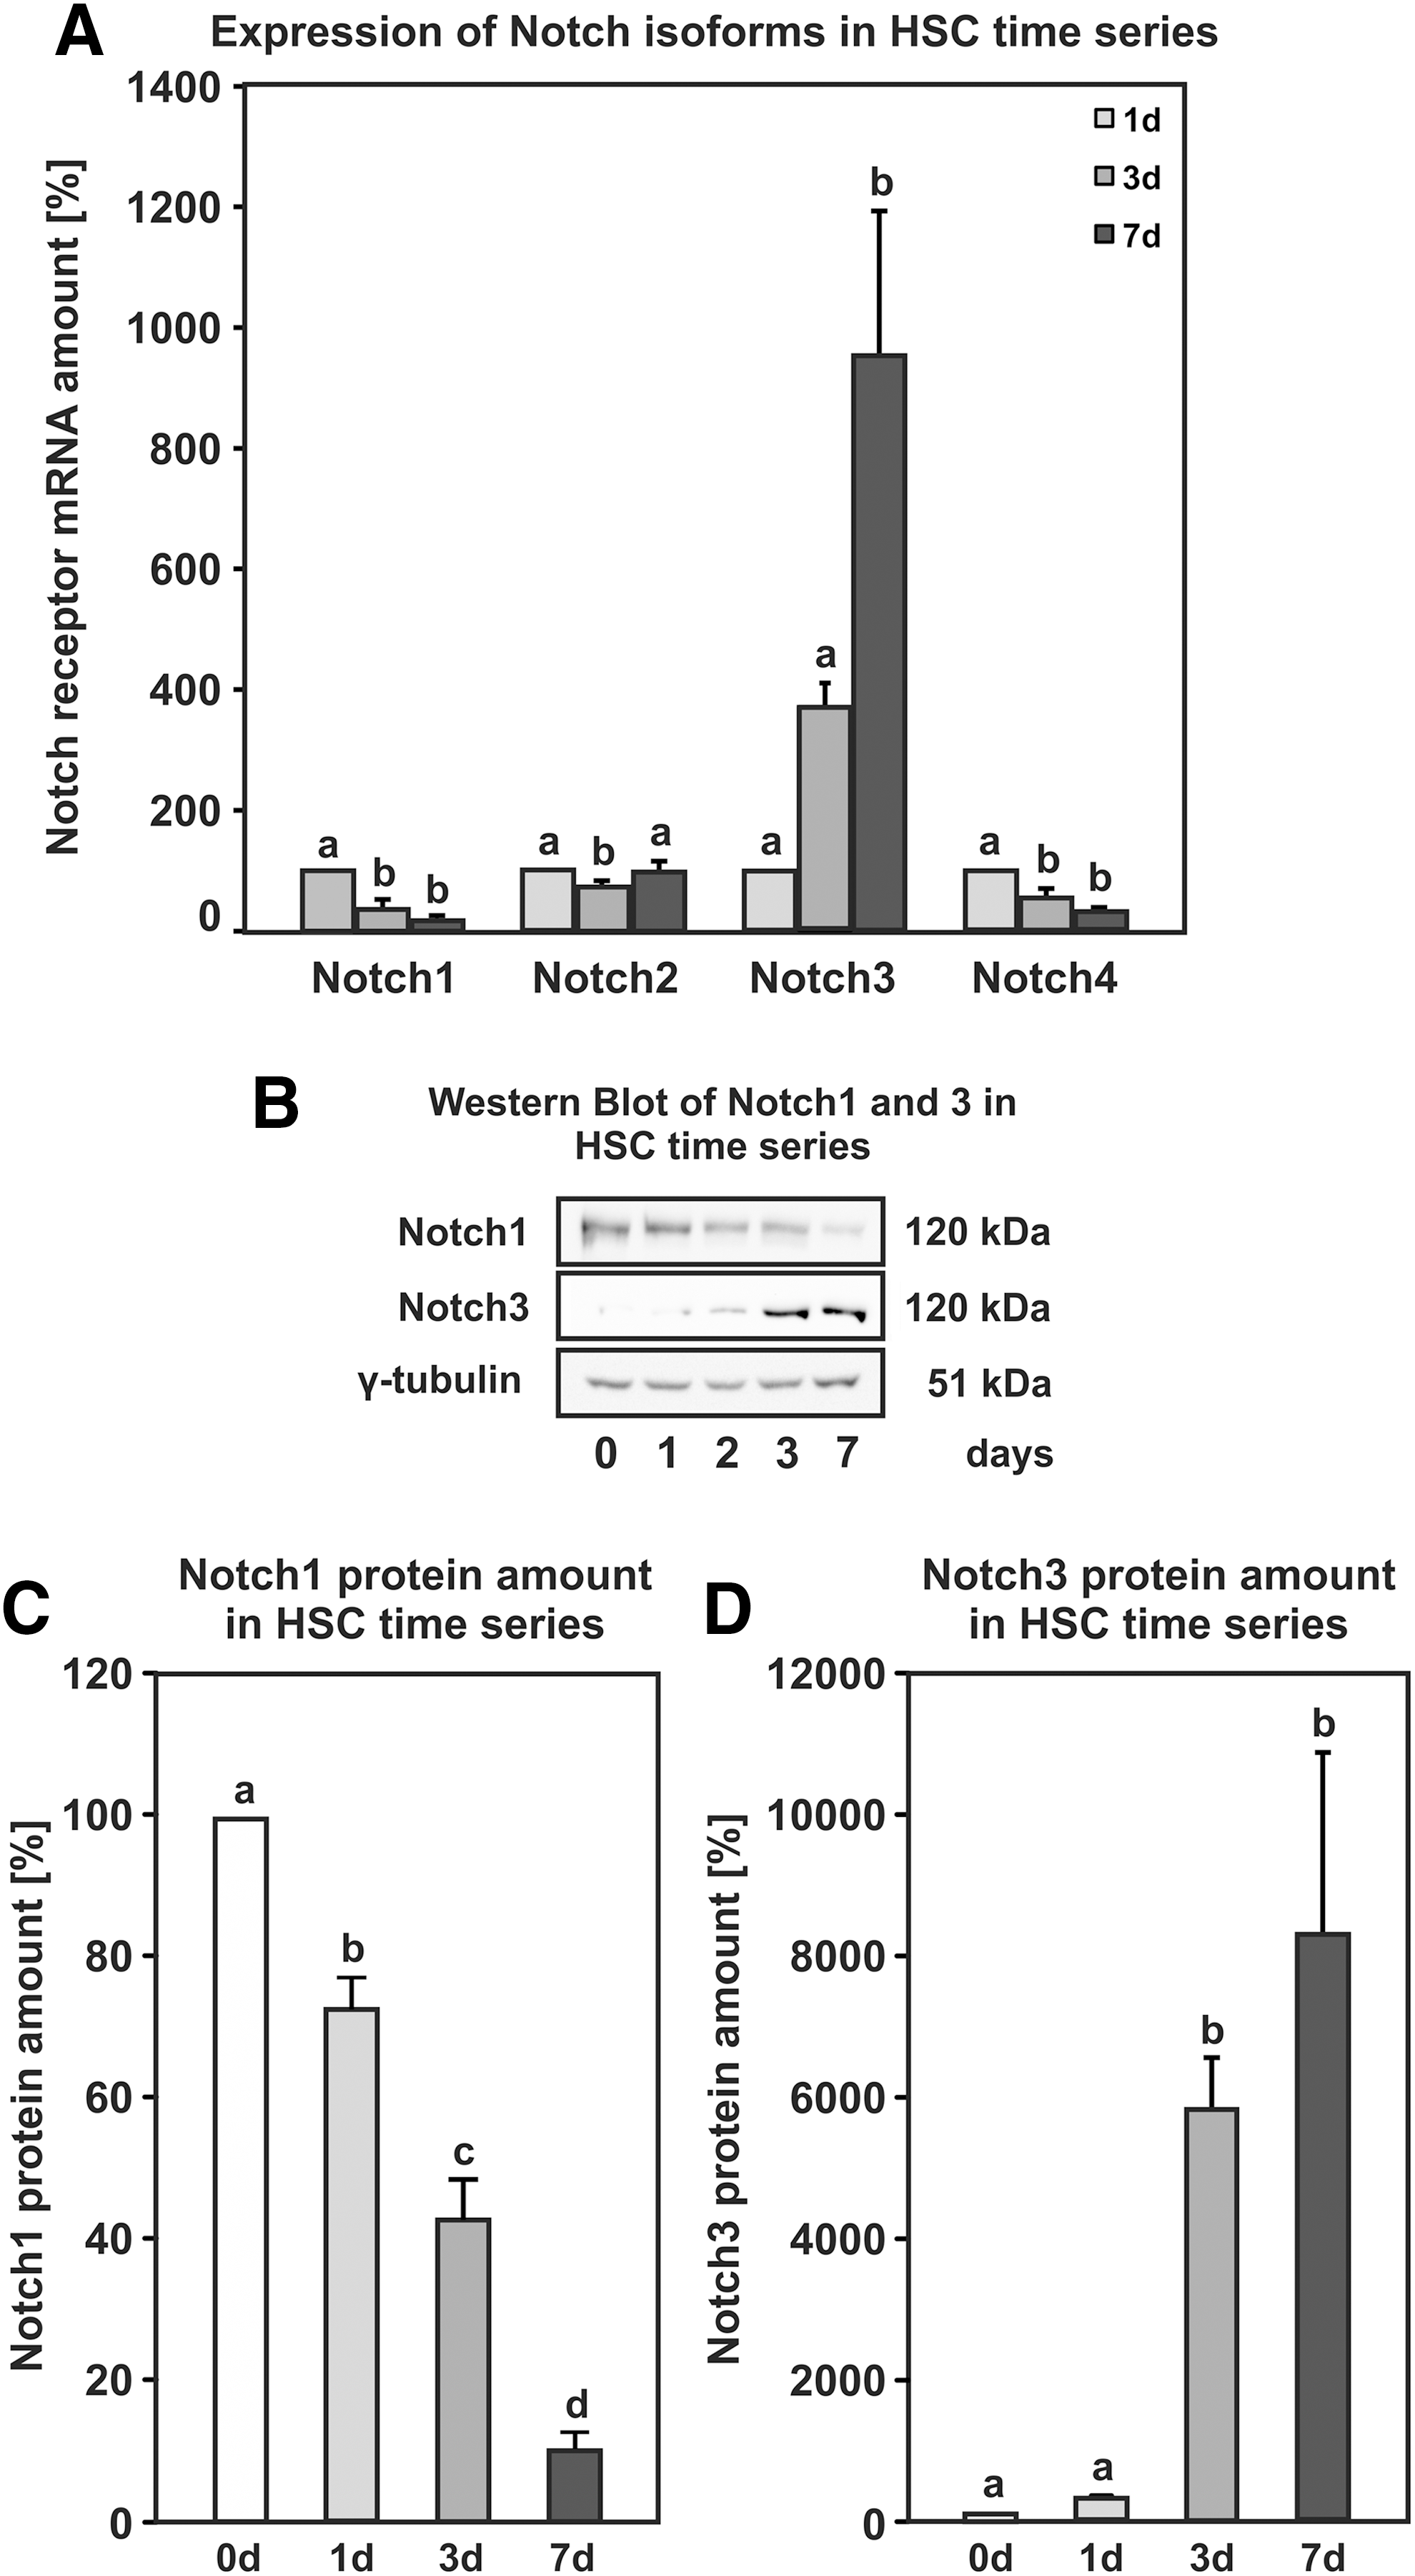
Dynamics of Notch signaling during culture-induced HSC activation.
Discussion
Activation of quiescent HSCs is a critical step for their development into myofibroblast-like cells and occurs after acute and chronic liver injury. In this study, we examined genome-wide dynamics of DNA methylation and gene expression during HSC activation and could demonstrate that HSC activation was accompanied by remarkable changes within methylome and transcriptome. While the majority of differentially expressed genes became upregulated, most of the DMR underwent hypermethylation and were located within the gene body rather than promoter regions. Promoter methylation was negatively correlated with gene expression, when all differentially methylated promoters with altered expression of individual genes were taken into consideration. When we analyzed the relationship of gene-body methylation and gene expression, we could not detect a clear pattern of regulation. This indicates that gene-body methylation may have functions beyond direct gene expression regulation. In a recent review, several studies were listed that suggest a potential role of DNA methylation in mRNA splicing [43]. Exons and introns seem to be distinguished by differential DNA methylation levels. This enables the discrimination of introns and exons as well as the recruitment of different factors that promote alternative exon inclusion or exclusion, respectively [43]. Furthermore, a study by Bogdanovic et al. [44] showed that DNA methylation of enhancers positioned in introns or exons is involved in the regulation of gene expression during vertebrate embryogenesis.
GO term analysis revealed that both, differentially expressed genes and DMR can be assigned to the same GO terms, namely “differentiation,” “stress,” “cell migration,” “ECM organization,” “wound healing,” and “immune system processes.” This indicates a functional connection between DNA methylation dynamics and gene expression changes. It is conceivable that the isolation and culturing procedures induce cell stress, which could explain the high number of stress-associated genes showing differential expression. Moreover, the identified GO terms specifying biological functions such as “ECM organization” and “wound healing,” which are well known for activated stellate cells, underline the importance of epigenetic mechanisms regulating the activation process. The most striking result of GO term analysis was a remarkable number of genes with altered DNA methylation and gene expression that are associated with cell differentiation processes. Activating HSCs acquire the expression profile of MSCs and can fulfill typical functions of bmMSCs [12]. Furthermore, in vitro- as well as in vivo-activated HSCs upregulate their nestin expression [45], which is defined as a multilineage progenitor cell marker and seems to be a prerequisite for several differentiation processes [46]. In the present study, the activation of HSCs was obviously associated with mechanisms involved in cell differentiation, which could be important for initiating cell development and subsequently a contribution of HSCs to liver regeneration.
We identified Wt1 as an epigenetically modified and differentially expressed gene during HSC activation. The discussion about the embryonic origin of HSCs is lively and this question is not answered definitely yet. Asahina et al. [47] used a tamoxifen-driven LacZ construct to tag Wt1-positive cells of the septum transversum in mouse embryonic development and showed that these cells migrated into the developing liver and gave rise to desmin-expressing HSCs and perivascular mesenchymal cells. By upregulation of Wt1 expression, HSCs obviously regain the gene expression pattern of their cell of origin, to become a multipotent MSC again. Assuming the discrimination between an active and a potential stem cell state as postulated by Huch and Dollé in a recent review [48], we conclude that quiescent HSCs are stem cells in a resting state, which reacquire stem cell criteria found in MSCs of the bone marrow by activation. Wt1 is mainly known as a tumor suppressor gene that is mutated in Wilm's tumors [49], but is also capable to interact with the methylcytosine dioxygenase Tet2, but not Tet1 [50]. Tet2 can be recruited to Wt1 target genes to mediate DNA demethylation and transcriptional activation. HSCs undergo a global DNA demethylation of about 60% during the in vitro activation process and many genes undergo hypomethylation [22]. It will be interesting to examine if WT1 acts as a transcription factor that induces DNA demethylation in cooperation with members of the Tet family during HSC activation.
Besides Wt1, Dtx4 is another interesting gene showing epigenetic regulation and mRNA upregulation during HSC activation. Dtx4 is a member of the Deltex family, which is known to regulate Notch signaling. Since Notch signaling is a highly conserved pathway regulating cell fate, Dtx4 is probably an important factor for the control of developmental fate decisions in HSCs. In rats, four different Notch receptors Notch1–4 exist [51], which are implicated in lineage specification of cholangiocytes and hepatocytes and are deregulated in hepatocellular carcinoma [52,53]. The four Notch receptors seem to fulfill different functions during proliferation, and differentiation of hepatic progenitor cells [54], Notch1, Notch2, and Notch4 increase cell growth, but inhibit the differentiation into hepatocytes, while Notch3 mediates opposing effects, inhibition of cell growth, and enforcement of the differentiation process. The Notch receptors were differentially regulated during HSC activation. While the expression of Notch1 and Notch4 was downregulated, the expression of Notch2 was unaffected and Notch3 expression increased. This observed switch in Notch signaling is consistent with observations made after partial hepatectomy, which leads to Notch1 downregulation [55]. Notch3 expression is induced in activating HSCs and apparently involved in the regulation of the activation process [56,57]. The interaction between Deltex and Notch is best examined in Drosophila melanogaster and was established to convey positive or negative regulation of Notch, which depends on the cellular context and interacting molecules. As a positive regulator of Notch signaling, Deltex interacts with the membrane bound Notch receptor and mediates the nuclear translocation of suppressor of hairless, an effector protein in Notch signaling [58]. In contrast to these results, Deltex was found to colocalize with β-arrestin, shrub, and Notch in intracellular vesicles. In these vesicles, Notch gets polyubiquitinylated presumably resulting in proteasomal degradation, while the sole binding of Deltex to Notch leads to ligand-independent signaling [59,60]. It will be interesting to identify interacting partners of Notch receptors during HSC activation. In addition, Deltex appears to control the expression of Bmp4, which was also identified to be epigenetically regulated in our assays. Dtx4 promotes and maintains the Bmp4 expression during neural crest formation in quail embryogenesis [61]. The finding that Dtx4 as well as Bmp4 expression is upregulated during HSC activation strengthens the idea that Dtx4 is probably functionally active in liver regeneration.
DNA methylation seems to be a key mechanism in the regulation of pluripotency and differentiation. Primordial germ cells and the preimplantation embryo are characterized by low levels of DNA methylation and the efficiency of iPSC production is enhanced by DNA methylation inhibitors [20,21,62]. In a review about epigenetic reprogramming, Lee et al. [63] postulated that this global demethylation is required to erase the epigenetic memory and to enable lineage commitment. Cell fate decisions require differential DNA remethylation. According to this, a lack of DNA methyltransferases in embryonic stem cells reverses differentiation and favors a pluripotent state [64]. The global DNA demethylation in activating HSCs [22] reminded us of this epigenetic reprogramming and prompted us to take a closer look on the affected genes. The results reported in the present study showed that the main DNA hypomethylation was found in regions not associated with genes. This is in accordance to what is known for primordial germ cells, whose global DNA demethylation does not coincide with remarkable gene transcription changes [65]. In addition, genes, which showed altered DNA methylation and transcription during HSC activation, were associated with cell differentiation (eg, Bmp4, Dtx), regulation of stem cell homing (eg, Robo4), or DNA methylation (eg, Wt1) [22,66], indicating control of stem cell functions in activating stellate cells.
In conclusion, we identified profound changes in DNA methylation associated with changes in gene expression during HSC activation. Several genes potentially regulated by DNA methylation indicate that the activation process is an unlock mechanism that enables cell differentiation of HSC, which is in line with its characterization as a multipotent MSC.
Footnotes
Acknowledgments
The authors thank Claudia Rupprecht (Clinic of Gastroenterology, Hepatology and Infectious Diseases, Düsseldorf) and Jelena Pistolic (Genomic Core Facility, EMBL Heidelberg) for their skilled technical assistance. This work was funded by the German Research Foundation (DFG) through the Collaborative Research Center SFB 974 “Communication and System Relevance during Liver Injury and Regeneration” (
Author Disclosure Statement
No competing financial interests exist.
References
Supplementary Material
Please find the following supplemental material available below.
For Open Access articles published under a Creative Commons License, all supplemental material carries the same license as the article it is associated with.
For non-Open Access articles published, all supplemental material carries a non-exclusive license, and permission requests for re-use of supplemental material or any part of supplemental material shall be sent directly to the copyright owner as specified in the copyright notice associated with the article.
