
Abstract
Cell spheroids are inducible or spontaneously generated cell aggregates produced in vitro that can provide a valuable model for developmental biology, stem cell biology, and cancer therapy research. This investigation aimed to define the cellular identity of spheroids spontaneously generated in vitro from sheep ovarian cortical cells cultured under specific serum-free conditions. Spheroids were characterized during 21 days of culture by morphometric evaluation, detection of alkaline phosphatase (AP) activity, gene expression analyses of stemness transcription factors and several lineage markers, immunolocalization analyses, as well as assessment of self-renewal and differentiation potential. Cell aggregation, evidenced from day 3 of culture onward, resulted in efficient generation of 65–75 spheroids for every 500,000 cells seeded. The spheroids reached maximum diameter (187 ± 15.9 μm) during the second week of culture and exhibited AP activity. Sox2, Oct4, and Nanog were expressed throughout the culture period, with upregulation of Sox2. Neural lineage specification genes (eg, nestin, vimentin, Pax6, and p75NTR) were expressed from day 10 onward at levels above that of Oct4, Nanog and those for endoderm [alpha-fetoprotein (AFP)], and mesoderm (brachyury) specification. Neural stem cell (NSC)/neural progenitor cell (NPC) markers, nestin, Pax6, p75NTR, and vimentin, were extensively localized in cells on day 10, 15 (44.75% ± 5.84%; 93.54% ± 1.35%; 78.90% ± 4.80%; 73.82% ± 3.40%, respectively), and 21 (49.98% ± 5.30%; 91.84% ± 1.9%; 76.74% ± 11.0%; 95.80% ± 3.60%, respectively). Spheroid cell self-renewal was evidenced by cell proliferation and the generation of new spheroids during two consecutive expansion periods. Culture of spheroid cells under differentiation conditions gave rise to cells showing immunolocalization of the neuron-specific antigen NeuN and the astroglial antigen GFAP (glial fibrillary acidic protein). Our results indicate that spheroids spontaneously generated in this culture system were comprised of cells with molecular characteristics of NSC/NPC that can self-renew and differentiate into neurons and glia, supporting the identity of spheroids as neurospheres.
Introduction
S
Formation of cell spheroids can be induced in vitro by different approaches [2 –4] aimed to force intercellular contacts that prevail over cell attachment to the growth surface to enable cell aggregation and spheroid assembly. Spheroids can also be spontaneously generated through culture of highly proliferative cells that have strong expression of surface adhesion proteins under conditions that discourage cell attachment to the growth surface. Tumor and stem cells are capable of spontaneous spheroid formation [2,5,6].
Stem cell spheroids are formed by aggregation of stem or progenitor cells that have committed to a specific cell lineage rather than solely arising through cell clonal expansion [7]. Spontaneous spheroid generation begins with formation of loose cell aggregates mediated by integrin intercellular contacts. Following formation of such contacts, the aggregating cells form tight homophilic E-cadherin bonds [8,9], which are essential to drive cell fate, proliferation, and differentiation [10]. Thereafter, changes in actomyosin cytoskeleton promote spheroid compaction [11] that results in the formation of tumor spheres [12], or, for stem cells, embryoid bodies [1], neurospheres [13], or cardiospheres [14].
Cellular spheroids represent a particularly valuable experimental model in developmental biology [15] and stem [16 –18] and cancer cell biology [19,20], as well as cell-based therapies [21] and tissue engineering [2]. Such models can be used for toxicological and pharmacological screening of chemical compounds and for in vitro modeling of degenerative or developmental diseases [22].
Microtissues in general, and particularly spheroids, represent an attractive tool for cell therapy since these structures provide a more physiological microenvironment following engraftment in host tissues. Spheroids can produce extracellular matrix proteins that contribute to homing of transplanted cells in recipient tissues and participate in local signaling pathways to promote tissue regeneration and remodeling. Transplantation of scaffold-free tridimensional stem cell aggregates into injured tissues has yielded better cell integration in host organs than injections of isolated stem cells [10].
Recent reviews [10, 23], emphasized that culturing stem cells as spheroids has clear advantages over monolayer culture, except for the low yields to produce homogeneous cell populations, not yet overcome by spheroid culture. In stem cell spheroids, the relative hypoxia to which the cells are exposed in the sphere reduces oxidative stress, which promotes cell survival [24,25] and stemness [9,26] through increases in the expression of the pluripotent transcriptome. Stem cells cultured as spheroids retain migratory potential [27] as well as self-renewal capacity and pluripotency for longer periods relative to monolayer cultures [28]. As an additional benefit, stem cell spheroids are integrated by cells that have diverse levels of cell fate commitment, such as stem, progenitor, and precursor cells, which makes spheroid culture a useful experimental approach for monitoring stem cell-directed differentiation to particular cell lineages, which is valuable for developmental biology studies and in cell therapy strategies.
In several mammalian species, the ovary harbors pluripotent stem cells (PSCs) in the surface epithelium [29 –31] and cortical stroma [32,33]. Adult stem cells found in mammalian ovary tissue can have differentiation potential that could be useful for regenerative medicine applications. Ovarian surface epithelium (OSE) cells can differentiate in vitro to generate early germ cells and oocytes [30,34,35] and, under particular culture conditions, these stem cells can differentiate into neural-like cells [29]. Pluripotent subpopulations of ovarian cortex stromal cells can differentiate into germ cells and diverse types of somatic cells [32,33]. These studies reported the presence of embryonic-like stem cell colonies and embryoid body-like cell aggregates resulting from differentiation of PSCs in vitro.
Ovarian stem cells isolated from adults might eventually be used in autologous cell therapy programs after directed differentiation in vitro, as could stem cells found in hair follicles [36 –38], muscle [39], and dental pulp [40]. Ovarian stem cells could also be valuable as experimental models in developmental biology and stem cell biology.
Neurospheres are integrated by neural stem cells (NSCs), neural progenitor cells (NPCs), and some precursor cells, which can progress in development and express characteristic transcripts and protein markers [41], such as nestin, Sox2, CD133, and Pax6 and proliferate in response to the neural inducing and expansion factors, fibroblast growth factor 2 (FGF2) and epidermal growth factor (EGF) [42,43]. NSCs are multipotent stem cells that are derived from embryonic stem cells during development [44 –46] or after directed specification of embryonic stem cells or induced pluripotent stem cells (iPSCs) [47 –49]. NSCs are also found in neurogenic areas of the postnatal and adult brain [50 –52]. Neurosphere-integrating cells can differentiate to become neurons, astrocytes, and oligodendrocytes when culture medium is supplemented with serum, or in the presence of appropriate combinations of hormones and factors, such as glial-derived neurotrophic factor or brain-derived neurotrophic factor in neural serum-free defined media [47,53,54]. In culture, neurospheres are formed when NSCs/NPCs are seeded under conditions of low attachment to the growth surface or after exposure of PSCs to FGF2 and EGF to induce neural lineage specification and proliferation. Therefore, adult PSCs found in differentiated tissues could be a valuable source of NSCs/NPCs for regenerative medicine and studies to evaluate their differentiation potential and function after transplantation are required.
Characterization of spontaneously generated cell spheroids in vitro allows the quantitative analysis of the identity of cells that have committed to a particular cell fate during stem cell differentiation in culture.
In a previous study, spontaneous formation of spheroids derived from ovarian cortical tissue cells was reported to occur under specific culture conditions [55]. In this study, culture of sheep ovarian cortical cells gave rise to large-scale generation of spheroids integrated by cells carrying the molecular hallmarks of PSCs.
The aim of the present research was to characterize spheroids spontaneously generated in vitro from sheep ovarian cortical tissue by molecular and functional criteria. Findings from these studies can be used in future directed differentiation experiments.
Materials and Methods
Cell culture and generation of spheroids
Ovarian cortical tissue cells were isolated from ovaries of prepubertal ewe lambs 3–6 months of age that were sacrificed at a local abattoir close to the Complutense University Veterinary Faculty in Madrid. The ovaries were aseptically isolated, placed in a sterile flask with M199 culture medium (Ref. M7528; Sigma-Aldrich Química) containing antibiotic–antimycotic solution (Ref. 15240; Gibco, Life Technologies), and immediately transported to the laboratory under refrigeration (2°C–8°C).
The ovaries were washed several times by repeated replacement of collecting medium with fresh medium and then placed in a Petri dish on ice. Strips of cortex tissue (1 mm depth) from areas that were devoid of antral follicles were dissected from the ovaries and fragmented with scalpels to yield ∼0.5 × 0.5 mm pieces that were digested with collagenase type IA (Ref. C2674; Sigma), in Hank's solution (Ref. H9269; Sigma-Aldrich) containing bovine serum albumin (BSA, Ref. A9418; Sigma-Aldrich), deoxyribonuclease (Ref. D4513; Sigma-Aldrich), and antibiotic–antimycotic, for 30 min at 37°C with gentle agitation. The enzyme solution was removed by centrifugation and replaced with Hank's solution lacking calcium and magnesium (Ref. H9394; Sigma-Aldrich) supplemented with BSA and antibiotic–antimycotic.
Dissociation of the fragments was completed by repeated and gentle passage of the suspension through Pasteur pipettes with successively decreasing diameters. The suspension was then centrifuged and the supernatant was replaced by complete M199 culture medium with 0.1% BSA,
After removal of remaining fibronectin, 500,000 live cells were seeded per well, and 500 μL complete culture medium was added before incubation for 21 days at 37°C, 5% CO2, and 99% humidity in a Forma Steri-Cycle incubator (Thermo Scientific Forma). The culture medium was removed every 48 h and replaced with fresh medium having the same composition.
Experimental designs
Image analysis was carried out twice weekly to determine particular features of the cells in culture and to establish the time course development of spheroids in vitro by morphometrical analysis. Cell spheroids were processed for immunohistochemical analyses on days 10, 15, and 21. Analysis of alkaline phosphatase (AP) activity was carried out weekly beginning on the fifth day of culture, and cell lysates for RNA extraction and quantitative reverse transcription polymerase chain reaction (qRT-PCR) were prepared on days 0, 10 15, and 21 of culture. The neurosphere assay was performed to assess self-renewal and differentiation potential of spheroid cells. Experiments were repeated three times, and results presented are the mean values from these experiments.
Time course evaluation of spheroid development in vitro
Cultures were observed and photographed under an inverted microscope (Nikon Eclipse TiS) equipped with a digital camera (Nikon DS-Fi1) and an acquisition unit (Nikon Digital Sight) that transferred the images to a computer with image analysis software (NIS-D-Elements; Nikon). Cell aggregation to generate spheroids was initiated and spheroid diameters were measured twice weekly to depict the time course for the development of these structures. At each time point, the diameters of at least 200 spheroids were determined. Data were transferred to a datasheet for statistical analyses. Results are presented as mean and standard error of mean.
AP activity assay
AP activity was determined in cells once weekly after 5 days in culture with the aid of commercial reagents (Alkaline Phosphatase Detection Kit Millipore Cat. SCR004) used according to the manufacturer's recommendations after two washes with DPBS (Ref. D8537; Sigma-Aldrich Química) and cell fixation with 4% paraformaldehyde (Ref. P6148; Sigma-Aldrich Química) in phosphate-buffered saline (PBS; pH 7.4) for 1–2 min at room temperature (RT). The number of colonies expressing AP (red staining) was counted and evaluated under an inverted microscope.
Gene expression analyses
Total RNA was extracted from cell spheroid lysates for gene expression analyses. Briefly, the culture medium was removed, and after washing twice with DPBS at 37°C the plates were placed on ice and spheroids were separated from the growth surface with the aid of polypropylene micropipettes and a stereomicroscope.
The isolated spheroids were transferred to labeled vials containing 300 μL lysis buffer (Buffer RLT, Ref. 79216; Sigma-Aldrich Química) on ice. Spheroids from three culture wells (n = 180–200) were pooled and placed into each vial. After rapid and gentle repeated aspiration with micropipettes, lysates were stored at −80°C until RNA extraction with an RNeasy Mini Kit (Ref. 74104; Qiagen). Extracts were treated with DNase (Turbo DNA Free Kit, Ref. AM1907; Ambion) before qRT-PCR of samples taken on days 0, 10, 15, and 21 in culture to detect ovine Oct4, Nanog, Sox2, nestin, Pax6, p75NTR, vimentin, alpha-fetoprotein (AFP), brachyury, doublecortin (DCX), glial fibrillary acidic protein (GFAP), and olig2 transcripts, with 18S ribosomal RNA used as an endogenous control.
Total RNA samples (total concentration 20 ng/mL) were used for reverse transcription with the Applied Biosystems High-Capacity RNA-to-cDNA Kit (Ref. 4387406). For PCR, TaqMan probes (TaqMan Gene Expression Master Mix, Ref. 4370074; Applied Biosystems) and oligonucleotides (Power SYBR Green Master Mix, Ref. 4367659; Applied Biosystems), were used. For amplification, primers were designed and synthesized from available mRNA sequences at the National Center of Biotechnology Information (Table 1). The PCR reaction mix contained 5 μL 2 × Master Mix (ABI), 900 nM forward and reverse oligonucleotide primers, 250 nM TaqMan probe (FAM-labeled, MGF-NFQ; Applied Biosystems), 500 nM oligonucleotide mix, 0.25 μL cDNA (20 ng/μL), and nuclease-free water to a final volume of 10 μL.
AFP, alpha-fetoprotein; DCX, doublecortin; GFAP, glial fibrillary acidic protein.
Amplification was carried out at 50°C, followed by 10 min at 95°C and 40 cycles of 15 sec at 95°C, and 1 min at 60°C, in a quantitative PCR apparatus (Applied Biosystems 7900HT, provided with Software SDS 2.2.2). qRT-PCR analyses were carried out in Servicio de Genómica y Proteómica Antonia Martín Gallardo, Parque Científico de Madrid, Campus de Cantoblanco. For relative quantification of all transcripts at each time point, brachyury expression levels were used as a reference for normalization. For quantification of time-dependent variations in the expression of individual genes, transcription levels on day 0 were used as a reference for normalization. Data are presented as mean relative quantification with standard error of mean.
Sample processing for histology and immunohistochemistry
Spheroids were processed for histology and immunohistochemistry following a procedure established in the laboratory (Patent P201300524/PCT/ES2014/000089).
In brief, culture medium was removed and cells were washed twice for 5 min with DPBS at 37°C. Subsequently, spheroids were fixed by addition of 4% paraformaldehyde in PBS (pH 7.4) for 15 min at 2°C–8°C. The fixative was removed and cultures were washed twice for 5 min with ice-cold PBS. The cultures were then dehydrated by sequential addition of 30%, 50% and 70% ethanol (Ref. 1009832500; Merck Millipore), for 10 min at each concentration at 2°C–8°C. PBS washes, fixation, and dehydration were carried out on the culture plates under a stereomicroscope (Nikon SMZ 800) with the aid of micropipettes (Steripette, Ref. 19025/0050; Minitube International). Before paraffin embedding, spheroids were preaggregated in groups in 1.5% aqueous agar (Ref. LP001; Oxoid Ltd., Hampshire, England) solution.
The agar solution was then dispensed to form a continuous layer at the base of polypropylene molds (5 mm diameter × 3 mm depth). When the agar matrix solidified, spheroids were transferred from the culture wells to the mold atop the agar layer. Under a stereomicroscope, excess ethanol was removed and spheroids were positioned at the center of the agar base using round-edged glass micropipettes before solubilized agar was added to overlay the grouped spheroids. Molds were incubated at 2°C–8°C for 3–4 h to completely solidify the agar. Agar blocks containing groups of spheroids were retrieved from the molds with 26-gauge syringe needles and placed into labeled histology cassettes for storage in 70% ethanol until paraffin embedding.
Immunohistochemical analyses
Spheroid samples were sectioned into 4 μm slices. Immunohistochemical staining was based on the biotin peroxidase complex method, using a commercial kit (NovoLink Polymer Detection System, 250 tests, NRE7140-K; Leica Microsystems, United Kingdom) following the manufacturer's recommendations.
Sections were pretreated with 10 mM citrate buffer (pH 6.0) in a pressure cooker for antigen retrieval, cooled for 30 min at RT, and washed twice in distilled water. Incubation with primary antibodies was carried out in a humidified chamber and the following antibodies and conditions were used: rabbit polyclonal anti-Pax6 antibody (Ref. 030765; Sigma-Aldrich, Inc., Saint Louis) diluted 1:400 and incubated overnight at 4°C; mouse monoclonal anti-nerve growth factor receptor (p75NTR, Ref. N3908; Sigma-Aldrich, Inc.) diluted 1:1,500 and incubated overnight at 4°C; mouse monoclonal anti-vimentin antibody (clone V9; Dako, Glostrup, Denmark) diluted 1:500 and incubated for 1 h at RT; and rabbit polyclonal anti-nestin (Ref. N5413; Sigma-Aldrich, Inc.) diluted 1:200 and incubated for 1 h at RT.
Immunolocalization was detected by exposure of tissue sections to 3,3′-diaminobenzidine tetrachloride (DAB) for 5 min at RT. After washing for 10 min in distilled water, sections were counterstained with Hematoxylin, dehydrated in alcohol, cleared, and mounted. In negative control sections, protein block solution was used instead of primary antibodies in the corresponding incubation step. All primary antibodies were previously validated in our laboratory. At least 10 sections per time point were used for immunolocalization of each individual marker. Images of sections were obtained with an Olympus camera connected to an Olympus DP50 microscope and processed using Viewfinder Lite and Studio Lite software (Better Light, Inc., San Carlos, CA).
Positive and negative cells were counted in the images from each section obtained after immunohistochemistry and the percentages of immunostained cells in each tissue section were calculated. Results are presented as mean percentage of immunostained cells at each time point with standard error of mean.
Neurosphere assay
The self-renewal activity of spheroids and the ability of spheroid cells to differentiate into mature neural cells were evaluated by a neurosphere assay based on previously established procedures [56]. The self-renewal activity of spheroids was assessed by evaluating the capacity of cells to proliferate and generate new spheroids after enzymatic dissociation and subculture during two consecutive cell expansion periods. Cells were isolated as previously described and seeded at 20,000 and 500,000 cells per well in fibronectin-coated 96- and 24-well plates, respectively.
For both plate types, cells were cultured for 7 days at 37°C, 5% CO2, and 99% humidity in two different defined media. M1 medium: Dulbecco's modified Eagle's medium (DMEM):F12 (Ref. 11039021; Life Technologies S.A.) supplemented with 0.1% BSA, 1% N2 (Ref. 17502048; Life Technologies S.A.), 25 mM
For subculture, on day 7 of the first expansion period, spheroids were dissociated into single cells after 10–15 min exposure to Stem Pro Accutase (Ref. A1110501; Life Technologies) followed by gentle mechanical dissociation, washing, and resuspension in culture medium. Cell concentration and viability were determined after Trypan Blue staining and counting in a hemocytometer. Cells were then cultured at the same initial density using the same culture conditions as described above.
In both culture periods images taken every 48 h beginning at 24 h in culture were analyzed as previously described to determine the state of cell aggregation and generation of primary and secondary spheroids in vitro. On days 4 and 6, cell proliferation was assessed by a BrdU uptake enzyme immunoassay (Ref. ab126556; Abcam) according to the manufacturer's instructions. Absorbances corresponding to BrdU uptake in M1 and M2 cultures (n = 8 culture wells/group/time point) were recorded with a microplate spectrophotometer at 450 nm. On day 7, total RNA was extracted from lysates of primary and secondary cell spheroids and transcript levels for nestin, Pax6, p75NTR, DCX, GFAP, and Olig2 were quantified relative to levels on day 0 by qRT-PCR, as described in Gene expression analyses section. 18S ribosomal RNA was used as endogenous control for normalization.
For differentiation of spheroid cells, a 12 mm round borosilicate coverslip (Ref. CB00120RAC20MNTO; Menzel, Thermo Fisher Scientific) was placed into each well of 24-well culture plates that were then coated with polyornithine–fibronectin.
On day 7 of culture, cells were isolated from secondary spheroids after dissociation with Accutase. The number of viable cells was determined in a hemocytometer after Trypan Blue staining of the cell suspension, and 80,000 cells per cm2 were seeded in each well. The cells were then cultured at 37°C, 5% CO2, and 99% humidity for 25 days with differentiation medium consisting of DMEM F12 with 2% fetal bovine serum (Ref. A3160401; Life Technologies), 1% N2 supplement, 25 mM
Medium was replaced every 48 h (2/3 vol/well) with fresh medium of the same composition. Cultures were observed under an inverted microscope twice weekly, and representative photomicrographs were taken.
At the end of the culture period, staining for specific antigens for neural progenitors (Pax6), neural precursor cells (DCX), astrocytes (GFAP), and neurons (NeuN), was performed using antibodies covalently conjugated with the following fluorochromes: anti-GFAP (Ref. G4546; Sigma-Aldrich) labeled with DyLight 594 (Ref. ab201801; Abcam); antibodies to DCX (Ref. SAB4500628; Sigma-Aldrich), NeuN (Ref. ab177487; Abcam Ltd.), and Pax6 (Ref. HPA030775; Sigma-Aldrich) labeled with DyLight 488 (Ref. ab201799; Abcam), according to the manufacturer's instructions. An Olig2 antibody with reactivity in sheep for this particular application was not available.
The culture medium was then removed and the cells were washed with PBS prewarmed to 37°C and fixed for 15 min at 2°C–8°C with methanol prechilled to −20°C. After removal of the fixative, cells were gently washed with PBS and blocked with 5% BSA-PBS for 60 min at RT. Cells were then incubated with conjugated antibodies diluted in 5% BSA-PBS (anti-GFAP, 1:200; anti-DCX, 1:200; anti-NeuN, 1:300; anti-Pax6 1:400) overnight in the dark, at 2°C–8°C in a humidified chamber. After antibody removal, coverslips were washed with PBS, counterstained with DAPI (4′,6-diamidino-2-phenylindole), mounted (ProLong Gold Antifade Mounting Medium with DAPI, Ref. P36931; Thermo Fisher Scientific) on glass slides, and stored in the dark overnight at 2°C–8°C before image analysis performed in Centro de Citometría y Microscopía de Fluorescencia de la Universidad Complutense de Madrid using a laser confocal microscope (Leica TCS SP8; Leica Microsystems). Representative microphotographs of labeled cell cultures were taken.
Statistical analyses
Time-dependent changes in spheroid diameter in culture were analyzed by one-way analysis of variance (ANOVA), using measurements taken at each time point. P < 0.01 was considered to be significant. Data for relative quantification transcript expression levels using brachyury levels at each time point for reference were analyzed by repeated measures ANOVA with P < 0.01 considered to be significant. Data for relative quantification of each individual transcript over time with the expression level at t = 0 as a reference were analyzed by one-way ANOVA with P < 0.01 considered to be significant.
Percentages of immunolocalization of vimentin, nestin, p75NTR, and Pax6 were first analyzed by Shapiro–Wilk test to assess normal distribution. Time-dependent variations in the percentages of immunolocalization were determined by one-way ANOVA with P < 0.05 considered to be significant.
The expression of nestin, Pax6, p75NTR, DCX, GFAP, and Olig2 in spheroids generated in vitro and cultured in defined media M1 and M2 was compared between first and second cell expansion periods by one-way ANOVA with P < 0.05 considered to be significant. Absorbances corresponding to BrdU uptake during cell proliferation in the first and second cell expansion periods were compared by one-way ANOVA to determine the effect of each medium type. The level of significance was P < 0.05. Bonferroni post hoc test was performed after ANOVA for all cases.
Results
Generation and in vitro development of spheroids
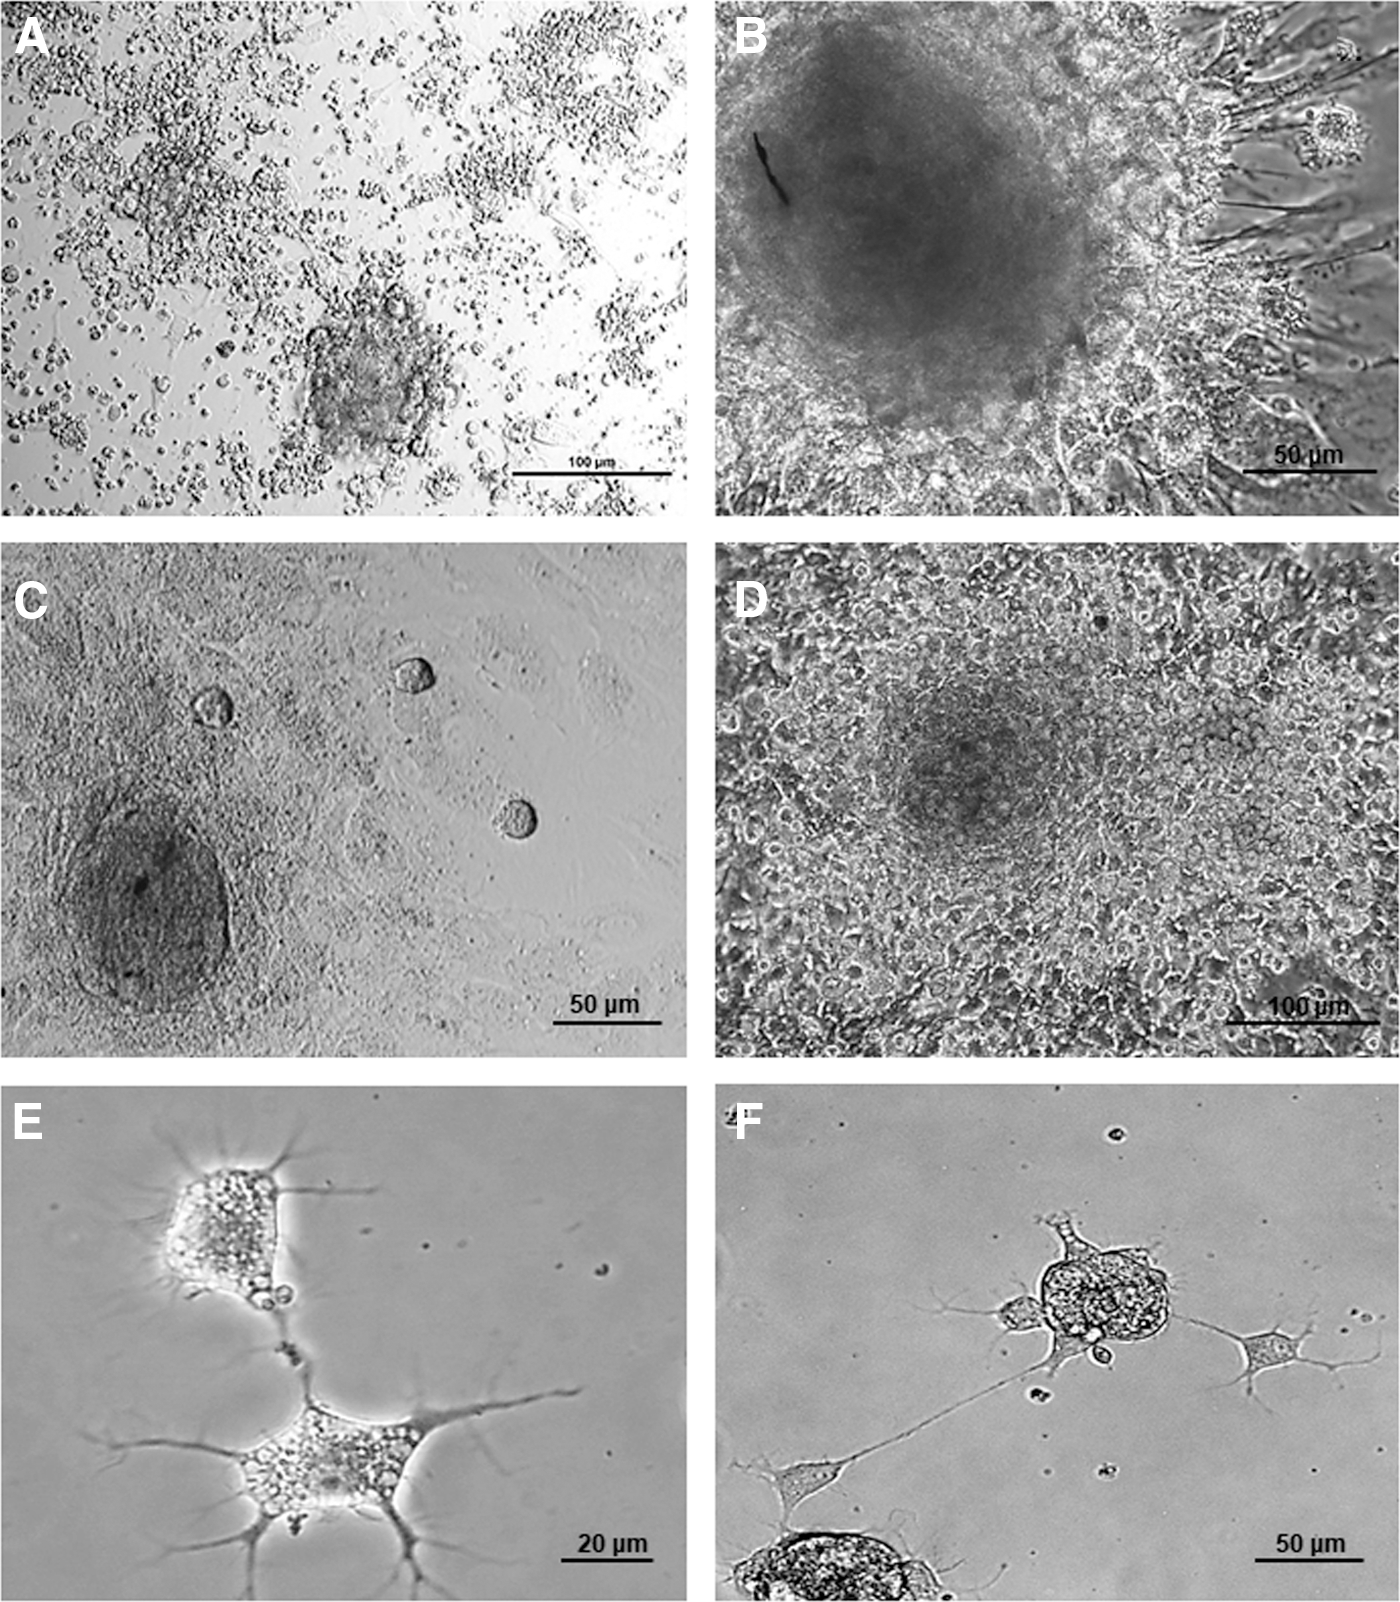
Spontaneous cell aggregation was assessed from the onset of culture, particularly from the third day (Fig. 1A). Spheroids were organized as compact cell aggregates from day 5 onward. On day 7 of culture, elongated cells polarized from the spheres to the periphery were present (Fig. 1B), as were large round cells that had a high nucleus to cytoplasm ratio that arose either from the spheres and consistently migrated toward specific areas of the culture surface or aggregated with previously formed spheroids (Fig. 1C). In these areas, the growth surface was covered with a layer of elongated cells that had a similar morphology to fibroblastic or stromal cells. Round migrating cells showed tropism to areas that harbored round, postmigration cells (Fig. 1D).
Photomicrographs of day 3 cell cultures
The mean spheroid diameter was 163.13 ± 16.2 μm at the end of the first week in culture, and the maximum diameter of 183.70 ± 15.9 μm (P < 0.01) was achieved by the end of the second week before decreasing to values that were similar to those of the first week (150 ± 11.4 μm) by the end of culture period. From the first week onward, cells having morphological features consistent with those of neural lineage were found surrounding the spheroids (Figs. 1E, F, and 2).

Photomicrographs taken during the second
AP activity of spheroids
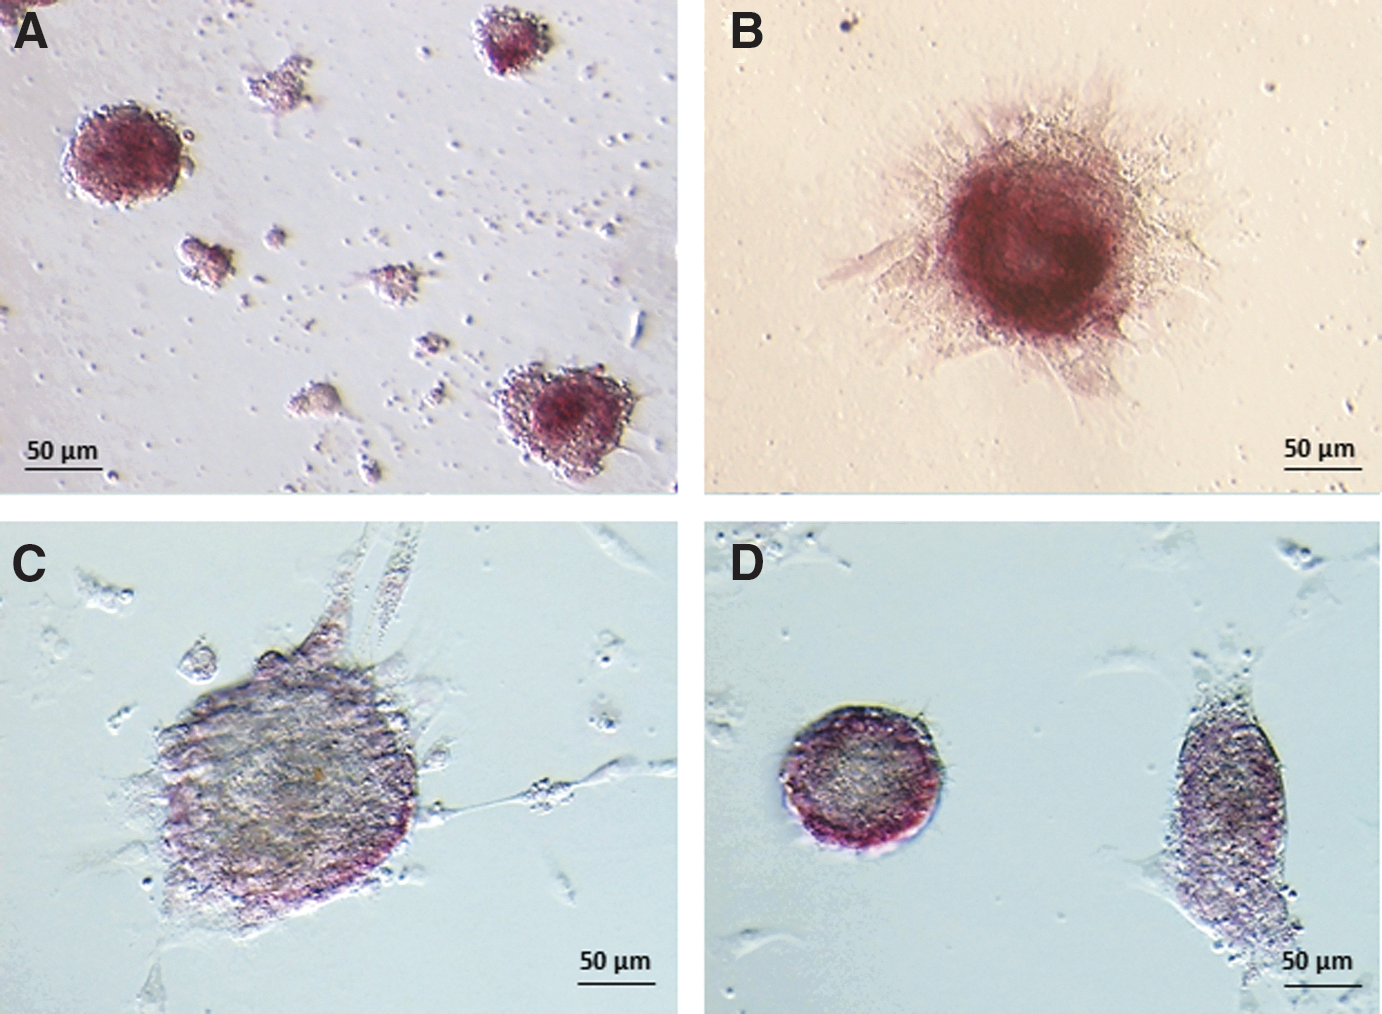
AP activity was present in all spheroids generated in vitro and the highest staining intensity was seen on day 5 of culture (Fig. 3A); these high levels were maintained in all spheroids throughout the remaining culture period (Fig. 3A–D). Interestingly, AP activity appeared to be confined to cells in the outer spheroid layer during the third week of culture (Fig. 3C, D).
Photomicrographs showing localization of alkaline phosphatase activity in spheroids on days 5
Spheroids express transcripts characteristic of pluripotency and neuroepithelial cell lineages
Relative quantification of mRNAs was performed on days 0, 10, 15, and 21 of culture (Fig. 4A, B). All transcripts were expressed in cell suspension before culture (day 0), and at all time points throughout the culture period.
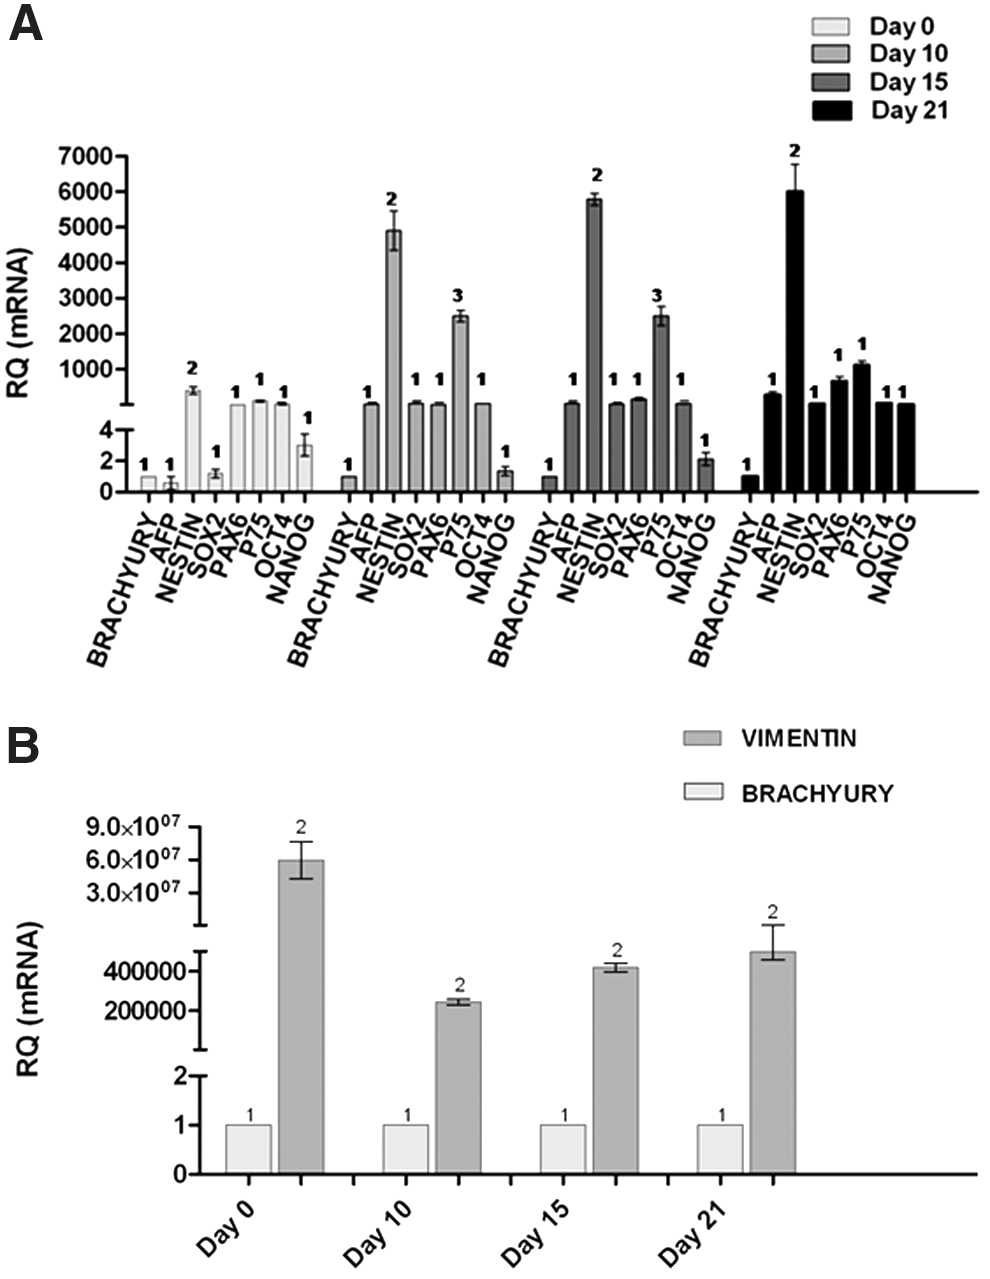
Relative quantification of transcripts characteristic of endoderm (AFP), mesoderm (brachyury), pluripotency, and neuroectoderm specification (nestin, Sox2, Pax6, p75NTR),
Expression of the pluripotency transcripts Oct4, Sox2, and Nanog was present in the cell suspension before culture (day 0) and persisted in the spheroids generated in vitro across the culture period. Vimentin transcript predominated at all time points (Fig. 4B; P < 0.01), followed by nestin (days 10, 15, 21; P < 0.01), and p75NTR (days 10 and 15; P < 0.01) (Fig. 4A). Expression of transcripts characteristic of endoderm (AFP) or mesoderm (brachyury) was close to the limit of detection at all time points in culture (Fig. 4A).
Time-dependent variations in the expression of each transcript are shown in Fig. 5. For pluripotency transcripts (Fig. 5A), Oct4 expression was maintained in spheroids during the culture period, but decreased on day 10 from the initial levels on day 0 (P < 0.01), and on day 15 the expression was lower than levels for day 10 (P < 0.01). Oct4 transcription in spheroids on day 21 of culture was similar to expression levels seen before culture. Nanog mRNA levels in spheroids decreased to similar values on days 10 and 15 of culture and by day 21 had increased to levels that were still below those at time 0 (P < 0.01). Unlike the decline in expression of Oct4 and Nanog, on day 10 Sox2 transcript levels were higher than that in cell suspensions at culture outset and remained higher than that for Oct4 (P < 0.01), Nanog (P < 0.01), and Sox2 on days 0 (P < 0.01), 15, and 21 of culture.

Line and bar graphs depicting time-dependent expression of each transcript in cell suspensions before culture (day 0) and in spheroids on day 10, 15, and 21 in culture, using the level of transcription for each gene in cell suspension before culture as the reference value for relative quantification. Time-dependent variations in transcription of Oct4, Nanog, Sox2
Expression of brachyury, a gene characteristic of mesoderm specification, and AFP, an endoderm marker, was close to the limit of detection at all time points during culture relative to expression of neuroectoderm genes (Fig. 4).
Expression of nestin, vimentin, Pax6, and p75NTR, characteristic of neuroectodermal cell fate, and particularly enriched in NSCs and NPCs, predominated at all times (Fig. 4A). Expression of nestin increased on day 10 (P < 0.01) relative to day 0 levels, and this level of transcription was maintained to similar values on days 15 and 21 (Fig. 5C). Vimentin exhibited a sustained increase (P < 0.01) in transcription in spheroids on days 10, 15, and 21 (Fig. 5C) relative to day 0 values. Expression of Pax6, a DNA-binding protein that activates expression of genes involved in brain, spinal cord, and eye development exhibited a sustained increase in spheroids on days 15 and 21 relative to levels of transcription in cell suspension before culture and in spheroids after 10 days of culture (Fig. 5C). Transcription of p75NTR markedly increased (P < 0.01) on day 10 compared with day 0 levels, and progressively decreased on days 15 and 21, although the levels remained higher (P < 0.01) than those found in cell suspension before culture (Fig. 5C).
For genes characteristic of neural differentiation (Fig. 5D), transcription of DCX, a marker of neuron precursor cells and neurons, increased (P < 0.01) in day 10 spheroids over that for day 0. The expression then decreased in spheroids to attain similar levels on days 15 and 21 (P < 0.01); these levels were higher than those on day 0, although this difference did not achieve significance. Expression of GFAP, an astroglial marker, and olig2, an oligodendrocyte transcription factor, exhibited a similar change relative to that of DCX, with an increase (P < 0.01) on day 10, and a subsequent reduction (P < 0.01) on days 15 and 21 to values that were higher than those on day 0, but these differences also were not significant.
Neural progenitor and NSC markers are extensively localized in spheroids
Characteristic markers of NSCs and NPCs were extensively localized in spheroids on day 10, 15, and 21 in culture (Fig. 6). Percentages of immunolocalization of nestin, vimentin, Pax6, and p75NTR are presented in Table 2. Nestin was mainly localized in the nucleus (Fig. 6D–F), whereas vimentin was extensively localized in the cytoplasm (Fig. 6A–C). Pax6 had a nuclear localization (Fig. 6J–L) and p75NTR was also predominantly localized in the nuclei, with a reduced incidence of positive cytoplasmic immunostaining (Fig. 6G–I). After 10 days in culture, most cells were positive for vimentin as well as the neural lineage markers p75NTR and, predominantly, Pax6. These markers were immunolocalized in most spheroid cells on day 15, when the percentage of cells with positive Pax6 immunostaining increasing to the highest values on day 21 of culture. Approximately, half of cells integrating spheroids immunolocalized nestin, with no time-dependent differences.
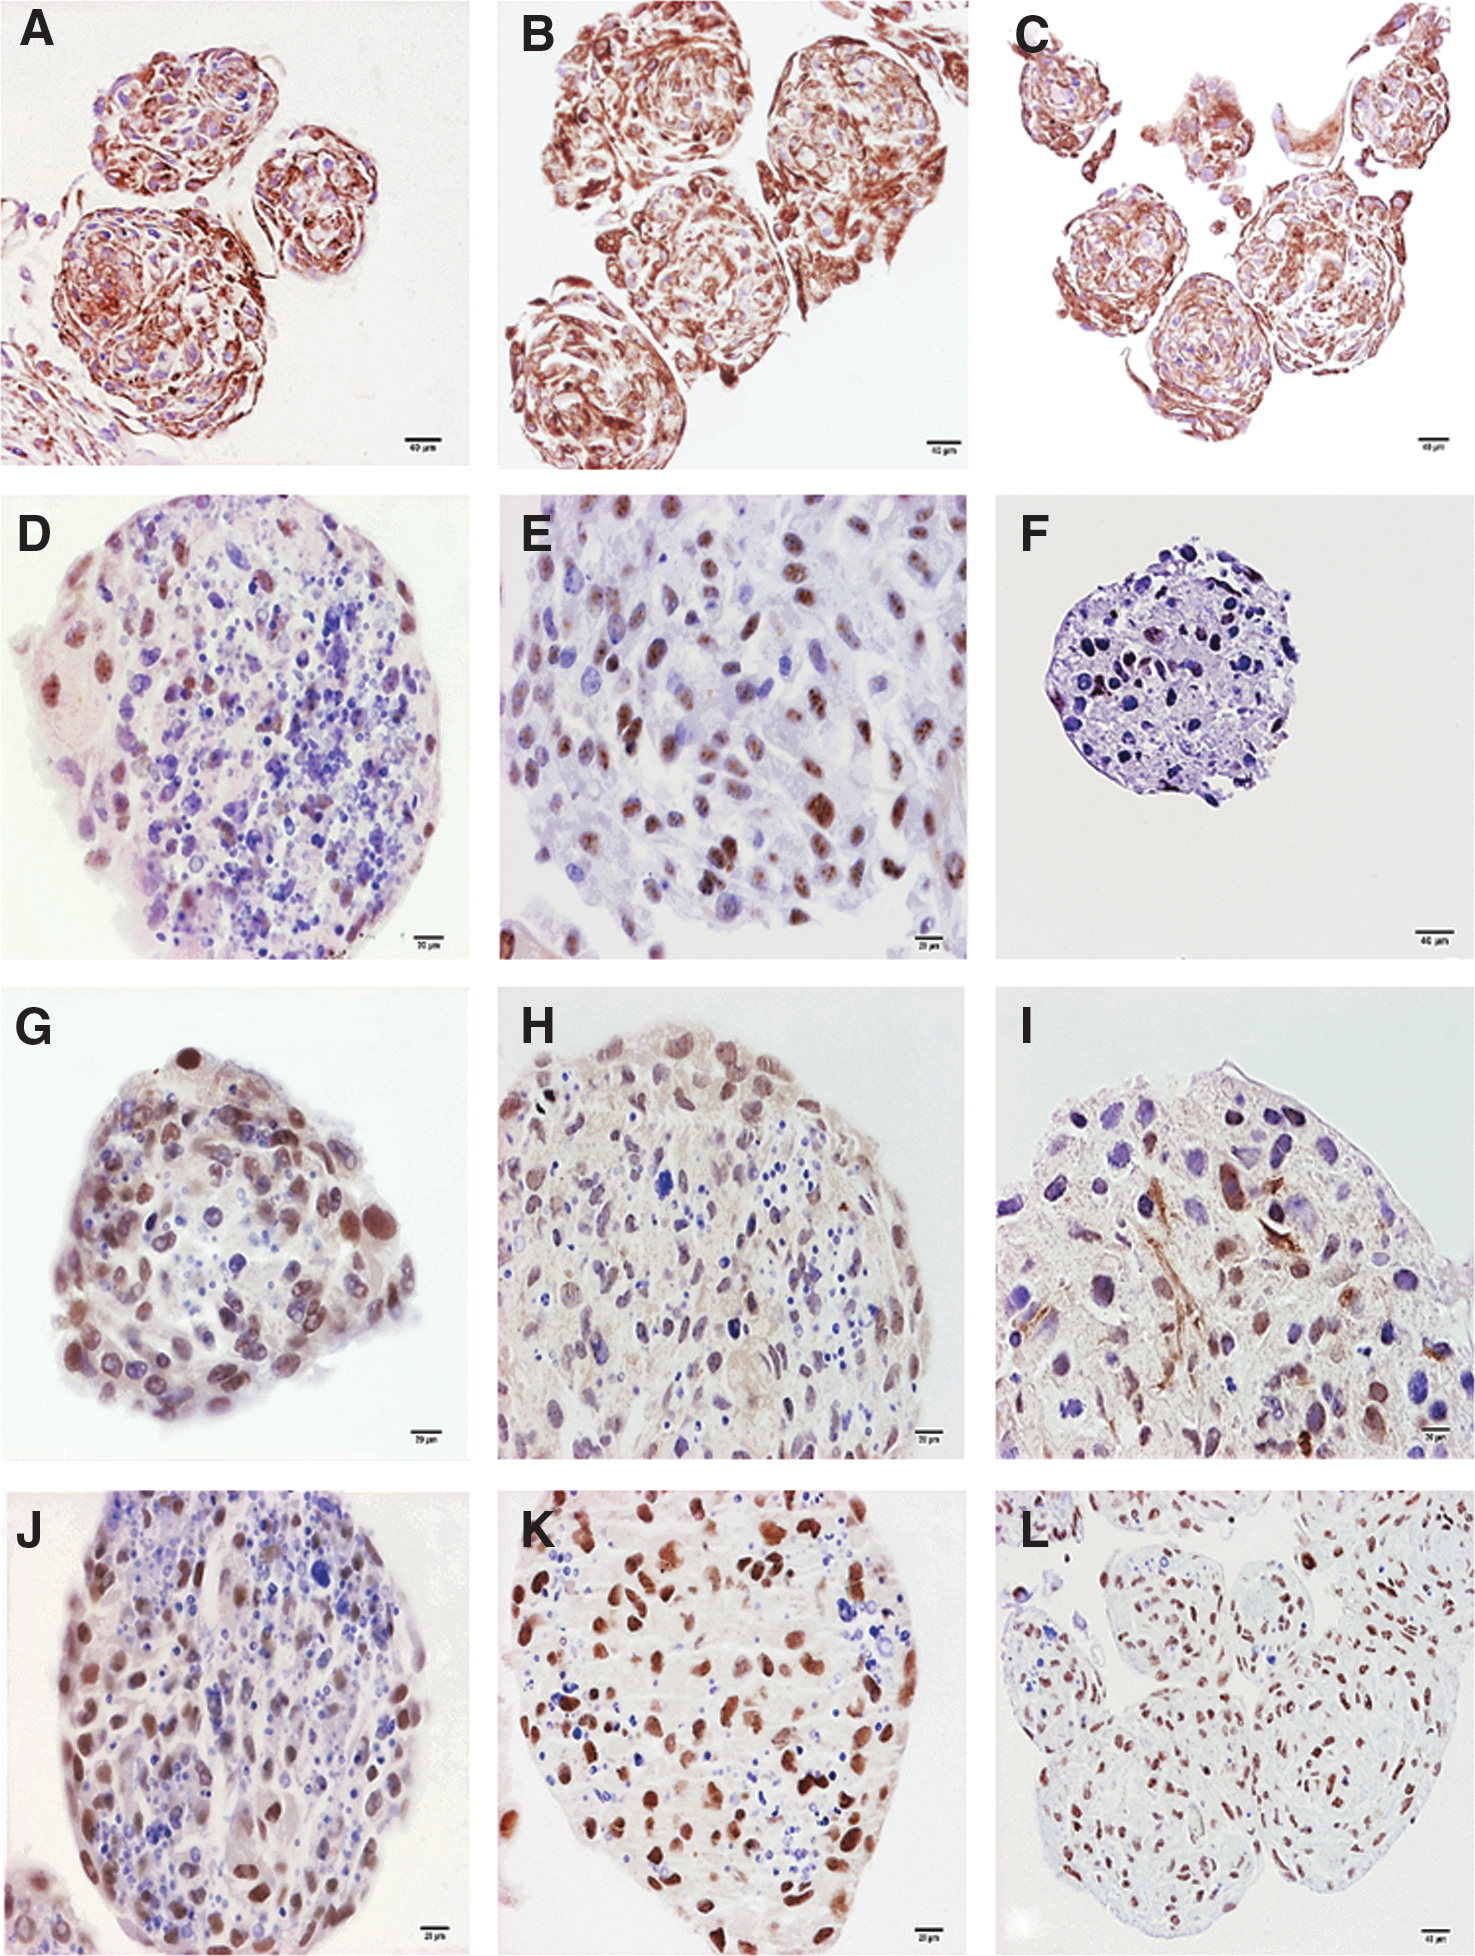
Representative photomicrographs of spheroids on day 10 (first column), day 15 (second column), and day 21 (third column) in culture, showing immunohistochemical staining for vimentin
Results are presented as the mean percentage and standard error of cells that were immunostained at each time point.
Denote significant time-dependent differences (P < 0.05) in the percentage of cells having positive immunostaining for each antigen.
Neurosphere assay
During the first cell expansion period, cell aggregation was seen beginning at 24 h in culture. Cell aggregates that were clearly defined 72 h after seeding increased in size to become compact primary spheroids on days 5–6 in culture (Fig. 7A). Primary spheroid compaction occurred slightly earlier in group M2 compared with cells exposed to EGF and FGF2 mitogens (group M1). After primary spheroid dissociation and cell passage, cell aggregates were seen at 24 h and became defined at 72 h in culture; secondary spheroids were patent after 5–6 days in culture in both groups (Fig. 7B).
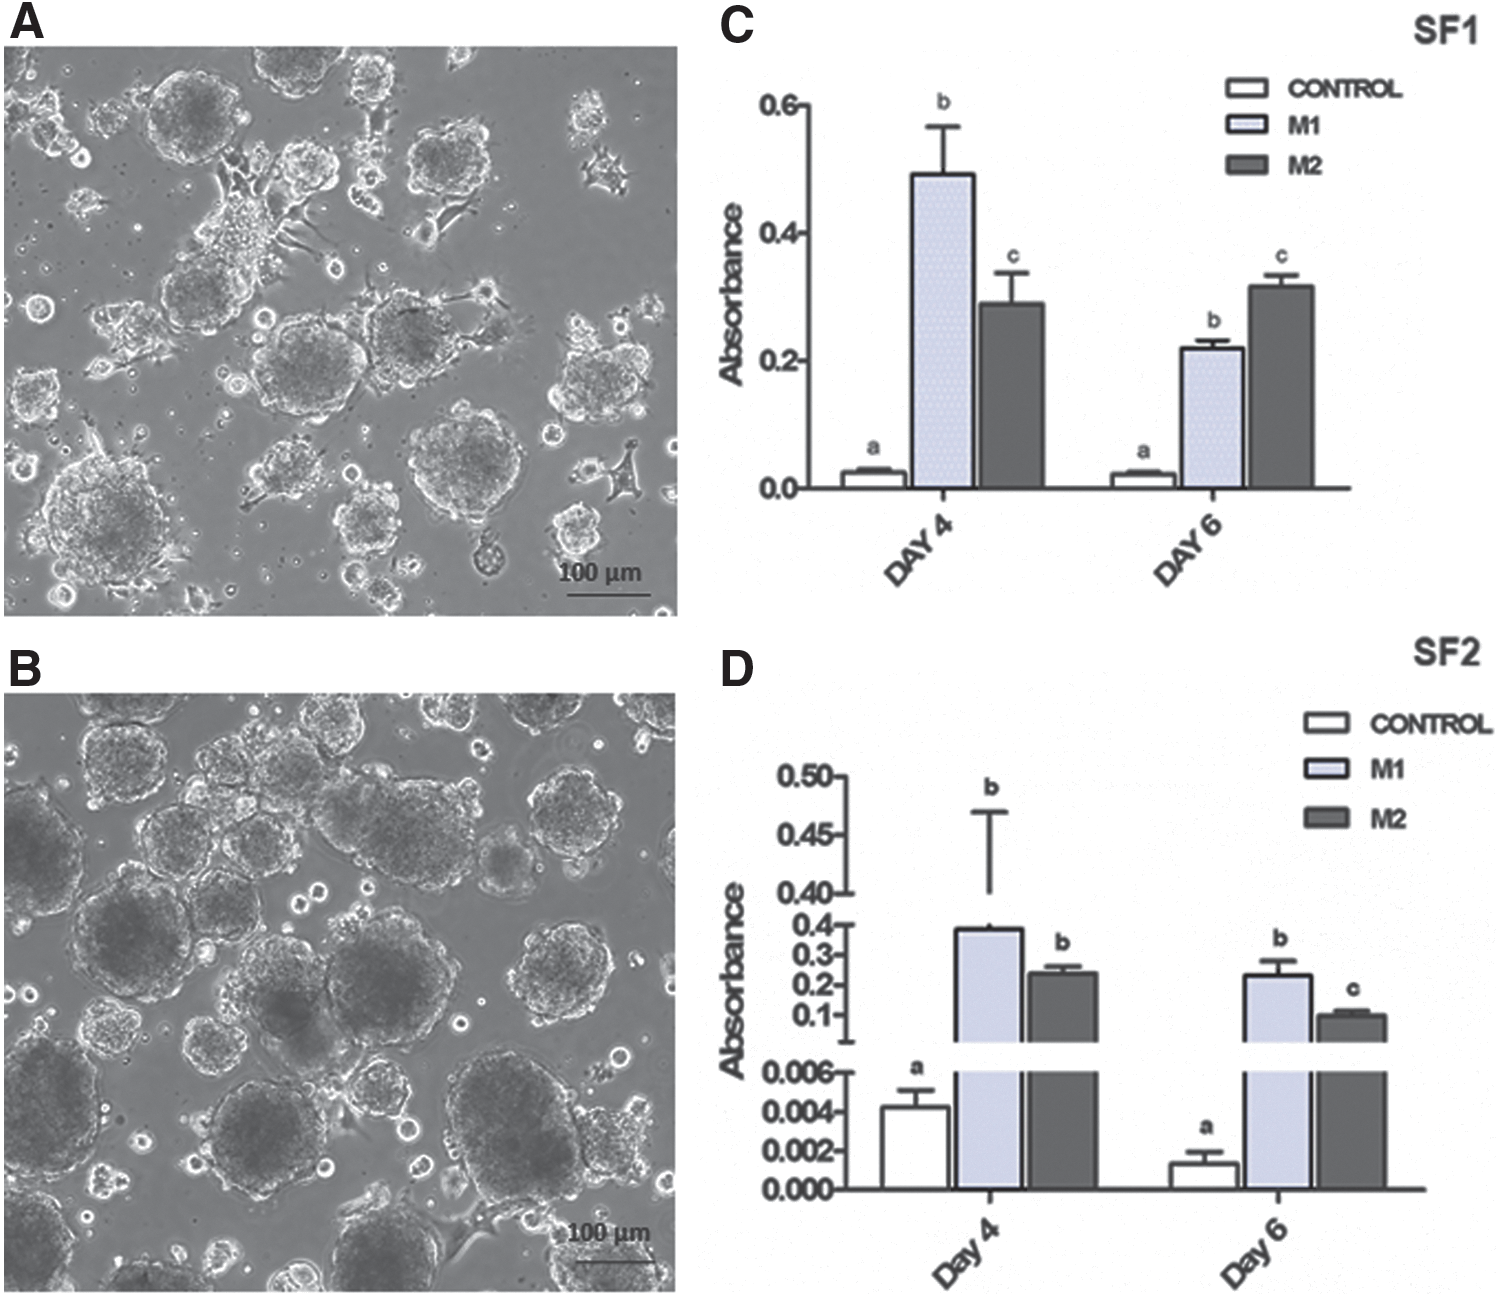

Incorporation of BrdU occurred in cells cultured in M1 and M2 during the first and second culture expansion periods. Cell proliferation was more intense (P < 0.01) in cells exposed to EGF and FGF2 (M1 group) than for the M2 group in both cell expansion periods (Fig. 7C, D). Taken together, these results support the self-renewal ability of these spheroids and their integrating cells.
NSC/NPC genes (nestin, Pax6, p75NTR), and neural differentiation genes (DCX, GFAP, Olig2) were all expressed in M1 and M2 primary and secondary spheroids on day 7 of culture, as shown by qRT-PCR analyses performed on isolated RNA (Fig. 7E, F). In both M1 and M2 groups, nestin expression was higher in secondary spheroids than in primary spheroids (P < 0.01), whereas expression of neural differentiation transcripts DCX, GFAP, and Olig2 was lower in secondary spheroids relative to primary spheroids (P < 0.01, in all cases). Expression of the NPC transcript Pax6 was lower (P < 0.01) in secondary compared with primary spheroids only for the M1 group. These results confirm the stability of the molecular identity of primary and secondary spheroids as NSC/NPC.
During culture under cell differentiation conditions, there was no evidence of changes in cell morphology during the first 15 days of culture when cells were exposed solely to 2% serum-supplemented medium (Fig. 8A). Formation of small cell aggregates was still observed during culture at low density in the presence of serum. A few days after addition of EGF receptor and FGF2 receptor antagonists to 2% serum-supplemented medium (48–72 h), changes in cell shape were visible upon image analysis using an inverted microscope. Short projections around the entire cell began to appear and the presence of a single elongating projection from one cell pole together with neurite-like projections at the opposite cell pole were seen in a large number of cells. Cells having a triangular shape and neurite-like projections as well as rounded cells with a single long projection were seen, as were several other configurations (Fig. 8B–G).
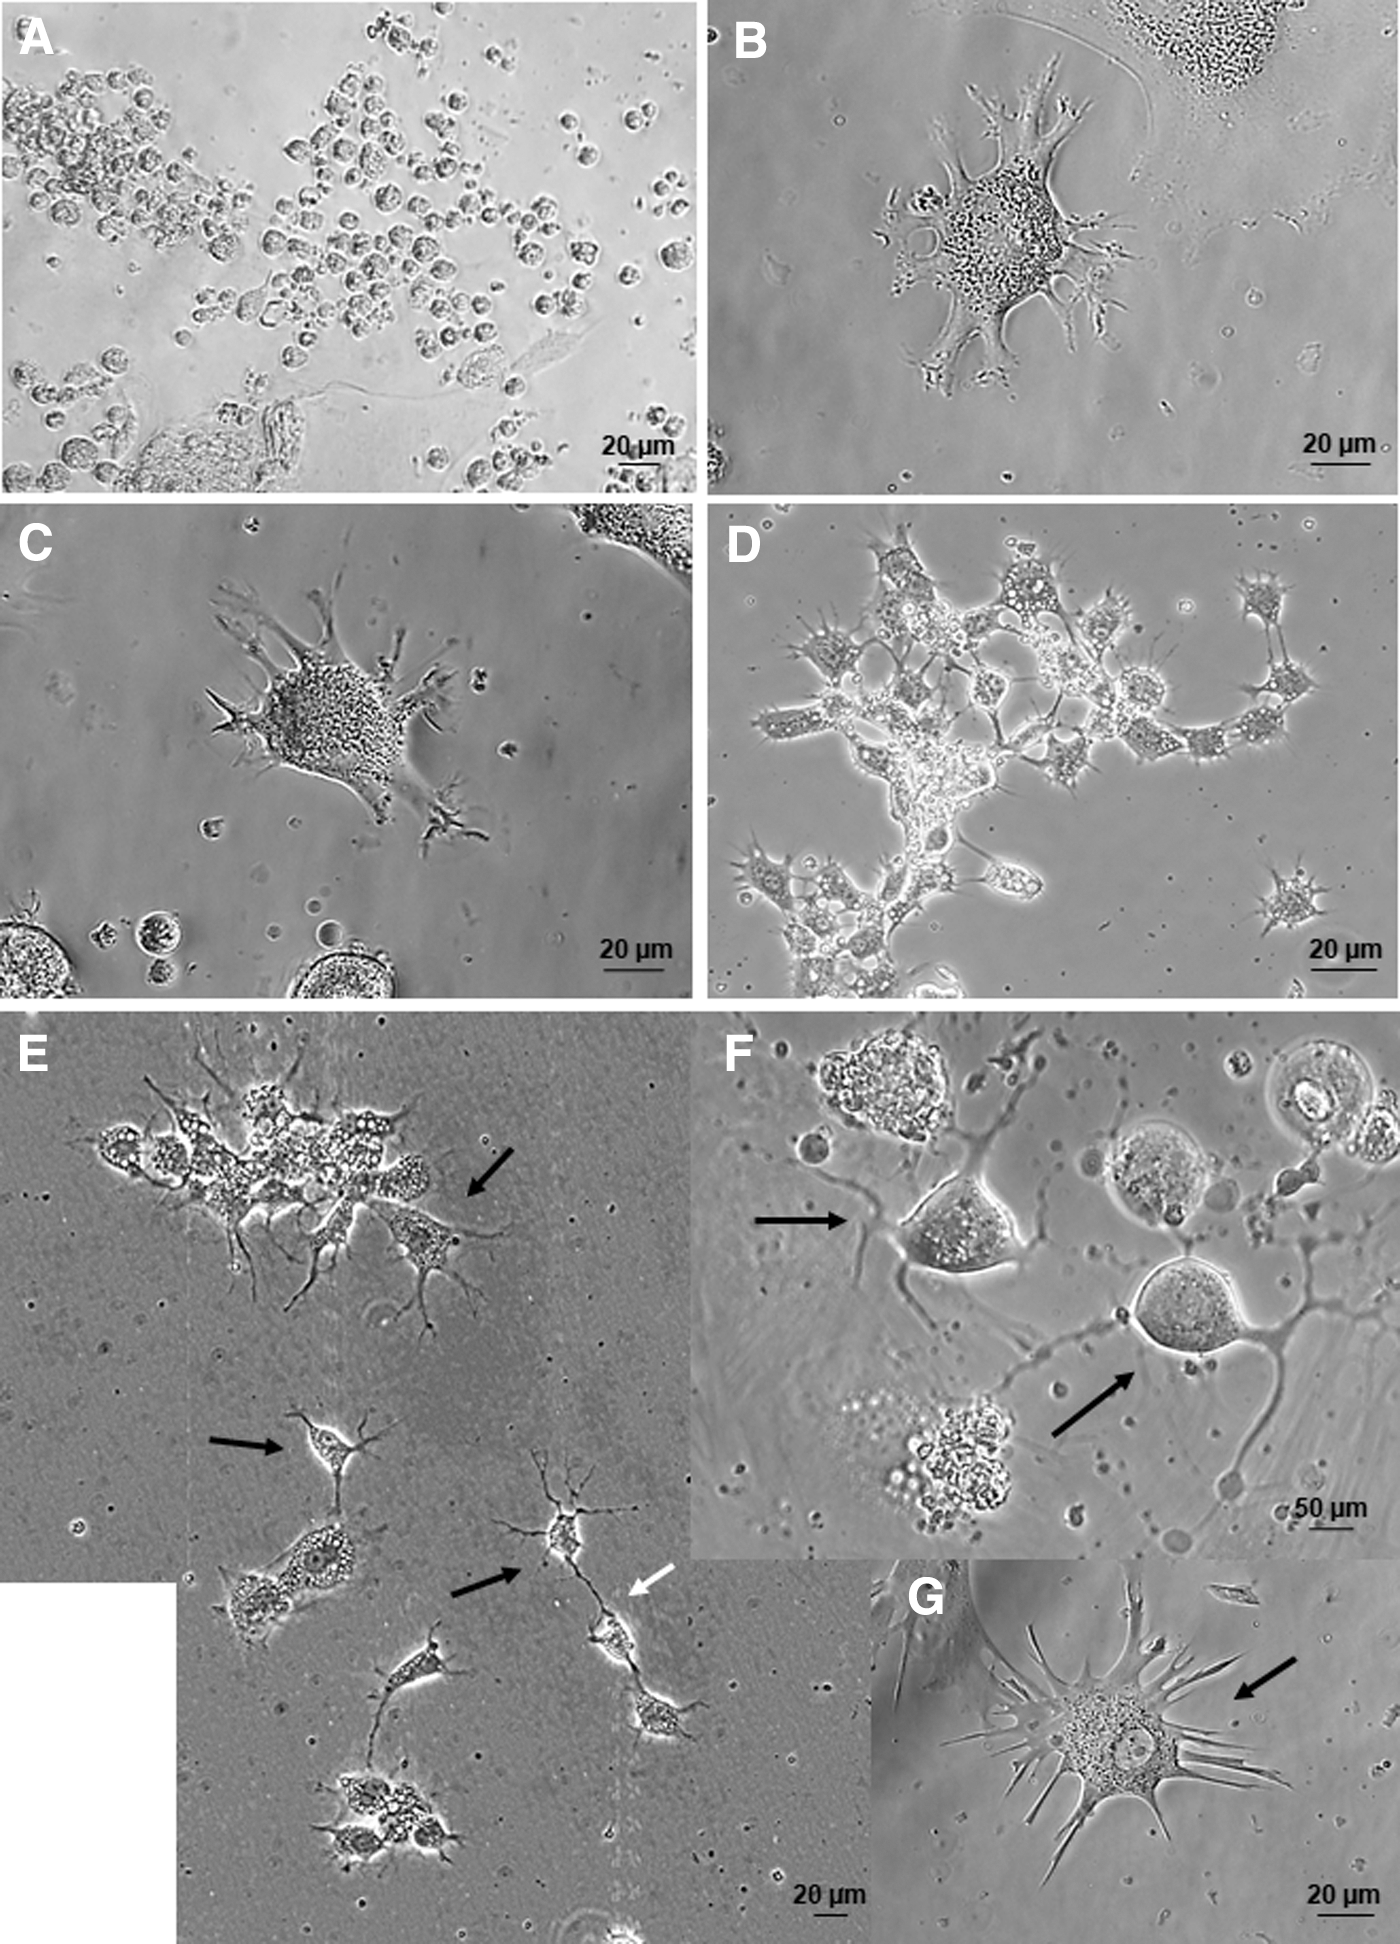
Assessment of differentiation using photomicrographs taken with an inverted microscope during culture showed characteristic cell morphology when cells were exposed to 2% FBS-supplemented medium during the first 15 days of culture
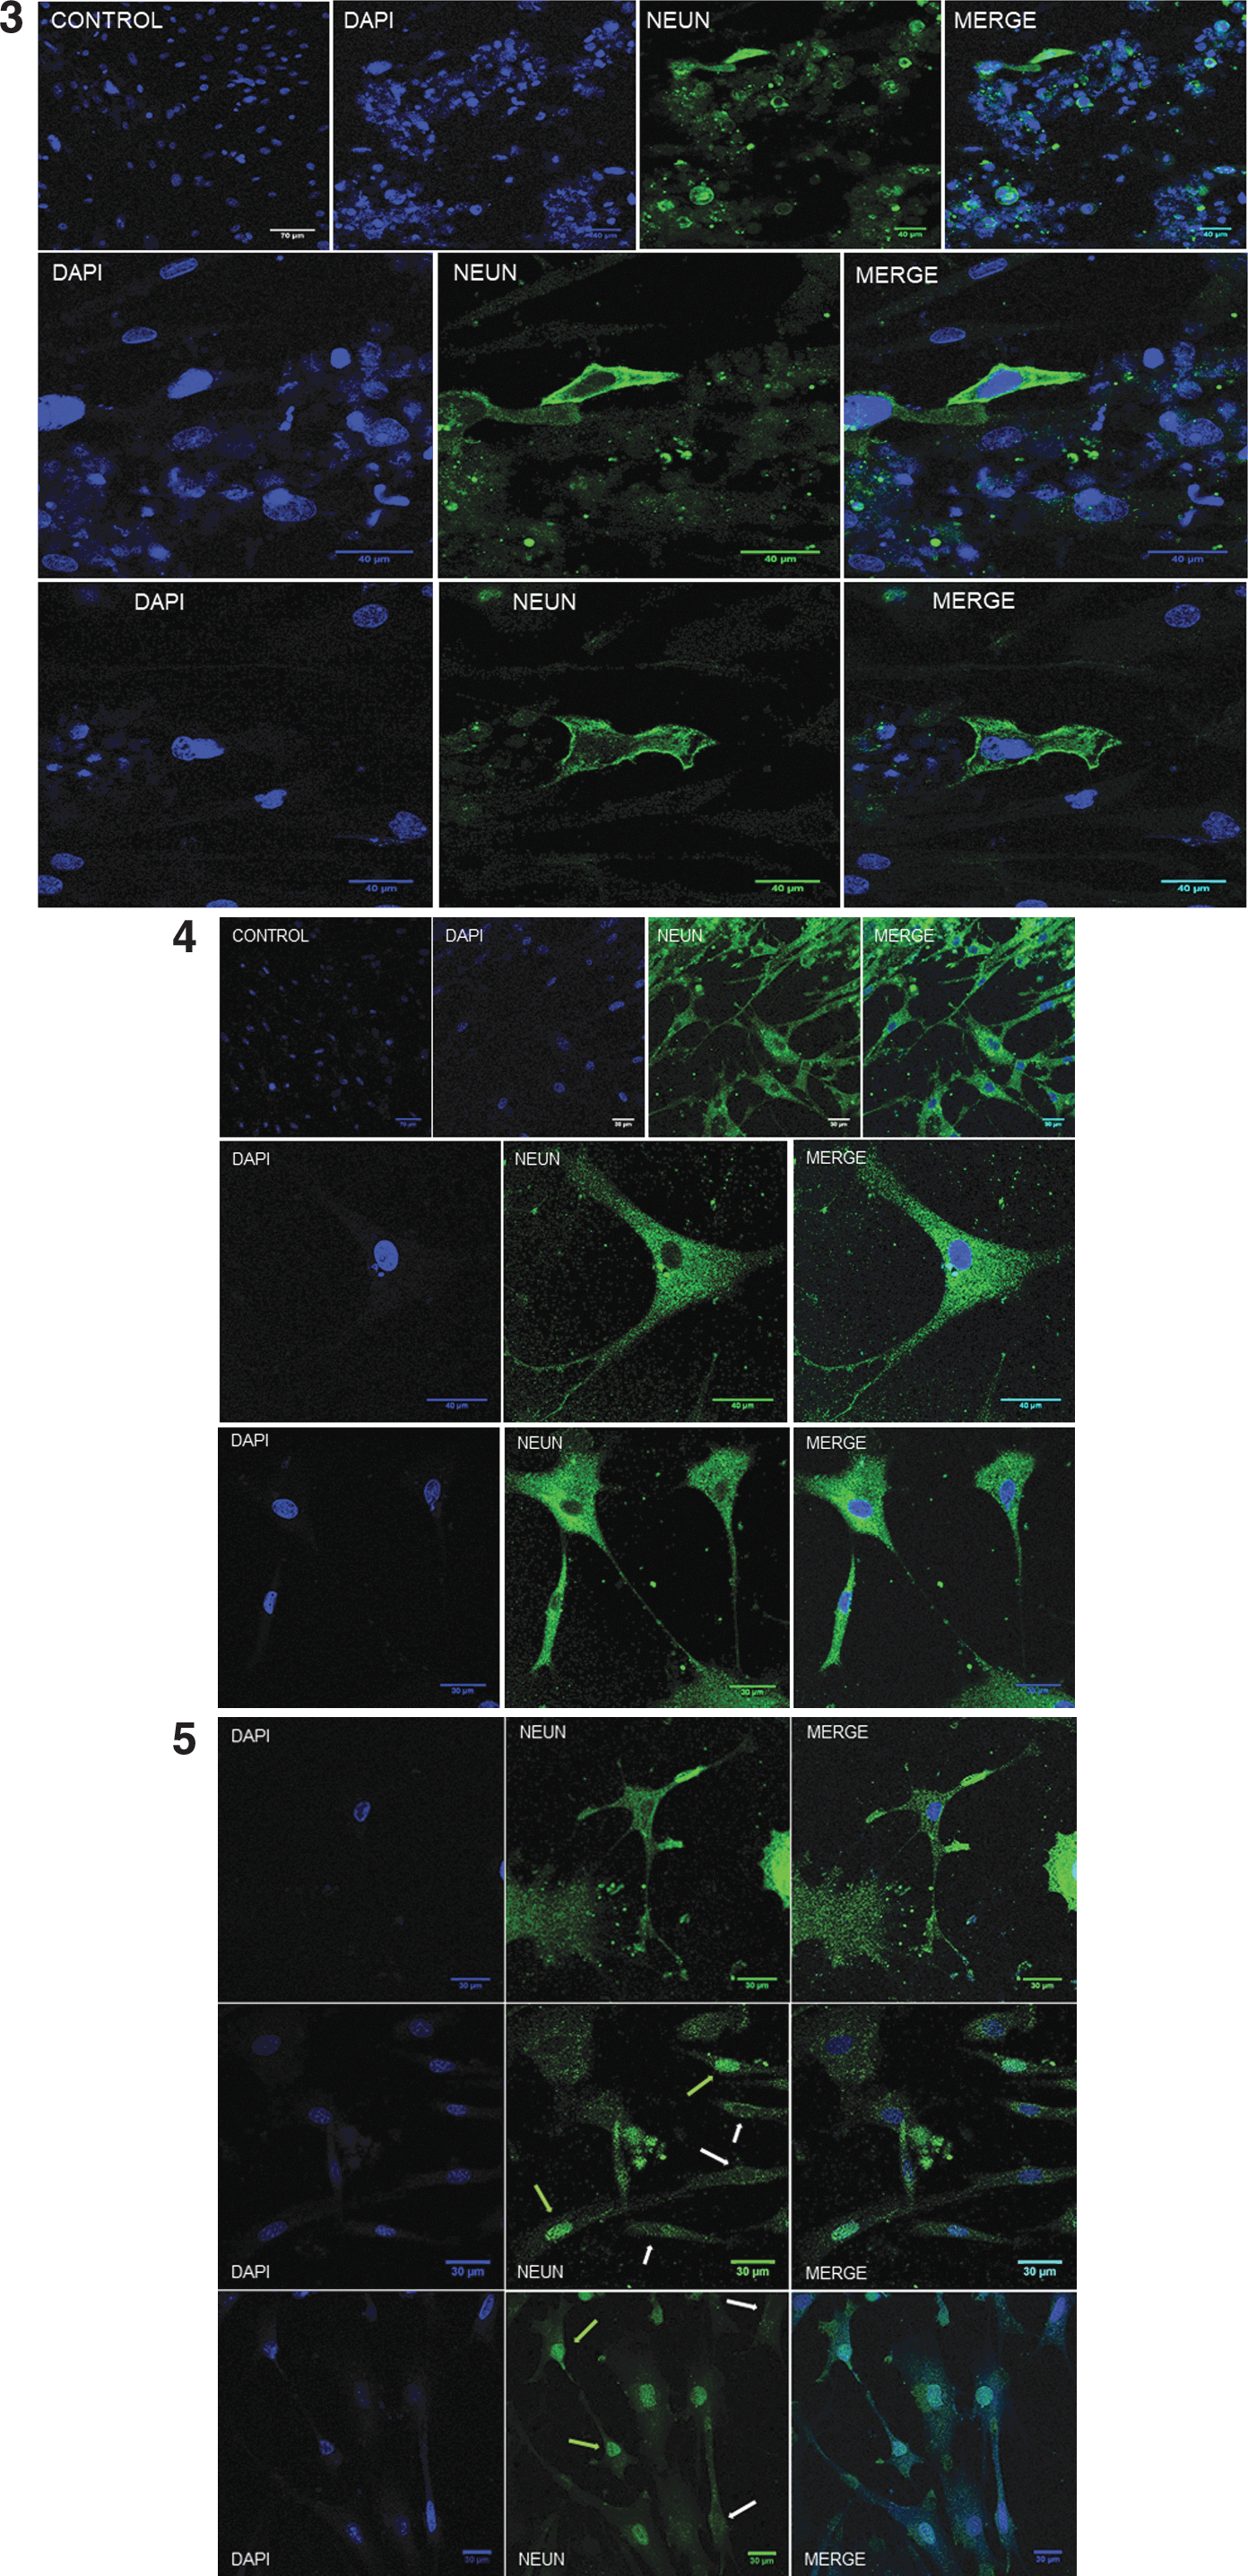
Immunolocalization of specific neural cell antigens revealed that significant number of cells, particularly those found in small cell aggregates, expressed the NPC marker Pax6 in nucleus and cytoplasm and the neural precursor marker DCX (Fig. 9, panels 1, 2). A majority of cells expressed the mature neuron marker NeuN either in the cytoplasm or the nucleus (Fig. 9, panels 3–5), with lesser incidence of cells expressing the astrocyte marker GFAP (Fig. 9, panel 1).
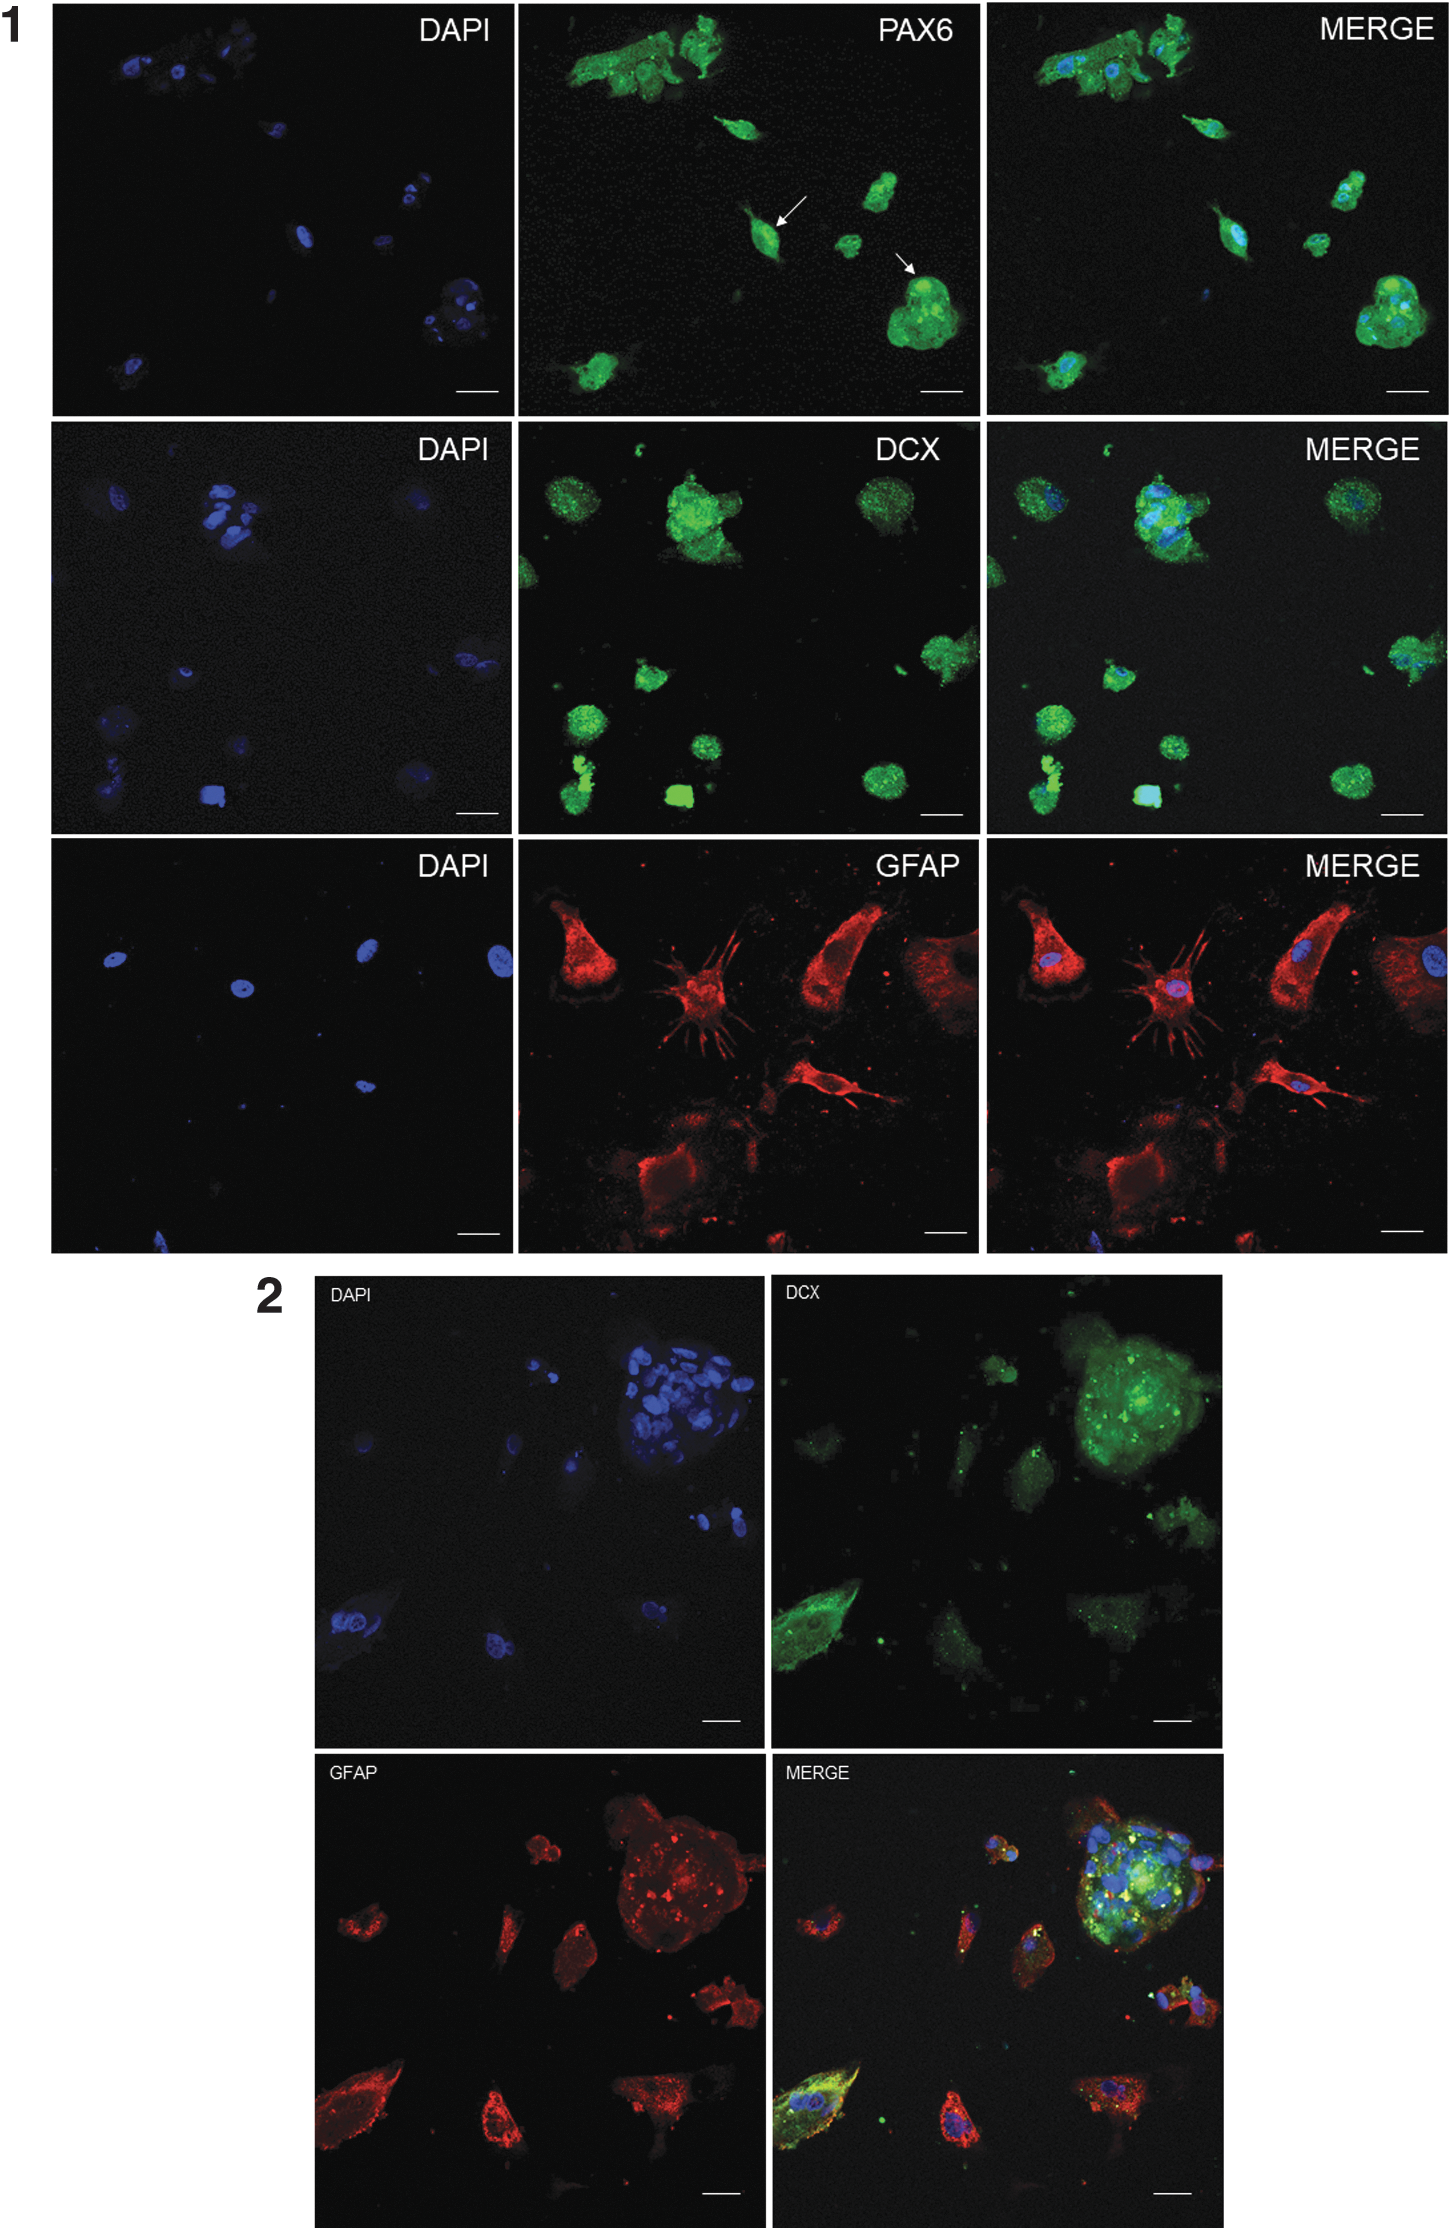
Photomicrographs corresponding to immunofluorescent localization of Pax6 (neural progenitors; green), DCX (neuronal precursors; green), GFAP (astrocytes; red), and NeuN (mature neurons; green) by confocal laser microscopy. Panel 1: Immunofluorescent localization of Pax6 (upper; arrow indicate nuclear localization) and DCX (middle) in small cell aggregates and surrounding isolated cells. GFAP was immunolocalized in isolated cells during culture under differentiation conditions (lower) and in DCX-positive cell aggregates (panel 2), with some surrounding cells that displayed both antigens (HC PL APO CS2, 20 × /0.75 dry; scale bar length corresponds to 20 μm). The mature neuron antigen NeuN was immunolocalized in the cytoplasm and/or nuclei of differentiating cells (panels 3–5). Positive cells localized to the periphery of small cell aggregates (panel 3; HC PL APO CS2, 20 × /0.75 dry) and were abundant across the entire growth surface with both cytoplasmic (panels 4, 5; HC PL APO CS2, 20 × /0.75 dry; HC PL APO CS2 63 × /1.40 oil, panel 4 middle and lower) and nuclear localization [panel 5; green arrows (+), white arrows (−); HC PL APO CS2, 20 × /0.75 dry]. Nuclei were counterstained with DAPI (blue). DAPI, 4′,6-diamidino-2-phenylindole.
These results demonstrate that spheroids spontaneously generated during culture of cells from ovarian cortical tissue under the conditions described in this study are neurospheres and that, in consistency with molecular and functional characterization performed, the cells comprising these spheroids are NSC/NPC.
Discussion
Spontaneous generation of cell spheroids occurred consistently when seeding ovarian cortical tissue cells as described in this culture system. During culture, spheroids expressed stemness transcription factors and characteristic markers of neural lineage. The neurosphere assay demonstrated the self-renewal capacity of these spheroids and the ability of cells integrating into the spheroids to differentiate into cell types displaying antigens specific to neurons and glia.
Cell spheroids are tridimensional, self-assembled aggregates that can be induced in vitro in response to different conditions that promote cell-to-cell contacts mediated by cell adhesion molecules, such as E-cadherin and connexins [2]. Alternatively, the high cell adhesion activity of cancer cells or stem cells gives rise to spontaneous spheroid formation regardless of simultaneous clonal expansion, such as occurs in neurospheres [7]. The spheroids generated in vitro in this study most likely resulted from rapid aggregation of dispersed cells from the initial cell suspension and were independent of subsequent cell proliferation. In fact, observations with an inverted microscope indicated that cell aggregation is present as early as 24 h of culture, and cell clusters had already formed in vitro by 48–72 h.
The large number of spheroids (65–75 spheroids/1.25 cm2 growth surface) that were spontaneously generated in all experiments, the spheroid morphology, and some events observed during culture, such as patterns of round cells migrating from spheroids toward particular areas of the growth surface or aggregating to spheres, as well as the apparent self-renewal activity, were suggestive of the stemness of the integrating cells. This possibility was supported by the extensive AP activity and the expression of stemness markers Oct4, Nanog, and Sox2 in spheroids during the entire culture period. The presence of PSCs integrating into spheroids in this culture system is consistent with the presence of stem cells in the surface epithelium [29,30] and cortical stroma [32,33] of ovary tissue in several mammalian species. Parte et al. found that OSE contains a small subpopulation of pluripotent embryonic-like stem cells that, under particular culture conditions, can give rise to oocytes, embryonic stem cell-like colonies, and embryoid body-like structures [30]. Interestingly, this study also reported the occasional presence of differentiated cells that had a neuronal-like morphology.
The culture system presented in this study yielded a consistently larger number of spheroids that had a homogeneous cell lineage relative to previous findings involving cultured OSE [29,30] or stromal cells [32,33]. The highly efficient and large-scale production of spheroids of homogeneous cell identity described here could be because this system is indeed a coculture of OSE and cortical stromal cells. Apart from the pluripotent component found both in OSE and ovarian cortical stroma, culture of a mixed population of ovarian cortical cells might highlight the neural-inducing activity of stromal cells present in the OSE cell population, which is similar to that seen for cocultures of iPSC with stromal cells, a procedure known as stromal cell-derived inducing activity [57], or after addition of specific stromal factors to culture medium of PSCs [58] that can induce highly efficient specification to NSCs and NPCs for directed differentiation experiments.
Recently, the neural-inducing activity of stromal cells from deciduous teeth was revealed, as was the ability of stromal cells to generate neural crest stem cells from embryonic stem cells [59]. In our experiments, putative neural-inducing activity of ovarian cortical stromal cells on OSE pluripotent cells seeded in coculture might have accounted for the large number of spheroids generated and for the uniform identity of the integrating cells. This possibility is consistent with findings from an earlier study showing that the number and size of neurospheres generated from a cell suspension could be used as indicators of neurogenicity and proliferative potential of the original stem cells in suspension [13].
Spheroids of this culture system expressed brachyury and AFP that are characteristic of mesoderm and endoderm specification, respectively, along with the predominant expression of neuroectodermal genes.
Transcription of genes characteristic of the three embryonic germ layers, with a predominant expression of those corresponding to neuroectodermal lineage, suggests that, under the conditions described, spheroids would first exist as embryoid bodies, and under adequate specification signals, cells would commit to a neuroectodermal cell fate. This possibility is further supported by results of time-dependent variations in Oct4, Nanog, and Sox2 expression, wherein on day 10 of culture, Sox2 transcription levels were strongly increased, whereas Oct4 and Nanog expression remained simultaneously downregulated throughout the culture period.
This finding is consistent with earlier studies showing that neural cell-fate commitment is closely preceded by a switch in the relative expression of Oct4, Nanog, and Sox2, with Sox2 expression predominating over that of Oct4 and Nanog [60]. Whereas sustained Sox2 expression can repress mesoendoderm differentiation and is essential to maintain stem cell self-renewal, Nanog selectively represses neuroectoderm differentiation, and Oct4 interacts with the BMP4 pathway to induce mesoderm specification. On day 10 of culture in this study, Nanog and Oct4 transcription levels were decreased whereas Sox2 gene expression increased relative to day 0 levels. This expression pattern leaves the neuroectodermal fate as the unique derivation pathway for cell specification between day 0 and 10. Simultaneous downregulation of brachyury expression, which is a characteristic gene of mesoderm specification, supports this possibility and could explain the predominant transcription of nestin, vimentin, p75NTR, and Pax6 in spheroids. Indeed, immunolocalization experiments demonstrated that most cells expressed vimentin, p75NTR, and Pax6, with a moderately high percentage of cells expressing nestin.
Taken together, these results confirm the presence of NSCs and NPCs as the main cell type that integrates into the spheroids. Notably, in these primary spheroids, transcription of DCX, GFAP, and Olig2 was upregulated around day 10 of culture, when spheroid cells could have attained an adequate status for terminal differentiation.
On days 10, 15, and 21, between 40% and 50% of sphere cells expressed nestin, a class IV intermediate filament protein used as the main marker of neural precursors [61,62]. During neural precursor differentiation, nestin expression is eventually replaced by proteins specific to neurons and glia. In this study, the percentage of cells that showed nestin expression was similar throughout the culture period, consistent with gene expression analyses showing similar transcription levels of nestin on days 10, 15, and 21 in culture. Most nestin-positive cells were found at the spheroid periphery, where most cells were also strongly positive for vimentin. Based on this finding, we hypothesize that nestin and vimentin-positive cells are the “light cells” that had been previously described [63].
Nestin is most frequently localized in the cytoplasm where it coassembles with vimentin to form intermediate filaments [64,65] and participates in vimentin distribution to daughter cells during cell division [66]. In contrast, here, nestin localized to the nuclei of spheroid cells. Such nuclear localization of nestin was previously reported for highly proliferative cells, such as NPC of vomeronasal organ during development [67], in cancer stem cells [68], and in adult NSC/NPCs of the postnatal central nervous system [69]. Nuclear localization of nestin could occur in response to phosphorylation by the kinases CDK5 and CDC2 during mitosis that induces nestin depolymerization [70] and promotes nestin transport to the nucleus where it could interact with nucleic acids to regulate gene expression. The nuclear localization of nestin observed in spheroids in the culture system described in this study is consistent with findings for adult neurospheres from the central nervous system [69].
The percentage of cells showing Pax6 expression was high in spheroids throughout the culture period, but particularly on day 15 (93.54% ± 1.35%). Pax6 expression was similarly detected in neurospheres generated by human adipose-derived mesenchymal stem cells [71,72] and by mesenchymal stromal cells from Wharton's jelly and bone marrow [71]. Pax6 functions in spheroids of this culture system should be similar to those exhibited during neurogenesis, where Pax6 is a specific and established NPC marker that plays an essential role in maintaining the NPC population and in promoting NSC/NPC responsiveness to EGF [73] as well as neuron and glia differentiation [74,75] by driving neurosphere cells toward neurogenesis [76].
Our results also demonstrate a time-dependent sustained increase in Pax6 expression, beginning on day 15 in culture, which could influence spheroid cell differentiation in this culture system. A relationship between the level of Pax6 expression and neurosphere size was previously observed [77] which, as indicated above, is correlated with higher spheroid neurogenicity [13]. Interestingly, in our system, increased transcription of Pax6 from basal levels at culture initiation occurred from day 15 onward, after the rise in Sox2 expression that occurred on day 10. Sox2 is essential for NSC self-renewal and multipotency [78]. Sox2 and Pax6 are known to modulate the expression of each other and to exhibit a regulatory interplay to maintain NSC self-renewal by controlling the balance between proliferation and differentiation. Indeed, Pax6 binds to the Sox2 promoter to upregulate its expression, resulting in increased proliferative activity of NPCs [79], which was similar to that seen in the adult brain hippocampus, where Pax6 is coexpressed with Sox2 to control NSC proliferation and neurogenesis [80].
These results indicate that this culture system could recapitulate key molecular events that normally occur during PSC specification to produce NSC/NPC in embryogenesis, and to maintain their self-renewal and multipotency. This possibility will be explored in future experiments.
A high percentage of cells in spheroids on days 10, 15, and 21 in culture expressed p75NTR (86.30% ± 2.37%; 78.90% ± 4.80%; 76.74% ± 11.0%, respectively), consistent with gene expression analyses. The p75NTR is a TNF-α superfamily receptor that is used by all neurotrophins and is closely related to cell stemness [81,82]. Moreover, p75NTR is a bona fide marker of neural crest stem cells [83] that undergo migration during embryogenesis to produce a variety of cell phenotypes [84]. Extensive localization of p75NTR was previously demonstrated in neurosphere-forming neural precursor cells from the central nervous system [85] that are involved in neurogenesis in response to neurotrophins. In addition, p75NTR is widely immunolocalized in neurosphere-forming neural progenitors isolated from the enteric nervous system [86], in neural progenitors derived from adult bone marrow [87], and in neurospheres integrated by neural crest cells derived from embryonic stem cells [59], among others.
Apart from being a NSC/NPC marker, p75NTR partners with TrK receptors to regulate stem cell differentiation, and downregulation of p75NTR expression during cell differentiation [88] influences cell survival, apoptosis, and cell migration, as well as other biological processes [89 –91]. Our results show that under the described conditions, p75NTR mainly localized to the nucleus. A similar nuclear localization of p75NTR was reported in Schwann cell lines such that, upon binding of neurotrophins to p75NTR, α-secretase releases the p75NTR intracellular domain that then translocates to the nucleus [92]. Furthermore, spiral ganglion Schwann cells undergo intensive proliferation after nuclear translocation of p75NTR [93]. Although in the culture system described in this study no exogenous neurotrophin were added, such neurotrophins are likely secreted to the conditioned medium by NSC/NPCs integrating into the spheroids, since NSCs synthesize neurotrophins that act in an autocrine and paracrine fashion [94]. Thus, p75NTR would likely mediate similar biological effects in this culture system.
Our results showed that large percentages of cells expressed nestin, vimentin, Pax6, and p75NTR, and a majority of cells coexpressed at least three of these transcripts, in support of the NPC/NSC identity of spheroid cells. The neurosphere assay demonstrated that spheroid cells cultured with defined media M1 and M2 proliferated during two consecutive cell expansion periods, and also had self-renewal activity that could generate new spheroids having a similar molecular signature after dissociation and subculture. Spheroid cells could differentiate into cells that display neuron-specific antigens (eg, DCX, and NeuN) and glia (eg, GFAP) when cultured with defined M2 medium during previous cell expansion periods. Therefore, spheroids generated in this culture system meet the characteristics of neurospheres. However, the molecular basis for the absence of differentiation of spheroid cells exposed to exogenous supplementation of EGF and FGF2 in defined medium (M1 group) during two expansion periods before culture that induces differentiation remains unclear.
Our results suggest that in this culture system neural induction should occur before the 10 first days of culture. Regulatory factors synthesized and secreted by ovarian cells during the culture period would likely accumulate in conditioned medium to promote neural induction of ovarian PSC in a paracrine fashion, like EGF and FGF2 [42,43], which are normally synthesized by somatic ovarian cells [95 –97]. This hypothesis was supported by the fact that supplementing culture medium with EGF and FGF2 receptor antagonists to abolish the actions of these factors triggered cell differentiation, in consistency with previous research [43,98].
Taken together we can conclude from our results that spheroids spontaneously generated in vitro after culture of cells from ovarian cortical tissue have molecular and functional characteristics that correspond to those of neurospheres. Future experiments will explore the differentiation potential of these cells for their eventual use in basic and applied stem cell biology.
Footnotes
Acknowledgments
This investigation was supported by the Ministerio de Economía y Competitividad, Gobierno de España (research grant AGL/2008-03227), by Universidad Complutense de Madrid, Programa de Creación y Consolidación de Grupos de Investigación (research group UCM-920380), and by UCM-Santander Research Grants (research grant PR41/17-21020). The authors thank Pedro Aranda Espinosa for his technical support during sample processing for histology and immunohistochemistry, Silvia Vázquez, Susana Ovalle, and Ricardo Ramos for their expertise and technical support for qRT-PCR analyses, Juan José Muñoz Oliveira and Luis Alonso Colmenar for their expert technical help during fluorescence microscopy, Javier Cebrián and Fernando Cobo for their technical and logistic support and Pilar Millán Pastor for providing technical equipment for ELISA analyses, and Ricardo García Mata for his work and collaboration on statistical analyses.
Methods and results contained in this article were presented as examples for validation of a patent entitled “Method to obtain neural stem cells/neural progenitor cells from nonembryonic ovarian cortical tissue,” reference number P2011601014, publication reference ES2605655A1, submitted to the Spanish Office of Patents OEPM. The procedure for processing of spheroids for histology and immunohistochemistry corresponds to patent P201300524/PCT/ES2014/000089.
Author Disclosure Statement
No competing financial interests exist.