
Abstract
Bronchopulmonary dysplasia (BPD), the most common complication of extreme preterm birth, can be caused by oxygen-related lung injury and is characterized by impaired alveolar and vascular development. Mesenchymal stromal cells (MSCs) have lung protective effects. Conversely, BPD is associated with increased MSCs in tracheal aspirates. We hypothesized that endogenous lung (L-)MSCs are perturbed in a well-established oxygen-induced rat model mimicking BPD features. Rat pups were exposed to 21% or 95% oxygen from birth to postnatal day 10. On day 12, CD146+ L-MSCs were isolated and characterized according to the International Society for Cellular Therapy criteria. Epithelial and vascular repair potential were tested by scratch assay and endothelial network formation, respectively, immune function by mixed lymphocyte reaction assay. Microarray analysis was performed using the Affymetrix GeneChip and gene set enrichment analysis software. CD146+ L-MSCs isolated from rat pups exposed to hyperoxia had decreased CD73 expression and inhibited lung endothelial network formation. CD146+ L-MSCs indiscriminately promoted epithelial wound healing and limited T cell proliferation. Expression of potent antiangiogenic genes of the axonal guidance cue and CDC42 pathways was increased after in vivo hyperoxia, whereas genes of the anti-inflammatory Janus kinase (JAK)/signal transducer and activator of transcription (STAT) and lung/vascular growth-promoting fibroblast growth factor (FGF) pathways were decreased. In conclusion, in vivo hyperoxia exposure alters the proangiogenic effects and FGF expression of L-MSCs. In addition, decreased CD73 and JAK/STAT expression suggests decreased immune function. L-MSC function may be perturbed and contribute to BPD pathogenesis. These findings may lead to improvements in manufacturing exogenous MSCs with superior repair capabilities.
Introduction
E
Emphysema is an important component of chronic obstructive pulmonary disease, and is predicted by the World Health Organization to be the third leading cause of death by 2030 [6]. BPD and emphysema are significant global health problems at the extreme stages of life. Both are characterized by arrested alveolar development or loss of alveoli, respectively. Both lack effective treatment strategies. Understanding how alveoli and the underlying capillary network develop and how these mechanisms are disrupted in disease are critical for developing efficient therapies.
Recent evidence suggests that bone marrow (BM-) and human cord-derived (C-) mesenchymal stromal cells (MSCs) or their cell-free conditioned media prevent lung injury in experimental oxygen-induced BPD in newborn rodents [7 –11]. This suggests that exogenous MSCs restore lung growth through potent paracrine effects. In recent years it has become clear that the lungs contain a resident population of lung (L-)MSCs, which harbor the capacity to suppress inflammation and promote repair [12 –14]. This raises the question why exogenous MSCs are capable of restoring lung development after oxygen injury, and resident L-MSCs are not. Understanding the role of L-MSCs in health and disease is crucial to translate cell-based therapies into the clinic.
Currently little is known about the role of L-MSCs in the normal developing lung or in the pathogenesis of BPD. The mesenchyme has long been acknowledged to be the source of important cues for lung development, although the majority of cell types in the mesenchyme were often described as fibroblasts based on their morphology. In the developing lung, where an extensive microvasculature is crucial for lung function, resident L-MSCs are likely important candidates for orchestrating the formation of the alveolar microvasculature, repair/regeneration, and tissue maintenance [15]. Importantly, L-MSCs are essential for the support of lung epithelial progenitor cells, which are unable to form colonies in their absence or in the presence of more differentiated myofibroblasts [16].
Based on these findings, we sought to identify how L-MSCs are affected in an experimental oxygen-induced rat model of BPD. We hypothesized that hyperoxia would perturb the phenotype and function of endogenous L-MSCs in oxygen-induced BPD in rats.
Materials and Methods
Neonatal rat model for oxygen-induced lung injury
All procedures were approved by the Animal Care Committee of the University of Ottawa (animal ethics protocol OHRI-1696). Animal care in this study was performed in accordance with institutional guidelines.
From the day of birth (P0.5), Sprague–Dawley rat pups and their dam (Charles River, Saint Constant, QC, Canada) were exposed to room air (21% oxygen) or hyperoxia (95%) for 10 days, as described previously [17]. Rats were kept in a 12-h light/dark cycle, and dams had ad libitum access to food and water. Rat pups were sacrificed on P12.5 by an intraperitoneal (i.p.) injection of pentobarbital sodium (euthanyl, 0.2 mL, 65 mg/mL; Bimeda-MTC Animal Health, Inc., Dublin, Ireland). See Table 1 for physiological animal data.
P < 0.05 with unpaired t-test.
Micro computerized tomography analysis
The pulmonary vasculature was visualized by perfusing lungs with a gelatin-barium sulfate solution as described previously through the pulmonary artery and subsequently inflation fixed using 10% buffered formalin, as described previously [17]. For the visualization of the alveoli and histology, lungs were inflation fixed with 10% buffered formalin under 20 cmH2O pressure [17]. For histology, lungs were paraffin-embedded, sectioned into 4 μm sections, and stained with hematoxylin and eosin.
Barium-perfused lungs were scanned using a Cu 0.11 m filter (100 kV, 100 μA) at a pixel size of 17 μm in a Bruker SkyScan 1272 system (Bruker microCT, Kontich, Belgium). The right upper lobes of inflation-fixed lungs were scanned without filter (40 kV, 250 μA) at a pixel size of 1.56 μm. Scans were reconstructed using NRecon software (version 1.6.9.8), and color-coded density (barium lungs) or structure separation (inflation-fixed lungs) projections and measurements were obtained using CTAn (version 1.14.4.1+) and CTVox software (version 3.0.0r1114) (all from Bruker).
Isolation of lung MSCs
L-MSCs were isolated as reported extensively elsewhere [18]. In brief, upon necropsy, lungs were removed and sequentially rinsed in 30% citrate-phosphate-dextrose-adenine-1 (CPDA-1) in PBS (vol/vol), PBS and Dulbecco's PBS + Sodium-pyruvate + Glucose (DPBS++). After finely mincing with a scalpel, an enzyme mixture consisting of 30 U neutral protease (LS02104; Worthington Biochemical Corporation, Lakewood, NJ), 2500 U collagenase type I (LS004196; Worthington Biochemical Corporation), and 500 U DNAse I (D5025-150KU; Sigma-Aldrich, St. Louis, MO) dissolved in 10 mL DPBS++ was added. Enzymatic digestion proceeded for 120 min at 37°C with regular gentle agitation and was stopped by adding 200 μL ethylenediaminetetraacetic acid (EDTA, 0.15 M, pH 7.4).
Cells were rinsed with 5% fetal bovine serum (FBS)/PBS and passed through a 100 μm cell strainer to obtain a single-cell suspension. After centrifugation and rinsing, the single-cell suspension was layered over Ficoll (1.073 g/cm3, Ficoll-Paque PREMIUM, 17-5446-52; GE Healthcare, Little Chalfont, United Kingdom), and centrifuged (20 min, 900 rcf, medium (5/10) acceleration, no deceleration, 19°C). Cells in the interphase were collected, rinsed, counted, and seeded at 10,000 cells/cm2 on culture-treated plastic flasks in L-MSC culture media (minimum essential media Eagle, alpha modification (αMEM, M8042; Sigma-Aldrich), supplemented with 4 mM
CD146+ L-MSCs were selected at passage 1 through magnetic bead selection (M-280 Dynabeads, 11205D; Life Technologies). Beads were coated with biotinylated polyclonal rabbit-anti-mouse IgG antibody (E0464; Dako, Agilent Technologies, Glostrup, Denmark) (10 μg secondary AB/100 μL beads). L-MSCs were incubated with anti-rat CD146 antibody (C35841; Lifespan Biosciences, Inc., Seattle, WA) and subsequently with the secondary antibody-coated magnetic beads. After magnetic separation, CD146+ L-MSCs were plated and frozen for further experiments. All L-MSCs were cultured at 5% O2 5% CO2 and used at passage 2–3 for experiments.
Flow cytometry analysis
CD146+ L-MSCs were labeled with the following antibodies: anti-CD166 (AF1172; R&D Systems, Minneapolis, MN) labeled with donkey-anti-goat IgG-AF488 (A11055; Life Technologies), anti-CD73 (551123; Becton Dickinson Biosciences, San Jose, CA) labeled with Zenon IgG1-R-phycoerythrin (RPE, Z25055; Life Technologies), anti-CD146 (C35841; Lifespan Biosciences, Inc.) labeled with Zenon IgG2a-AF488 (Z25103; Life Technologies), anti-CD90- allophycocyanin (APC)-eFluor780 (47-0900; eBioscience, Inc., San Diego, CA), anti-CD45-AF647 (MCA43A647; AbD Serotec, Oxford, United Kingdom), anti-major histocompatibility complex (MHC) class II RT1B (MCA46A647; AbD Serotec), anti-CD11b-AF647 (MCA275A647; AbD Serotec), anti-CD79a-AF647 (MCA2538A647; AbD Serotec), anti-CD34-AF647 (bs-2038R-A647; Bioss antibodies, Woburn, MA), and violet fixable live/dead cell stain (L34955; Life Technologies).
Flow cytometry was performed on a BD LSRFortessa cell analyzer (Beckton Dickinson Biosciences, Franklin Lakes, NJ), and data were analyzed using FlowJo v10 (FlowJo LLC, Ashland, OR).
Osteogenic, adipogenic, chondrogenic, and endothelial differentiation
Osteogenic, adipogenic, and chondrogenic differentiation was induced for 21 days using the R&D systems StemXVivo system, according to manufacturer's instructions (CCM007, CCM009, CCM011, CCM005, CCM020; R&D Systems, Minneapolis, MN). Differentiation was assessed by Alizarin Red S staining (osteogenic), Oil Red O staining, and Harris Hematoxylin counterstain (adipogenic) and Safranin O staining with fast green counterstain (chondrogenic). Chondrogenic differentiation was quantified by surface area analysis using ImageJ (Rasband, W.S., ImageJ, U. S. National Institutes of Health, Bethesda, MD,
RNA was isolated from the adipogenic differentiated cells using the Qiagen RNeasy Plus Mini kit (74136; Qiagen, Hilden, Germany) and the QIAshredder spin column (79656; Qiagen) according to manufacturer's instructions. cDNA was produced using the Maxima First Strand cDNA Synthesis Kit (K1672; ThermoFisher Scientific). Real-time polymerase chain reaction (PCR) was performed using IQ SYBR Green Supermix reagent (170–8882; Bio-Rad, Hercules, CA) and a Bio-Rad CFX96 real-time system. Primer sequences were as follows: PPARG Forward 5′-ACCACTCGCATTCCTTTGAC-3′, Reverse 5′-TGGGTCAGCTCTTGTGAATG-3′ (Integrated DNA Technologies (IDT, Coralville, IA), kindly provided by Dr. Yevgeniya Le and Dr. David Allan), GAPDH Forward 5′-ATGGCCAGCCTCGTCTCATAG-3′, Reverse 5′-CGTTGAACTTGCCGTGGGTAG-3′ (Eurofins Scientific, Ebersberg, Germany, [19]).
The endothelial differentiation protocol was modified from Chow et al. [20] and Yamamoto et al. [21]. In brief, CD146+ L-MSCs were plated in gelatin-coated tissue culture-treated 25 cm2 flasks at 5,000 cells/cm2 in 0.2 mL/cm2 completed endothelial cell growth medium (EGM-2 bullet kit, CC-3162; Lonza, Basel, Switzerland). After 7 days of differentiation, cells were incubated with Dil labeled acetylated low-density lipoprotein (DiI-Ac-LDL, 10 μg/mL, BT-902; Biomedical Technologies, Inc., Stoughton, MA) for 4 h. LDL+ cells were sorted by fluorescence activated cell sorting and plated on a Matrigel-coated (Matrigel Basement Membrane Matrix Growth Factor Reduced, 354230; Corning, Corning, NY) 48-well plate for network formation assay (90,000 cells/well, three wells per sample).
Network formation was assessed at 18 h by analyzing three photomicrographs per well (nine photomicrographs per sample) using a Nikon Eclipse TE2000-E inverted microscope (Nikon, Tokyo, Japan) and NIS-Elements v3.0 software (Nikon).
Colony-forming unit analysis
To assess clonogenic potential, L-MSCs were plated as single cells using a Beckman Coulter MoFlo XDP (Beckman Coulter, Brea, CA) into three 96-well plates per sample (1 cell/well), cultured for 10 days and stained with crystal violet. Colony size was measured using a Nikon Eclipse TE2000-E inverted microscope (Nikon) and NIS-Elements v3.0 software (Nikon), and colonies ≥0.2 mm2 were included in the analysis. The number of colonies per plate was averaged per sample and presented as a percentage of cells plated.
Wound healing assay
A wound healing assay was performed using rat lung alveolar type II cells (RLE-6TN, CRL-2300; ATCC, Manassas, VA) (modified from Vadivel [22]). Rat lung alveolar type II cells (RLE-6TN, CRL-2300; ATCC) were plated at 300,000 cells/well in a 12-well plate for ∼24 h until 80% confluent, at 21% O2 5% CO2 atmospheric conditions in completed growth medium according to ATCC instructions. 12 mm Hanging Millicell Cell Culture Inserts (PIHT30R48; EMD Millipore, Merck KGaA, Darmstadt, Germany) were coated with 0.75 mg/mL of rat tail collagen type I (CACB354236; VWR International, Radnor, PA) for 24 h, placed in a 12-well plate and seeded with 60,000 L-MSCs/well. CD146+ L-MSCs were cultured at 5% O2 for 24 h until 100% confluent.
Once RLE-6TN cells and CD146+ L-MSCs had reached the required confluency, the RLE-6TN cells were changed to serum-free growth medium and a single scratch was made with a sterile 200 μL pipette tip. After rinsing with PBS, fresh serum-free medium was added and photomicrographs were taken of the fresh scratch using a Nikon Eclipse TE2000-E inverted microscope (Nikon) and NIS-Elements v3.0 software (Nikon) (t = 0 h). Subsequently, the CD146+ L-MSC-coated insert was added to the well with RLE-6TN cells, covered with serum-free RLE-6TN medium, and cells were incubated for 24 h at 21% O2. After t = 24 h, inserts were removed and photomicrographs were taken.
The scratch/wound surface area was quantified using TScratch software (developed by Tobias Gebäck and Martin Schulz, ETH Zürich) [23], closure is given as a percentage of the original scratch surface area.
Generation and analysis of concentrated conditioned medium
Conditioned medium was generated as published previously [24]. In brief, CD146+ L-MSCs were plated at 5,000 cells/cm2 and grown until ∼80% confluency in complete L-MSC medium, at which point they were rinsed twice in PBS and changed to serum-free L-MSC medium. After 24 h, the concentrated conditioned medium (CdM0 was harvested and centrifuged for 5 min at 300 rcf, 4°C to pellet dead cells. The supernatant was transferred to Amicon Ultra Centrifugal Filter Units (UFC900396; EMD Millipore) and centrifuged at 4,000 rcf, 4°C for 45 min. Concentrated CdM was immediately aliquoted, snap-frozen, and stored at −80°C for further use.
The levels of thrombospondin 1, angiostatin, and endostatin in concentrated CdM were determined according to manufacturer's instructions using the following enzyme-linked immunosorbent assays (ELISAs) from LifeSpan Biosciences: rat thrombospondin 1 ELISA kit (LS-F21616-1), rat angiostatin ELISA kit (LS-F6297-1), and rat endostatin ELISA kit (LS-F6296-1).
Epithelial oxygen toxicity assay
RLE-6TN cells were plated at 10,000 cells/200 μL/well in two 96 well plates, one each for normoxic (21% O2, 5% CO2) and hyperoxic (85% O2, 5% CO2) conditions. Concentrated CdM (3.7 μL/well of 0.5 cm2, corresponding with 7.3 μL concentrated CdM/cm2 of original CD146+ L-MSC culture surface area) was added in triplicate for three CD146+ L-MSC samples from either normoxic or hyperoxic animals. After a 72-h incubation period, cell viability was measured using the Vybrant MTT Cell Proliferation Assay Kit (Life Technologies; V13154) according to manufacturer's instructions, as previously published [25].
Endothelial network formation assay
Primary rat pulmonary microvascular endothelial cells (PMVECs) were isolated from 6-day-old rat pups as previously reported [26]. PMVECs were seeded at a density of 90,000 cells/well of a 48-well plate coated with Matrigel (Matrigel Basement Membrane Matrix Growth Factor Reduced, 354230; Corning) in EBM-2 basal media (CC-3156; Lonza). Concentrated CD146+ L-MSC CdM (8 μL/well of 1 cm2) was added in triplicate for three CD146+ L-MSC samples from either normoxic or hyperoxic animals. Peak network formation was at 4 h, at which point 3 photomicrographs were taken per well for analysis using a Nikon Eclipse TE2000-E inverted microscope (Nikon) and NIS-Elements v3.0 software (Nikon). Network analysis was performed by measuring the number and length of cords, and the number of intersections using NIS-Elements v3.0 software (Nikon).
Endothelial proliferation, apoptosis/necrosis, and migration assays
To assess the effect of CD146+ L-MSC CdM on PMVEC viability and function, proliferation, apoptosis/necrosis, and migration assays were performed. To measure proliferation and apoptosis/necrosis, PMVECs were seeded at a density of 2 × 10³ cells/well in a 96-well plate coated with 50 μg/mL rat tail collagen type I (VWR international) and cultured in completed EGM-MV2 medium (Endothelial Cell Growth Medium MV 2, C-22022, PromoCell, Heidelberg, Germany) at 5% O2 5% CO2 for 48 h.
For the proliferation assay, PMVECs were subsequently cultured for 24 h in starvation medium (0.2% FBS + Endothelial Cell Basal Medium MV 2, C-22221; PromoCell), before changing to starvation medium with added bromodeoxyuridine (BrdU), CdM and/or recombinant rat VEGF-164 (rrVEGF, 30 ng/mL, [27], 564-RV-010; R&D systems), or recombinant rat FGF2 (rrFGF2,10 ng/mL, [27], 3339-FB-025; R&D systems) for another 24 h. Cells were then fixed and stained for colorimetric analysis at a wavelength of 450/550 nm according to the manufacturer's instructions for the BrdU cell proliferation ELISA kit (ab126556; Abcam, Cambridge, United Kingdom).
For the apoptosis/necrosis assay, PMVECs were rinsed and directly incubated with starvation medium, CdM and/or rrVEGF or rrFGF2. After 24 h, the Apoptosis/Necrosis Detection Kit (Ab176750; Abcam) was used according to manufacturer's instructions. Apoptotic and necrotic cells were quantified using a Thermo Scientific ArrayScan VTI.
To assess PMVEC migration capability, PMVECs were seeded in a 24-well plate coated with 50 μg/mL rat tail collagen type I and grown until ∼80% confluency in completed EGM-MV2 medium at 5% O2 5% CO2. Cell monolayers were then scratched with a 10 μL pipette tip, rinsed twice in PBS, and imaged at t = 0 h and t = 24 h. The scratch/wound surface area was quantified using TScratch software as mentioned previously.
Mixed lymphocyte reaction assay
The effect of L-MSCs on lymphocyte proliferation was tested by coculturing L-MSCs with primary rat T cells (modified from Muul [28]). Spleens from four 14-day-old rat pups were mechanically dissociated to obtain a single-cell suspension kept in ice-cold rat splenocyte medium made according to Weiss et al. [29] supplemented with 20 U/mL recombinant rat IL2 (502-RL-010; R&D systems) to promote viability [30]. The MACS Pan T cell rat MicroBead Kit (130-090-320; Miltenyi Biotec GmbH, Bergisch Gladbach, Germany) was used to purify T cells from the splenocyte suspension, according to manufacturer's instructions using LS columns.
Obtained T cells were stained with carboxyfluorescein succinimidyl ester (CFSE, 1 μM CFSE/106 T cells final concentration, C34554, Life Technologies), stimulated using 1 × Cell Stimulation cocktail per volume of cells (00-4970-93; eBioscience) and plated at 5 × 10⁴ cells/200 μL/well of a 96-well plate in rat splenocyte medium. 5 × 10³ CD146+ L-MSCs were added in triplicate wells per sample, using n = 3 per group. CD146+ L-MSCs were native or preconditioned for 48 h with interferon γ (recombinant rat IFNγ, 585-IF-100; R&D Systems). Plates were incubated at 21% O2, 5% CO2 for 5 days. Upon readout, cells were stained with propidium iodide and anti-CD45-Alexa Fluor 647 antibody (0.5 μL/well, MCA43A647; AbD Serotec).
T cell proliferation was measured by flow cytometry (LSRFortessa; Beckton Dickinson Biosciences) and analyzed using FlowJo V10 (FlowJo LLC, Ashland, OR). As a measure of proliferation, the division and proliferation index were used as defined by FlowJo [31], respectively, representing the number of divisions of all cells and the number of divisions of proliferating cells.
Microarray execution, analysis, and validation
RNA was isolated from CD146+ L-MSCs (n = 3 per group) using a QIAshredder (79656; Qiagen, Hilden, Germany) and RNeasy Plus Mini kit (74136; Qiagen), according to manufacturer's instructions. RNA quality was ensured using the Agilent 2100 Bioanalyzer (Agilent Technologies, Santa Clara, CA). Whole transcript analysis was performed using the rat gene 2.1 ST array (Affymetrix, Santa Clara, CA).
Significant up- and down-regulated genes were identified by significance analysis of microarrays, followed by gene set enrichment analysis (GSEA software V2.1.0, Broad Institute) [32,33], as described previously [34]. A default false discovery rate (FDR) of 0.25 identified differential gene set enrichment. Pathway interactions were visualized using Cytoscape software V3.1.1 [35], using the following cutoffs: P-value 0.05, Q-value 0.25, and Jaccard and overlap combined similarity 0.25. Microarray data were deposited in the Gene Expression Omnibus (GEO accession number GSE99633;
A selection of genes of interest was validated by real-time PCR, using the following primers: housekeeping gene PGK1: Forward 5′- ATGCAAAGACTGGCCAAGCTAC-3′ Reverse 5′- AGCCACAGCCTCAGCATATTTC-3′ [36]; SEMA3A: Forward 5′-GAGTGATGTAAGAAGGGTGTTCC-3′ Reverse 5′- CAAGTTCCTGGTCGTGGATAAG-3′ [37]; FGF1 Forward 5′- ATGGCCGAAGGGGAGATCACAACC-3′ Reverse 5′- TTAGTCAGAAGATACCGGGAGGGG-3 [38] ′; FGF2 Forward 5′- TTCACAGCCTGTGCTCTAGGG-3′ Reverse 5′- GATCGGGTCAGGTTTTGGAAA-3′ (RTPrimerDB, ID 1399); FGF10 Forward 5′- GGGGAAACTCTATGGCTCAAAAG-3′ Reverse 5′- CCACATACATTTGCCTGCCG-3′ (designed by JJPC, using NCBI primer BLAST (refseq record NM_012951.1).
Statistics
Statistical analyses were performed using GraphPad Prism version 6.07 (GraphPad Software, Inc., La Jolla, CA). Statistical significance was determined by nonparametric tests when total n < 20, either by Mann–Whitney test (two groups) or by Kruskal–Wallis test followed by Dunn's multiple comparisons test (>two groups). For analysis of the mixed lymphocyte reaction (MLR) assay (n > 20), a one-way analysis of variance (ANOVA) with Holm–Sidak's multiple comparisons test was used. When comparing two variables two-way ANOVA with Sidak's multiple comparisons test was used. Significance was accepted when P < 0.05. Data are presented as median ± range for nonparametric tests, unless otherwise indicated and mean ± standard error of mean (SEM) for parametric tests.
Results
Hyperoxia exposure impairs development of the pulmonary microvasculature and leads to alveolar simplification
Alveolar spaces were visualized by color-coding the separation between structures in micro-computed tomography (μCT) scans of the distal lung. In a normoxia P14 rat lung, this revealed a multitude of smaller alveolar spaces (Fig. 1A, B), which is consistent with histology (Fig. 1C). Conversely, hyperoxia exposure resulted in a shift to larger alveolar spaces (Fig. 1A–C).
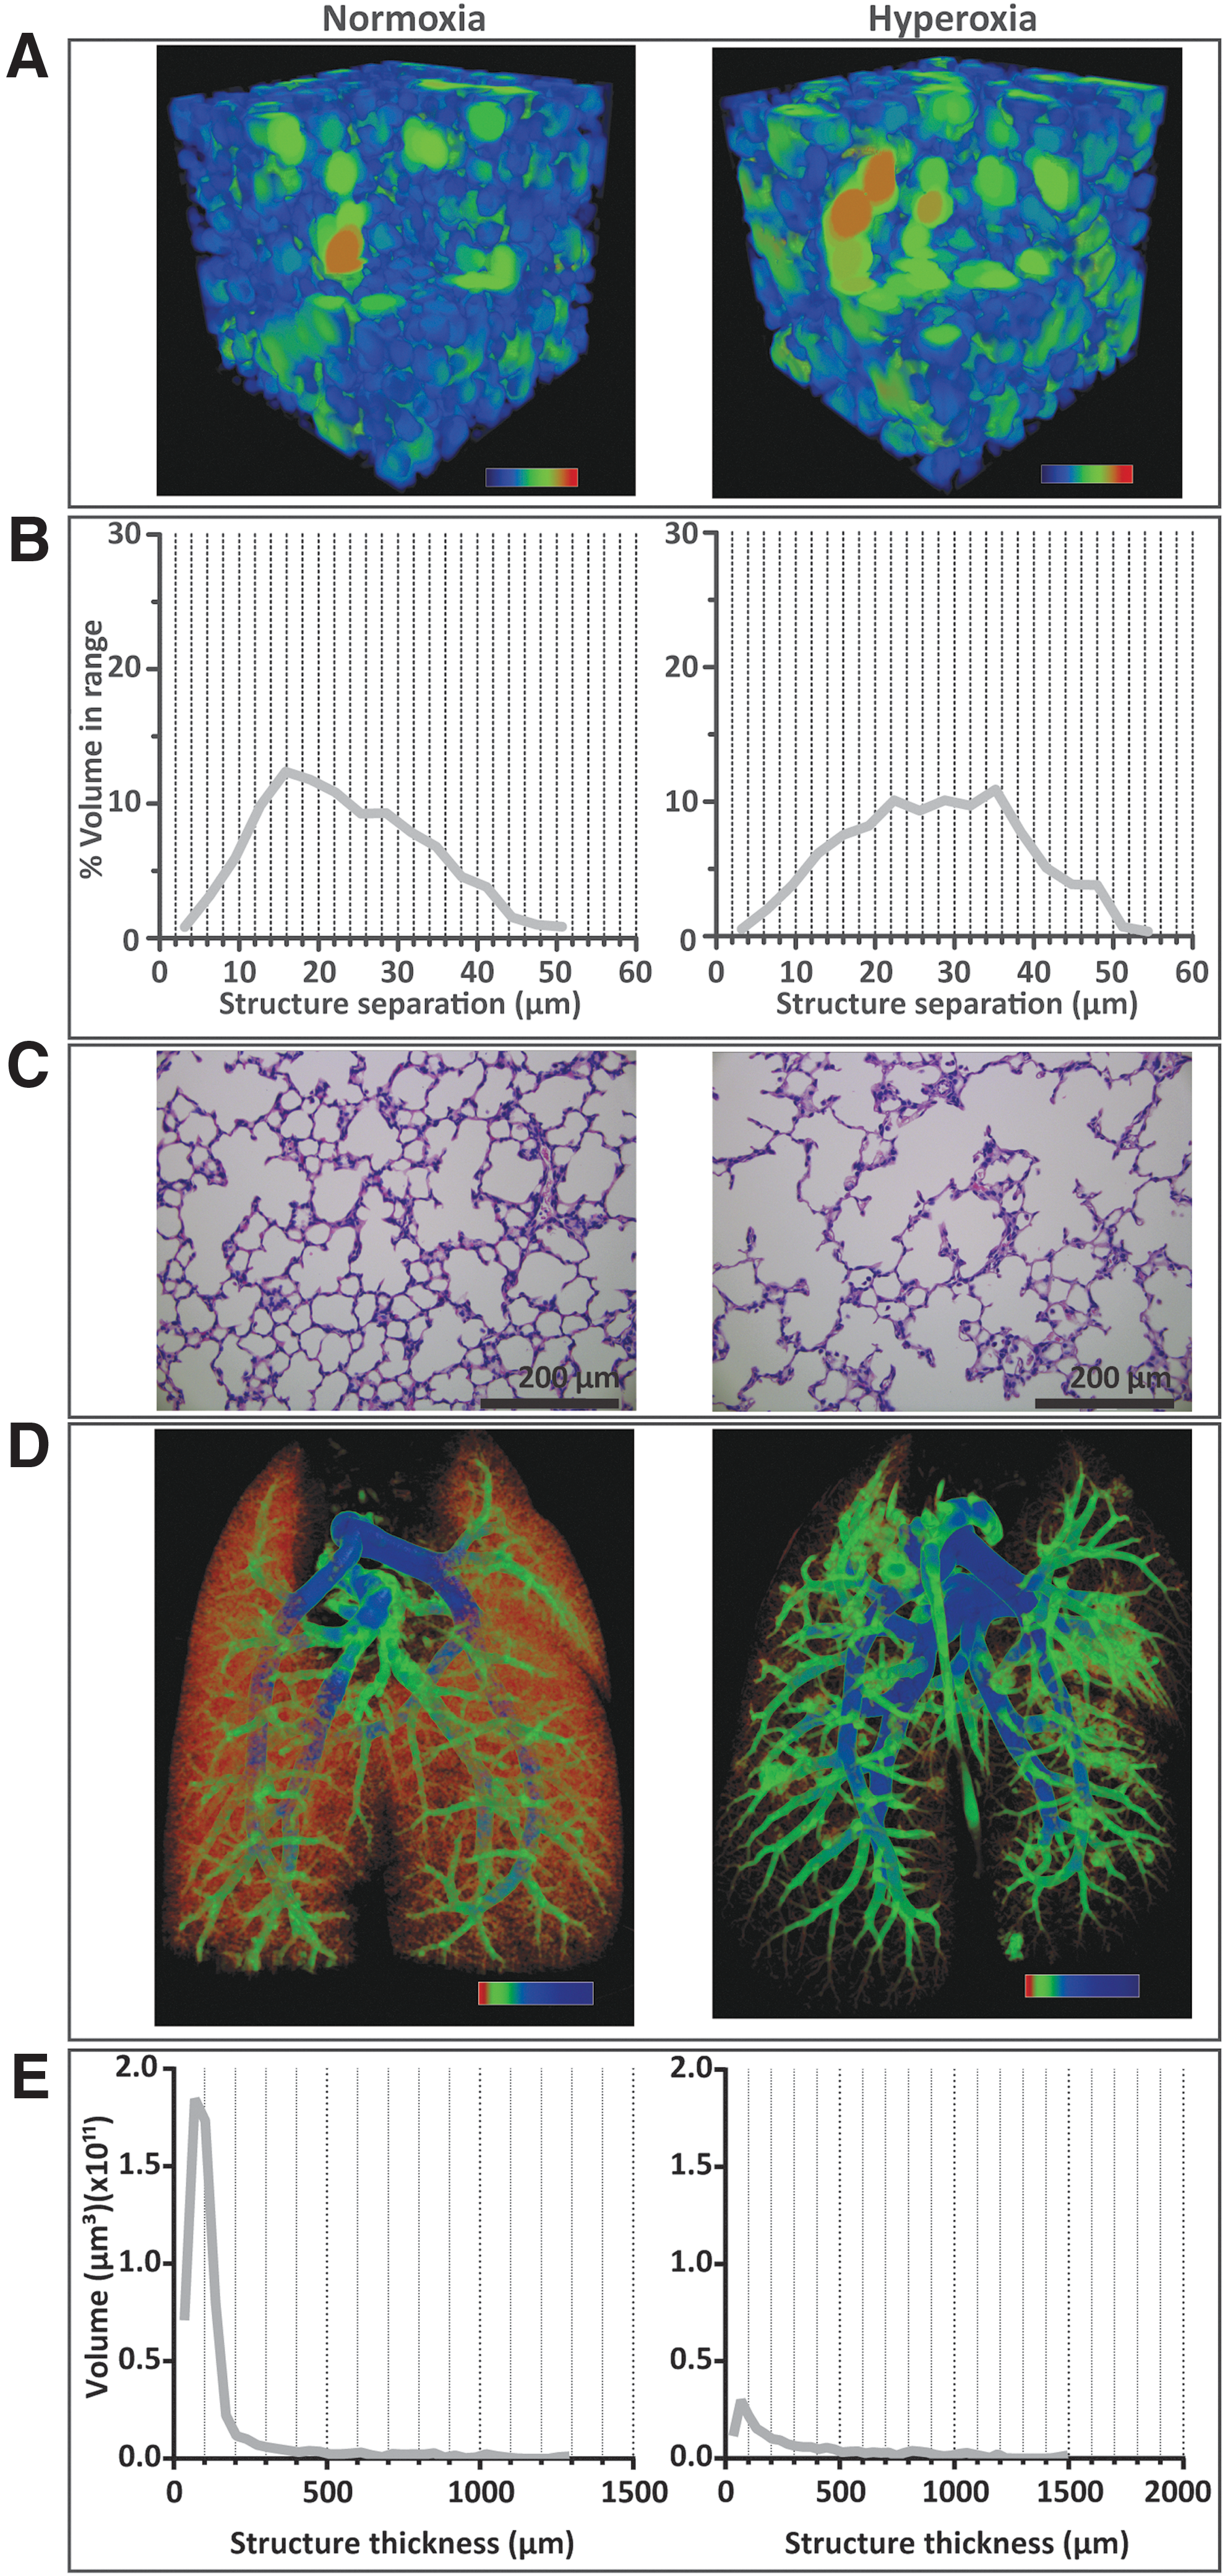
Hyperoxia exposure of neonatal rat pups impaired microvascular and alveolar development.
The impact of postnatal hyperoxia exposure on the developing microvasculature is clearly visualized in μCT images of barium-infused lungs from P14 rat pups. Structure thickness analysis of the vessels revealed a dense microvasculature in the lungs of pups housed in normoxia (Fig. 1D, E). The microvasculature was strikingly reduced in the lungs of pups kept in hyperoxia (Fig. 1D, E), in which the volume of vessels within the 17–200 μm range was reduced up to sixfold compared with normoxia lungs. Together, these morphological changes underline the drastic impairment induced by postnatal hyperoxia exposure on alveolar and microvascular development during the saccular and alveolar stages of lung development.
Hyperoxia decreases CD73 expression in CD146+ L-MSCs, but does not affect clonal or differentiation capacity
CD146-selected L-MSCs, which henceforth are referred to as CD146+ L-MSCs, were first assessed for the three classical hallmarks of MSC phenotype: clonal capacity, surface marker expression, and differentiation capacity [39]. CD146+ L-MSCs isolated from P12.5 rat pups displayed 70–75% colony-forming efficiency as assessed by single-cell plating colony-forming assay (Fig. 2A). Clonality was slightly lower in L-MSCs derived from hyperoxia-exposed pups (65–75%), but this difference was not significant.
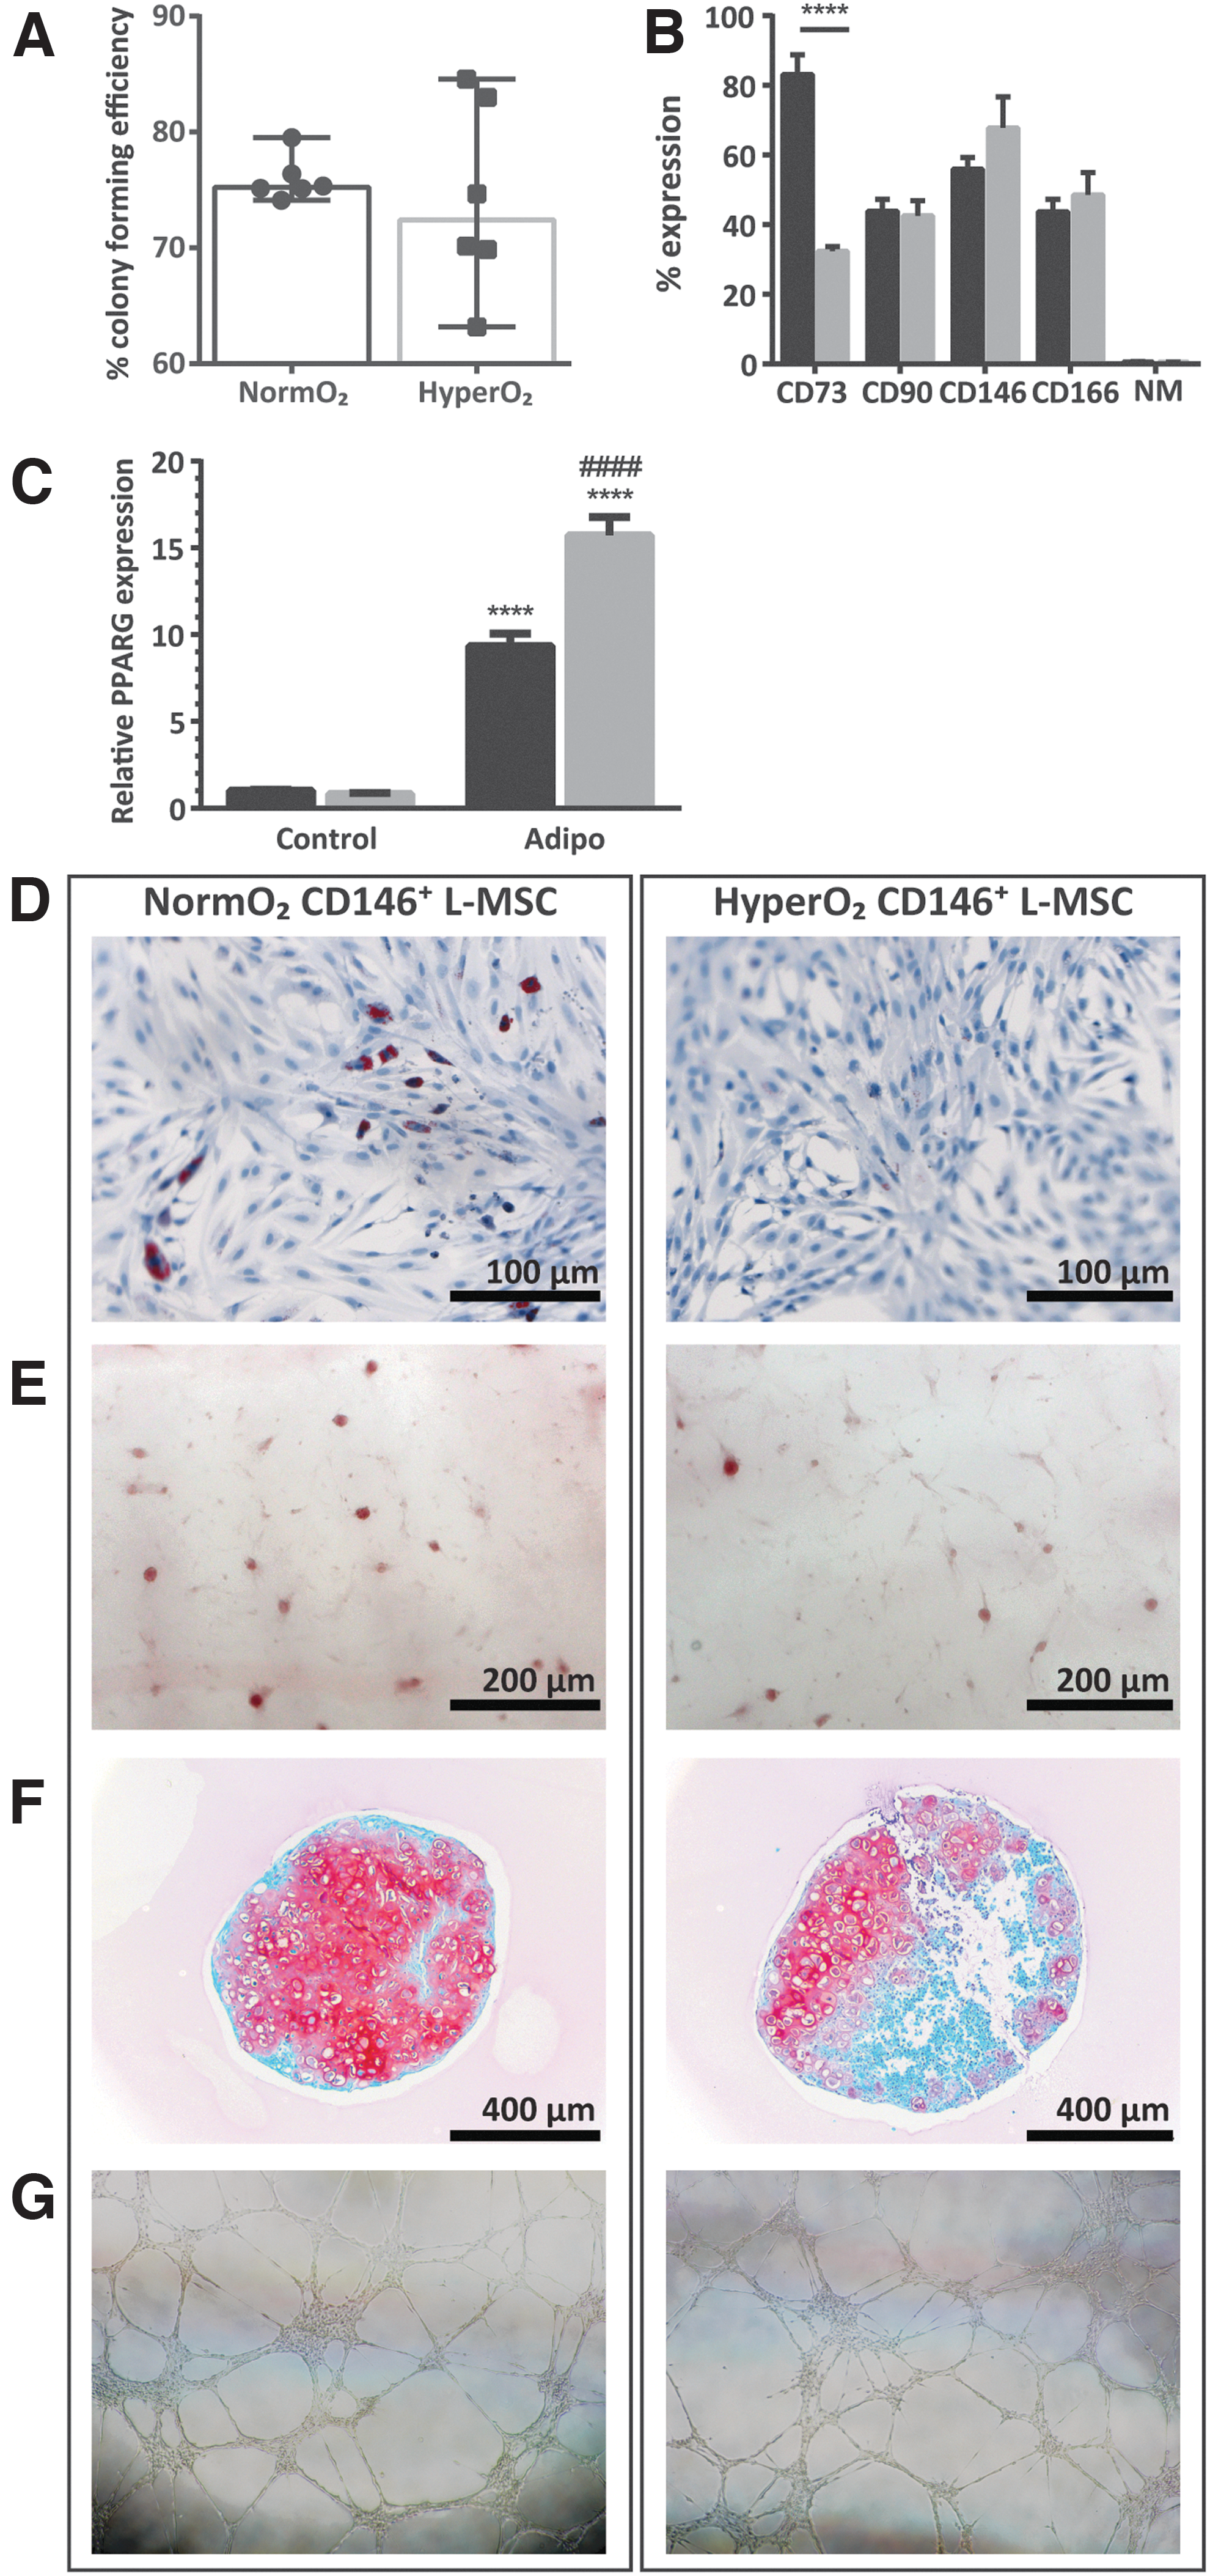
Decreased expression of CD73, but not differentiation or clonal capacity, in CD146+ L-MSCs exposed to in vivo hyperoxia.
Second, CD146+ L-MSCs were analyzed for expression of the classical MSC markers CD73 and CD90, CD166, and the absence of the negative markers CD45, MHC class II RT1B, CD11b, CD79a, and CD34 (Fig. 2B). L-MSC populations from both groups displayed around 40–50% positivity for CD90 and CD166 and consistent very low expression of the negative markers (<0.7%). Interestingly, whereas 83.1% of normoxic CD146+ L-MSCs expressed CD73, only 32.4% of hyperoxia-derived CD146+ L-MSCs did. Furthermore, within one passage of selecting for CD146-expressing L-MSCs, 33–44% of cells have already lost this surface marker.
Third, CD146+ L-MSCs were induced to differentiate along the three classical lineages of MSC differentiation: adipogenic (Fig. 2C, D), osteogenic (Fig. 2E), and chondrogenic (Fig. 2F). Normoxia-derived CD146+ L-MSCs gave rise to a small number of adipocytes, although the majority of cells retained a largely fibroblast-like morphology containing only small lipid vesicles, potentially representing preadipocytes or lipofibroblasts. This was confirmed by the expression of the adipogenesis marker PPARG, which was increased 10-fold compared to undifferentiated controls. In addition, they could produce osteogenic and chondrogenic matrix.
In comparison, hyperoxia-derived CD146+ L-MSCs produced little to no adipocytes, and visually produced less osteogenic and chondrogenic matrix (mean ± SEM chondrogenic surface area: hyperoxia 30.14% ± 13.45% vs. normoxia 38.70% ± 18.34%, P = 0.7). Surprisingly, PPARG expression was 15-fold increased over undifferentiated controls in hyperoxia-derived CD146+ L-MSCs, despite the absence of lipid vesicle containing cells, which was significantly greater than in normoxia-derived CD146+ L-MSCs.
CD146+ L-MSCs were also induced to differentiate along the endothelial lineage (Fig. 2G). Regardless of in vivo hyperoxic exposure, this resulted in an extremely high proportion of cells able to uptake LDL (mean ± SEM: hyperoxia 97.02% ± 0.48% vs. normoxia 96.98% ± 0.49%). LDL+ cells could form and maintain highly complex networks in Matrigel for up to 45 h, which is 6 times longer than PMVECs can. LDL− cells also initially formed networks, but these collapsed shortly after 24 h (Fig. 3). Despite displaying these two hallmarks of endothelial function, endothelial-induced CD146+ L-MSCs did not have increased vascular endothelial growth factor receptor 2 or Von Willebrand factor expression (Fig. 3), indicating functional mimicry rather than actual differentiation.
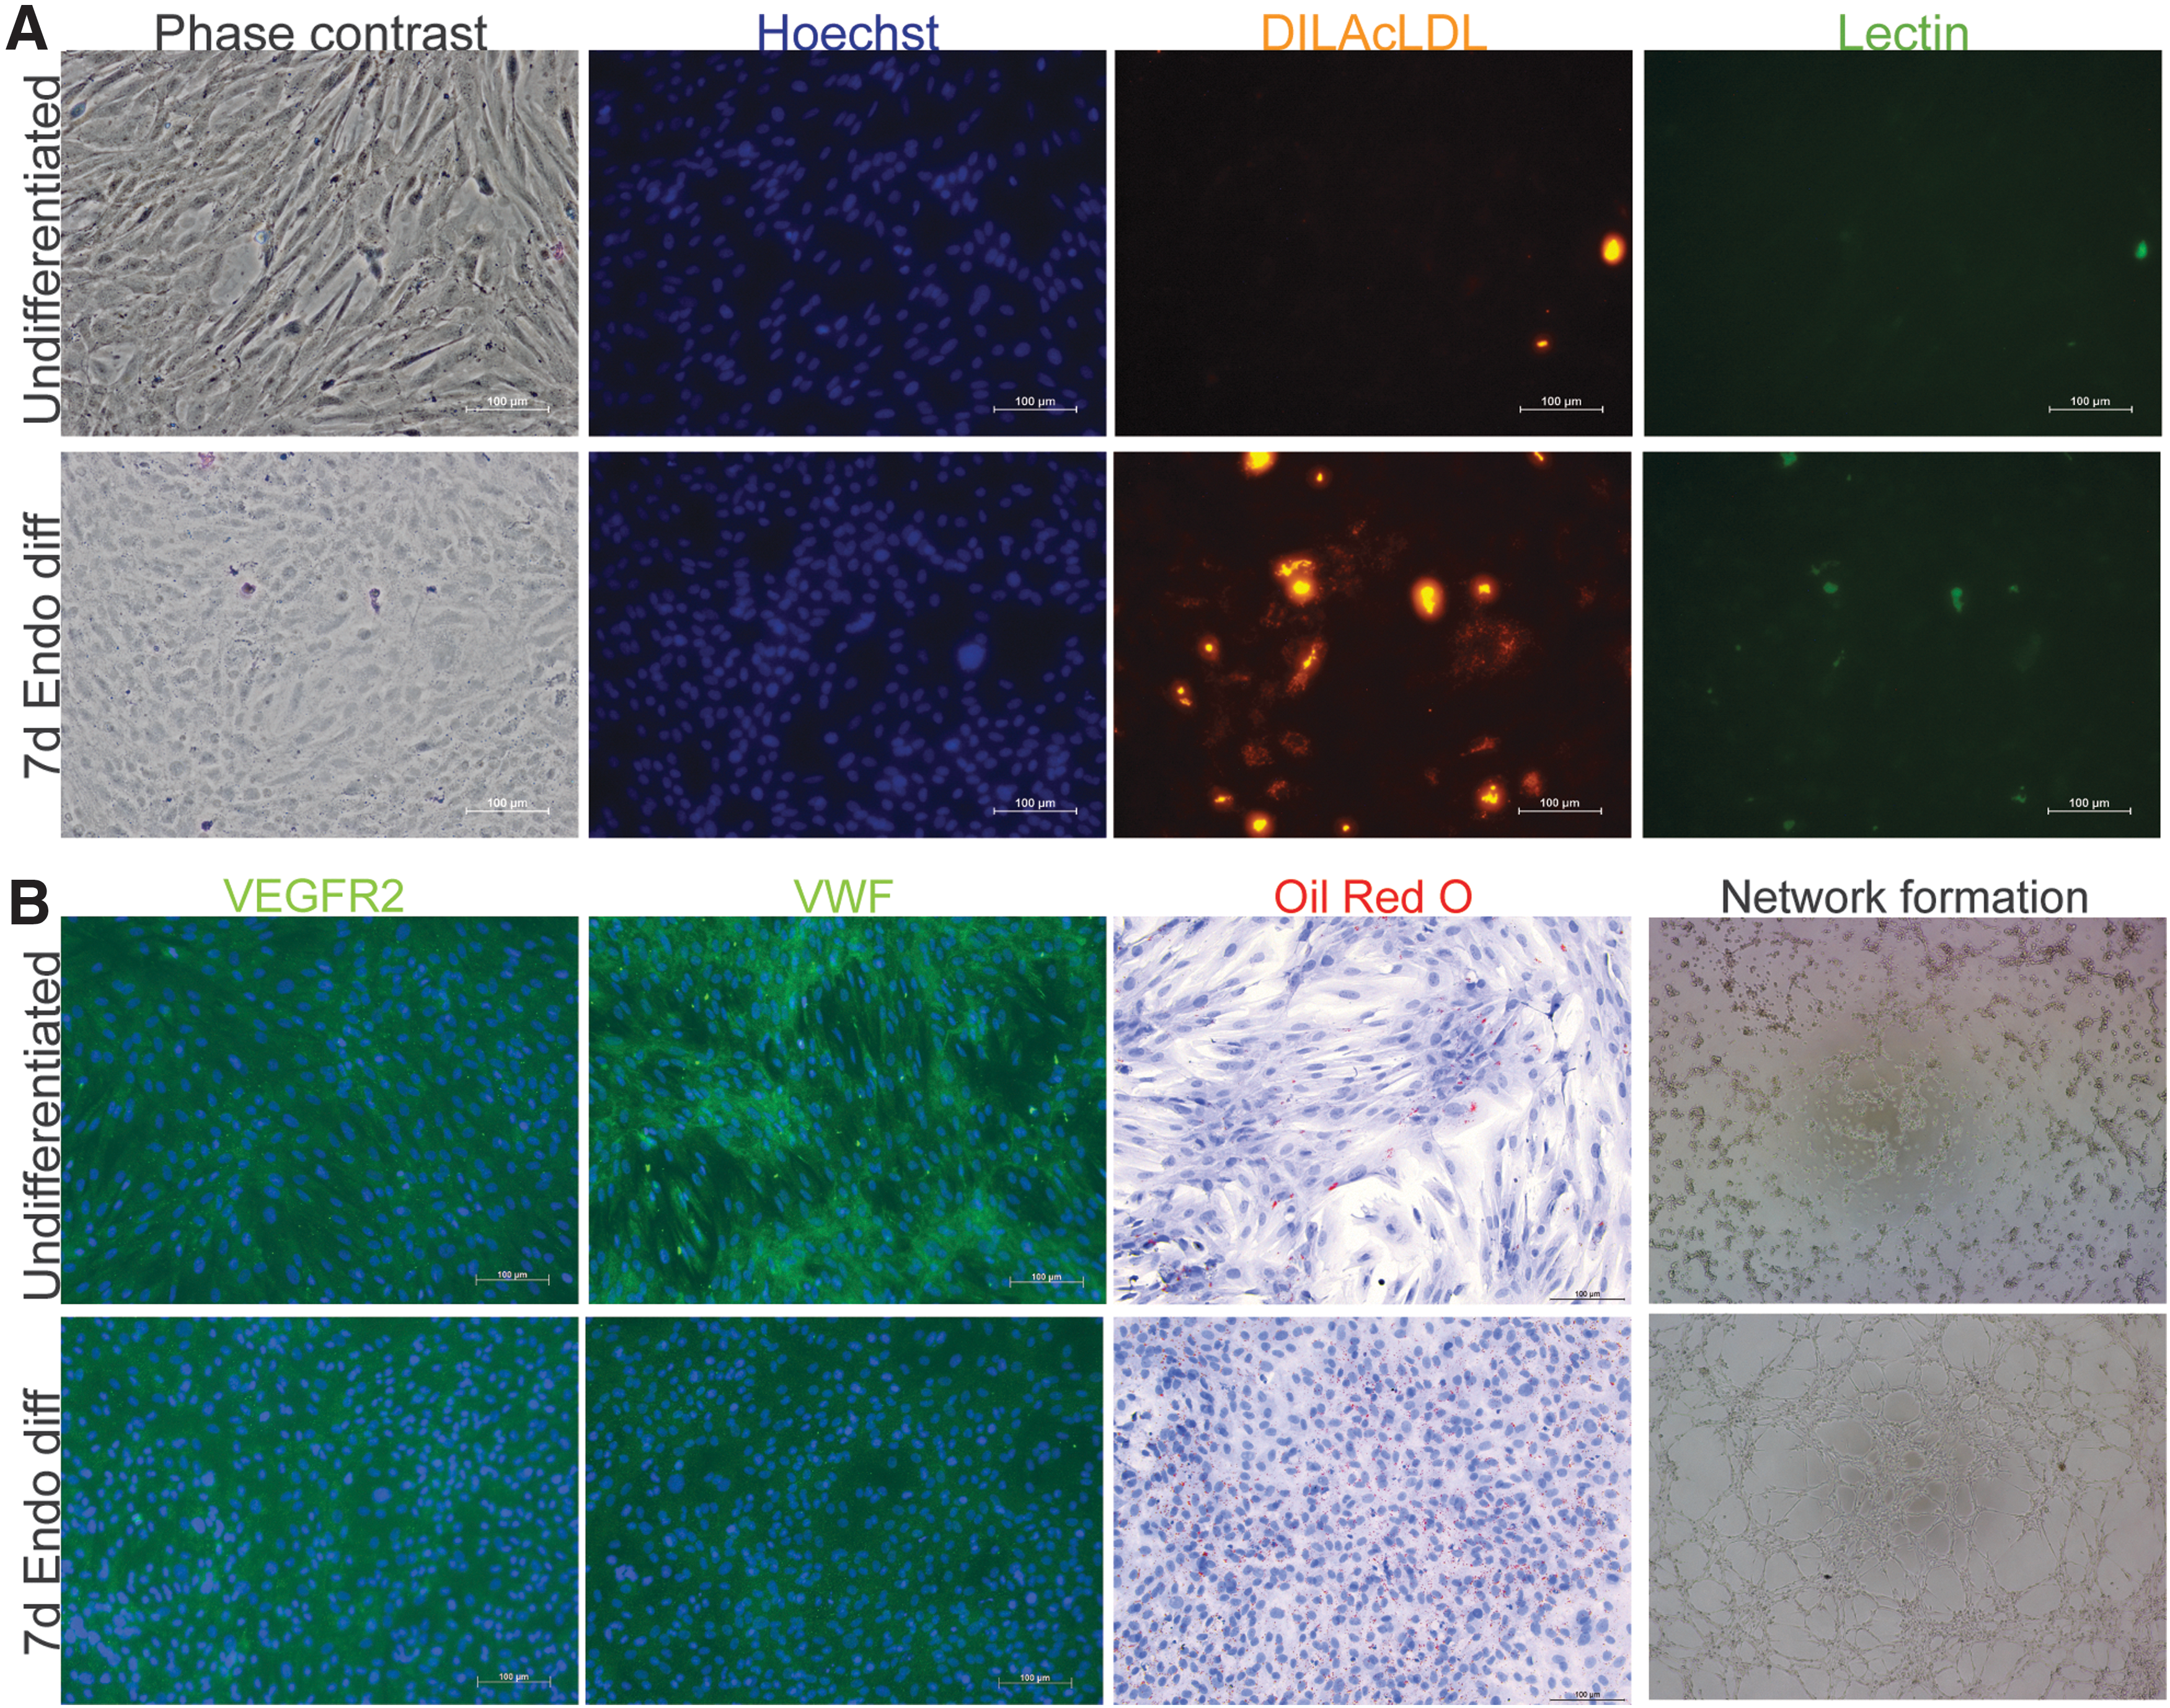
Endothelial characterization of CD146+ L-MSCs after 7 days of induction of differentiation in L-MSC medium or EGM2 endothelial medium.
Hyperoxia exposed CD146+ L-MSCs secrete factors which inhibit endothelial network formation, but not epithelial wound healing
MSCs are known to contribute to growth and repair, yet, the altered gene expression profile suggests that key paracrine pathways involved in orchestrating alveolar and microvascular growth and repair are affected in hyperoxia-exposed CD146+ L-MSCs. To assess the effect of CD146+ L-MSCs on epithelial wound healing, a monolayer of alveolar epithelial cells that had been scratched were cocultured with CD146+ L-MSCs in a cell culture insert. Over the course of 24 h, wound closure was 1.5-fold greater when epithelial cells were cocultured with CD146+ L-MSCs when compared with control wells, where no inserts with CD146+ L-MSCs were added (P = 0.07, Fig. 4A). Wound closure was not affected by in vivo exposure of CD146+ L-MSCs.
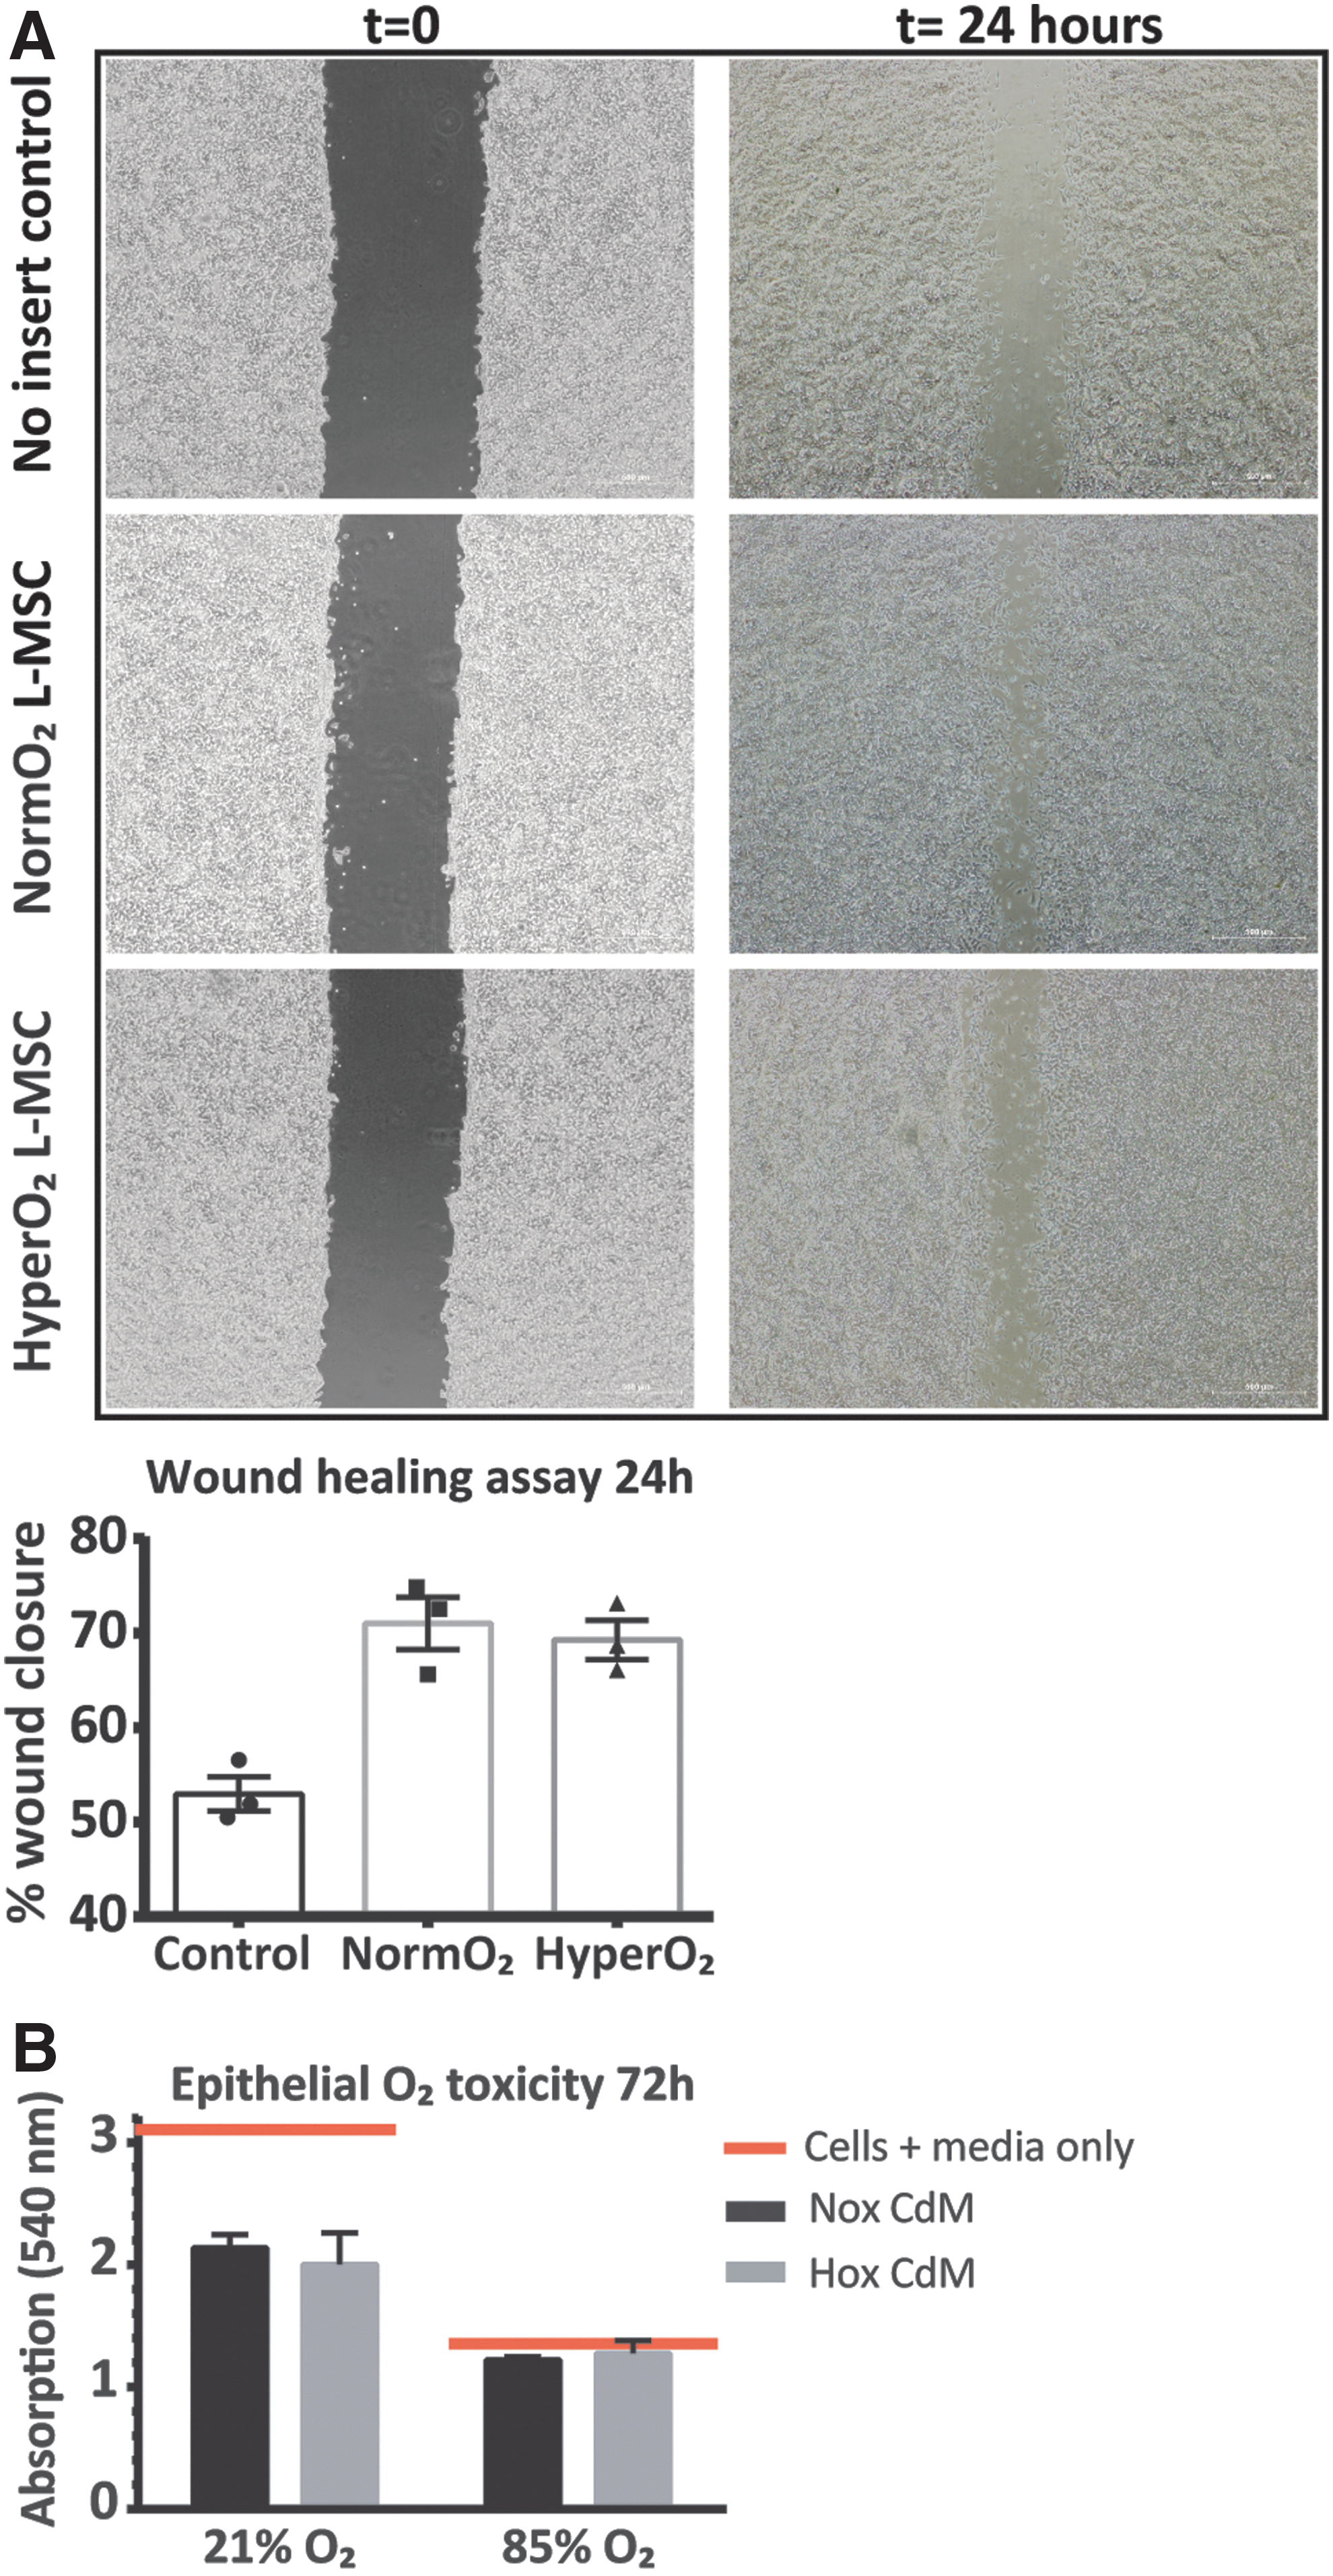
CD146+ L-MSCs promote epithelial wound healing regardless of in vivo oxygen exposure.
To determine whether this increased wound closure was the result of increased epithelial proliferation, alveolar epithelial cells were cultured for 72 h in the presence of CD146+ L-MSC CdM and assessed for proliferation during the last 24-h period by MTT assay (Fig. 4B). Interestingly, in 21% oxygen, CD146+ L-MSC CdM decreased the proliferation of epithelial cells, when compared with control wells where no CdM was added, ruling out proliferation as the means of increased wound closure.
In addition, we assessed whether the presence of CdM from hyperoxia-exposed CD146+ L-MSCs would be protective in hyperoxia, by repeating the 72-h proliferation assay in 85% oxygen. In this setup, alveolar epithelial cells did not proliferate at all, with or without the presence of CD146+ L-MSCs CdM. Again, in vivo hyperoxic exposure of the CD146+ L-MSCs did not affect epithelial proliferation.
To assess the effect of CD146+ L-MSCs on endothelial cell function and angiogenic capacity, we performed a network formation assay using PMVECs that were exposed to CD146+ L-MSC CdM (Fig. 5). After 4 h in physiological conditions (5% oxygen), the complexity of the endothelial networks was markedly lower when CdM from hyperoxia-exposed CD146+ L-MSCs was present. Contrastingly, PMVECs exposed to normoxia CD146+ L-MSC CdM showed similar complexity to wells with no CdM. To assess whether this response would be different in a damaging hyperoxia environment, the experiment was repeated in 60% oxygen. Again, the network complexity, as indicated by the number of intersections, was significantly impaired if PMVECs were exposed to CdM of hyperoxia-exposed CD146+ L-MSCs.

CD146+ Hyperoxia-derived L-MSCs impair endothelial network formation in 21% and 60% O2. Hyperoxia CD146+ L-MSC CdM (Hox CdM) impaired network formation capacity of primary rat PMVECs grown in both physiologic 5% O2 and injurious 60% O2 conditions compared to normoxia CD146+ L-MSC CdM (Nox CdM). Representative photomicrographs are shown of each condition after 8 h of network formation, quantitative analyses of the number of cords and intersections are shown below. *P < 0.05 by Kruskal-Wallis test. BM only, basal media only; PMVEC, pulmonary microvascular endothelial cell.
To further examine the influence of hyperoxia-exposed CD146+ L-MSCs on PMVEC function, we assessed proliferation, migration, and apoptosis/necrosis of PMVECS cultured with CD146+ L-MSC CdM (Fig. 6). CdM from hyperoxia-exposed CD146+ L-MSCs inhibited PMVEC proliferation and caused a two to fourfold increase in early and late apoptosis/necrosis. Addition of FGF2 only counteracted the effect on early apoptosis caused by CdM from hyperoxia-exposed CD146+ L-MSCs. Addition of vascular endothelial growth factor (VEGF) could not significantly counteract any of the adverse effects caused by CdM from hyperoxia-exposed CD146+ L-MSCs. Migration capacity, however, was not affected.
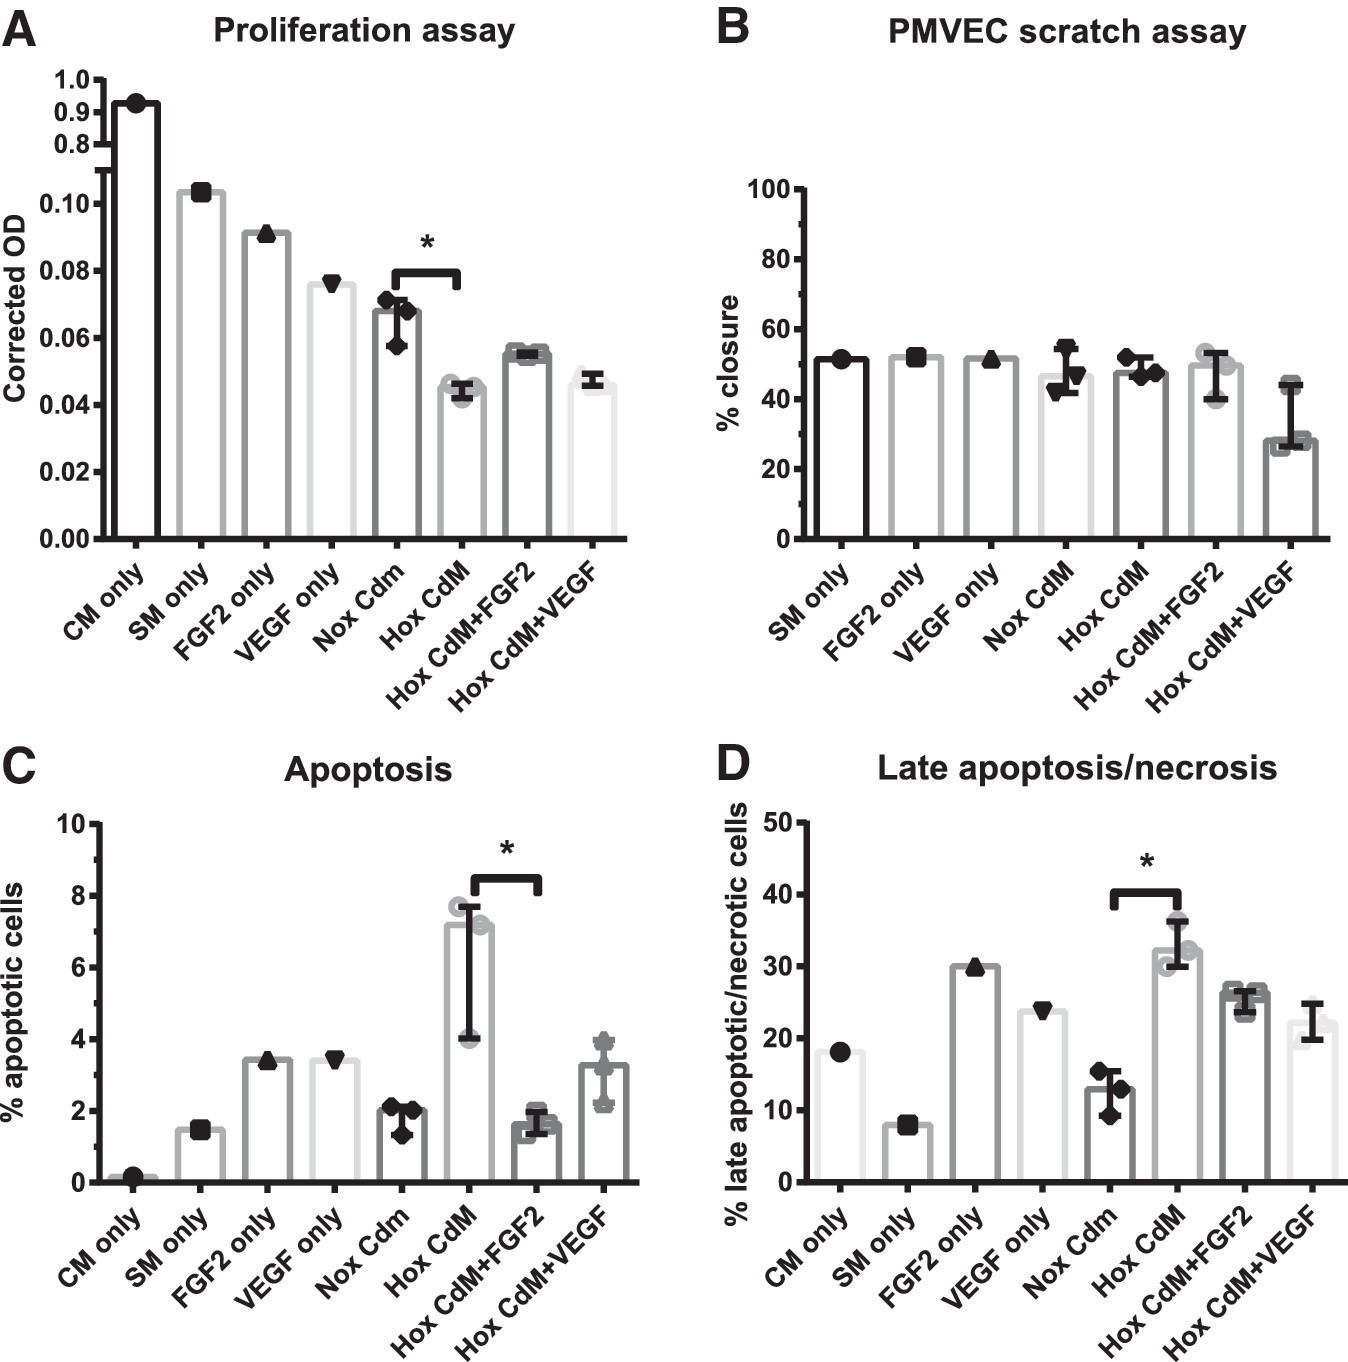
The effect of CD146+ L-MSC CdM on PMVEC proliferation, migration, early and late apoptosis/necrosis.
Immune regulatory capacity of CD146+ L-MSCs
MSCs of different tissue sources have been attributed various immune regulatory properties, which are triggered when MSCs are exposed to an inflammatory environment or licensing agent. A widely recommended licensing agent to elicit these immune regulatory properties is interferon γ (IFNγ) [40]. To assess the direct effect that CD146+ L-MSCs from healthy or hyperoxia-exposed rat pups have on T cell proliferation, an MLR was performed, in which either native or IFNγ-licensed CD146+ L-MSCs were cocultured with T cells isolated from rat spleens (Table 2).
Data are presented as mean ± standard error of mean.
P < 0.05 versus unstimulated control.
P < 0.05 versus stimulated control.
L-MSC, lung mesenchymal stromal cell.
All CD146+ L-MSCs, regardless of in vivo exposure or in vitro licensing, were able to dampen T cell proliferation. In vivo exposure did not significantly alter this particular immunomodulatory capacity in CD146+ L-MSCs, nor was it enhanced by in vitro licensing with IFNγ. Moreover, all T cell subpopulations characterized by CD4+, CD4+CD25high, and CD8highCD4− were affected similarly. Hyperoxia CD146+ L-MSCs were somewhat less able to inhibit proliferation of CD8highCD4− cells, but this did not reach statistical significance (P = 0.08 for both native and IFNγ-licensed CD146+ L-MSCs).
Hyperoxia exposure alters gene expression of pathways supporting alveolar and microvascular development, repair, and immunomodulation
To address the hypothesis that the response of CD146+ L-MSCs to hyperoxia likely represents the cumulative effect of multiple small changes in gene expression, we used GSEA to identify, in an unbiased manner, critical pathways in CD146+ L-MSCs affected by hyperoxia. The dataset comprised a total of 36,665 probes, corresponding to 14,129 genes. For the top 50 most strongly up- and downregulated genes, see Supplementary Figure S1 (Supplementary Data are available online at
Based on a minimal gene set size of 15, GSEA (Molecular Signatures Database (MSigDB) C2.CP V5.2) identified 65 of 978 canonical pathway (CP) gene sets as upregulated by hyperoxia (FDR <25%, Supplementary Table S1). Of these gene sets, axon guidance cue signaling and the related CDC42 regulatory pathway, which regulate migration of various cell types, were most strongly affected, with a NES of around 2 (Fig. 7A and Supplementary Fig. S2). Among the genes that were most strongly affected within those pathways were SEMA3A, SEMA5A, SEMA7A, VAV2, VAV3, NRP1, EFNA1, and EPHA2. Many other upregulated gene sets are involved in cell cycle.
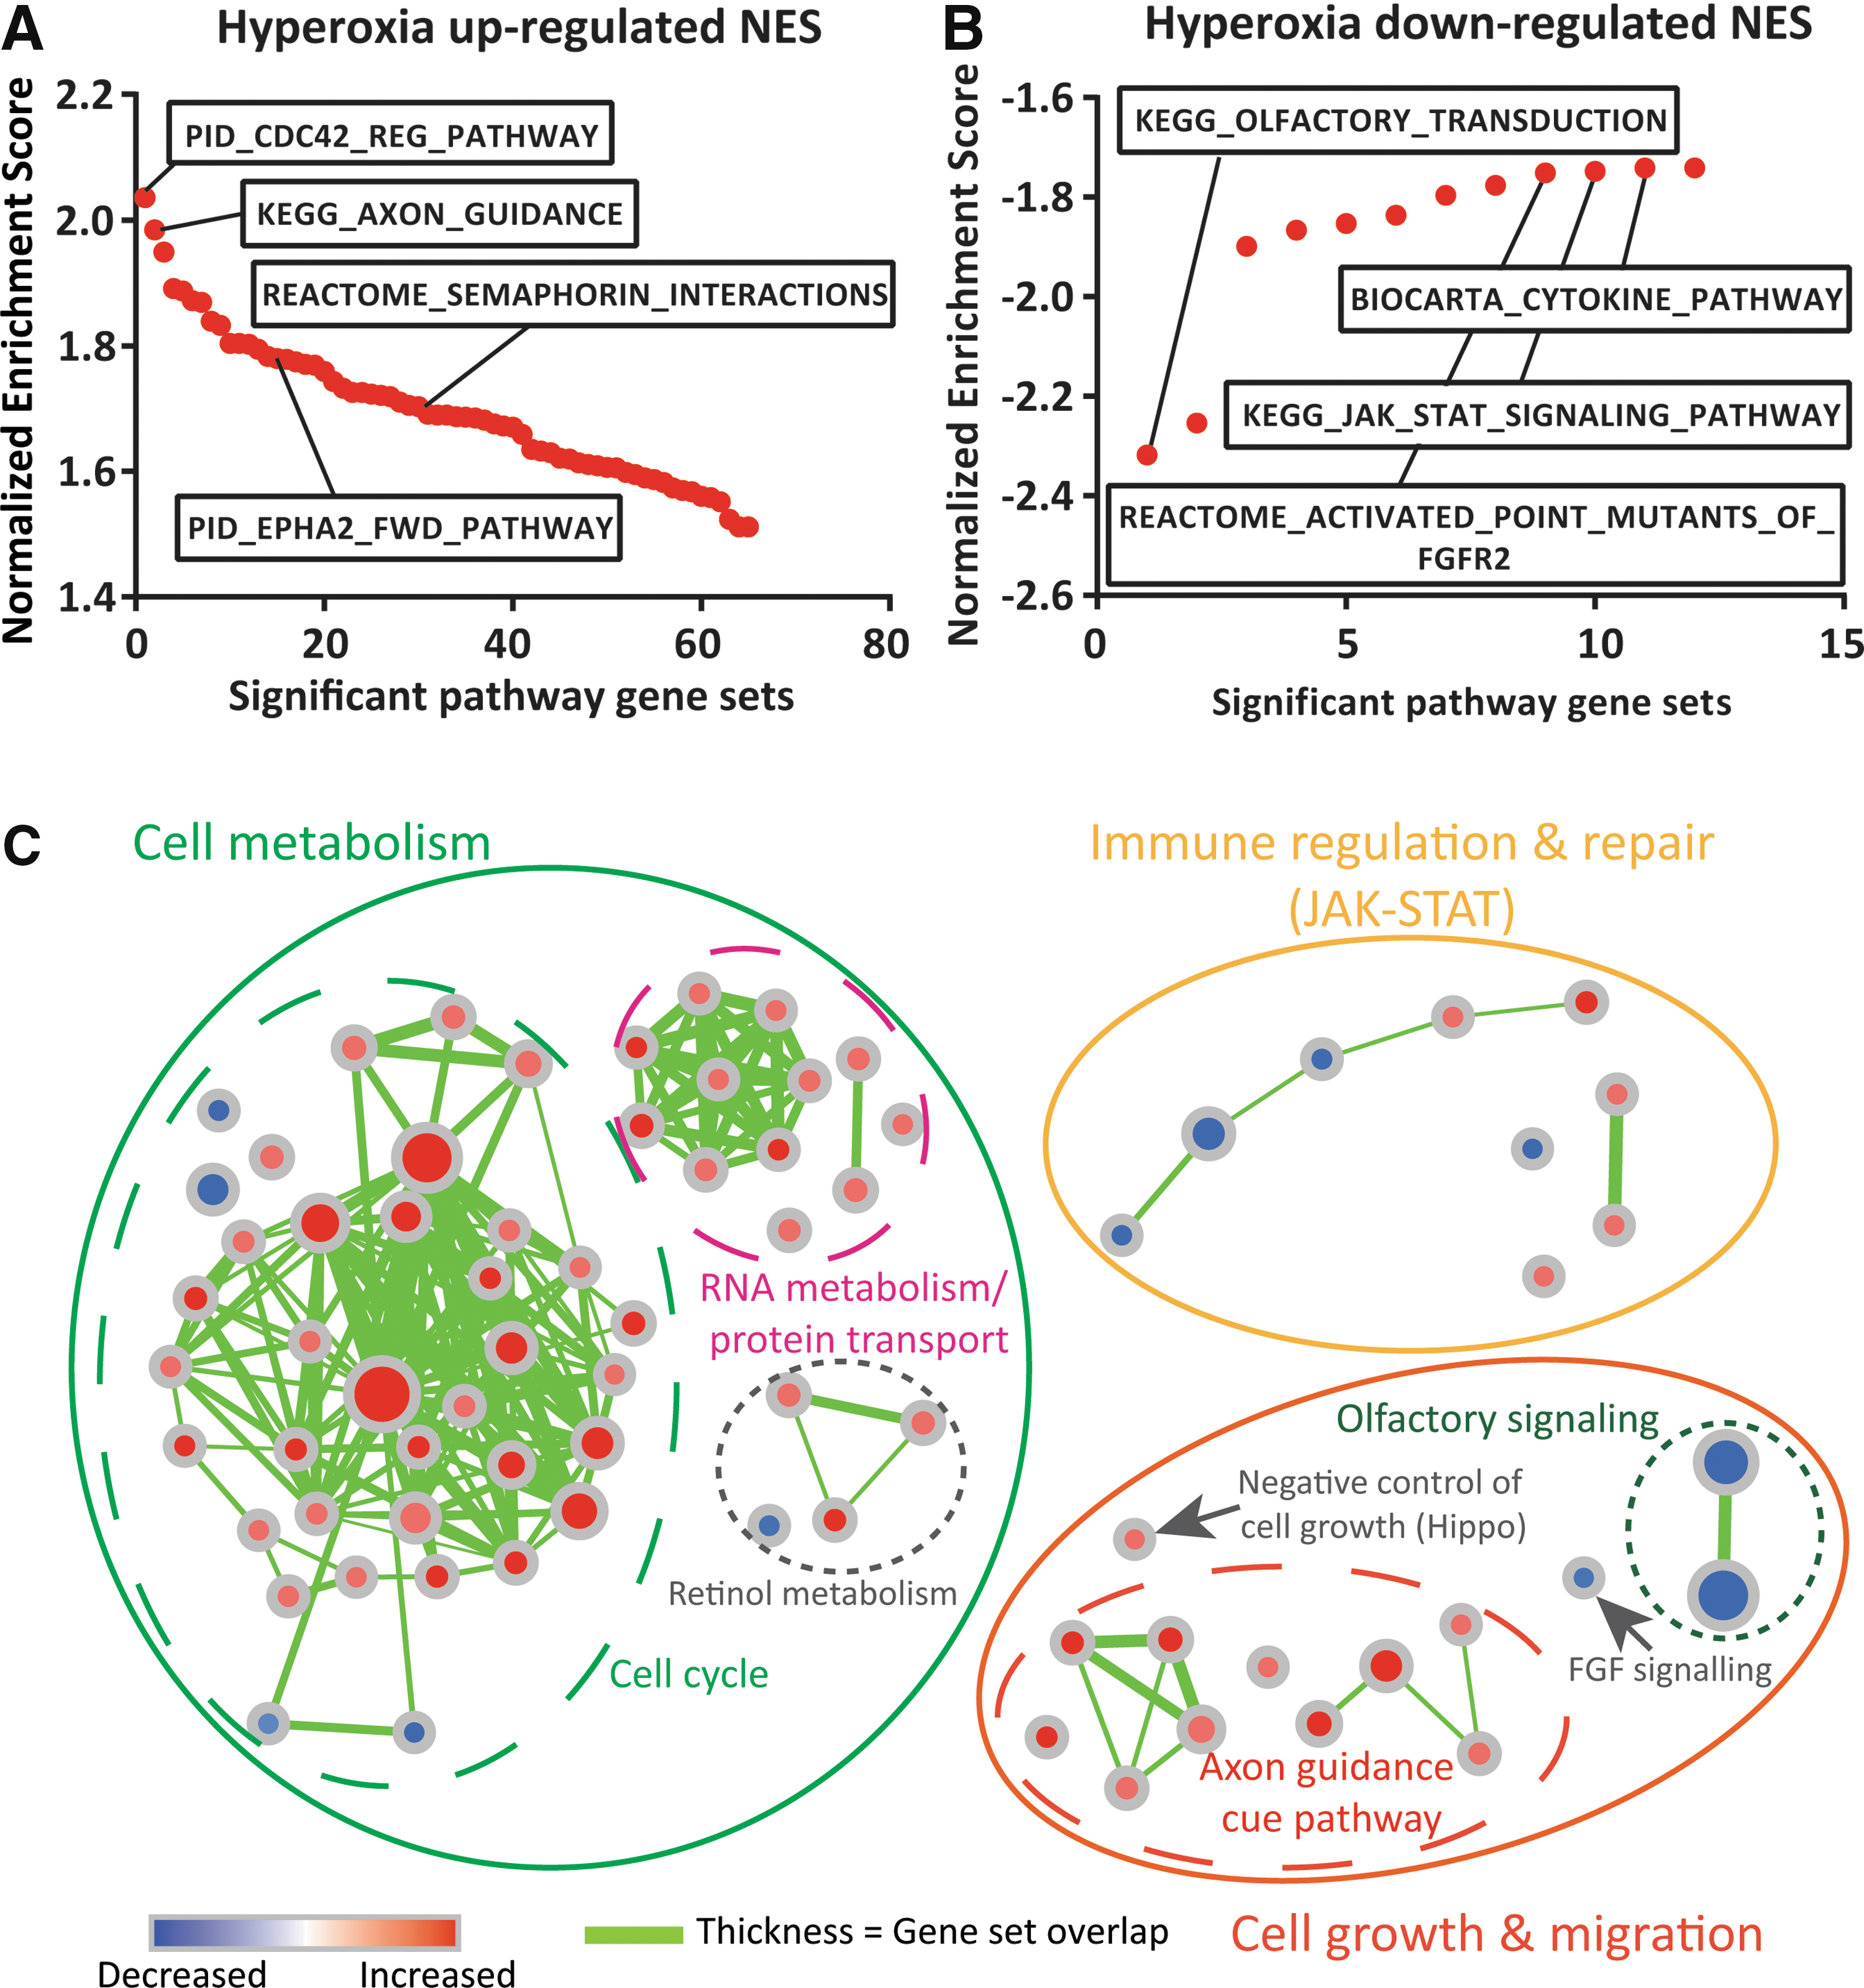
Gene set enrichment analysis of CD146+ L-MSCs exposed in vivo to normoxia versus hyperoxia.
At the other end of the spectrum, 12 gene sets were downregulated in hyperoxia which with an FDR <25% (Supplementary Table S2). Downregulated pathways that had the lowest NES included FGF, JAK/STAT, inflammatory and cytokine signaling pathways and, surprisingly, olfactory receptor genes (Fig. 7B and Supplementary Fig. S3). Among the genes, most strongly affected within those pathways were FGF1, FGF2,FGF9, FGF10, SOCS2, SOCS3, SPRY1, IL1A, IL2, IL3, IL4, IL6, IL7, IL11, and IL15.
A functional clustering of these pathways is represented in Figure 7C. Strikingly, a majority of gene sets that are upregulated in hyperoxia CD146+ L-MSCs are involved in cell cycle processes, with an increase in DNA replication and decrease in DNA packaging gene sets. Hyperoxia exposure also increased expression of cellular machinery-related gene sets involved in mRNA and protein translation, cell metabolism, and cell death signaling. Validation by real-time PCR indeed confirmed a greater than threefold increase in SEMA3A and twofold decrease of FGF10, but not for FGF1 and FGF2 (Fig. 8A).
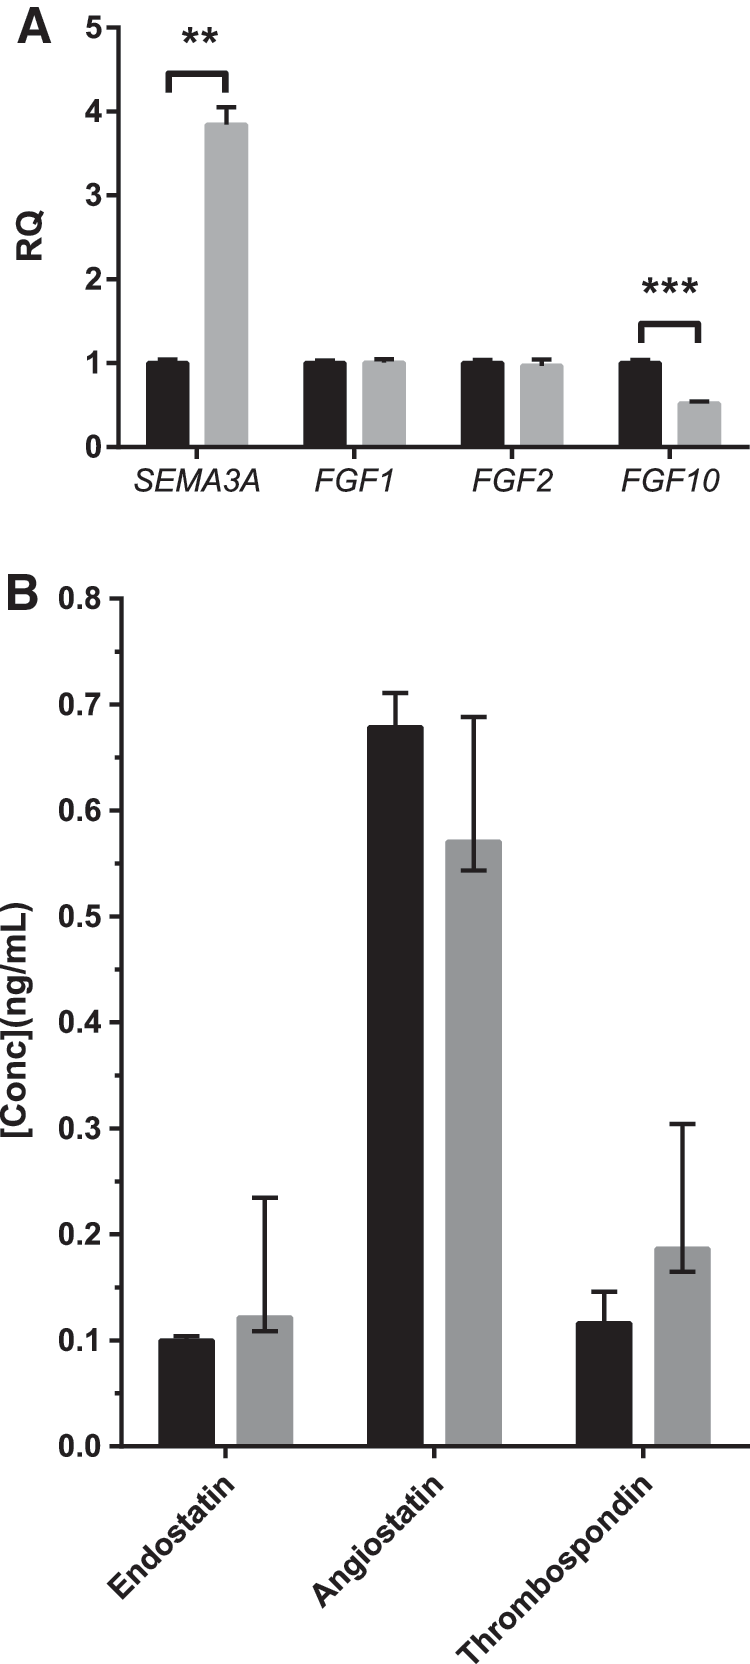
Validation of (anti-)angiogenic gene expression and protein secretion by CD146+ L-MSCs.
In addition, manually curated datasets that identify as chemical and genetic perturbations (MSigDB
A total of 233 out of 2578 gene sets were downregulated in hyperoxic CD146+ L-MSCs (FDR <25%, Supplementary Table S4). Downregulated gene sets included targets of NF-κB (de Bosscher gene set [45]), targets of VEGF-A (Weston gene set [46]), genes involved in adipogenesis (Burton gene set [47]), and genes that are highly expressed in adipose MSCs (Boquest gene set [48]). Moreover, genes that are associated with combined lipopolysaccharide (LPS) and mechanical ventilation exposure (Altemeier gene set [49]) were downregulated in hyperoxia CD146+ L-MSCs. Downregulated genes include STC2, NT5E, PDGFRA, IGF1, IGFBP3, FIGF, ANGPT1, VCAM1, DCN, FGF7, FGF10, TGM2, and POSTN.
Since MSCs have been attributed with immune regulatory functions, the gene expression data were also analyzed for immunologic signatures (MSigDB C7 V5.2). Out of 4872 gene sets, 22 were significantly upregulated in hyperoxia CD146+ L-MSCs (Supplementary Table S5). These gene sets were associated with T cells, CD8+ dendritic cells, and macrophages.
One hundred thirty three gene sets were significantly downregulated (Supplementary Table S6). Here also, gene sets with (regulatory) T cells, dendritic cells, and macrophages show up, but especially those that are downregulated as a result of LPS stimulation. The majority of those downregulated genes are also those represented in the JAK/STAT pathway in the CP gene sets, such as IL6, IL1A, and CD274. Several genes that were strongly represented in the C7 gene sets were also represented in the CGP, but not CP, gene sets, such as ATF3, NR4A1, NR4A2, NR4A3, and CD53. NT5E, the gene coding for MSC cell surface marker CD73, is also identified in multiple CGP and C7 downregulated gene sets.
Discussion
In this study, we show how gene expression and function of resident CD146+ L-MSCs are affected by prolonged hyperoxia exposure of the neonatal lung as a model for BPD (see summary Fig. 9).
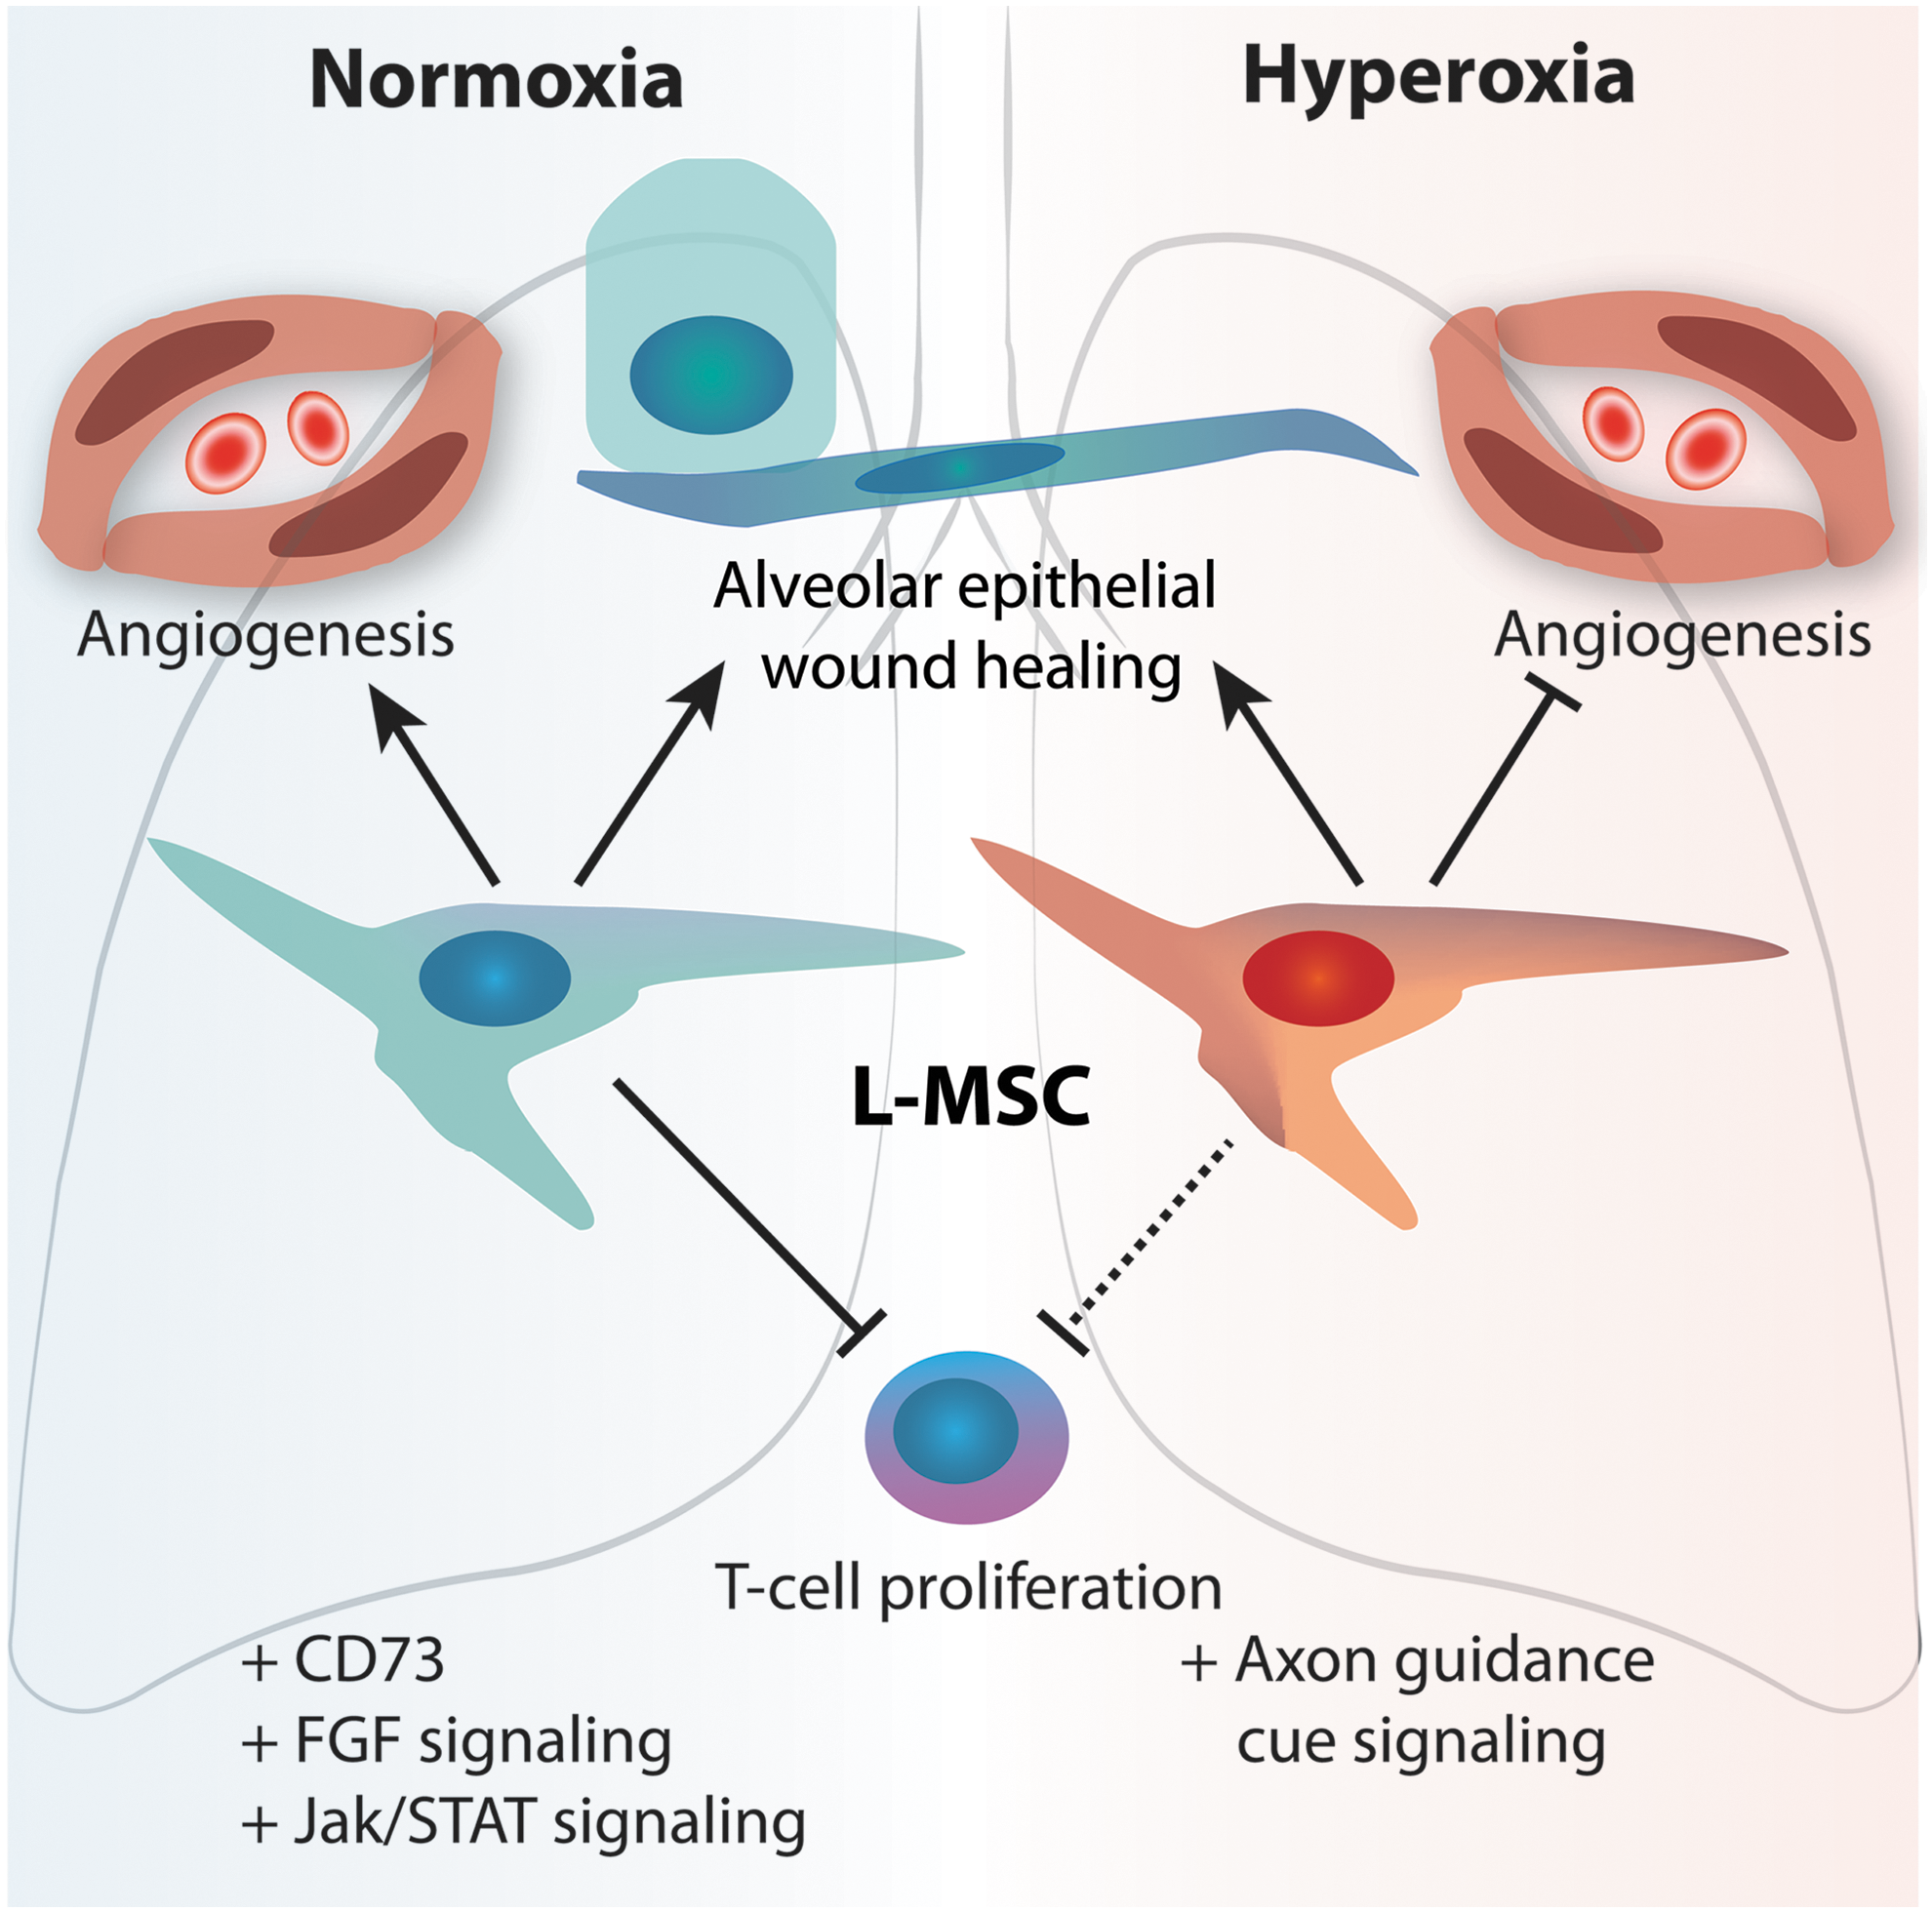
Model summarizing the phenotype and microenvironment interactions of L-MSCs in normoxia and hyperoxia-exposed neonatal rat lungs. Normoxia L-MSCs display a growth-promoting and anti-inflammatory phenotype, while hyperoxia L-MSCs display impaired angiogenic supportive capacity and an altered gene expression profile.
Using in vitro cell culture assays, we were able to demonstrate that CD146+ L-MSCs derived from rat pups with experimental BPD inhibit the network formation capacity of PMVECs, as a model for angiogenesis. Phenotypically, there was a twofold decrease in CD146+ L-MSCs expressing CD73 after in vivo hyperoxia exposure. CD146+ L-MSCs from either experimental group were similarly able to promote epithelial wound closure and inhibit T cell proliferation in vitro. Gene expression profiling confirmed the decrease in angiogenesis-related gene expression, the decrease in expression of immune function-associated genes, including NT5E, the gene for MSC surface marker CD73, and hinted at further altered developmental support and repair capacity with respect to axon guidance, cytokine, JAK/STAT, and FGF signaling.
Regardless of in vivo exposure, CD146+ L-MSCs displayed an exceptional capacity for clonality upon single-cell plating, ranging from 60% to 85% efficiency, which is an order of magnitude greater than is reported for other tissue resident MSCs [13,50]. This high clonality and modest capacity to inhibit T cell proliferation and to differentiate along the classical three lineages was recently also reported for human fetal L-MSCs [51].
The impact that hyperoxia CD146+ L-MSC CdM had on PMVEC network formation was particularly striking. Considering that CdM from control normoxia CD146+ L-MSCs did not enhance network formation of PMVECs, it would suggest that hyperoxia CD146+ L-MSCs secrete compounds that actively inhibit angiogenesis. This antiangiogenic effect was further supported by a decrease in proliferation capacity and increased apoptosis/necrosis in hyperoxia CD146+ L-MSC CdM-exposed PMVECs.
This antiangiogenic phenotype is reminiscent of a recent study, in which adult human pulmonary mesenchymal progenitor cells from patients with pulmonary hypertension exhibited a phenotype that promotes microvascular dysfunction, associated with increased Wnt/β-catenin signaling and increased numbers of NG2-positive pericyte progenitors [52,53]. Based on our microarray gene expression analysis, we also see increased CSPG4 (NG2) expression in hyperoxia CD146+ L-MSCs (ranked 198th in the gene expression list), consistent with the observations by Gaskill et al.
However, we found a different signaling pathway that was significantly upregulated in hyperoxia L-MSCs that could have an inhibiting effect on angiogenesis, namely axon guidance cue signaling. In the developing lung, axon guidance cue signaling directs branching morphogenesis and epithelial cell outgrowth, during which different pathway members can either promote or inhibit these processes [22,54,55]. Semaphorin 3A and its receptor neuropilin 1 specifically inhibit branching morphogenesis, although no specific reports are available for their effect on pulmonary angiogenesis.
In the cancer literature, however, class 3 semaphorins (including semaphorin 3A, B, E, and F) are known as potent endogenous angiogenesis inhibitors [56 –59]. Semaphorin 3A can inhibit binding of VEGF, and promote apoptosis of endothelial cells [59]. SEMA3A and SEMA3E are among the most significantly upregulated genes of the axon guidance cue signaling pathway, while SEMA3A is also one of the 50 most upregulated genes in hyperoxia CD146+ L-MSCs overall. Semaphorin 3A and 3E are therefore likely candidates for the inhibitory effect of the hyperoxia CD146+ L-MSC CdM on PMVEC network formation.
Concomitantly, hyperoxia CD146+ L-MSCs had decreased gene expression of prominent proangiogenic genes, such as FGF9 [60] and IL6 [61]. The effect of these altered pathways combined with the in vitro effects of hyperoxia CD146+ L-MSC CdM on endothelial network formation, strongly supports the phenotype of aberrant microvascular development that characterizes BPD pathogenesis [62]. We also measured three well-known antiangiogenic proteins in concentrated CD146+ L-MSC CdM, thrombospondin-1, endostatin, and angiostatin. There was a trend toward increased levels of thrombospondin-1 and endostatin, but differences were not statistically significant (Fig. 8B).
Among the most strongly downregulated gene sets were olfactory receptors, which were only recently found to be expressed in the lung [63] and appear to act as chemosensors to regulate migration, regeneration, angiogenesis, and vasocontractility [64]. In this regard, the shift in gene expression is likely complementary to the increase in those genes of the axon guidance cue signaling pathway that would have an inhibitory effect on lung development and branching [54] and promote pulmonary inflammation [65]. This would be supported by the observed decrease in FGF9 and FGF10 expression, which normally function as a mesenchymal stimulus for lung outgrowth and distal lung capillary development [60,66].
Overall, hyperoxia CD146+ L-MSCs displayed a decrease in the expression of genes that have been recognized as key for fibroblasts directing alveolar development, such as PDGRA and FGF10 [67 –69]. During the process of secondary septation, an increase in PDGFRα expression followed by acquisition of αSMA expression mediated by FGF signaling, including FGF10, is necessary for the differentiation of developmental myofibroblasts that direct the outgrowth of secondary septa [70].
The FGFR pathway is extremely important for alveologenesis, particularly FGF10, as has been extensively demonstrated by the work of many investigators. More recently, Bellusci's group demonstrated that L-MSCs specifically are a subpopulation of FGF10-expressing cells in the postnatal developing lung, and that FGF10-expressing cells play an important role in alveologenesis [71,72]. FGF10+/− mice also developed more severe hypoplasia in the hyperoxia-induced model of experimental BPD, leading to increased mortality by day 8 [73]. Moreover, these mice displayed a reduced number of functional (surfactant producing) AEC2.
We think that our findings presented in this study are complementary in this regard. Moreover, both decreased FGF10 and PDGFRA expression have been implicated in the pathogenesis of BPD [72,74 –77]. It is therefore tempting to speculate that these changes in paracrine signals and receptor expression would not only alter the CD146+ L-MSC's capacity to repair injury in the developing lung but also inhibit saccular and alveolar development and thus contribute to BPD pathogenesis.
Another notable impact of in vivo hyperoxia exposure was the decrease in CD73 expression, both on gene and protein expression level. (L-)MSCs have the capacity to clean up adenosine triphosphate, a proinflammatory stimulus that is released by injured cells, by converting it into the anti-inflammatory adenosine through their expression of CD73 [78]. An additional side effect of MSC-induced adenosine production is that it suppresses activity and even induces apoptosis in T cells [78]. Although in our study CD146+ L-MSCs could indeed dampen T cell proliferation, there were no significant changes in T cell proliferation or viability between normoxia and hyperoxia CD146+ L-MSC coculture. In addition to affecting T cell activity, CD73-mediated adenosine production also induces VEGF expression and angiogenesis [78].
Furthermore CD146+ L-MSCs were not capable of fully differentiating into endothelial cells, they could assume endothelial cell functions when exposed to endothelial growth medium, such as highly efficient LDL uptake and the formation of networks in Matrigel, suggesting a supportive capacity for angiogenesis, which is unchanged in hyperoxia CD146+ L-MSCs. MSCs are recognized for their ability to mediate wound healing, especially through their ability to recruit and direct other cells in their microenvironment toward an anti-inflammatory and pro wound healing state [79]. In the lung, wound healing processes involve the recruitment of many other cell types, including macrophages, pericytes, fibroblasts, and endothelial cells.
Other genes in multiple significant gene sets reflect how the repair capacity of CD146+ L-MSCs may be affected by prolonged hyperoxia exposure. For example, there is a decrease in JAK/STAT signaling genes that are involved in fetal lung morphogenesis [80], regeneration [81,82], pericyte migration [83], and M2 macrophage activation for wound healing [84], and currently under investigation. While these genes may be involved in JAK/STAT signaling, they are, however, first and foremost genes involved in the innate immune response.
In summary, we show in this study that resident CD146+ L-MSCs, isolated from hyperoxic alveolar growth-restricted rat lungs mimicking BPD, no longer support angiogenesis and display a gene expression profile that would inhibit lung growth and immunomodulatory properties. Understanding how normal L-MSCs function and how these cells are perturbed in BPD may prove useful in designing superior MSC products with enhanced repair capabilities.
Footnotes
Acknowledgments
The authors thank Kathy Sheikheleslamy of the StemCore Affymetrix Microarray Facility, Paul Oleynik of the StemCore Flow Cytometry Facility, and Dr. Vera Wang of the University of Ottawa Flow Cytometry Core Facility for their technical assistance and Dr. Yevgeniya Le and Dr. David Allan for providing the PPARG primers.
For the research reported in this article, JJPC was supported by a Canadian Institutes of Health Research (CIHR) postdoctoral fellowship. BT is supported by the CIHR, Canadian Thoracic Society, Stem Cell Network, and the Children's Hospital of Eastern Ontario foundation.
Author Disclosure Statement
No competing financial interests exist.
References
Supplementary Material
Please find the following supplemental material available below.
For Open Access articles published under a Creative Commons License, all supplemental material carries the same license as the article it is associated with.
For non-Open Access articles published, all supplemental material carries a non-exclusive license, and permission requests for re-use of supplemental material or any part of supplemental material shall be sent directly to the copyright owner as specified in the copyright notice associated with the article.