
Abstract
Tumor necrosis factor alpha (TNF-α) induced protein 6 is a major anti-inflammatory mediator released by activated mesenchymal stromal cells (MSCs). Neonatal MSCs are considered more metabolically active than cells derived from adult tissues, and potentially less heterogeneous. We hypothesized that a TNF-α-activated neonatal MSC population [human umbilical cord perivascular cells (HUCPVCs)] would show an enhanced level of TSG-6 activation compared with adult bone marrow MSCs (BMMSCs). Thus, we stimulated HUCPVCs, and both human BMMSCs (hBMMSCs) and mouse BMMSCs (mBMMSCs) with 1, 10, 50, and 100 ng/mL of recombinant TNF-α over various exposure times. Supernatant, and total RNA, of the cells were collected for measurement of both TSG-6 RNA expression, and secreted TSG-6 protein. To compare gene levels, quantification was done by normalizing the expression levels of TSG-6 to the geometric mean of the three most stable reference genes, out of a cohort of 30 tested genes, using the Pfaffl method. We found that HUCPVCs exhibited both an enhanced and more rapid response to low dose (1 ng/mL) TNF-α exposure resulting in ∼11.5-fold increase in TSG-6 expression within the first 30 min. In contrast, hBMMSCs showed 2-fold increase by 1 h that increased to 9.5-fold with a higher (50 ng/mL) TNF-α exposure for the same time. mBMMSCs showed a two-fold increase after 24 h that was independent of TNF-α concentration. Thus, although TSG-6 expression level varied among donors, both hMSC populations exhibited enhanced TSG-6 upregulation, upon TNF-α stimulation, compared with mBMMSCs. In conclusion, HUCPVCs showed higher sensitivity, and a prompter response to TNF-α stimulation compared with hBMMSCs. Thus, neonatal MSCs may be a stronger candidate population than those derived from adult bone marrow to treat inflammatory diseases.
Introduction
M
Of the neonatal tissues, UC connective tissue—“Wharton's Jelly” (WJ) is the most frequently employed source of MSCs and is the focus of 108 clinical trials registered at
Indeed, MSCs from both placenta [14] and UC [15] exhibit increased proliferative activity and colony-forming unit fibroblasts (CFU-F) frequency [16] when compared with MSCs derived from adult tissue sources. Specifically, Sarugaser et al. [16] reported a (CFU-F) frequency of 1:300 in human umbilical cord perivascular cells (HUCPVCs), whereas that in the whole UC tissue is 1:1,609 [17], both of which are significantly higher than that of adult BMMSCs (1:1 × 10⁵) [18]. This may suggest a greater homogeneity of the HUCPVC population compared with the BMMSCs [19,20]. Neonatal MSCs have also shown low immunogenicity [11], increased immunosuppression [11,13], and cause an increase in alternatively activated M2-type macrophages [21] compared with BMMSCs, although this may not be reflected in standard mixed lymphocyte reactions where both a similar [22] and improved [12] functional phenotype has been reported. Holley et al., using quantitative proteomics, reported small numbers of proteins that were either BMMSC or HUCPVC specific, although the functional relevance of these differences was not explored [23].
Thus, of the major paracrine signaling functions of MSCs, their anti-inflammatory properties have attracted considerable attention [24]. Placental and UCMSCs have been shown to have profound anti-inflammatory effects in both cutaneous wound healing [25,26] and acute liver failure [27], respectively. In particular, Liu et al. showed that UCMSCs reduced the activation of proinflammatory signaling [26], and Raicevic et al. concluded that WJ-MSCs were more effective than either adipose tissue or BMMSCs, when an immunosuppressive action is required in the presence of an inflammatory stimulant [28].
Tumor necrosis factor (TNF)-stimulated gene 6 (TSG-6) protein is a key anti-inflammatory mediator whose gene, TNFAIP6, is highly expressed in inflammation. It has been identified as one of the most upregulated genes in hBMMSCs and plays a critical role in the immunomodulation and downregulation of inflammation [29]. Knockdown, or silencing, of TSG-6 has been shown to result in the loss of therapeutic activity of both BMMSCs [29] and UCMSCs [26]. TSG-6 is shown to interact with macrophages through the CD44 receptor to decrease translocation of nuclear factor kappa-light-chain-enhancer of activated B cells (NF-κB) [30]. Increased activation of NF-κB in hBMMSCs has been correlated with increased expression of TSG-6, whereas inhibition of NF-κB signaling has been shown to result in decreased expression of TSG-6 and, interestingly, an increase in the osteogenic differentiation of hBMMSCs [31]. TSG-6 has been also shown by Tsukahara et al., to downregulate osteoblastic differentiation induced by bone morphogenetic protein (BMP)-2 [32] by direct binding to receptor activator of nuclear factor kappa-B ligand (RANKL) and BMPs (except BMP-3) through Link (a hyaluronan-binding domain) and CUB domain [33]. Hence, TSG-6 secretion by MSCs has potent autocrine effects [30,32,33].
Furthermore, TSG-6 protein is also shown to abrogate neutrophil migration and infiltration [34] through interference with chemokine/glycosaminoglycans and chemokine (C-X-C motif)/ligand 8 (CXCL8) interactions [35]. In addition, a number of studies have shown TSG-6 to be important in inhibition of inflammation and joint destruction in autoimmune disease [36], acceleration of wound closure, and reduction of fibrosis through altering transforming growth factor (TGF)-β1 and TGF-β3 synthesis from a scar promoting (high) to an antifibrogenic (low) ratio [37], and inhibition of metalloproteinase-mediated degradation of the cartilage matrix [38]. Hence, TSG-6 expression has been suggested as a biomarker of potency of MSCs [31].
Therefore, while MSCs have an anti-inflammatory phenotype, and TSG-6 has been shown to be an important mediator of this putative therapeutic outcome, little is known of the comparative sensitivity of MSC populations to a temporal exposure to a specific inflammatory stimulant. To address this issue, and using TSG-6 expression as a surrogate for an anti-inflammatory phenotype, we compared HUCPVCs with adult BMMSCs by addressing the following questions: (1) What is the TSG-6 gene expression response to different doses of TNF-α stimulation? and (2) Is there an optimum priming condition for HUCPVCs to achieve the maximum upregulation of TSG-6 compared with hBMMSCs? Also, in preparation for an in vivo xenotransplantation study in a mouse model of inflammation, we included cohorts of mBMMSCs to compare with both human cell types. We hypothesized that TNF-α-activated neonatal HUCPVCs would express an enhanced level of TSG-6 activation compared with adult BMMSCs.
Materials and Methods
HUCPVC culture and source
HUCPVCs were isolated from the perivascular region of human UC, using a proprietary serum and xeno-free process, provided by Tissue Regeneration Therapeutics, Inc. (Toronto, Canada). Passage 1 cells were seeded at 1,333 cells/cm2, incubated at 37°C in a 5% CO2 atmosphere in a humidified incubator, and expanded in Lonza TheraPEAK™ MSCGM-CD™ (Cat. No. 00192125; Lonza) medium, which was changed every 3 days. The cells were enzymatically dissociated from the culture dish at ∼70% confluency using TrypLE Select CTS (Cat. No. A12859-01; Invitrogen). HUCPVCs derived from five donors were either individually expanded to passage 3 and/or grown to passage 3 as a pooled population.
hBMMSCs culture and source
hBMMSCs, isolated from human BM aspirates, were obtained as frozen vials at passage 1 from the Center for the Preparation and Distribution of Adult Stem Cells [39]. Two frozen vials with ∼1 million cells in each from different donors were thawed at 37°C in a water bath followed by resuspension in complete culture medium, the MSCGM Bullet Kit (Cat. No. PT-3238 and PT-4105; Lonza). Cells were pooled and seeded at 1,333 cells/cm2, and incubated at 37°C in a 5% CO2 atmosphere in a humidified incubator. The medium was changed every 3 days followed by enzymatic dissociation of cell from the culture dish at 70% confluency using TrypLE Select CTS (Cat. No. A12859-01; Invitrogen). Cells were then reseeded for growth up to passage 3.
mBMMSCs culture and source
mBMMSCs, isolated from mouse BM aspirates, obtained as frozen vials at passage 1, were kindly donated by Professor Donald Phinney at Scripps Research Institute. Frozen vials were thawed at 37°C in water bath followed by resuspension in complete culture medium consisting of minimum Essential Medium-alpha (α-MEM) (Cat. No. 32561-037; Gibco), 10% fetal bovine serum (FBS) (Cat. No. S12450, Lot. No. M13174; Atlanta Biologicals, Optima), and 1% penicillin/streptomycin (Cat. No. 15140122; Gibco). mBMMSCs were seeded at 5,000 cells/cm2, incubated at 37°C, under hypoxic conditions (5% O2, 5% CO2 atmosphere) in a humidified incubator. The medium was changed every 4 days followed by enzymatic dissociation of cells from the culture dish at 70% confluency using 0.25% trypsin-ethylenediaminetetraacetic acid (EDTA) (1 × , Cat. No. T3924; Sigma). Cells were then reseeded for growth up to passage 3.
Cell growth rate measurements
HUCPVCs, hBMMSCs, and mBMMSCs at passage 2 were cultured as described above. The medium was changed every 3 days. Cells in culture were washed with 1 × phosphate-buffered saline (PBS), and enzymatically detached from the dish using TrypLE Select Enzyme (A1217701; Thermo Fisher Scientific), followed by centrifugation. Viable cells were then counted using a hemocytometer. The exclusion cell viability test used a 1:1 ratio of Trypan Blue 0.4% (Cat. No. 15250061; Thermo Fisher Scientific). Individual plates were set up for each time point up to 7 days, n = 4/time point. The doubling time (DT) was calculated based on the following formula [40]:
where T, culture time in hours; Xe , cell number at harvest; Xb , cell number at seeding; Ln, natural logarithm.
Baseline measurement of HUCPVCs and hBMMSCs
We assessed the comparative baseline expression of 47,322 genes in HUCPVCs and hBMMSCs, from which we present the Tnfaip6 (TSG-6) expression level herein (Supplementary Fig. S1; Supplementary Data are available online at
TNF-α treatment in cultures
Cells were harvested at passage 3, plated at 12,000 cells/cm2 in six-well plates in complete media. After 18–24 h, when cells had adhered to the culture plates, the medium was changed to that supplemented with recombinant human/recombinant mouse TNF-α (rh/rmTNF-α) (rhTNF-α: Cat. No. 210-TA-020/CF; R&D Systems; rmTNF-α aa 80-235: Cat. No. 410-MT-050/CF; R&D Systems) (n = 3). Through our preliminary studies, we found 1 ng/mL to be the minimum concentration of TNF-α for reproducible cell activation. Thus, for this study, the TNF-α concentrations for MSC activation were 1, 10, 50, and 100 ng/mL. Cells were exposed to TNF-α for 0.5, 1, 10, 24, and 48 h. Experiments were conducted under one-time induction of TNF-α at a defined concentration; TNF-α was not continuously added.
Total RNA and protein sample collection
At each time point, supernatant was collected followed by immediate addition of 1 × protease inhibitor cocktail without EDTA (Cat. No. PIC002.1; BioShop) that contains 2 mM AEBSF HCL, 130 μM Bestatin, 14 μM E-64, 1 μM Leupeptin, and 0.3 μM Aprotinin. Cells were washed with PBS (1 × , Cat. No. 10010023; Gibco) followed by immediate lysis and collection of total RNA using the Arum™ Total RNA Mini Kit (Cat. No. 7326820; Bio-Rad), followed by the company's recommended procedure. Samples were stored at −80°C for further analysis.
RNA purification and reverse transcription
RNA was immediately purified using the Arum Total RNA Mini Kit (Cat. No. 7326820; Bio-Rad). Purity and quantity of RNA was measured through absorbance using spectrophotometric quantification (NanoDrop™ 1000; Thermo Fisher Scientific). The A260/A280 ratio for all RNA samples was 1.9–2. Genomic DNA elimination, and reverse transcription was performed using the iScript™ gDNA Clear cDNA Synthesis Kit (Cat. No. 1725035; Bio-Rad) according to the manufacturer's instructions. Approximately 300 ng of RNA from each sample was reverse transcribed to cDNA (Bio-Rad C1000™ Thermocycler) under the following synthesis reaction protocol: priming (5 min at 25°C), reverse transcription (20 min at 46°C), and reverse transcription inactivation (1 min at 95°C) followed by incubation at 4°C.
Reference gene selection
A reference gene panel consisting of 30 reference genes (H384, Cat. 10025899; M384, 10029516; Bio-Rad) was used to identify the most stable reference genes with regard to TNF-α treatment. cDNA samples of cells exposed to different concentrations and exposure time of TNF-α was tested on the panel. Three reference genes were chosen based on average expression stability (M-value) and their coefficient of variation (CV) on the normalized relative quantities. The reference genes used for quantification of human samples were human ribosomal protein L13a (Rpl13a), human beta-2-Microglobulin (β2m), and human glyceraldehyde-3-phosphate dehydrogenase (Gadph)—mean M value (0.0795), mean CV (0.0325) for HUCPVC samples; mean M value (0.0798) and mean CV (0.1881) for hBMMSCs samples. The most stable reference genes chosen for mouse were mouse tyrosine 3-monooxygenase/tryptophan 5-monooxygenase activation protein zeta (Ywhaz), mouse peptidylprolyl isomerase A (Ppia), and mouse Gadph—mean M value (0.3519), mean CV (0.1442). All primers were validated by Bio-Rad with the following unique assay IDs: human Rpl13a (qHsaCED0045063), human β2m (qHsaCID0015347), human Gadph (qHsaCED0038674), mouse Ywhaz (qMmuCED0027504), mouse Ppia (qMmuCED0041303), and mouse Gadph (qMmuCED0027497). Supplementary Figure S2 illustrates the quantification cycle (Cq) value, as proposed by Bustin et al. [41], of the selected reference genes across concentrations and exposure times. The starting material and loading concentration of the cDNA was maintained at the same quantity. Thus, the values of Cq represents the variation in the expression level of the genes when cells were treated with TNF-α.
Real-time polymerase chain reaction and quantification
Real-time quantitative polymerase chain reaction (RT-qPCR) was carried out on the synthesized cDNA using SsoAdvanced™ Universal SYBR Green Supermix (Cat. No. 1725272; Bio-Rad) according to the manufacturer's instructions (10 μL reaction volume) at an annealing temperature of 65°C. Each sample was run in triplicate and a Bio-Rad CFX384 Touch™ System was used for fluorescence measurement. Validated Bio-Rad TSG-6 primers had the following unique assay IDs: human TSG-6 (qHsaCID0008311), and mouse TSG-6 (qMmuCID0010069). Quantification was done by normalizing the expression levels of TSG-6 to the geometric mean of the three reference genes mentioned previously, using the Pfaffl method. PCR efficiency, linearity (R 2), slope, and y-intercepts, respectively, according to the Minimum Information for Publication of Quantitative Real-Time PCR Experiments (MIQE) guidelines for each cell type and primer calibration are listed: HUCPVCs-TSG-6 (101.1%, 0.99, −3.298, 44.961); HUCPVCs-Rpl13a (95.4%, 0.99, −3.436, 44.621); HUCPVCs-β2m (102.8%, 0.99, −3.255, 41.03); HUCPVCs-Gadph (97.7%, 0.99, −3.379, 41.264); hBMMSCs-TSG-6 (104.7%, 0.99, −3.214, 43.578); hBMMSCs-Rpl13a (104.3%, 0.99, −3.222, 4.139); hBMMSCs-β2m (103.3%, 0.99, −3.246, 37.588); hBMMSCs-Gadph (104.1%, 0.97, −3.228, 38.192); mBMMSCs-TSG-6 (92.4%, 0.99, −3.519, 45.855); mBMMSCs-Ppia (99.3%, 0.96, −3.339, 38.805); and mBMMSCs-Ywhaz (100.9%, 0.99, −3.302, 41.727).
Enzyme-linked immunosorbent assay and quantification
Culture supernatant samples supplemented with protease inhibitor stored at −80°C were tested for TSG-6 levels in the human samples using a validated sandwich-based ELISA Kit (Cat. No. ELH-TSG6; RayBiotech), as employed by others [42,43]. Before measurement, protein samples were centrifuged at 1,000 g for 5 min at 4°C to remove cellular debris. A standard curve was generated using the recombinant TSG-6 protein in the kit and all samples were tested in triplicate and measurements followed the company's recommended procedure. Sample absorbance was measured at 450 nm using a plate reader (SpectraMax i3x Multi-Mode Detection Platform; Molecular Devices). Total protein of the same samples was measured using the Pierce BCA Protein Assay Kit (Cat. No. 23225; Thermo Fisher Scientific) and measurements were then normalized to the total protein.
Statistical analysis
Statistical analysis of groups/time points was performed by means of factorial ANOVA multiple comparison followed by post hoc Tukey's statistical test between the mean of replicates at significance level of 95% confidence interval. Each figure legend indicates details of the statistical analysis performed. Statistical analysis was performed using GraphPad Prism 6.01 (GraphPad Software, Inc., La Jolla, CA).
Results
Growth rate of HUCPVCs and adult BMMSCs
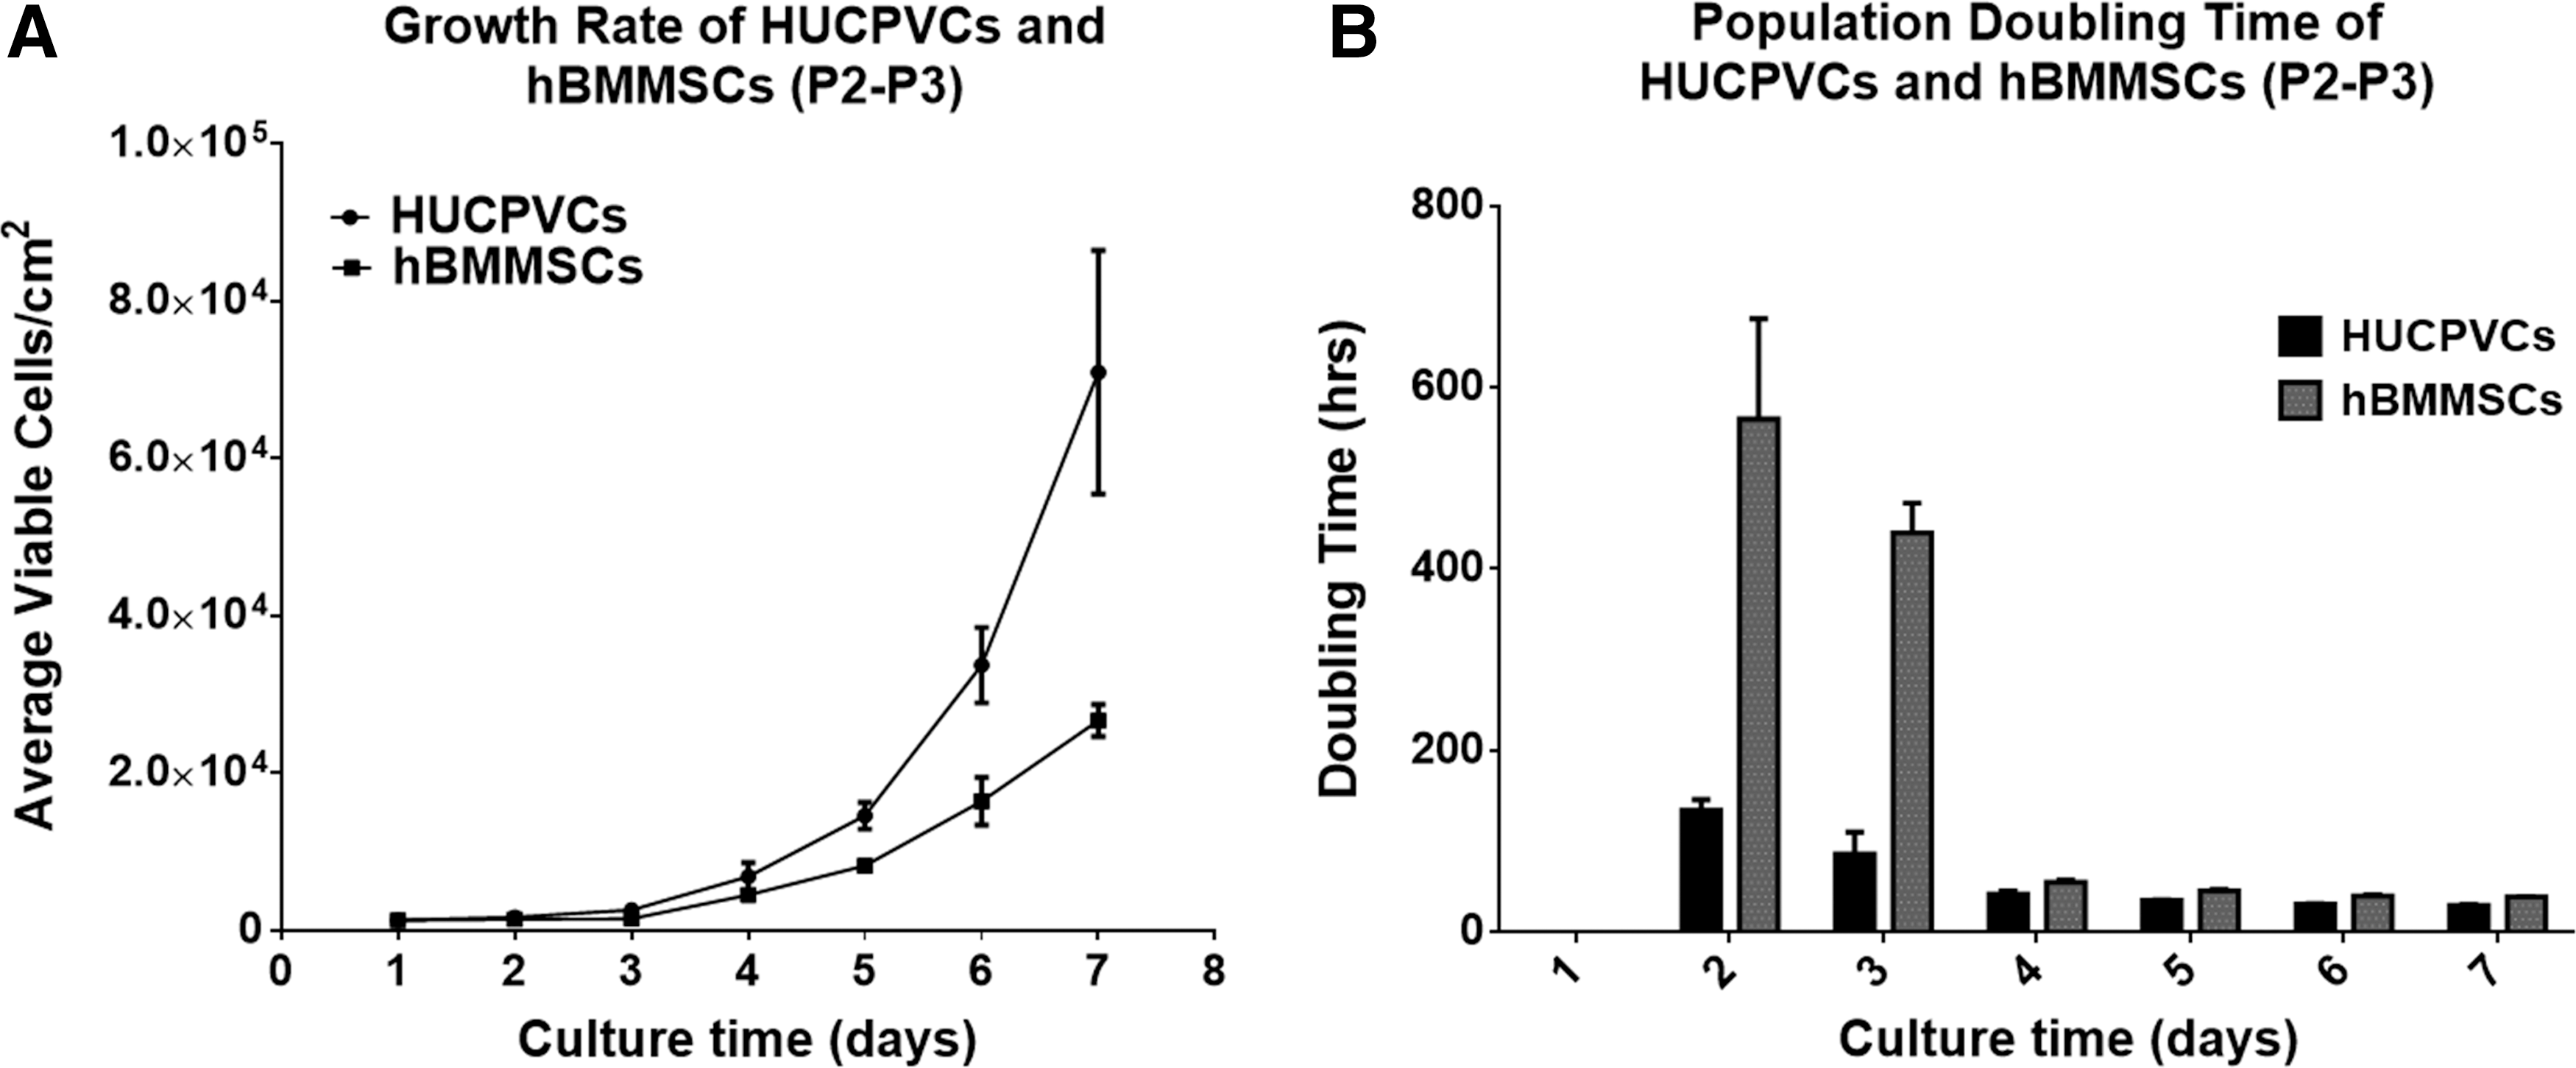
HUCPVCs when compared with hBMMSCs, exhibited faster growth rates of about 43% and 63%, postseeding on day 4 and 7, respectively (Fig. 1A). The short population DT of HUCPVCs, Fig. 1B, further highlights their growth rate from day 2 of seeding compared with hBMMSCs. Cultures of mBMMSCs represented a morphologically heterogeneous population with slow growth rate (not shown).
Growth profile
Response time of activated HUCPVCs
The TSG-6 mRNA expression profile of pooled HUCPVCs in response to TNF-α stimulation was assessed at various stimulant concentrations and exposure times. As shown in Fig. 2, upregulation of TSG-6 across all stimulant concentrations was evident in HUCPVCs compared with unstimulated HUCPVCs. Stimulation of HUCPVCs with 1 ng/mL of TNF-α resulted in the highest upregulation of TSG-6 expression in the first 30 min (
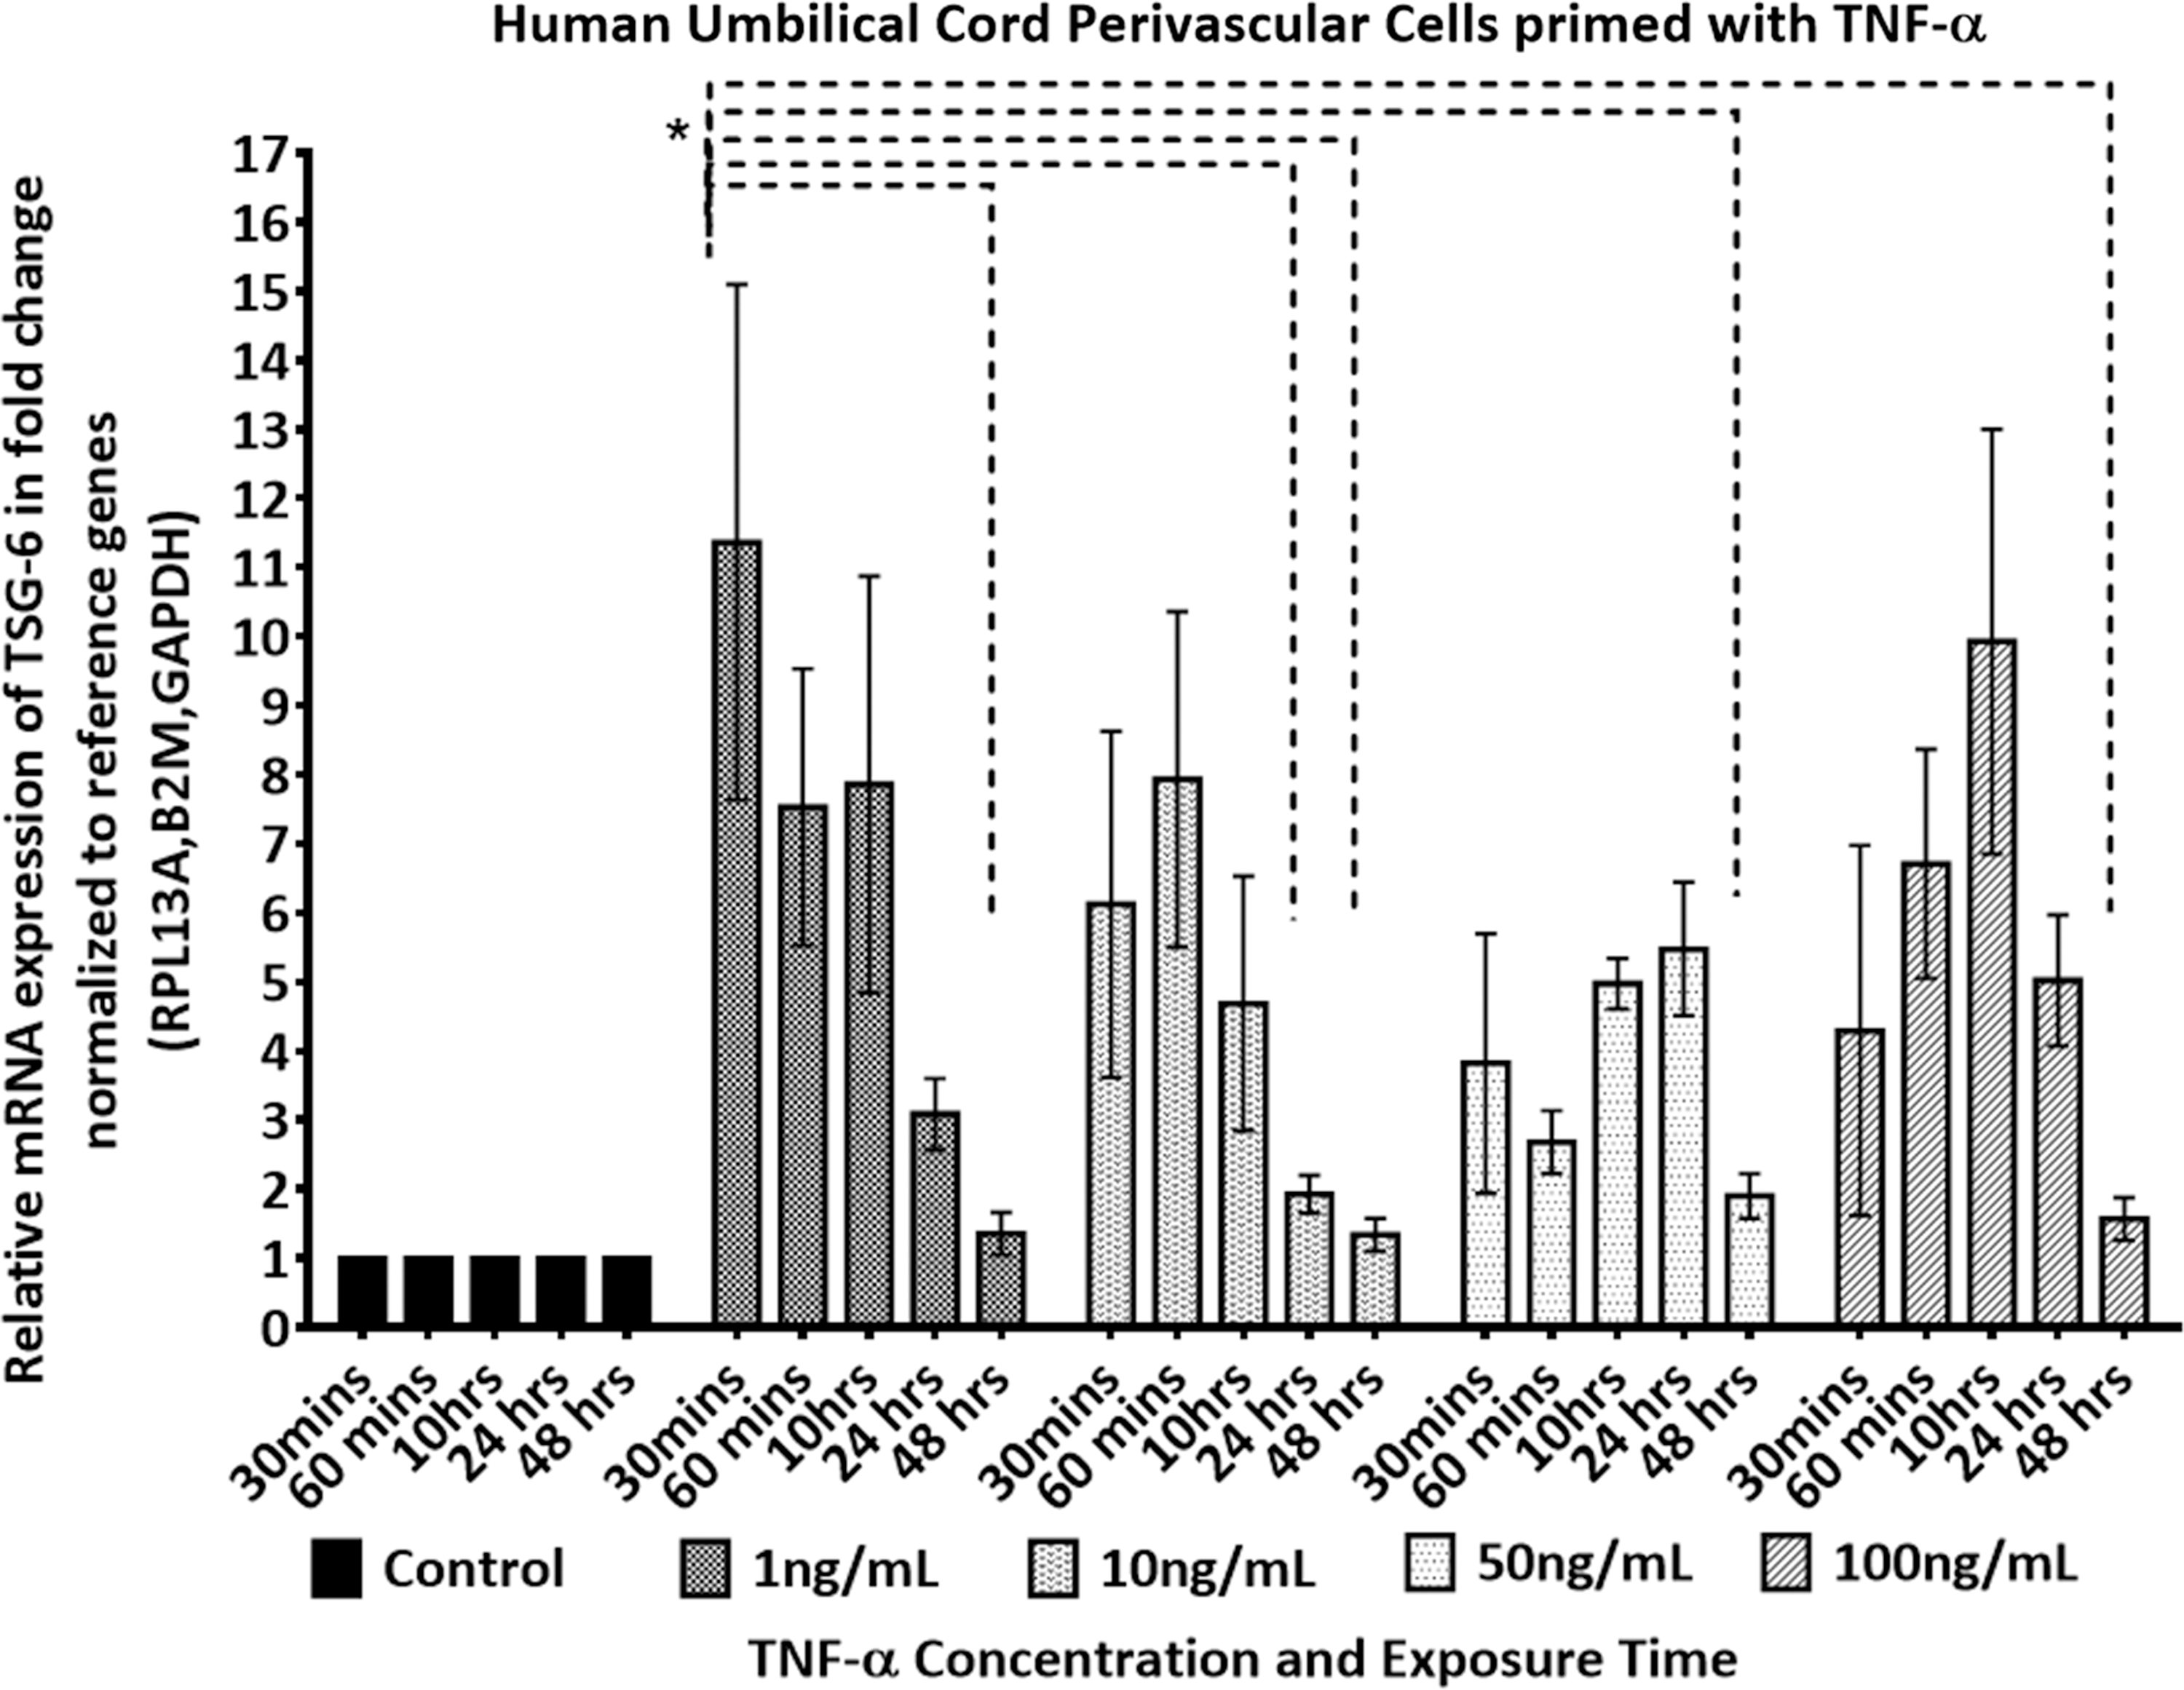
TSG-6 dose and response time of a pooled population of HUCPVCs stimulated with (1–100 ng/mL) of rhTNF-α. mRNA fold change expression level of TSG-6 was determined by RT-qPCR. Expression level was normalized to the geometric mean of β2m, Rpl13a, and Gadph and further normalized to the controls (untreated) of each time point. Two-way ANOVA multiple comparison Tukey's statistical test was performed between the mean of three replicates at significance level of 95% CI, data are expressed as mean ± SEM. Asterisk (*) represents P ≤ 0.05, otherwise, no significant difference was noted at P > 0.05. CI, confidence interval; Gadph, glyceraldehyde-3-phosphate dehydrogenase; rhTNF-α, recombinant human tumor necrosis factor alpha; Rpl13a, ribosomal protein L13a; RT-qPCR, real-time quantitative polymerase chain reaction; SEM, standard error of the mean; TSG-6, tumor necrosis factor-stimulated gene 6.
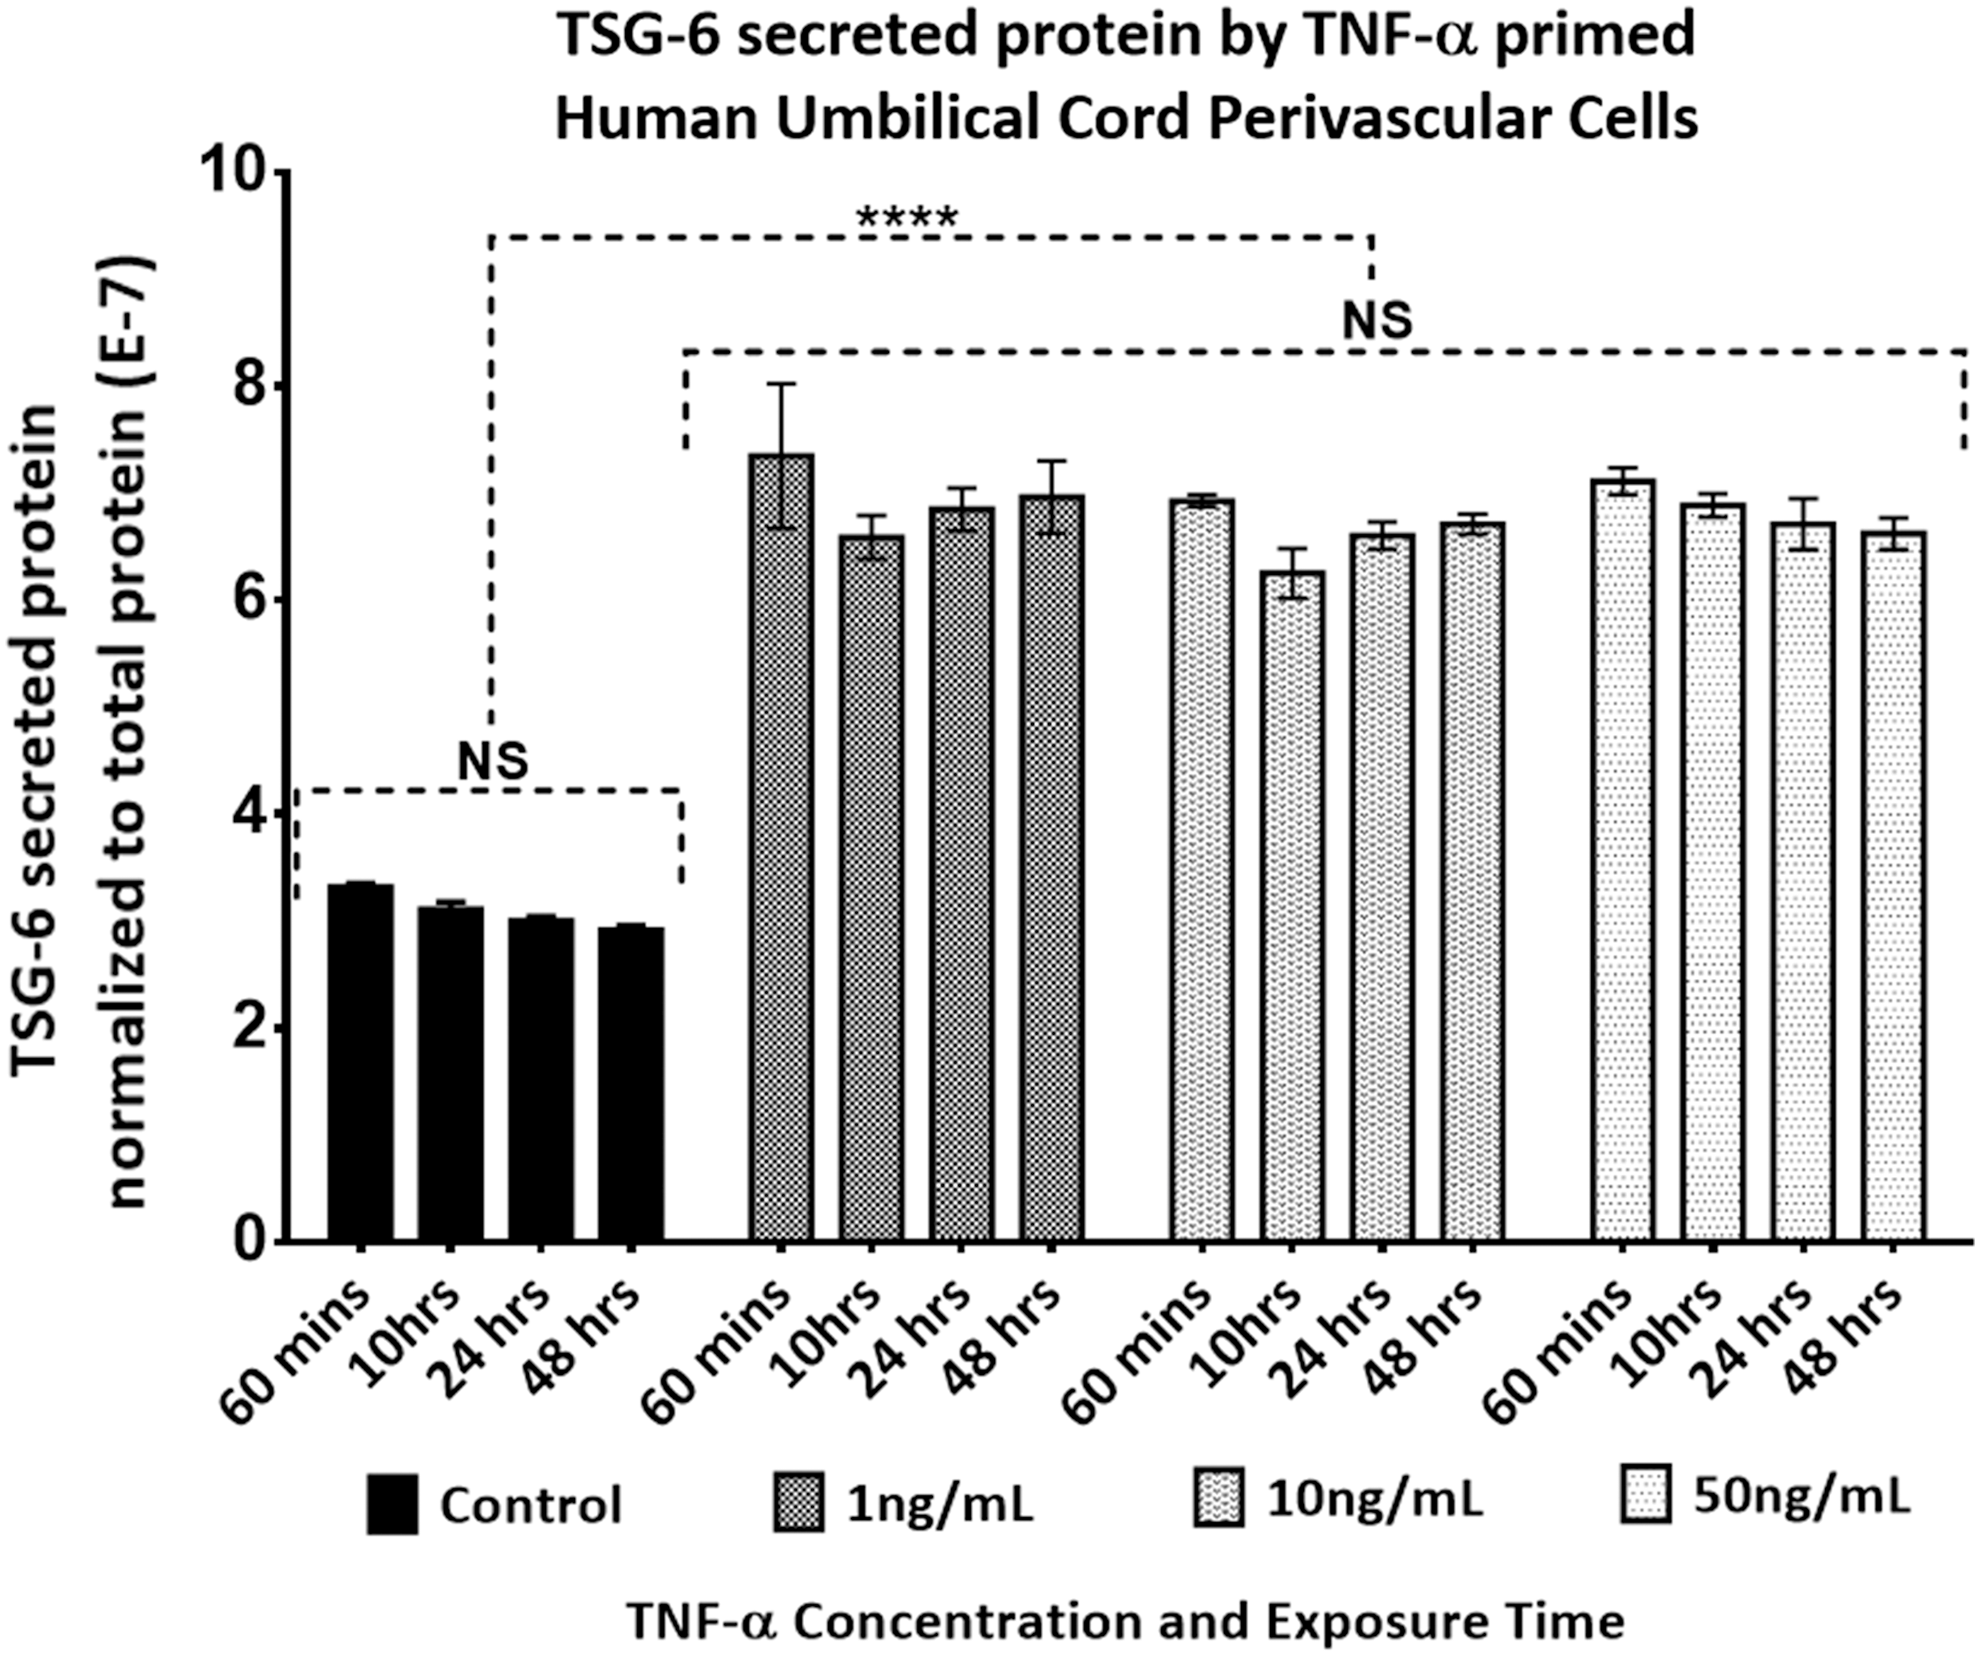
TSG-6 dose and response time of a pooled population of HUCPVCs stimulated with (1–100 ng/mL) of rhTNF-α. Secreted protein concentration of TSG-6 in the supernatant of the same cultures in Fig. 1, was quantified with ELISA and normalized to the total secreted protein/well. Two-way ANOVA multiple comparison Tukey's statistical test was performed between the mean of three replicates at significance level of 95% CI, data are expressed as mean ± SEM. Asterisk (****) represents P ≤ 0.0001, otherwise NS P > 0.05. ELISA, enzyme-linked immunosorbent assay; NS, not significant.
Response time of activated adult BMMSCs
To test the difference in TSG-6 expression pattern of HUCPVCs with an adult population of MSCs, we chose hBMMSCs to represent the most commonly employed mesenchymal cells in both research and clinical therapies. The TSG-6 mRNA expression profile of pooled hBMMSCs in response to TNF-α stimulation was assessed at various stimulant concentrations and exposure times, and is shown in Fig. 4, and statistical analysis is presented in Supplementary Table S1.
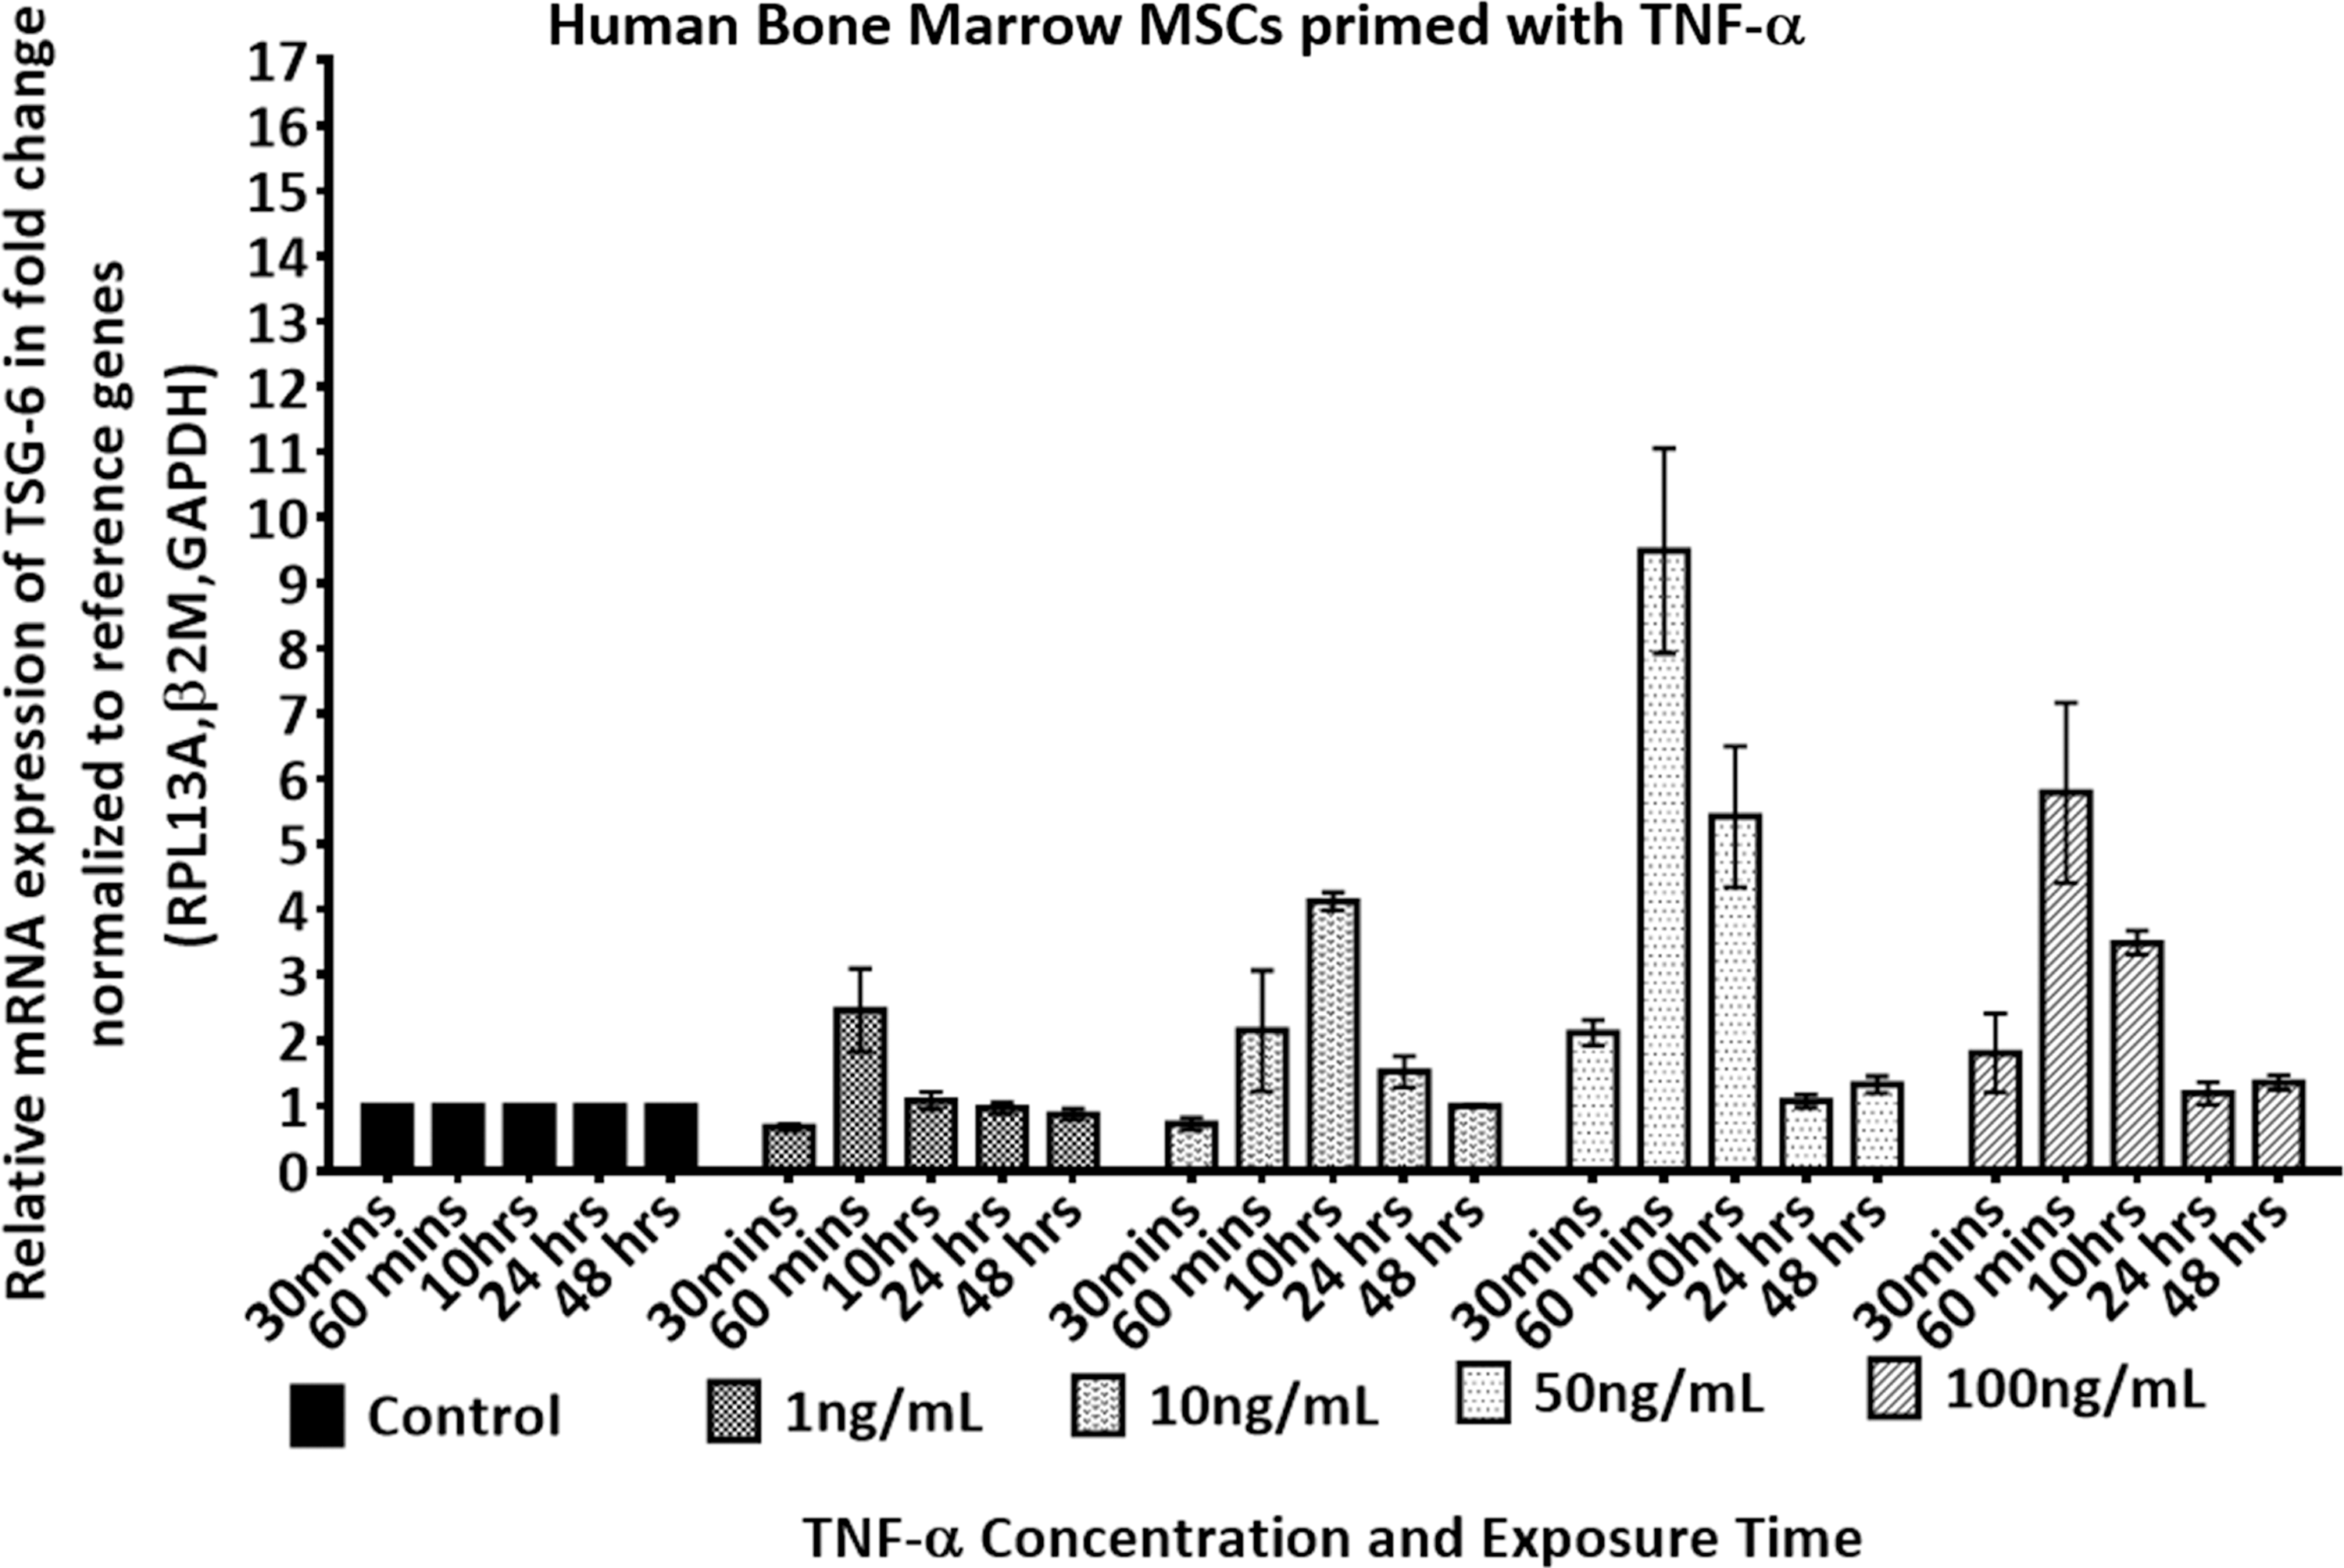
TSG-6 dose and response time of a pooled population of hBMMSCs stimulated with (1–100 ng/mL) of rhTNF-α. mRNA fold change expression level of TSG-6 was determined by RT-qPCR. Expression level was normalized to the geometric mean of β2M, Rpl13a, and Gadph and further normalized to the controls (untreated) of each time point. Two-way ANOVA multiple comparison Tukey's statistical test was performed between the mean of three replicates at significance level of 95% CI, data are expressed as mean ± SEM. Statistical significance between groups is shown in Supplementary Table S1.
Stimulation of hBMMSCs with 50 ng/mL of TNF-α after 60 min resulted in the highest upregulation of TSG-6 expression (

TSG-6 dose and response time of a pooled population of hBMMSCs stimulated with (1–100 ng/mL) of rhTNF-α. Secreted protein concentration of TSG-6 in the supernatant of the same cultures in Fig. 2, were quantified with ELISA and normalized to the total secreted protein/well. Two-way ANOVA multiple comparison Tukey's statistical test was performed between the mean of three replicates at significance level of 95% CI, data are expressed as mean ± SEM. Asterisks (*) represents P ≤ 0.05, and (**) P ≤ 0.01, otherwise NS P > 0.05.
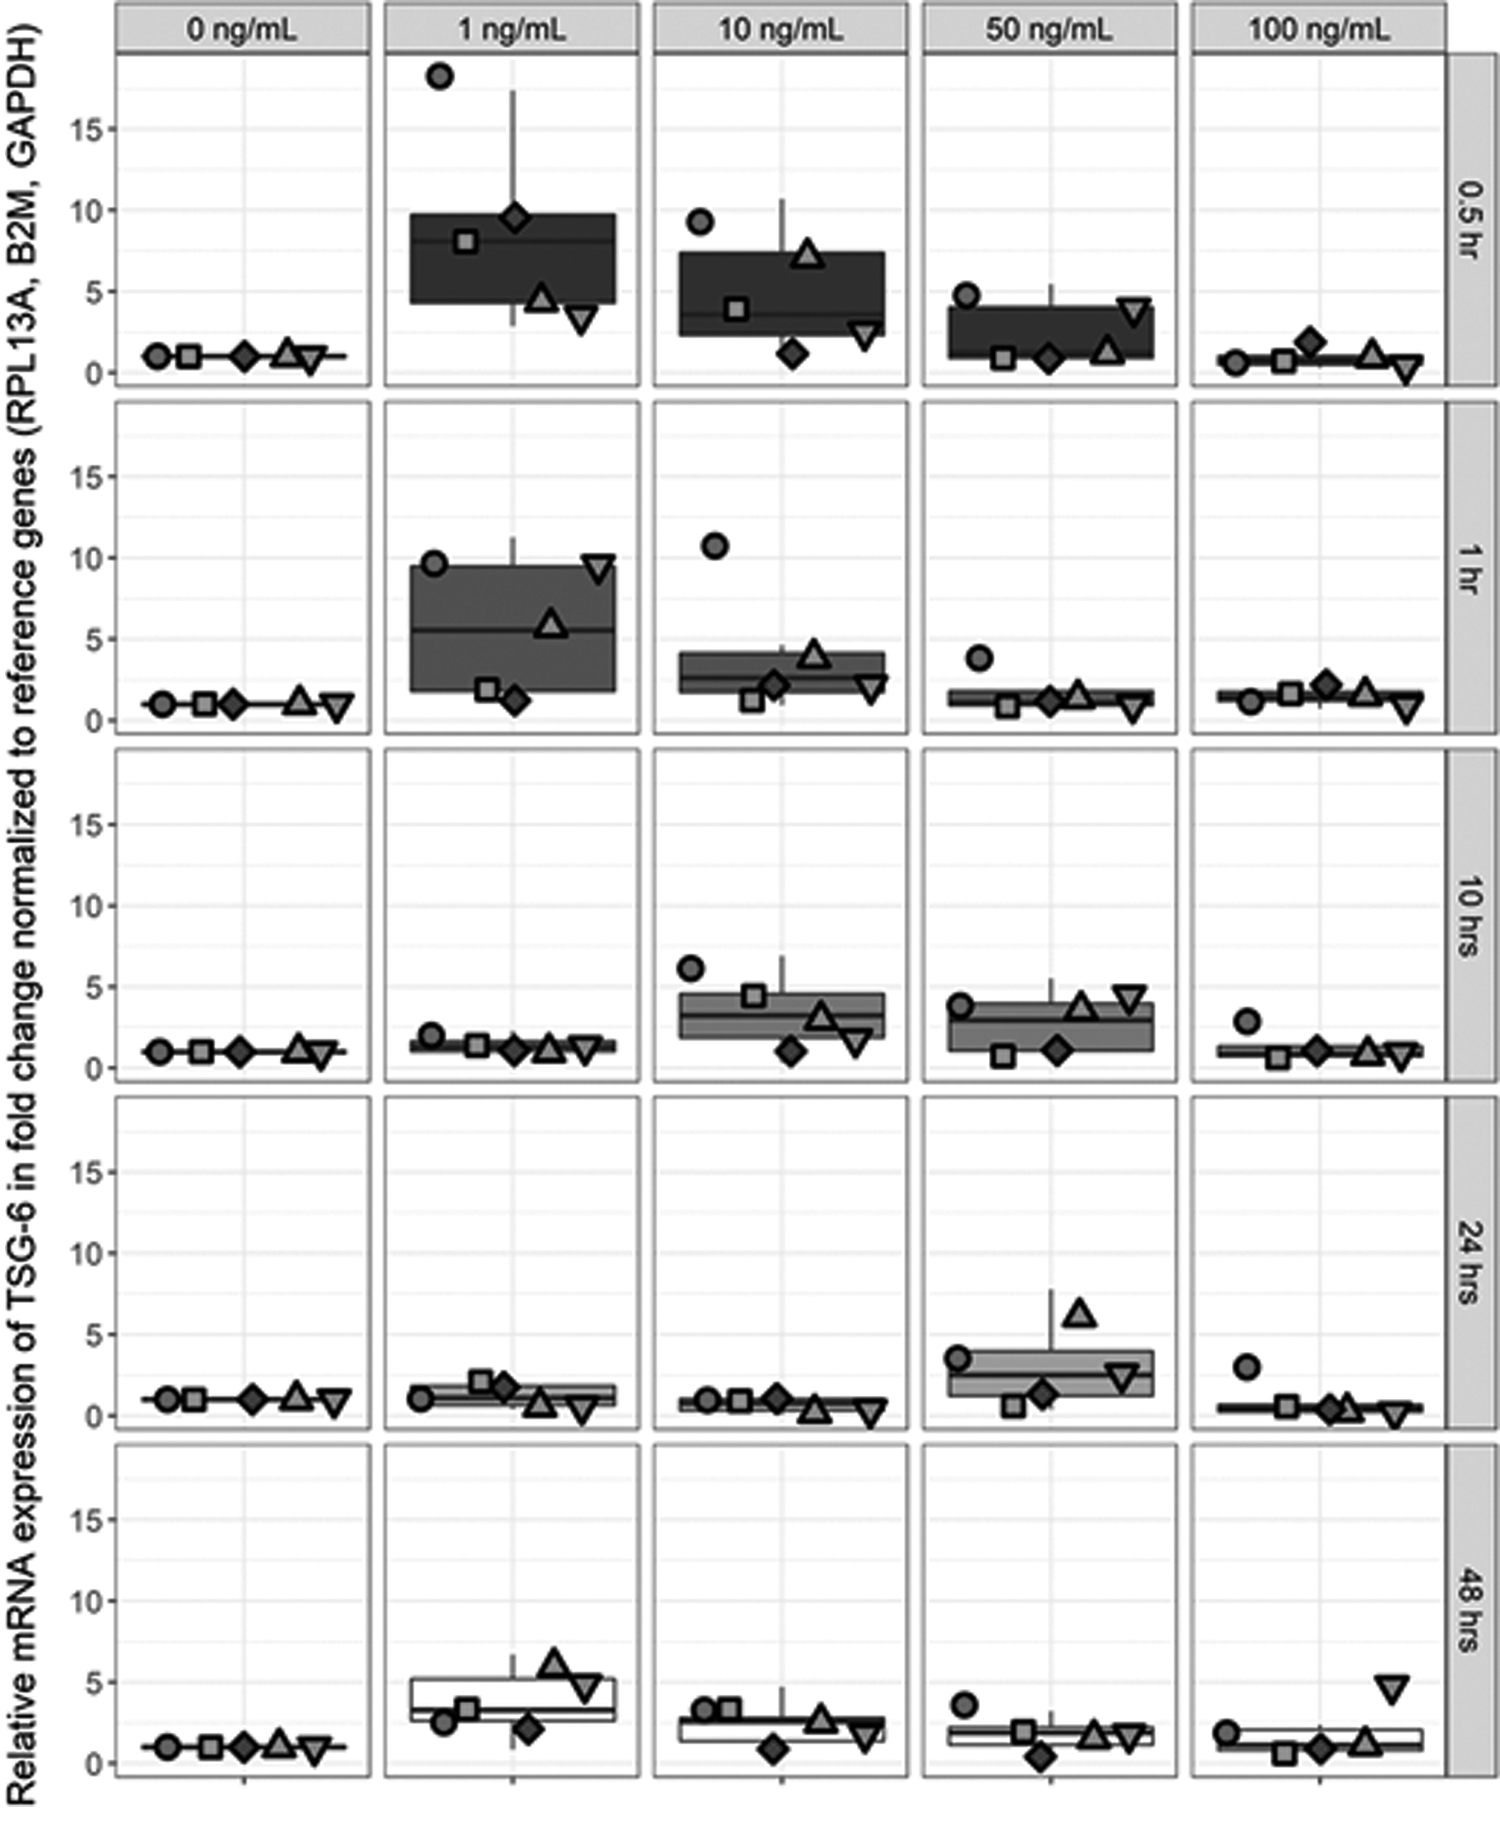
The response pattern of TSG-6 upregulation in the pooled population of mBMMSCs when stimulated with TNF-α is shown in Fig. 6. Statistical analysis suggests the highest stimulation to be achieved with TNF-α of 1 ng/mL at 48 h of exposure time (
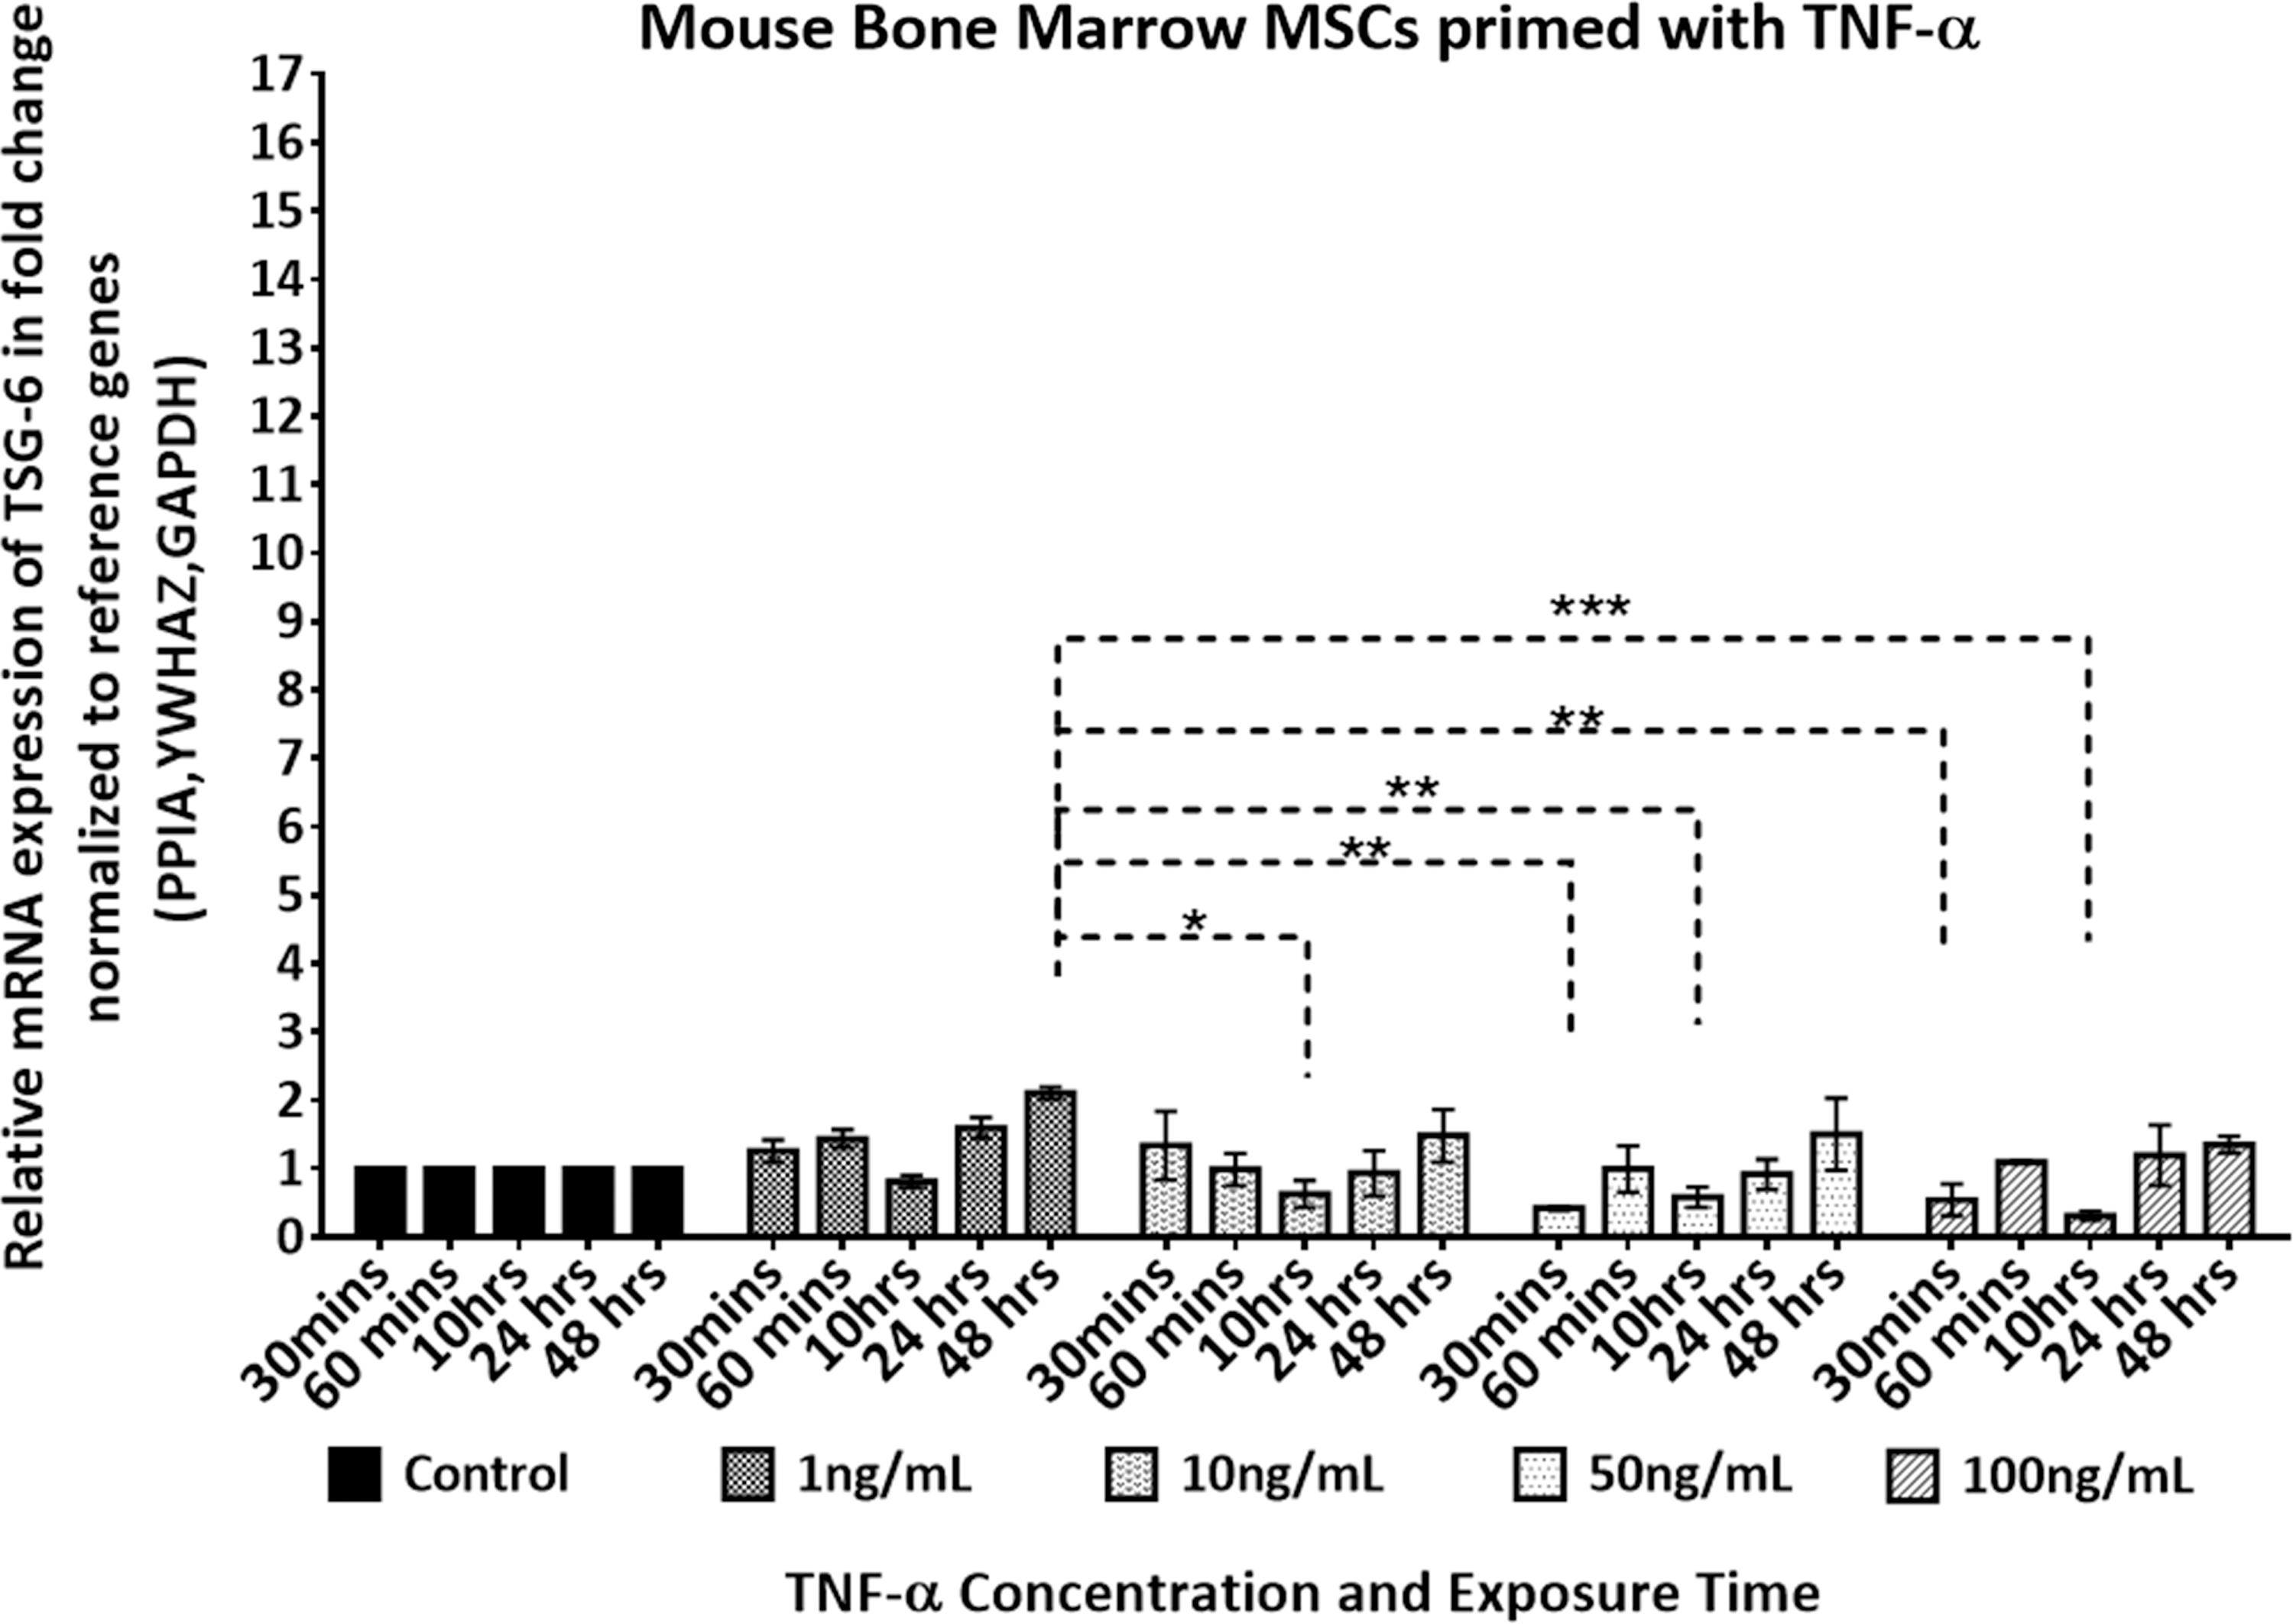
TSG-6 dose and response time of pooled donors of mouse bone marrow MSCs stimulated with (1–100 ng/mL) of rmTNF-α. mRNA fold change expression level of TSG-6 is determined by RT-qPCR. Expression level was normalized to the geometric mean of Ppia, Ywhaz, and Gadph and further normalized to the controls (untreated) of each time point. Two-way ANOVA multiple comparison Tukey's statistical test was performed between the mean of three replicates at significance level of 95% CI. Data are expressed as mean ± SEM. Asterisks (*) represents P ≤ 0.05, (**) P ≤ 0.01, (***) P ≤ 0.001, otherwise NS P > 0.05. Ppia, peptidylprolyl isomerase A.
Donor variation in HUCPVCs in response to TNF-α stimulation
TSG-6 expression in hBMMSCs has previously been shown to be donor dependent [31]. Thus, we assessed TSG-6 donor variation in HUCPVCs in response to various concentrations and exposure times of TNF-α stimulation (Fig. 7). Data from five independently cultured and stimulated HUCPVC populations plotted against stimulant concentration and exposure time are shown in Fig. 7. As can be seen in Fig. 7, TSG-6 expression is highly donor dependent in HUCPVCs. Across all donors, the highest expression was achieved with 1 ng/mL of stimulation with TNF-α within a short exposure period of 30–60 min. Higher concentrations and prolonged exposure times, inversely affected the expression level of TSG-6 in HUCPVCs. Statistical analysis is presented in Supplementary Table S2.
TSG-6 dose and response time of five HUCPVC donors stimulated with 1–100 ng/mL of rhTNF-α. mRNA fold change expression level of TSG-6 was determined by RT-qPCR. Expression level was normalized to the geometric mean of β2M, Rpl13a, and Gadph and further normalized to the controls (untreated) of each time point. One-way ANOVA multiple comparison Tukey's statistical test was performed between the mean of 15 data points [(n = 3/donor) × 5 donors] at significance level of 95% CI, data are expressed as mean ± SEM. Statistical significance between groups is shown in Supplementary Table S2. Red, Donor 1 (•); green, Donor 2 (▪); navy blue, Donor 3 (♦); aqua, Donor 4 (▴); olive, Donor 5 (▾).
Discussion
Both hBMMSCs and UCMSCs have been employed in cell therapy, and UCMSCs have been proposed as an alternative to MSCs derived from adult tissue sources. In this work, we studied the anti-inflammatory potency of HUCPVCs with respect to hBMMSCs in response to varying doses of TNF-α and monitored the pattern of upregulation of TSG-6.
Elevated serum and tissue levels of TNF-α, produced in inflammatory and infectious conditions, directly correlate with the severity of the inflammation or infection [44]. It has been shown that TNF-α induces an inflammatory response through the NF-κB signaling pathway [45]. Thus, TSG-6 that is shown to inhibit the NF-κB pathway is important in the regulation of TNF-α transcription. MSCs in contact with inflammatory stimulants switch to an activated state, upregulate anti-inflammatory-associated genes, and release anti-inflammatory mediators to immunosuppress/immunomodulate the inflammatory cascade. TSG-6 is identified as the most important mediator released by MSCs that shifts the proinflammatory milieu to an anti-inflammatory state [46]. Although in vitro assays cannot recapitulate the complex and dynamic physiological network, they can provide valuable insights into the cellular response to a distinct key mediator. The circulating concentration level of TNF-α in minor and advanced inflammation cases in humans ranges from 0.02 to 6 ng/mL [47 –53].
Interestingly, we found that in contrast to hBMMSCs, HUCPVCs demonstrated an early response (0.5 h) to 1 ng/mL of TNF-α, irrespective of the activation dose (Figs. 2 and 4). The prompt response of HUCPVCs corroborates the reported response of WJ-MSCs, where both unprimed and TNF-α or interferon-gamma (IFN-γ) primed WJ-MSCs demonstrated an earlier and higher extent of immunosuppression compared with hBMMSCs in an MLR assay [12]. The early response of WJ-MSCs was also reported to lead to early activation of the costimulatory molecule CTLA4 on peripheral blood mononuclear cells, which was not evident with hBMMSCs [12]. This prompt response of HUCPVCs may be associated with the age of UCMSCs compared with MSCs isolated from adult tissue sources. Several studies have highlighted the impact of BMMSCs donor age on the plasticity and differentiation capacity of the MSCs [54 –56], which would corroborate our results. The concentration of TSG-6 protein in the supernatant of HUCPVCs compared with hBMMSCs also reflected the low response of hBMMSCs to TNF-α activation compared with controls (Figs. 3 and 5). Additionally, when we compared the baseline gene expression of unstimulated HUCPVCs with hBMMSCs, the Tnfaip6 (TSG-6) expression level was 2.14-fold higher in the former (Supplementary Fig. S1).
The effect of TNF-α stimulation on the therapeutic effects of MSCs, from several tissue sources, have previously been studied as a function of dose and exposure time. It has been demonstrated that pretreatment of MSCs, before transplantation, can significantly enhance their therapeutic activity. Leijs et al. studied the effect of IFN-γ/TNF-α stimulation (1, 20, and 50 ng/mL) of hBMMSCs at 24 h and reported enhanced expression of migration and adhesion receptors of MSCs [57]. Ziaei et al. studied the effect of TNF-α stimulation on hBMMSCs for 2, 10, 24, and 48 h and observed greater CXCR4 expression with 10 ng/mL compared with 1 ng/mL of TNF-α stimulation after 24 compared with 2 h exposure time [58]. Interestingly, in the case of hBMMSCs, our results for TSG-6 were also higher at 24 h than earlier time points, and response to 10 ng/mL was >1 ng/mL. This was not the case for HUCPVCs.
Migration activity and CXCR4 upregulation has also been demonstrated in TNF-α-stimulated (100 ng/mL) human adipose-derived MSCs (hADMSCs) [59]. Lee et al., studied the effect of TNF-α stimulation (0.1–10 ng/mL) on hADMSCs and observed an enhanced secretion of IL-6, IL-8, monocyte chemoattractant protein-1 (MCP-1), and CXCL6 at an optimal concentration of 10 ng/mL at 48 h of exposure time [60]. Liu et al. also studied the effect of TNF-α (20 ng/mL) stimulation on hADMSCs for 24 h and observed the upregulation of MCP-1 at 24 h exposure time [61]. In an in vivo study, Kwon et al. studied the effect of pretreatment of hADMSCs with TNF-α (10 ng/mL), intramuscularly injected into athymic nude mice and observed an enhanced homing of endothelial progenitor cells and angiogenesis [62]. Furthermore, Liu et al. has reported upregulation of TSG-6 in human UCMSCs stimulated with a single dose of 10 ng/mL of TNF-α [26].
The aforementioned in vitro and in vivo studies confirm that the pretreatment of adult tissue-derived MSCs with TNF-α enhances both the migratory and immunomodulatory capacity of the cells and is dose dependent.
In this study, we observed the differential activation patterns of neonatal and adult tissue-sourced MSCs (Figs. 2 and 4). Importantly, as shown in Fig. 2, HUCPVCs upregulated TSG-6 independent of the stimulation dose, whereas adult hBMMSCs, corroborating previous reports and shown in Fig. 4, demonstrated TNF-α dose dependency. Additionally, prolonged exposure of MSCs to TNF-α did not lead to an increase in the expression level of TSG-6 in either HUCPVCs or hBMMSCs, independent of stimulation dose. This finding suggests that HUCPVCs and hBMMSCs could be activated at a shorter timescale than previously reported for pretreatment of MSCs. The observed downregulation in TSG-6 expression with prolonged culture time could be attributed to the short half-life of TNF-α. It has been reported that intravenously infused TNF-α has a short plasma half-life of 0.5 h in rats [63]. This supports our in vitro findings that suggest the effective response of MSCs to TNF-α to be within the first 0.5–1 h.
Lee et al., reported fold changes up to 80–120 for TSG-6 expression level of hBMMSCs when exposed to a single dose of 10 ng/mL of TNF-α for 48 h [29]. The difference in the observed fold changes of hBMMSCs in our study compared with Lee et al., could be associated with the difference in the stimulation methods. Lee et al., serum starved hBMMSCs during TNF-α stimulation, and Wang et al., have shown that serum starvation increases induction of TSG-6 in MSCs [64]. Clearly, it was not necessary to serum starve the HUCPVCs, as they were grown entirely in serum-free conditions; however, we did not serum starve either the human or murine BMMSCs to avoid sudden changes in the biological milieu of these cells. Another difference is the reference gene normalization method employed. To reduce the effect of reference gene variation, we followed MIQE guidelines [41] and normalized our TSG-6 expression data to the geometric mean [65] of 3 of the most stable (out of 30 tested) reference genes (data shown in the Supplementary Figure S2) to achieve a more reliable baseline for normalization of qPCR datasets. We believe this approach is important because reference gene expression is not protected from environmental changes in the cellular milieu. Yet, Gadph is commonly, and singularly, used for normalization of data involving tissues or cells treated with TNF-α and a number of such gene expression analyses have been done on TSG-6 in an inflammatory context [29,66,67].
In addition to HUCPVCs and hBMMSCs, we also explored the anti-inflammatory potency of mBMMSCs in a similar set of experiments. Stimulation of mBMMSCs with 10 ng/mL of TNF-α has previously shown to have minimal effect on upregulation of TSG-6 [29]. Indeed, Lee et al., reported that the response of hMSCs to TNF-α far exceeded that of human fibroblasts, but that murine MSCs showed an order of magnitude lesser response. We wanted to investigate if lower or higher concentrations of TNF-α would increase the induction of TSG-6 in mBMMSCs. Our results corroborated the earlier report [29]—both human MSC populations exhibited enhanced TSG-6 upregulation upon stimulation with TNF-α compared with mBMMSCs. mBMMSCs demonstrated a low-grade response to TNF-α exposure, with maximum upregulation of TSG-6 obtained after 48 h of exposure. Similarly to HUCPVCs, the TSG-6 expression level of mBMMSCs was independent of the stimulant concentration.
MSCs derived from different donors are shown to have different growth rate and potency. It has previously been reported that the expression level of TSG-6 by hBMMSCs is highly donor dependent [31] and we confirmed similar variation from HUCPVC donors (Fig. 6). However, our results also demonstrate an enhanced and prompt response of HUCPVCs to TNF-α stimulation compared with hBMMSCs. The question remains whether these in vitro results would correlate with an observable in vivo functional response. This we have done, and which we shall report elsewhere. If so, this would suggest that the functional potency of an MSC potentially could be screened, in vitro, with a rapid low-dose assay.
Conclusions
HUCPVCs showed higher sensitivity to TNF-α stimulation compared with hBMMSCs, but expression level varied across donors. Thus, MSC response to TNF-α stimulation is MSC population and source dependent, but neonatal MSCs may be a stronger candidate population than those derived from adult BM to treat inflammatory diseases.
Footnotes
Acknowledgments
S.H.J. gratefully acknowledges receipt of Ontario (OGS), Queen Elizabeth II, and Harron Graduate Scholarships during the course of this work. The authors are grateful to the Center for Microfluidic Systems in Chemistry and Biology, University of Toronto, for the use of the Bio-Rad CFX384 Touch™ System. The mouse bone marrow stromal cells were kindly donated by Dr. Donald G. Phinney at the Scripps Research Institute, Florida. This research was partially funded by Tissue Regeneration Therapeutics, Inc. (TRT).
This work was presented, in part, at the ISCT 2017 meeting in London, May 2017.
Author Disclosure Statement
S.H.J. and Y.L. declare no conflicts. J.E.D. is the founding president, officer, and shareholder of Tissue Regeneration Therapeutics, Inc. (TRT), Toronto, which provided the HUCPVCs.
References
Supplementary Material
Please find the following supplemental material available below.
For Open Access articles published under a Creative Commons License, all supplemental material carries the same license as the article it is associated with.
For non-Open Access articles published, all supplemental material carries a non-exclusive license, and permission requests for re-use of supplemental material or any part of supplemental material shall be sent directly to the copyright owner as specified in the copyright notice associated with the article.