
Abstract
Gravity influences physical and biological processes, especially during development and homeostasis of several tissues in the human body. Studies under altered gravity have been receiving great attention toward a better understanding of microgravity-, hypogravity (<1 g)-, or hypergravity (>1 g)-induced alterations. In this work, the influence of simulated hypergravity over human tendon-derived cells (hTDCs) was studied at 5, 10, 15, and 20 g for 4 or 16 h, using a large diameter centrifuge. Main results showed that 16 h of simulated hypergravity limited cell proliferation. Cell area was higher in hTDCs cultured at 5, 10, and 15 g for 16 h, in comparison to 1 g control. Actin filaments were more pronounced in hTDCs cultured at 5 and 10 g for 16 h. Focal adhesion kinase (FAK) was mainly expressed in focal adhesion sites upon hypergravity stimulation, in comparison to perinuclear localization in control cells after 16 h; and FAK number/cell increased with increasing g-levels. A tendency toward an upregulation of tenogenic markers was observed; scleraxis (SCX), tenascin C (TNC), collagen type III (COL3A1), and decorin (DCN) were significantly upregulated in hTDCs cultured at 15 g and COL3A1 and DCN were significantly upregulated in hTDCs cultured at 20 g. Overall, simulated hypergravity affected the behavior of hTDCs, with more pronounced effects in the long-term period (16 h) of stimulation.
Introduction
M
Interestingly, the adage “use it or lose it” holds true for musculoskeletal tissues as not only astronauts but also hospital patients rapidly (within days) lose muscle mass once they are in a near-weightlessness (microgravity) environment, which is found during spaceflight and, not less importantly, during bed resting. In fact, major health deteriorations generated by prolonged microgravity exposure are analogous to bed rest and aging-induced physiological degeneration [8].
Over the years, several studies have been conducted under simulated conditions of altered gravity using advanced ground-based facilities [9], such as bioreactors for microgravity/hypogravity (<1 g) research [10] and centrifuges for hypergravity (>1 g) studies [11,12]. Microgravity tools have been explored to generate three-dimensional (3D) microtissues by inducing cell aggregation and formation of spheroids [13]. In turn, exposing tissues to hypergravity constitutes a way of increased mechanical loading [14] to rescue cell phenotype after exposure to near-weightlessness conditions or toward the development of novel tissue-engineered substitutes [15].
Interestingly, simulated hypergravity has been widely demonstrated to act as a force stimulus [14], having positive effects on osteoblasts and chondrocytes by inducing a faster deposition of ECM components [16,17] or promoting osteogenic differentiation of stem cells [18]. Besides bones, cartilage, and muscles, tendons are critical musculoskeletal components, acting as mechanically active bridges by transmitting forces generated by muscles to bones, being subjected to distinct mechanical loads, from posture control (gravity) to daily body movements. Different studies have been focusing on bone, cartilage, and skeletal muscle, but effects on tendons (as well as ligaments) have been underappreciated. For instance, results from a 90-day study of bed rest simulated microgravity showed a reduction in tendon mechanical properties, including tendon stiffness and Young's modulus (58% and 57% reduction, respectively) [19]. On the other hand, no studies have focused on the effect of simulated hypergravity conditions on tendon cells and their biology. Therefore, the main objective of this study was to evaluate the influence of increasing g-levels (5, 10, 15, and 20 g) and different hypergravity exposure periods (4 and 16 h) on the behavior of human tendon-derived cells (hTDCs), a mixed population of tenocytes and tendon stem cells (TSCs)/progenitor cells [20]. Overall, simulated hypergravity conditions tested herein affected cell proliferation and morphology and the expression of tenogenic markers at the gene level, with more pronounced effects in the long-term period (16 h) of stimulation.
Materials and Methods
Isolation and culture of hTDCs
Tendon samples were collected from patients undergoing elective orthopedic reconstructive surgeries at Hospital da Prelada (Porto, Portugal) and obtained under informed consent, according to the Declaration of Helsinki and to the ethics committee of the hospital. hTDCs were isolated through collagenase digestion as previously described [20,21]. hTDCs were isolated from healthy tendon (autograft) collected from the knee (Sartorius) of a male patient of 25 years. Cells were cultured in minimum essential medium alpha (α-MEM; Invitrogen) supplemented with 10% (v/v) fetal bovine serum (FBS; Alfagene) and 1% (v/v) antibiotic/antimycotic solution (AB/AM; Life Technologies). Cells were maintained in a humidified atmosphere with 5% CO2–95% air at 37°C and expanded until a sufficient cell number was obtained. hTDCs were used at passages 2–3 for all experiments.
Hypergravity simulation using a large diameter centrifuge
To study the influence of hypergravity on tendon cell behavior, hTDCs were cultured and exposed to hypergravity conditions (5, 10, 15 and 20 g) for 4 or 16 h using the large diameter centrifuge (LDC) (Zeugma) at the European Space Research and Technology Center (ESTEC, European Space Agency; ESA, Noordwijk, The Netherlands). This centrifuge contains four arms with up to six free-swinging gondolas and can be used for experiments at hypergravity levels from 1 to 20 g [22]. As the LDC arms rotate, gondolas swing out, with a resultant acceleration vector perpendicular to their bottom surface. The large dimension of the LDC ensures minimal inertial shear effects [23].
A standard cell culture incubator was placed inside each gondola and cells were cultured in 24-well plates inside the incubator at 37°C in humidified air-locked chambers containing a 95% air and 5% CO2 atmosphere (Fig. 1). For all experiments, cells were seeded in 24-well tissue culture polystyrene plates at a density of 5 × 10⁴ cells/well and left to adhere for at least 1 h at 37°C, 95% air, and 5% CO2 before centrifugation. In addition, benchtop controls (1 g) were performed for both time points studied (4 and 16 h).

Experimental payload.
DNA quantification by PicoGreen assay
The amount of DNA of hTDCs was quantified by Quant-iT TM PicoGreen® dsDNA assay (ThermoFisher Scientific), according to the manufacturer's instructions. For that, cells were washed twice with phosphate-buffered saline (PBS), each sample was collected in 1 mL of sterile ultrapure water, and stored at −80°C until further quantification. Samples were thawed to room temperature, sonicated for 15 min, and then incubated for 5 min, protected from light with fluorescent dye PicoGreen, which has affinity for dsDNA. The fluorescence intensity was measured using a microplate reader (Synergy HT; BIO-TEK) with excitation and emission wavelengths of 485/20 and 530/25.
Immunofluorescence analysis of focal adhesion kinase
Immunocytochemical analysis was performed following 4 and 16 h of exposure to hypergravity of 1, 5, 10, 15, and 20 g. Cells were fixed with 10% (v/v) neutral buffered formalin (Richard-Allan Scientific™; ThermoFisher Scientific) for 20 min, permeabilized with 0.25% (v/v) Triton X-100 (Sigma-Aldrich) for 30 min, and unspecific reactions were blocked with 1% (w/v) bovine serum albumin (BSA; Sigma-Aldrich) for 30 min. For immunostaining, cells were incubated with primary antibody against focal adhesion kinase (FAK) (rabbit polyclonal, 5 μg/mL, ab39967; Abcam) at 4°C overnight and then incubated with secondary antibody Alexa Fluor® 488 donkey anti-rabbit IgG (H+L) (1:1,000, A21206; Molecular Probes®) for 1 h. Actin filaments were stained with Phalloidin (1:200, P1951; Sigma-Aldrich) for 30 min and nuclei were counterstained with DAPI (1:1,000, D9542; Sigma-Aldrich) for 5 min. All antibodies were diluted in 1% (v/v) BSA; phalloidin and DAPI were prepared in PBS. Cells were washed at least thrice between incubation steps and following DAPI staining. Stained cells were observed by fluorescence microscope (Transmitted and Reflected Light Microscope with Apoptome 2; Zeiss Group, Oberkochen, Germany).
Quantitative analysis of fluorescence images
Fluorescence images were analyzed using ImageJ 1.50i software. Changes in cell morphology were determined in the red channel [filamentous actin (F-actin) signal] by randomly outlining 30 isolated cells followed by quantification of the selected area (cell area) and the elongation index (aspect ratio, major axis/minus axis). For actin cytoskeleton analysis, selected cells were counted and segregated into two categories according to the amount of stress fibers. The extent of stress fiber formation was then determined by plotting the relative percentages of each cell category for the different conditions. Stress fibers were further studied using the ImageJ plug-in FibrilTool, which measured the anisotropy of actin fibers [24]. For each selection created, an anisotropy score was given, which indicated how parallel stress fibers were within cells (0 for no order and 1 for perfectly parallel ordered fibers).
Finally, the number of phosporylated FAK sites in each immunostained cell was determined using the function Analyze Particles. A minimum of 20 cells were analyzed and results are expressed as mean ± SEM.
Real-time reverse transcription-polymerase chain reaction
After culture, hTDCs were collected in RNAlater ® RNA Stabilization Solution (TermoFisher Scientific). Total mRNA was extracted using TRI Reagent® RNA Isolation Reagent (Sigma-Aldrich), according to the manufacturer's instructions. Then, RNA was quantified on a Nanodrop® ND-1000 spectrophotometer (ThermoFisher Scientific) and cDNA was synthesized from 50 ng of mRNA using the qScript™ cDNA synthesis kit (Quanta BioSciences). Reverse transcription-polymerase chain reaction (RT-PCR) was performed using PerfeCTA® SYBR Green FastMix (Quanta BioSciences), following manufacturer's instructions, on RT-PCR Mastercycler ep realplex gradient S machine (Realplex, Eppendorf). Primer sequences (Eurofins Genomics, UK) were designed using Primer-BLAST tool (Table 1). The relative gene expression was quantified using Livak's method (2−ΔΔCt) [25,26]. For this purpose, transcript expression of target genes was first normalized to the average expression of multiple internal control genes [glyceraldehyde-3-phosphate dehydrogenase (GAPDH); β-actin (ACTB) and Ribosomal 18S RNA (RNA18S)] [27] and then to a calibrator sample (1 g control). Five samples of each condition were considered and results are represented as fold change.
ACTB, β-actin; CD73, cluster of differentiation 73; CD90, cluster of differentiation 90; CD105, cluster of differentiation 105; COL1A1, collagen types I; COL3A1, collagen type III; DCN, decorin; GAPDH, glyceraldehyde-3-phosphate dehydrogenase; MSC, mesenchymal stem cell; RNA18S, ribosomal 18S RNA; SCX, scleraxis; TNC, tenascin C; TNMD, tenomodulin.
Statistical analysis
Statistical analysis was conducted using GraphPad Prism v6.0 software. Results are expressed as mean ± SEM. Statistical analyses were performed using one-way ANOVA test with Tukey post-hoc test. Statistical significances were established for P-values <0.05.
Results
Hypergravity exposure for 16 h reduced DNA content
DNA content was assessed to evaluate the influence of hypergravity on the viability/proliferation of hTDCs. Different exposure times resulted in a differential cell response. After a 4-h period of hypergravity exposure, no differences were observed in DNA content, independent of g-level tested (Fig. 2). Nevertheless, culturing hTDCs under hypergravity for 16 h resulted in diminished DNA content (Fig. 2). A significant reduction in DNA content was observed at 5 g (P < 0.0001), 10 g (P < 0.0001), 15 g (P < 0.0001), and 20 g (P < 0.005), in comparison to normogravity (1 g) control, but no significant reduction was observed in comparison to the “initial” (4 h, 1 g) DNA concentration.
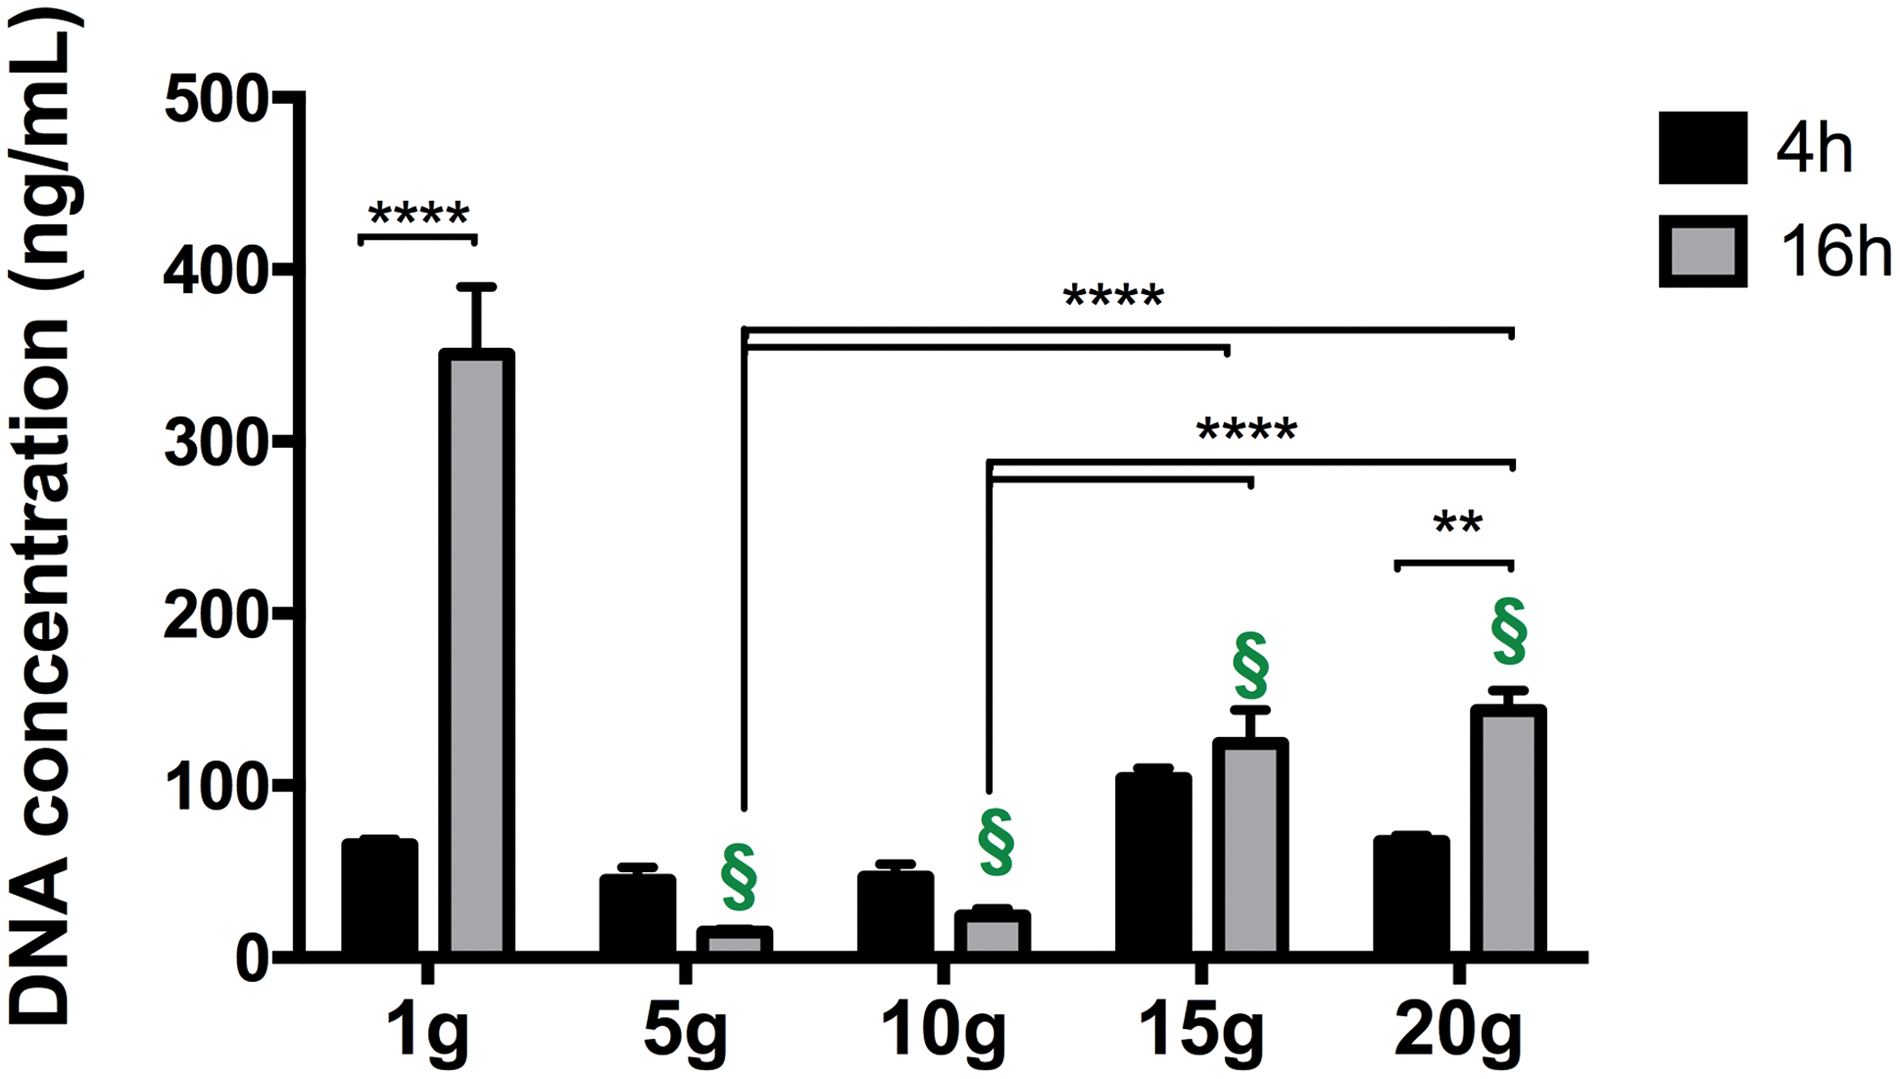
DNA content of hTDCs cultured at different g-levels. Results are presented as mean ± SEM (n = 5). Statistically significant differences are shown as **P < 0.05, ****P < 0.0001. § represents statistical difference in comparison to 1 g 16-h control with P < 0.0001. hTDCs, human tendon-derived cells. Color images available online at
Cytoskeleton is dynamically affected by hypergravity in a time- and g-level-dependent manner
To study the effects of simulated hypergravity in hTDC morphology, cell surface area and the extent of elongation were determined in cells stained for F-actin expression (Fig. 3). As shown in Figs. 3k and l, the 4-h exposure to hypergravity revealed no major changes in cell area and morphology. hTDCs exhibited their characteristic fibroblast-like shape (Figs. 3a–j and 4a–j), which did not change under hypergravity conditions, including for longer exposure times (16 h) (Fig. 4l). Yet, a significant increase (P < 0.001) in surface area was observed for cells cultured in hypergravity for 16 h (5, 10 and 15 g), when compared to 1 g controls (Fig. 4k).

Effect of 4-h exposure to hypergravity on hTDC morphology and F-actin distribution.

Effect of 16-h exposure to hypergravity on hTDC morphology and F-actin distribution.
Next, actin cytoskeleton organization was analyzed by phalloidin staining (Figs. 3, 4a–j). In general, F-actin expressed by hTDCs was mainly organized as parallel stress fibers, stretching along the major axis (yellow arrows), with some cells exhibiting protrusions in the form of filopodia (magenta arrows). Few peripheral actin bundles (green arrows) and lamellipodia could be detected under normogravity and hypergravity conditions. The extent of stress fiber formation was further assessed by categorizing cells according to their content in stress fibers. For the 4-h-period experiment, the relative number of hTDCs with pronounced and well-defined stress fibers was found to decrease as g levels were incremented up to 10 g (Fig. 3b, d, f, and n). However, exposure to higher g forces (15 and 20 g) seemed to elicit a reverse effect, in which stress fibers inside hTDCs became more evident again (Fig. 3h, j, n). Interestingly, the opposite response was observed for hTDCs exposed to hypergravity for 16 h (Fig. 4b, d, f, h, j, and n).
Finally, the anisotropy of actin stress fibers was determined for hTDCs exposed to 1 g and hypergravity as a measure of the degree of alignment and organization of actin stress fibers. The measured anisotropy score was not significantly altered with increasing g levels for hTDCs cultured for 4 h (Fig. 3m). Yet, longer hypergravity exposure significantly increased the anisotropy score when compared to 1 g controls (Fig. 4m). Indeed, stress fibers inside hTDCs exposed to higher g levels showed more well-defined and parallel actin fibers, while under 1 g conditions, stress fibers formed inside hTDCs with more than one direction, which overall contributed for a lower anisotropy score.
Expression of activated FAK is affected under hypergravity
The expression of activated FAK (phosphorylated FAK), a protein of the focal adhesion complex, was studied by immunocytochemistry (Figs. 5 and 6).

Expression of FAK (FAK Y397) under simulated hypergravity during 4 h.

Expression of FAK (FAK Y397) under simulated hypergravity during 16 h.
After a 4-h period of stimulation, FAK was found mainly localized at focal adhesion sites in cells cultured at 1 g (Fig. 5a), 5 g (Fig. 5b), 15 g (Fig. 5d), and 20 g (Fig. 5e), while in hTDCs cultured at 10 g, FAK appeared mainly with a perinuclear location (Fig. 5c). In addition, although smooth changes were registered in terms of FAK number/cell, particularly with an increase in hTDCs cultured at 5 g, no significant changes were observed upon exposure to simulated hypergravity for this shorter period (P > 0.05, Fig. 5f).
After a 16-h period, in all hypergravity stimulation conditions, FAK appeared at focal adhesion sites (Fig. 6b–e), whereas in control cells, FAK was mainly localized in the perinuclear region (Fig. 6a). Moreover, this period of stimulation seemed to result in a tendency for an increased FAK number/cell with increasing g-levels (Fig. 6f). In fact, the number of activated FAK points per cell was significantly higher in hTDCs exposed to 15 and 20 g, in comparison to cells cultured at 1 g control conditions (P < 0.05, Fig. 6f).
Gene expression profile is altered under continuous hypergravity (16 h)
Gene expression analysis was performed to evaluate the effect of hypergravity in the regulation of tenogenic markers. Figure 7 shows the results from quantitative RT-PCR analysis of scleraxis (SCX), tenomodulin (TNMD), decorin (DCN), collagen types I (COL1A1) and III (COL3A1), and tenascin C (TNC) in hTDCs cultured under hypergravity for 16 h. In hTDCs cultured at 15 g, SCX expression was significantly upregulated by fourfold (P < 0.05) in comparison to normogravity control (Fig. 7). However, no differences were observed for the transcript levels of TNMD, a tenogenic differentiation marker regulated by SCX. Moreover, although no differences were found for COL1A1, increasing g-levels clearly resulted in an upregulation of the expression of tendon ECM-associated genes TNC, COL3A1, and DCN (Fig. 7). Indeed, cells cultured at 15 g exhibited 5.4-fold upregulation of TNC (P < 0.01), 6.4-fold upregulation of COL3A1 (P < 0.05), and 7-fold upregulation of DCN (P < 0.05). Similarly, hTDCs exposed to 20 g presented 5.9-fold and 6.5-fold higher expression levels of COL3A1 and DCN (P < 0.05), respectively.
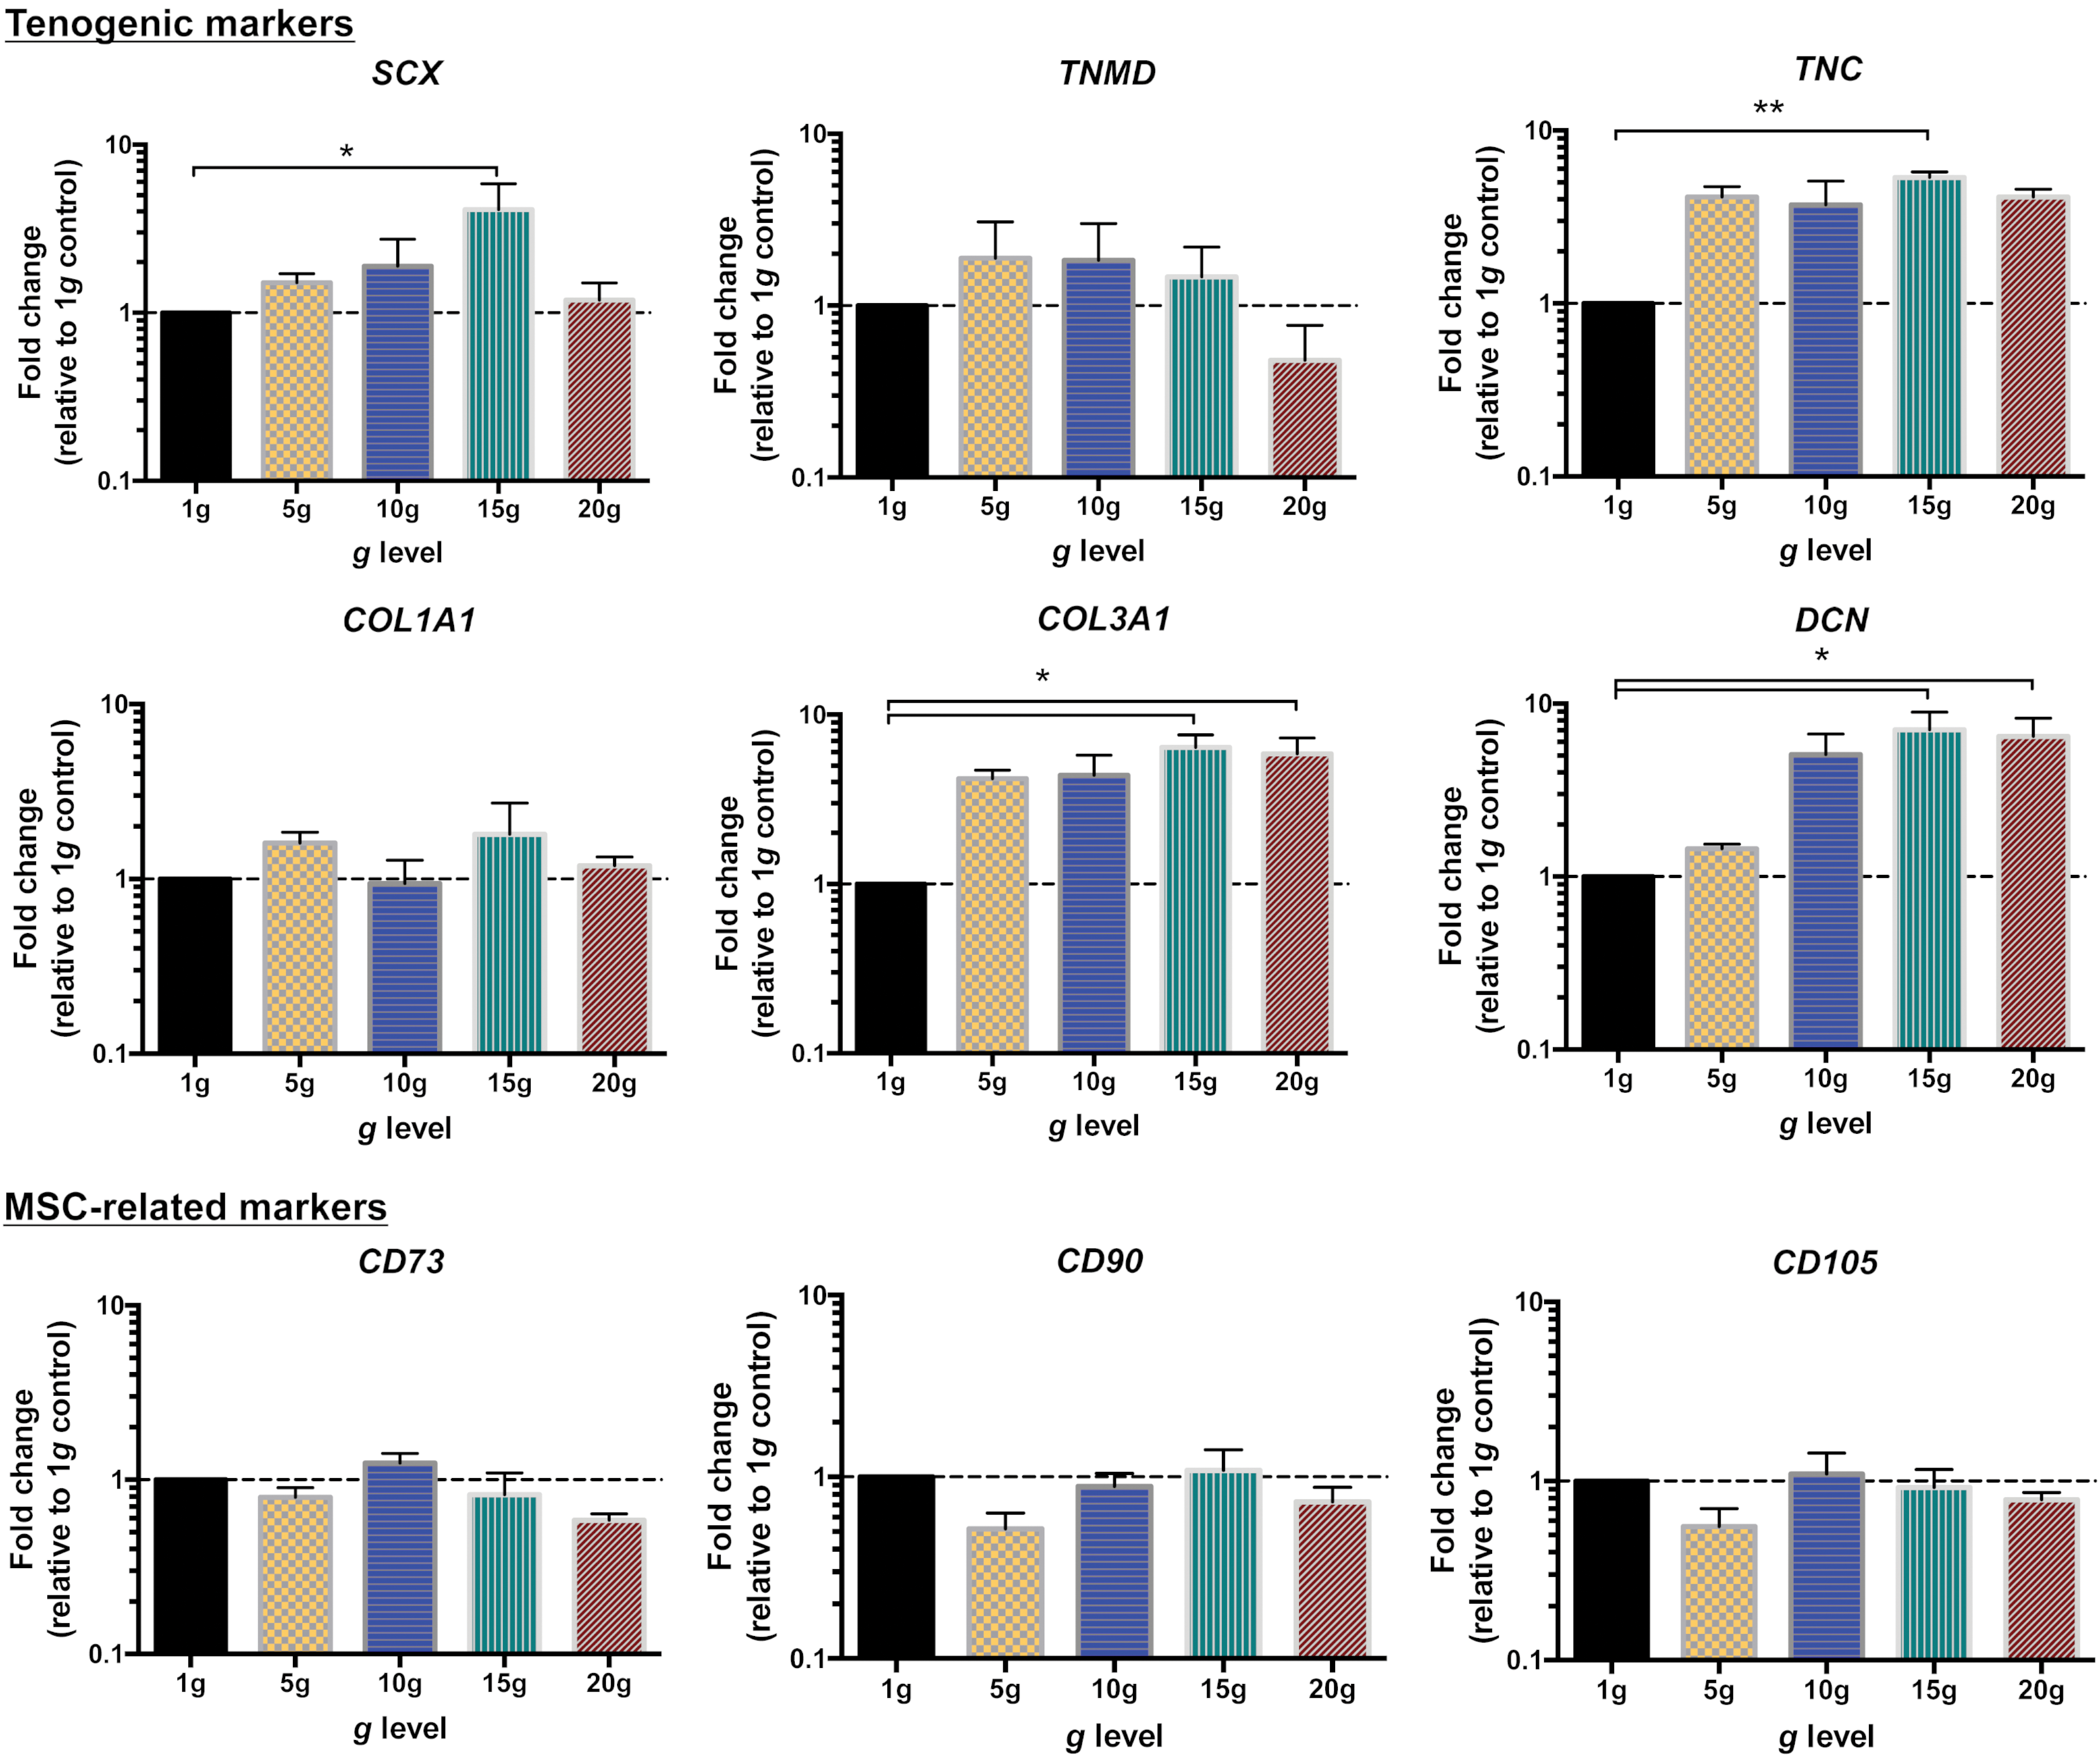
Expression of tendon-related genes and MSC-related markers in hTDCs cultured under hypergravity for 16 h. Expression of target genes was normalized to average internal control gene expression (GAPDH, ACTB, and RNA18S); 1 g was used as calibrator sample. Results are presented as mean ± SEM (n = 5). Dashed lines represent the calibrator sample (considered 1). Statistically significant differences are shown as *P < 0.05; **P < 0.01. ACTB, β-actin; GAPDH, glyceraldehyde-3-phosphate dehydrogenase; MSC, mesenchymal stem cell; RNA18S, ribosomal 18S RNA. Color images available online at
Furthermore, the expression of mesenchymal stem cell (MSC)-related markers, CD73, CD90, and CD105 was studied as a preliminary assessment regarding the influence of hypergravity on the stemness phenotype of the mixed population of hTDCs (Fig. 7). Herein, no differences on transcript levels of these markers were found between hypergravity-stimulated and control cells.
Discussion
Effects of altered gravity, in particular of hypergravity, on cell behavior are still far from being understood. Few studies exist and experimental results are even contradictory, due to the lack of standardized protocols, and different experimental setups and equipment [28]. Nonetheless, novel insights into the influence of acceleration forces caused by centrifugation can be helpful in several areas of biomedicine toward (1) understanding the potential of centrifugation as a countermeasure for microgravity-induced cellular alterations and (2) using these force stimuli to manipulate cell fate in tissue-engineered constructs. In this study, the behavior of hTDCs cultured under hypergravity conditions was evaluated using different g-levels (5, 10, 15, and 20 g) and different exposure times (4 or 16 h), with particular focus on cell morphology, cytoskeleton organization, and gene expression. Herein, hypergravity exposure periods selected were based on previous studies of the team, in which endothelial cells (also mechanoresponsive) were used, and time- as well as g-level-dependent effects were reported [29]. To the best of our knowledge, this is the first report on the influence of hypergravity on hTDCs. The isolated hTDC population has been described to exhibit MSC-related surface markers (positive ≥95% for CD73, CD90, and CD105; ≤2% for CD34 and CD45) [20] and to differentiate at least toward the osteogenic lineage (data not shown), supporting the existence of a mixed population containing mature tenocytes and TSCs/progenitor cells. Previous reports under simulated microgravity have not only shown the maintenance of stemness properties of embryonic stem cells [30] and adipose-derived MSC [31] but also the influence of exposure time on directing MSC differentiation toward soft tissue lineages or osteogenesis [32]. In turn, hypergravity can be applied as a tool to simulate loading [15], which has also been shown to direct osteogenic differentiation of MSC [33]. Therefore, we studied simulated hypergravity under the hypothesis that the behavior of hTDCs, as a heterogeneous population of mechanosensitive cells, could be altered with potential beneficial effects for the preconditioning of cells in tissue engineering strategies.
As a first approach, DNA content was quantified to infer on cell proliferation under hypergravity. Previous studies have reported an increased proliferation of adipose-derived stem cells (discontinuous exposure to 10, 20, 40, and 60 g—three times, 20 min—with intervals of 40 min at 1 g) [34], HeLa and JTC-12 cells (continuous exposure to 40 g up to 3 days) [35], and endothelial cells (human umbilical vein endothelial cells, continuous exposure to 3.5 g for 48 and 96 h) [36]. In addition, by studying the time-dependent effect of hypergravity (5 g) on the proliferation of MC3T3-E1 cells, Miwa et al. demonstrated an increase in DNA synthesis after 15 and 30 min of stimulation, but proliferation seemed to reach a plateau since no differences could be observed between 30 and 60 min of exposure [37]. In contrast, a slight reduction on the proliferation of human osteoblasts cultured for 24 h at 13 g has been described [38], whereas Hirasaka et al. reported no differences in the proliferation of rat myoblasts exposed to a short-term period (10 min) of hypergravity (3 and 100 g) [39]. Similar results have been observed for rat MSCs continuously cultured for 1 day at 10 g using the LDC [40]. Moreover, after culturing C2C12 mouse myoblasts for 2 h in the LDC at 5, 10, or 20 g, an increase in DNA content has been described for 10 and 20 g levels, in comparison to controls and 5 g level [41]. In our study, no differences in DNA synthesis were observed after 4 h of exposure to 5, 10, 15, or 20 g; however, DNA content was reduced for all g-levels after 16 h, in comparison to control. Altogether, these results suggest that the influence of hypergravity on cell proliferation might be orchestrated in a time-, g-level-, and cell type-dependent manner.
Besides cell proliferation, the morphology and cytoskeleton organization of hTDCs were evaluated upon hypergravity exposure. Although no studies have been conducted using tendon cells, reports in the literature with other cell types have demonstrated distinct results. For instance, no morphological alterations were detected on human osteoblasts cultured at 13 g for 24 h [38], neither on endothelial cells cultured at 3 or 10 g for 4 and 16 h [29]. On the other hand, an increase in cell aspect ratio (major cell axis/minor cell axis) has been described in adipose-derived stem cells cultured following a discontinuous exposure to 10, 20, 40, and 60 g (3 times, 20 min—with intervals of 40 min at 1 g) [34]. Also, increased cell area and cell perimeter were found in osteoblasts cultured at 3.3 and 4 g for 3 h or 2 days [42]. Herein, changes in cell area were only observed for the 16-h stimulation period. Indeed, hTDCs cultured at 5, 10, and 15 g for 16 h were significantly bigger, but no differences were detected in cell ratio for any condition in comparison to control, suggesting a time- and g-level-dependent effect on the morphology of hTDCs.
Furthermore, the cytoskeleton is the first responder to mechanical stimuli, allowing the cell to sense the surrounding environment and translate the input signals in alterations at cellular, molecular, and genetic levels. Overall, changes in cytoskeleton organization occur in response to altered gravity [43]. In particular, F-actin is the main protein of the microfilaments, which compose the cytoskeleton. Major alterations under hypergravity have been reported to include an increased thickness of actin stress fibers, as well as a higher number of fibers/cells [42,44,45]. Strikingly, F-actin anisotropy in hTDCs exposed to hypergravity was changed at 5 g in a time-dependent manner: after 4 h, actin filaments were less aligned than in control cells, while after 16 h of hypergravity, actin filaments were more aligned; no changes were detected for higher g-levels (>5 g) in any of the time points studied. Accordingly, more pronounced stress fibers were also observed at 5 g after 16 h. These results suggest that cytoskeleton is dynamically affected in response to hypergravity, being again dependent on the time of exposure and on different g-levels.
In matter of response to mechanical stimuli, cytoskeleton organization is strongly influenced by integrin-mediated focal adhesion complex integrating protein, including FAK, mostly activated by an autophosphorylation process at the tyrosine residue Tyr-397, acting therefore as an important integrator to control cell adhesion and motility [46]. Upon mechanical input through simulated hypergravity, the expression of FAK was enhanced in hTDCs exposed for the longer period (16 h), both at 15 and 20 g, leading to higher FAK number/cell in comparison to 1 g, while no changes were observed at 4 h of exposure. Although no studies have been reported concerning the activation of FAK under hypergravity in tendon cells, a particular study demonstrated that MC3T3-E1 osteoblasts did not change the expression profile of FAK when stimulated either at 1 and 12 g for 15 min [47]. However, longer periods of stimulation were not reported. On the other hand, cyclic stretched (1 Hz) neonatal rat ventricular myocytes (NRVMs) between 5% to 20% for 10 min increased FAK phosphorylation at Tyr-397 from 1.5- to 2.8-fold, and such phosphorylation escalated from 2.5- to 3.5-fold when NRVMs were stretched at 15% from 10 to 120 min [48]. In agreement with this study, phosphorylated FAK Tyr-397 was localized toward the periphery of the cell rather than the nuclear region. These findings suggest that phosphorylation of FAK is similar in localization whether cells are mechanically stimulated with hypergravity or cyclic stretching; however, its expression is highly encouraged by cell type and time of exposure.
Finally, the influence of hypergravity on the expression of tenogenic genes was also assessed after stimulating hTDCs for 16 h. Although there are no specific markers for characterizing tendon-derived cells, a panel of markers is commonly accepted, including SCX, TNMD, DCN, COL1A1 and COL3A1, and TNC. SCX is a basic loop-helix-loop transcription factor that has been identified in developing and mature tendons [49] and is involved in the regulation of collagen type I expression and production [50,51]. Mechanical forces have been previously described to regulate SCX expression [52,53], but the effect of hypergravity is yet to unveil. Herein, a trend for SCX upregulation was evidenced after 16 h of hypergravity stimulation. In particular, hTDCs cultured at 15 g exhibited significantly higher SCX transcript levels (fourfold increase), in comparison to normogravity controls at 1 g. In addition, SCX also regulates the expression of TNMD, a type II transmembrane glycoprotein found in tendons [54,55]. Although no significant changes in TNMD transcript levels were found in hypergravity-stimulated hTDCs, it is worth to mention that TNMD expression is temporally regulated, lagging behind SCX induction [56]. Thus, other regimens of stimulation (e.g., longer periods or discontinuous exposure) should be further tested to gain deeper insights into the regulation of relevant tenogenic genes by hypergravity.
Strikingly, increasing g-levels led to an upregulation of tendon ECM-associated genes. The expression of main collagens of tendon ECM, namely COL1A1 and COL3A1, as well as the expression of TNC, which encodes a glycoprotein of tendon ECM, and DCN, which encodes a proteoglycan involved in collagen fibrillogenesis in tendon ECM, were evaluated as indicators of matrix synthesis. Although tendon-derived cells have not been the focus of research under altered gravity, results on fibroblast behavior are contradictory. Indeed, reports from Spacelab D2 mission in 1993 showed an increase of collagen synthesis under microgravity conditions and a decrease of collagen synthesis with increasing g, being down to 15% at 10 g [57,58]. Contrarily, hypergravity has been reported to stimulate collagen synthesis by osteoblasts, reaching a significant increase of 42% at 13 g [38]. Herein, no significant differences were detected in COL1A1 transcript levels. Nonetheless, hTDCs cultured for 16 h at 15 and 20 g expressed significantly higher levels of COL3A1. Similarly, DCN transcript levels were significantly increased in the same conditions and TNC was highly expressed in cells at 15 g. Although no significant differences were found for lower g-levels tested (5 and 10 g), transcript levels of the studied tendon ECM-associated genes tended to be higher than in cells cultured at 1 g control condition. Similarly, previous studies applying mechanical loading have shown effects on the expression of tendon-related genes and tenogenic differentiation of TSCs. In particular, murine TSCs isolated from a treadmill running model have shown increased proliferation and upregulation of tenocyte-related genes [59]; subjecting tendons to mechanical loading has been demonstrated to result in an upregulation of COL3A1 and TNC [60]; and different stretching magnitudes could balance between tenogenic differentiation (low mechanical stretching forces, 4%) and the phenotypic drift of TSCs toward adipogenic, chondrogenic, and osteogenic lineages (large stretching, 8%) [61]. Furthermore, mechanomagnetic actuation of hTDCs has also been reported to result in an upregulation of tenogenic genes, including SCX, COL1A1, COL3A1, TNC, and DCN [21].
Although the effect of simulated hypergravity as a mechanical stimulus needs to be further elucidated at the protein level, overall, our results showed that hypergravity might act on hTDCs to increase the expression of tenogenic genes, particularly the ones related to tendon ECM, potentially directing tenogenesis.
This study, being the first to investigate hTDCs under simulated hypergravity, opens new avenues for more fundamental investigations regarding the influence of this mechanical stimulus on their differentiation potential and the mechanisms underlying cellular responses. Therefore, future studies will generate new insights on the prospective use of simulated hypergravity loading as a countermeasure to rescue tendon properties and regenerate tendons upon near-weightlessness exposure (either microgravity or bed-resting).
In summary, hypergravity induced g-level- and time-dependent changes in hTDCs in terms of proliferation, morphology, cytoskeleton organization, and tenogenic gene expression. Therefore, the behavior of hTDCs under hypergravity should be further explored using different regimens (i.e., g-levels, periods of stimulation, and continuous vs. discontinuous exposure), as well as 3D models to modulate cell function as a prospective tool toward enhancing the development of tendon constructs in tissue engineering strategies.
Conclusion
Our results showed for the first time that simulated hypergravity impacts the behavior of hTDCs. The longer exposure period (16 h) limited cell proliferation, independent of the g-level tested. Alterations in cell morphology were observed, which seemed to be dependent on g-level and time of stimulation. Similarly, changes were found in cytoskeleton organization, in particular, the presence and distribution of actin filaments, which were more pronounced in lower g-levels (5 and 10 g) after 16 h. The expression of FAK shifted from the perinuclear region in control (1 g) cells to focal adhesion sites in hypergravity-stimulated hTDCs, and FAK number/cell increased with increasing g-levels. Increasing g-levels resulted in an upregulation of tenogenic markers, including SCX, COL3A1, TNC, and DCN.
Overall, alterations on the behavior of hTDCs under simulated hypergravity were more pronounced in the long-term period (16 h) of stimulation. Nevertheless, both time- and g-level-dependent effects were observed. Altogether, these results suggest that simulated hypergravity might be a useful tool for conditioning hTDCs aiming at tendon tissue engineering strategies.
Footnotes
Acknowledgments
The experiments reported in this study were performed in the framework of the Spin Your Thesis! 2016 program, organized by ESA Education Office. The authors are grateful to the staff of ESA Education Office, Nigel Savage and Lukas Pfeiffer, for the insightful discussion and support, and to Alan Dowson and Elsa Silva for the technical support before and during the campaign.
The authors would like to thank Hospital da Prelada (Porto, Portugal) for providing tendon tissue samples. The authors would like to acknowledge Portuguese funds from FCT-Fundação para a Ciência e Tecnologia in the framework of FCT-POPH-FSE for the PhD grant (SFRH/BD/96593/2013 of R.C-A) and the consolidator grant (IF/00593/2015) of M.E.G. Authors also thank to the project RL3-TECT-NORTE-07-0124-FEDER-000020 cofinanced by ON.2 under the National Strategic Reference Framework (NSRF), through the European Regional Development Fund (ERDF).
Author Disclosure Statement
No competing financial interests exist.