
Abstract
Mesenchymal stromal cells (MSCs) are the most common cell population studied for therapeutic use in veterinary medicine. MSCs obtained from neonatal sources such as umbilical cord tissue (CT-MSCs) or cord blood (CB-MSCs) are appealing due to the non-invasive nature of procurement and the time allowed for characterization of cells before use. However, it remains unclear as to whether CB- or CT-MSCs have equivalent progenitor and non-progenitor functions. CB-MSCs have been shown to have superior chondrogenic potential to MSCs from other sources, whereas their immunomodulatory capacity does not seem to vary significantly. Using equine CB-MSCs and CT-MSCs from the same donors, we hypothesized that MSCs from both sources would have a similar immunophenotype, that CB-MSCs would be more amenable to differentiation, and that they can equally suppress lymphocyte proliferation. We evaluated cells from both sources for “classic” equine MSC markers CD90, CD105, CD29, and CD44, as well as pericyte markers CD146, NG2, and α-SMA. Contrary to our hypothesis, CB-MSCs showed mid- to high expression of pericyte surface markers CD146 and NG2, whereas expression in CT-MSCs was absent. On trilineage differentiation, CB-MSCs were more osteogenic and chondrogenic based on alkaline phosphatase activity and glycosaminoglycan content, respectively. Finally, using a mononuclear cell (MNC) suppression assay, we determined that both CB-MSCs and CT-MSCs are capable of suppressing stimulated MNC proliferation to a similar degree. We have determined that the choice of MSC tissue source should be made with the intended application in mind. This appears to be particularly relevant if pursuing a progenitor-based treatment strategy.
Introduction
Mesenchymal stromal cells (MSCs) are being explored as novel therapeutic agents in human and veterinary medicine for a variety of conditions. MSCs are a heterogenous population of multipotent cells that can be isolated from numerous tissues, such as bone marrow, adipose tissue, dental pulp, umbilical cord, and peripheral blood. These highly proliferative cells have dual progenitor and non-progenitor functions that are of great interest to the regenerative medicine field. They can differentiate into various tissues in vitro, accelerate or improve tissue repair in vivo, and secrete trophic factors that modulate inflammation [1 –3].
The field is increasingly focused on using these cells in an allogeneic manner due to their immediate availability and possible reduced cost of cell production [4]. In fact, 204 out of the current 773 human clinical trials on MSCs are using allogeneic cells as of January 29, 2018 [5], and four out of the five veterinary clinical trials listed in the American Veterinary Medical Association Animal Health Studies database are using allogeneic MSCs [6]. Autologous MSC collection from bone marrow and adipose tissue is invasive and although the MSC progenitor frequency within these tissues is relatively high compared with other MSC sources [7,8], the cells must still be cultured for several weeks to reach therapeutic numbers. In addition, MSCs isolated from older patients or patients with systemic disease may have reduced therapeutic potential [9 –11]. Allogeneic cells can be culture expanded, tested, frozen, and stored long-term before use, making them a potential “off-the-shelf” biological product.
An ideal MSC population for allogeneic use should be collected in a non-invasive manner, be highly proliferative, and maintain self-renewal throughout expansion. MSCs from the umbilical cord have higher proliferative potential than similar cells derived from adult tissues [12,13], and use of these cells eliminates donor age as a compounding factor in MSC function [14]. In addition to their proliferative capacity, umbilical cord-derived MSCs have been classified in some studies to have greater in vitro differentiation potential than MSCs from adult tissues [15 –17]. Umbilical cord-derived MSCs are also capable of immunomodulation and appear to have similar immunosuppressive activity to adipose tissue and bone marrow-derived MSCs [18,19].
Umbilical cord-derived MSCs are subcategorized based on their location within the cord, such as the whole Wharton's jelly (the gelatinous membrane that encases the umbilical arteries and vein), specific regions within the Wharton's jelly such as the amnion and the perivascular zone (collectively called “cord tissue” or “umbilical cord matrix”), as well as the blood. A few studies have been conducted on equine cord tissue-derived MSCs (CT-MSCs) [16,20 –23], and several more have been conducted on equine cord blood-derived MSCs (CB-MSCs) [16,24 –35]. Although the majority of work done on equine CT- and CB-MSCs has been done in vitro to characterize their function, a few noted works have evaluated their in vivo potential. Emrani demonstrated that CT-MSCs improved healing of induced tendon lesions via ultrasound after 3 months in a preliminary study [20]. Using CB-MSCs, Textor et al. found that these cells were effective in cutaneous wound healing [36]. Another report demonstrated that CB-MSC injection significantly reduced immune cell counts in an LPS-induced synovitis model [35]. This is consistent with reports that CB-MSCs are able to suppress lymphocyte proliferation in vitro [28,30].
MSCs are typically identified as plastic-adherent, fibroblast-like cells that are capable of restricted self-renewal, multilineage differentiation, and express a certain panel of surface markers (CD73, CD90, and CD105) [37]. In equine MSCs, reports on surface marker expression vary slightly; whereas the majority observe positive expression for CD29, CD90, and CD44, and the expression of CD105 and CD73 is variable [23,28,31,38 –41]. It has been suggested that human MSCs have a perivascular origin and may exist as pericytes in vitro [42]; however, the expression of pericyte surface markers on MSCs is variable between studies and within MSC populations in other species [43 –47]. Although equine MSCs from adipose tissue and bone marrow have been shown to express the pericyte markers CD146, NG2, and a-SMA [48], their expression has yet to be characterized in umbilical cord-derived equine MSCs. Although more work has been published on equine CB-MSCs, cord tissue is easier to obtain and reportedly has a greater number of progenitor cells compared with cord blood, though CB-MSCs showed better chondrogenic differentiation [16,34,49]. Several papers have indicated that MSCs from different sources have similar immunomodulatory capabilities in vitro [19]. It remains unclear as to whether MSCs from cord tissue and cord blood are equivalent with regards to immunophenotype, proliferation, trilineage differentiation, and immunosuppression capacity.
The success of MSC therapy resides in the ability to produce a stable, highly functional, highly proliferative population of cells that can be obtained non-invasively and ideally banked for future use. We hypothesize that equine CB-MSCs have greater differentiation potential than CT-MSCs from the same donor, but similar phenotypes and immunomodulatory capabilities. This study explores the isolation, proliferation, expression of MSC and pericyte surface markers, trilineage differentiation, and lymphocyte suppression capacity of CB- and CT-MSCs.
Materials and Methods
Ethics statement
The University of Guelph Animal Care Committee specifically approved this study with regards to the procedure of collection of equine peripheral blood mononuclear cells (MNCs) and umbilical cord blood and tissue (animal use protocols 1756 and 1570, respectively). No animals were harmed or sacrificed during the study.
CB-MSC and CT-MSC isolation and expansion
CB-MSC isolation
Umbilical cord blood was obtained from newborn foals as previously described [25]. The nucleated cell (NC) fraction was isolated within 36 h of blood collection by means of red blood cell lysis, as follows: Three parts of 1× RBC lysis buffer (1.5 M NH4Cl, 100 mM KHCO4, 1 mM EDTA, pH 7.3; all from Sigma; Oakville, ON, Canada) were added to 1 part of blood and mixed on a rocker for 10 min. The diluted blood was centrifuged at 400 g for 10 min; then, the cells were washed in 1× phosphate-buffered saline (PBS; Sigma) and centrifuged again. The cells were resuspended in MSC isolation media consisting of DMEM low glucose (DMEM-LG) (Lonza; Walkersville, MD), 10% fetal bovine serum (FBS) (Invitrogen; Burlington, ON, Canada), 100 nM dexamethasone (Sigma), 2 mM
CT-MSC isolation
After blood isolation, the umbilical cord was clamped off approximately 15 cm away from each end and approximately 20 cm of cord was cut and stored in 1X PBS and 1% antibiotic/antimycotic (Sigma) until ready for processing. Cell isolation was performed up to 36 h post-collection by harvesting the adventitia surrounding the umbilical vessels, mincing the tissue, and finally digesting it in DMEM-F12 (Sigma) containing 10 mg/mL collagenase (Type I; Sigma) for 4–6 h on a 37°C shaker. Digested cells were centrifuged at 400 g for 10 min, resuspended in MSC isolation media, and finally plated on culture-treated flasks at 1 × 10⁵ cells/cm2. Cells were incubated at 38°C at 5% CO2. Media were changed every 24 h for 3 days, then 3 days per week thereafter. Putative MSC colonies were observed between 5 and 10 days after initial seeding, on which the adherent cells were dissociated by trypsin-EDTA (Sigma) and replated. These cells were referred to as passage 1 (P1) and were subsequently cultured in MSC expansion media (same as MSC isolation media, with the omission of dexamethasone). Hereafter, cells were grown and split on reaching 80% confluency until passage 10. Flow cytometry and trilineage differentiation experiments were done with MSCs frozen and thawed once, whereas the MNC suppression assay (MSA) was performed with MSCs frozen and thawed twice.
Calculation of population doubling time
Population doubling time
At each passage, CB- and CT-MSCs (n = 3 for each source) were counted by using a Nucleocounter® (Chemometec, Copenhagen, Denmark) and growth rate (gr) was calculated by using the formula gr = ln(N(t)/N(0))/t, where N(t) is the number of cells at time t (in days) and N(0) is the number of cells at time 0. PDT was calculated by using the formula PDT = ln(2)/gr.
Flow cytometry
CB- and CT-MSCs (n = 3 for each source) were expanded to passage 5 (9.15 ± 0.95 population doublings from passage 2) and dissociated by using Accutase (STEMCELL Technologies, Vancouver, BC, Canada). Overall, 400,000 cells per cell line per condition were washed with flow buffer (1× PBS, 5 mM EDTA [Promega, Madison, WI], 1% horse serum [ThermoFisher], 0.1% sodium azide [Sigma]), then stained with the antibodies and isotype controls listed in Table 1. Goat anti-mouse IgG1-FITC (Abcam, Cambridge, MA) and donkey anti-rabbit IgG-FITC (Invitrogen) were used as secondary antibodies; 7-AAD (Sigma) was used as a dead cell stain. Three negative controls were included in the analysis: isotype negative control, secondary antibody alone, and unstained. Samples were run and analyzed on a BD Accuri™ C6 (BD Biosciences, San Jose, CA).
Antibodies Used for Flow Cytometry
Trilineage differentiation
Osteogenesis, adipogenesis, and chondrogenesis were induced in passage 5 (9.15 ± 0.95 population doublings from passage 2) CB- and CT-MSCs (n = 3 for each) as previously described [25] with some modifications.
Six-well (for histological and biochemical analysis of osteogenesis; histological analysis of adipogenesis) and 96-well (for biochemical analysis of adipogenesis) culture plates were seeded at 5,000 cells/cm2 and grown to 80% confluency in MSC expansion medium. At this point, osteogenic and adipogenic induction began by replacing the media in half of the wells with commercial osteogenic differentiation medium (BulletKit; Lonza, Walkersville, MD) or adipogenic medium (DMEM-LG [Lonza], 15% rabbit serum, 500 μM 3-isobutyl-1-methylxanthine, 2 mM
For chondrogenesis, 2.5 × 10⁵ cells/well were seeded into a 96-well low-binding V-bottom microplate (Brandplates®; Thomas Scientific, Swedesboro, NJ) in chondrogenic medium (DMEM-high glucose [Sigma], 1× insulin-transferrin-selenium [BD Biosciences], 10 mg proline [Sigma], 100 nM dexamethasone [Sigma], 100 mM sodium pyruvate [Invitrogen], 200 mM GlutaMAX [Invitrogen], 100 μg/mL ascorbic acid [Sigma], and 10 ng/mL TGFβ3 [R&D Systems; Minneapolis, MN]) and centrifuged at 200 g for 10 min to pellet the cells. Medium was changed thrice weekly, and chondrogenic differentiation was terminated after 21 days. Pellets were then fixed in 10% formalin, embedded in paraffin blocks, and finally sectioned at 5 μm. Toluidine blue O staining (Sigma) was used to confirm chondrogenic induction.
Quantitative assays of trilineage differentiation
Alkaline phosphatase activity
Assay was performed as previously described [25] with the following modification: 1× RIPA buffer [Abcam] with 1× protease inhibitor (Bimake, Cedarlane, Burlington, Ontario, Canada) was used to lyse the cells. Absorbance was read at 405 nm on a microplate reader at 0, 5, 10, 15, and 20 min for both control and induced wells after osteogenic differentiation.
AdipoRed™ assay
Assay was performed as per the manufacturer's instructions (Lonza) for a 96-well plate. Fluorescence was measured with excitation at 485 nm and emission at 572 nm on a microplate reader for both control and induced wells after adipogenic differentiation.
Dimethylmethylene blue assay
Pellets were digested in papain (50 μg/mL; Sigma) for 48 h and then frozen at −20°C until further analysis. Sulfated glycosaminoglycan (sGAG) was quantified by using the dimethylmethylene blue assay as previously described [26,50].
MNC suppression assay
MNC isolation
Equine peripheral blood MNCs were obtained as previously described [30]. Briefly, blood was obtained from the jugular vein of five unrelated adult horses. MNCs were isolated by using a Ficoll-Paque density gradient. Fifteen microliters of Ficoll-Paque Plus (density 1.078 g/mL; STEMCELL Technologies) were added to 50-mL Falcon tubes with 35 mL of whole blood. Gradients were centrifuged at 500 g for 30 min at room temperature with no brake. The MNC-containing fraction was removed, pooled, and washed with 10 mL of PBS. The washed fraction was centrifuged again at 500 g for 10 min. The resulting pellet was resuspended in 10 mL of RPMI 1640 medium (ThermoFisher) supplemented with 100U penicillin-streptomycin (Invitrogen), 2 mM L-glutamine (Sigma), and 10% horse serum (ThermoFisher). A live cell count was performed with an automatic cell counter (NC-100; Chemotech). MNCs were resuspended in cryomedium consisting of RPMI 1640 media, 100 IU penicillin-streptomycin, 2 mM
MNC suppression assay
MNCs from five unrelated donors were mixed in equal ratios and stimulated with the mitogen concanavalin A (Sigma; positive control). Negative control pooled MNCs were not stimulated with mitogen. CB- and CT-MSC cultures (passage 5; 9.15 ± 0.95 population doublings from passage 2) were irradiated (20 Gy) and mixed with stimulated MNCs at a ratio of 1:10 (MSC:MNC) in RPMI 1640 media, and they were then seeded in 48-well plates. Reactions were incubated for 4 days at 38°C in 5% CO2. On day 4 of co-culturing, cells were stained with Bromodeoxyuridine (BrdU) for 18 h and assessed with a BrdU ELISA kit (Roche, Mississauga, ON, Canada) following the manufacturer's protocol.
Statistical analysis
For PDT, triplicate values were averaged for each donor at each passage number, and a two-way ANOVA was performed with Sidak's multiple-comparisons test. For the alkaline phosphatase (ALP) assay, triplicate values were averaged for each donor at each time point per treatment group, and they were analyzed via two-way ANOVA with Tukey's multiple-comparisons test. For the AdipoRed assay, outliers from technical replicates were detected by using Grubb's test and removed; then, they were analyzed via two-way ANOVA. For flow cytometry and the GAG assay, unpaired two-tailed t-tests were performed. For the modified mixed lymphocyte reaction, a one-way ANOVA was performed with Tukey's multiple-comparisons test. The standard deviation of the means is presented in each assay, and significance was assigned at P < 0.05.
Results
MSC isolation and proliferation
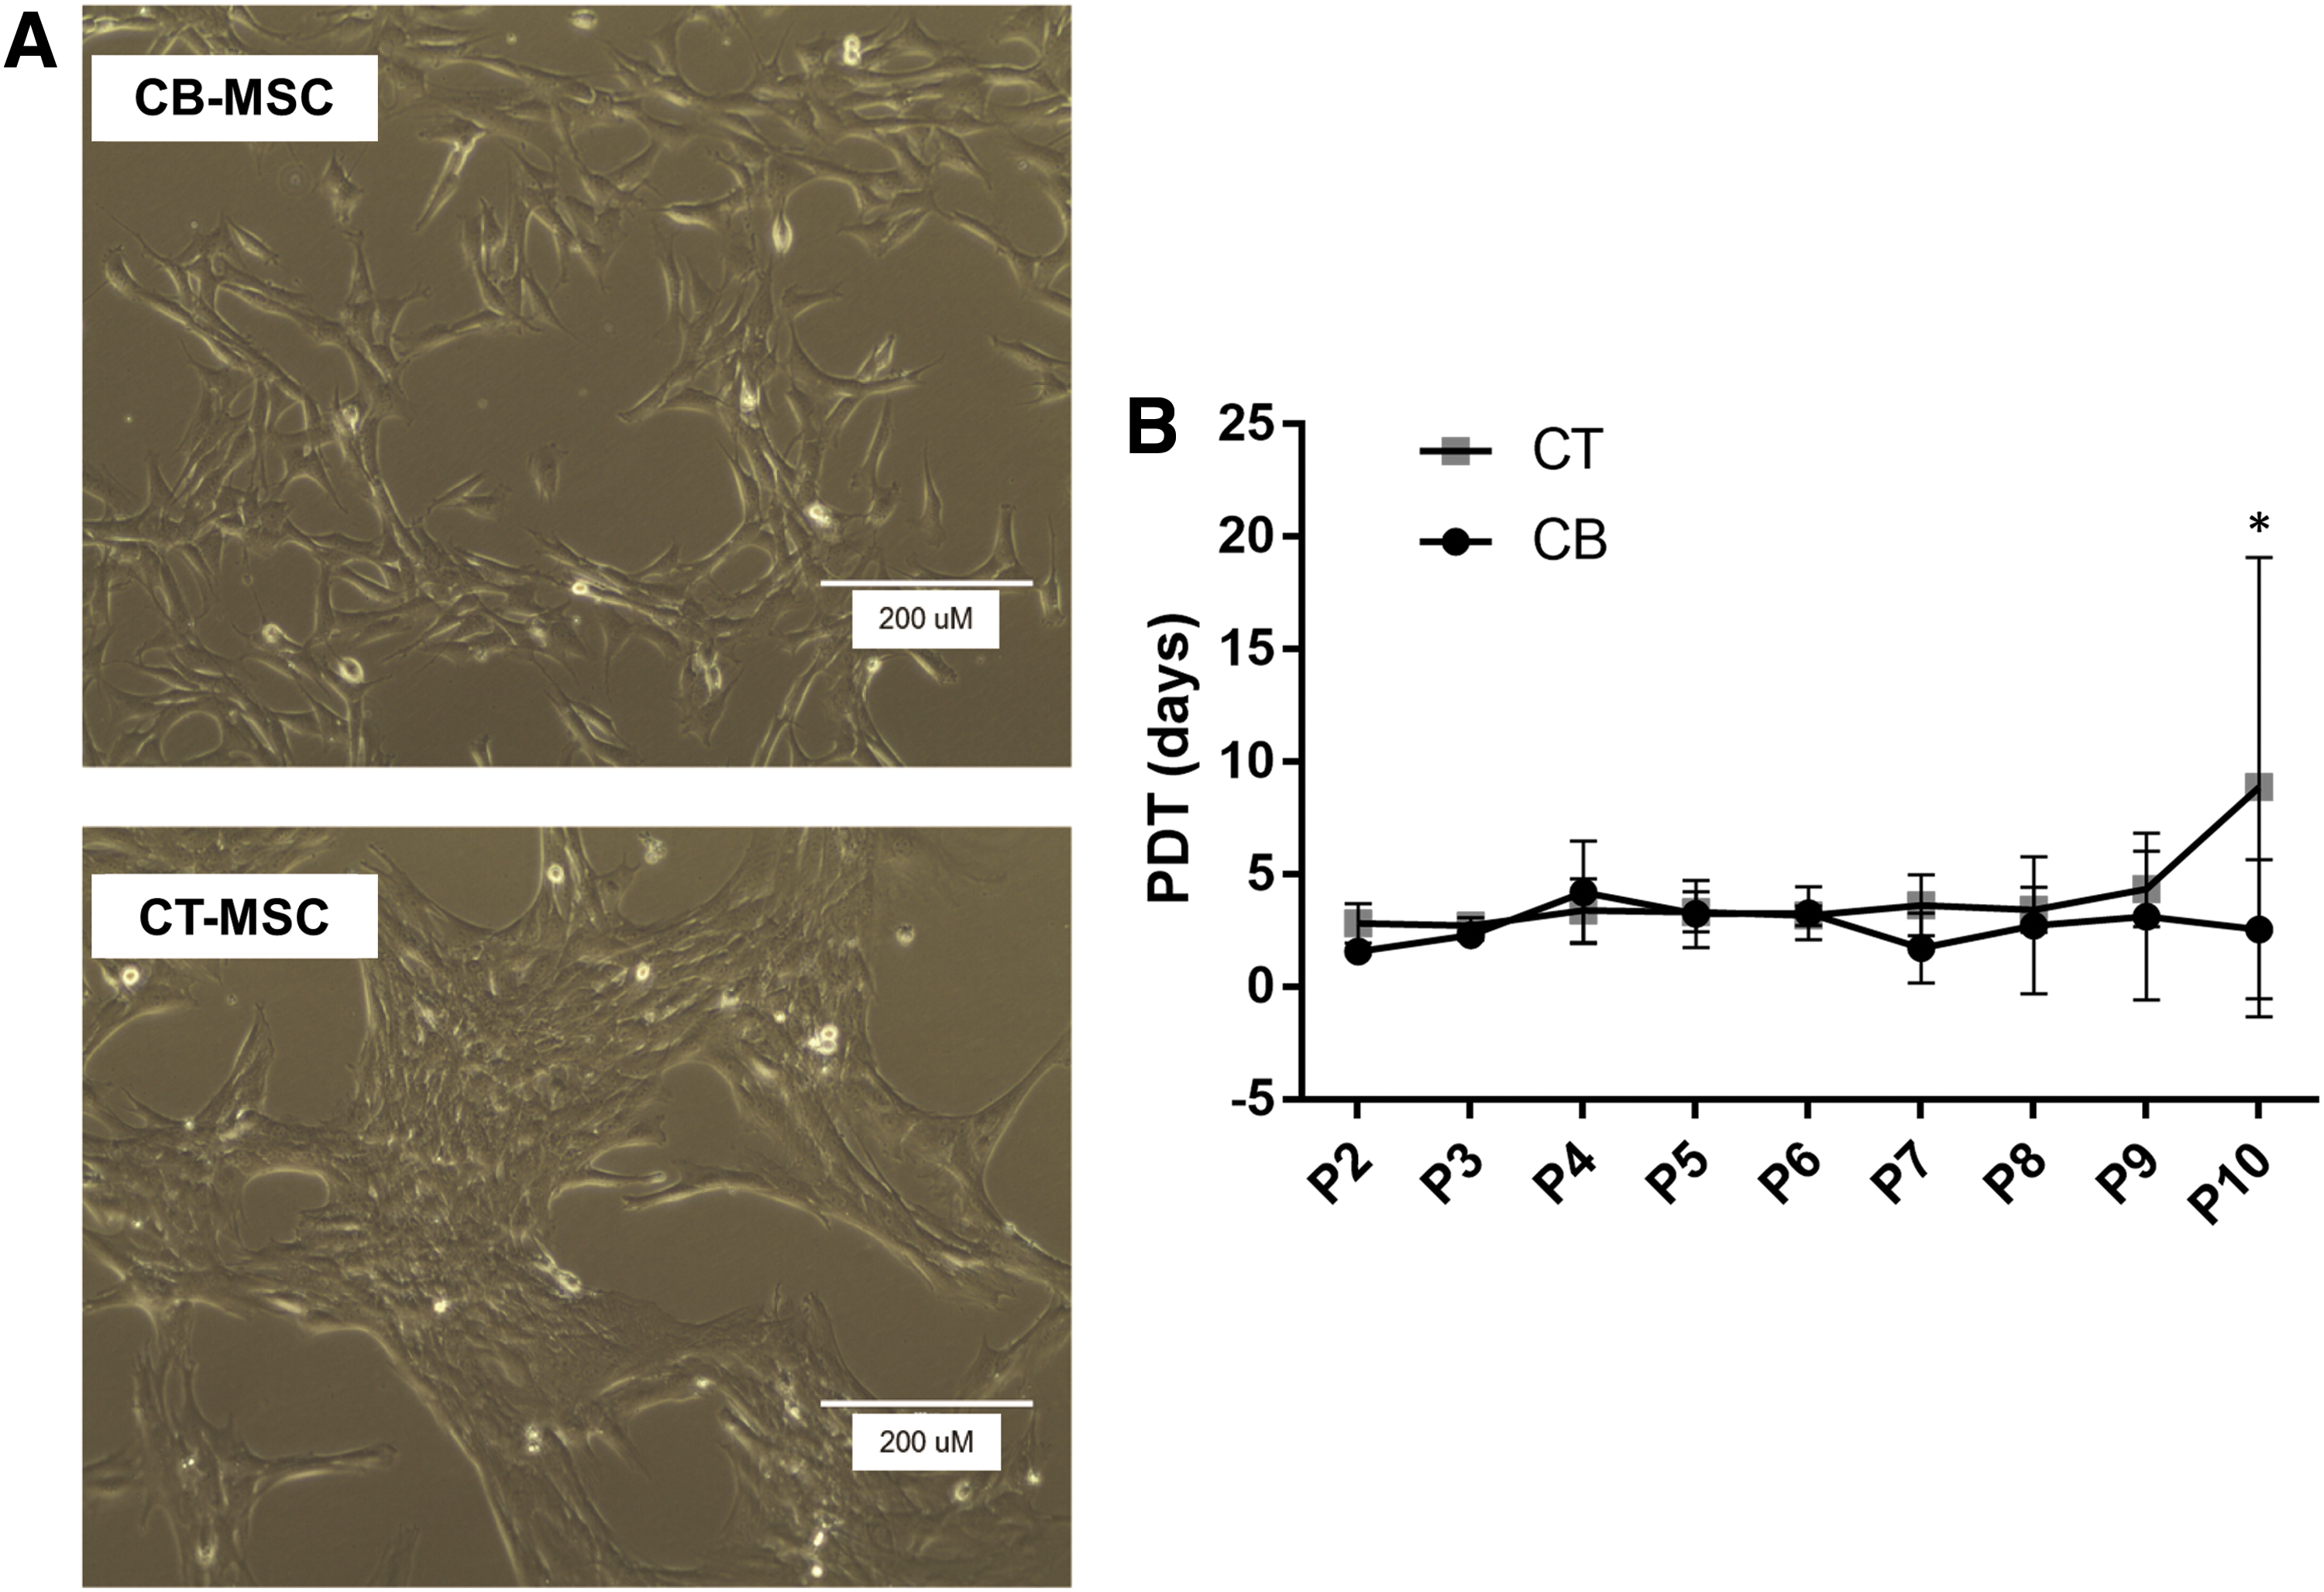
After 5–10 days, adherent, fibroblastic-like cells typical of MSCs were successfully isolated from the umbilical cord blood and cord tissue of three foals. As seen in Table 2, a higher number of NCs were isolated from cord blood, giving rise to a greater total number of putative MSCs (P < 0.0001). However, cord tissue contained a greater number of MSCs per number of MNCs (Table 2, P < 0.005). After 2 passages, a distinct morphology change was observed between CT- and CB-MSCs: CB-MSCs had a more spindle-like, elongated morphology whereas CT-MSCs were shorter and more web-like (Fig. 1A, B). The MSCs were passaged continually until passage 10, and the morphology persisted despite a slight increase in PDT in the CT-MSCs from passage 9 to passage 10 (CT-MSC PDT to passage 10: 8.7 days; CB-MSC PDT to passage 10: 2.6 days; P < 0.02) (Fig. 1).
Cell Yields at Time of Isolation and End of Passage 1 (P1)
Bold values indicate where differences is significant (P < 0.05).
CB, cord blood; CT, cord tissue; NC, nucleated cell; MSC, mesenchymal stromal cell.
Surface marker expression
As expected, both CB- and CT-MSCs expressed typical equine MSC markers CD29, CD44, CD90, MHC-I, and CD105, and they were negative for human MSC marker CD73 and endothelial cell marker CD34 as analyzed by flow cytometry (Fig. 2). We also interrogated CB- and CT-MSCs for the expression of pericyte markers α-SMA, CD146, and NG2. CB-MSCs showed low expression of alpha smooth muscle actin (α-SMA) (1.5–24.3%), moderate expression of NG2 (27.9–64.5%), and high expression of CD146 (89.6–99.4%). Interestingly, CT-MSCs showed no or low expression of these markers (α-SMA: 0.4–0.6%, CD146: 0.0–7.6%, NG2: 1.6–6.5%). NG2 and CD146 expression was higher in CB-MSCs (P < 0.05 and P < 0.0001, respectively). Histrogram plots can be found in Supplementary Fig. S1; Supplementary Data are available online at
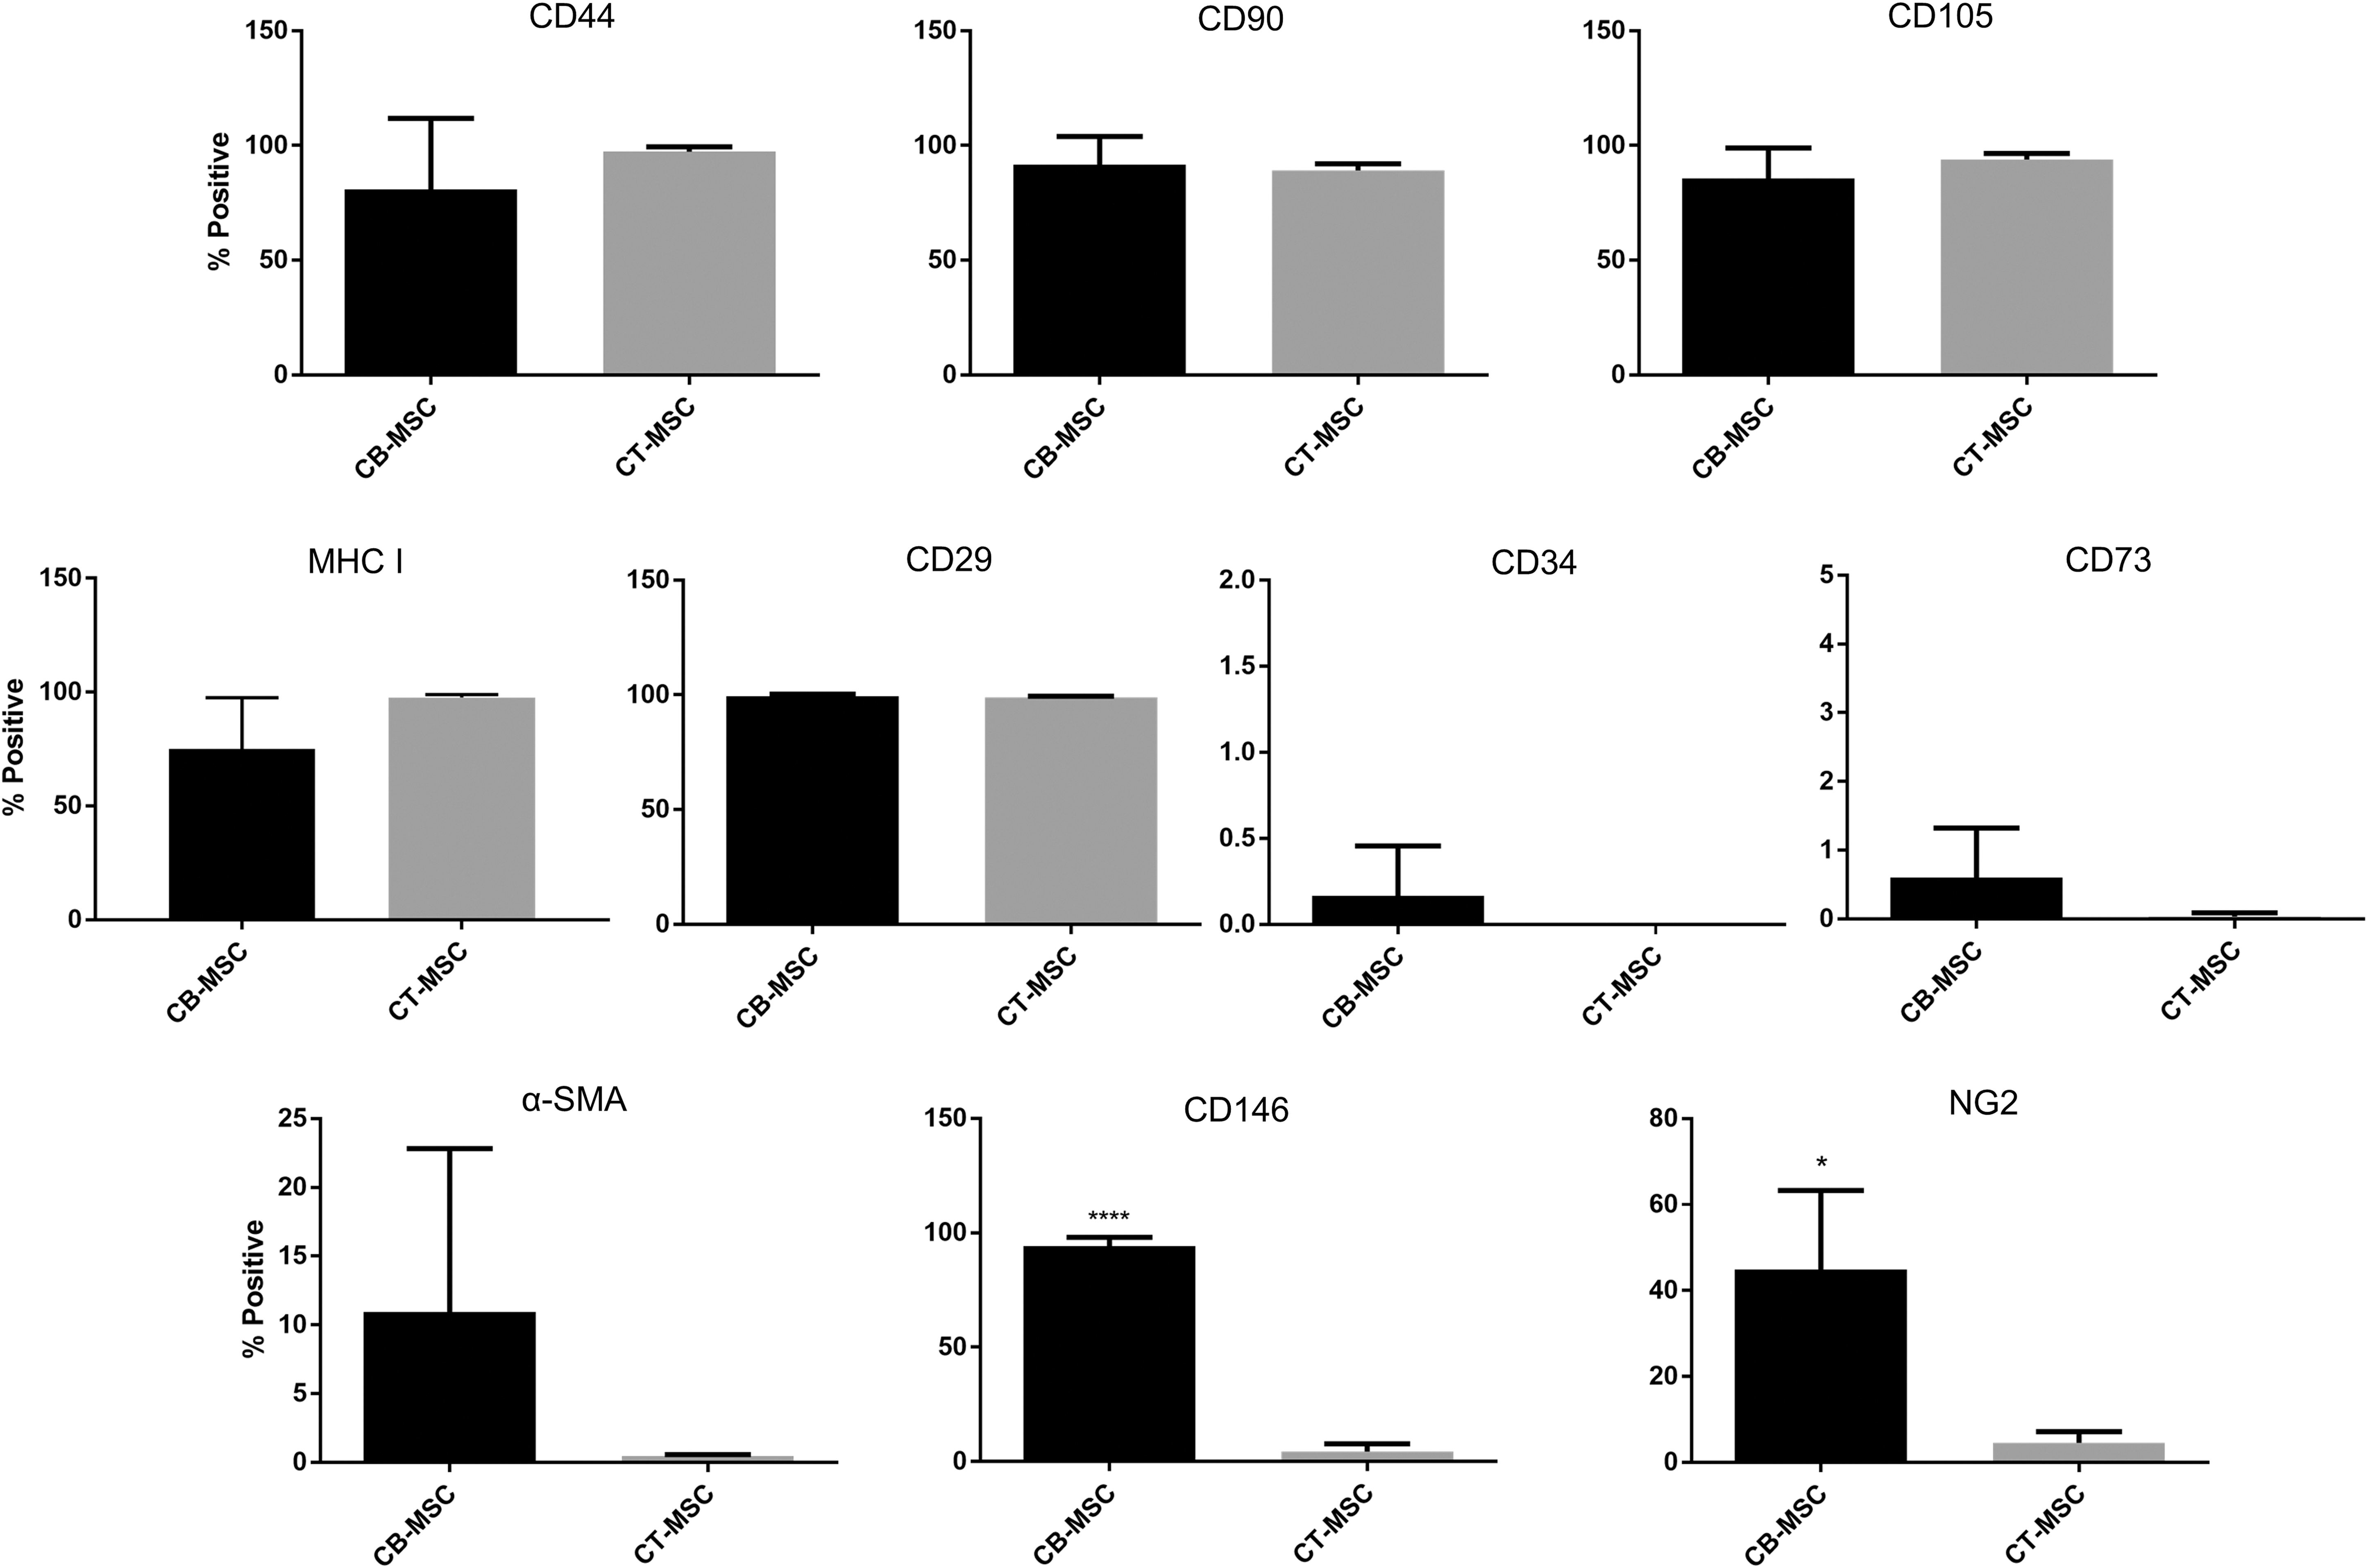
Flow cytometry analysis of CB- and CT-MSCs for expression of MSC, endothelial, and pericyte markers. Percent positive cells are presented as mean ± SD after gating around the isotype control population. *P < 0.05, ****P < 0.0001.
Trilineage differentiation
Both CB- and CT-MSCs showed capacity for trilineage differentiation. Histologically, there appeared to be no difference in staining intensity between CB- and CT-MSCs that underwent osteogenic or adipogenic induction; however, a difference in pellet size and staining intensity was observed during chondrogenic induction (Fig. 3). CB-MSC-derived pellets were larger, more spherical, more opaque, and showed greater presence of lacunae and GAG content as evidenced by toluidine blue staining.
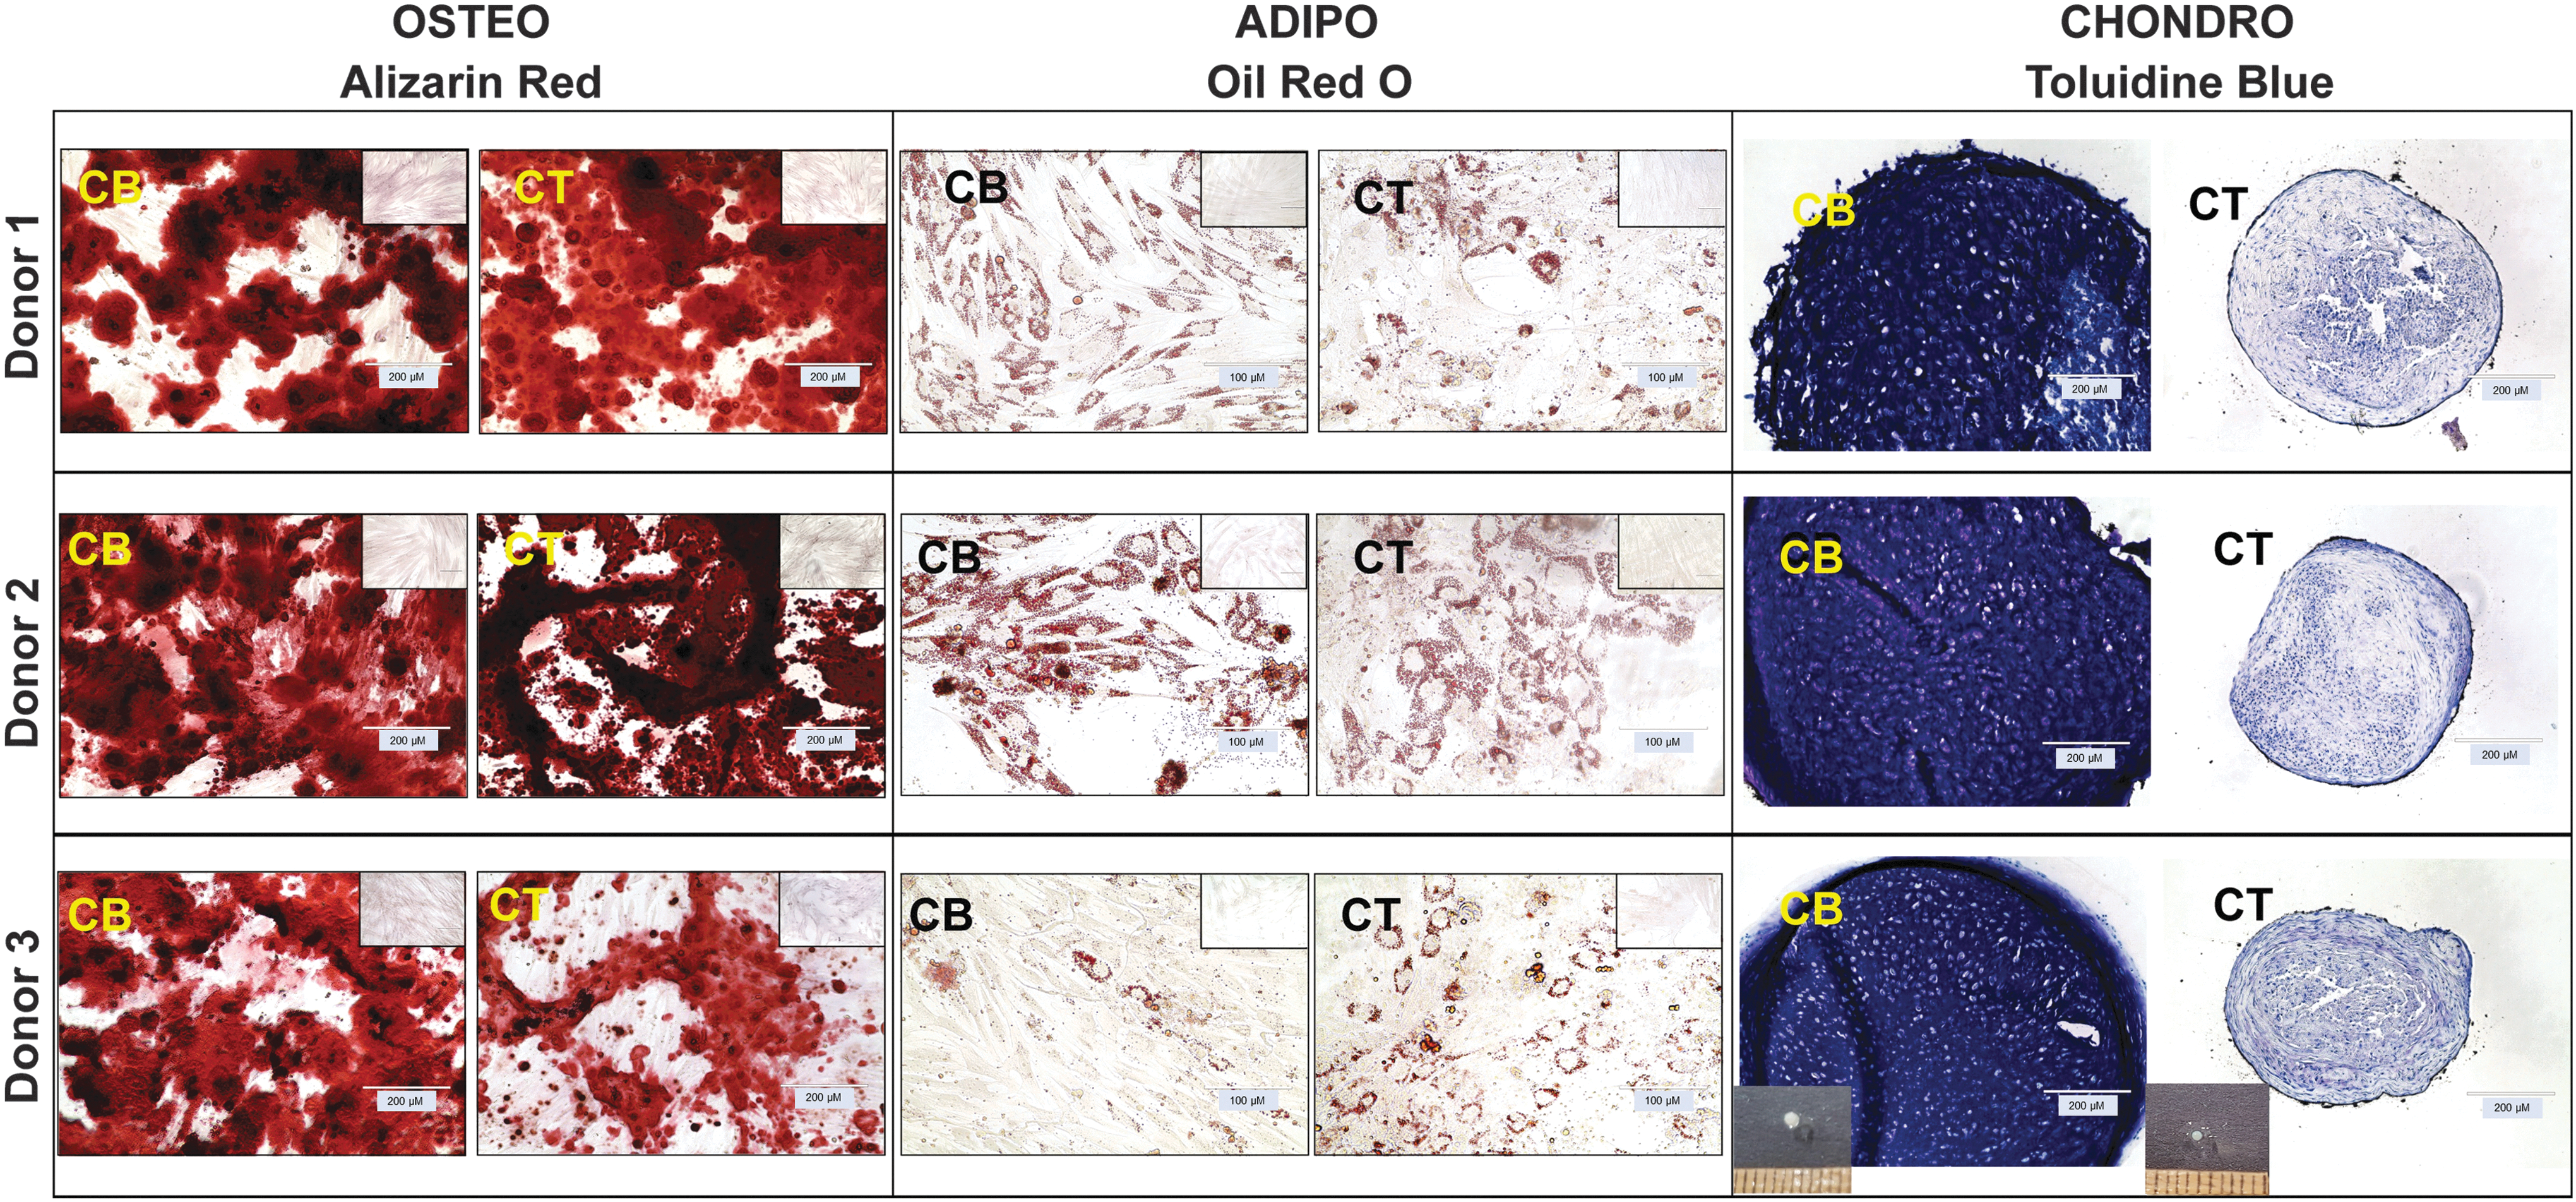
Histological assessment of in vitro osteogenic, adipogenic, and chondrogenic differentiation of CB- and CT-MSCs from three donors. Osteogenesis: CB- and CT-MSCs cultured in osteogenic induction medium for 14 days were stained with Alizarin Red. Adipogenesis: CB- and CT-MSCs cultured in adipogenic induction medium for 14 days were stained with Oil Red O. Chondrogenesis: CB- and CT-MSCs were differentiated in pellet culture in chondrogenic induction medium for 21 days, then sectioned, and stained for toluidine blue. Insets: osteogenesis and adipogenesis: negative controls were cultured for 14 days in MSC expansion medium and then stained with Alizarin Red or Oil Red O, respectively. Chondrogenesis: representative images of chondrogenic pellets at 21 days.
On further quantitative analysis, with regards to chondrogenic potency, CB-MSC chondrogenic pellets produced more GAG than CT-MSCs after 21 days of induction (total GAG and normalized to wet weight; P < 0.05 and P < 0.02, respectively, Fig. 4A, B). CB-MSC and CT-MSC adipogenic induction produced significantly greater lipid droplets compared with non-induced controls as evidenced by the AdipoRed™ assay (P < 0.05); however, there was no difference in adipogenic induction between sources (P = 0.226; Fig. 4C). Osteogenic potency was evaluated by incubation with pNPP (an ALP substrate) for 0 to 20 min. Induced CB-MSC cultures showed a greater reaction product at all time points over the non-induced control (P < 0.01 at 0 min, then P < 0.0001 at 5, 10, 15, and 20 min). Induced CT-MSCs did not differ from the corresponding non-induced control, indicating that induced CB-MSCs had greater ALP activity than induced CT-MSCs (Fig. 4D).
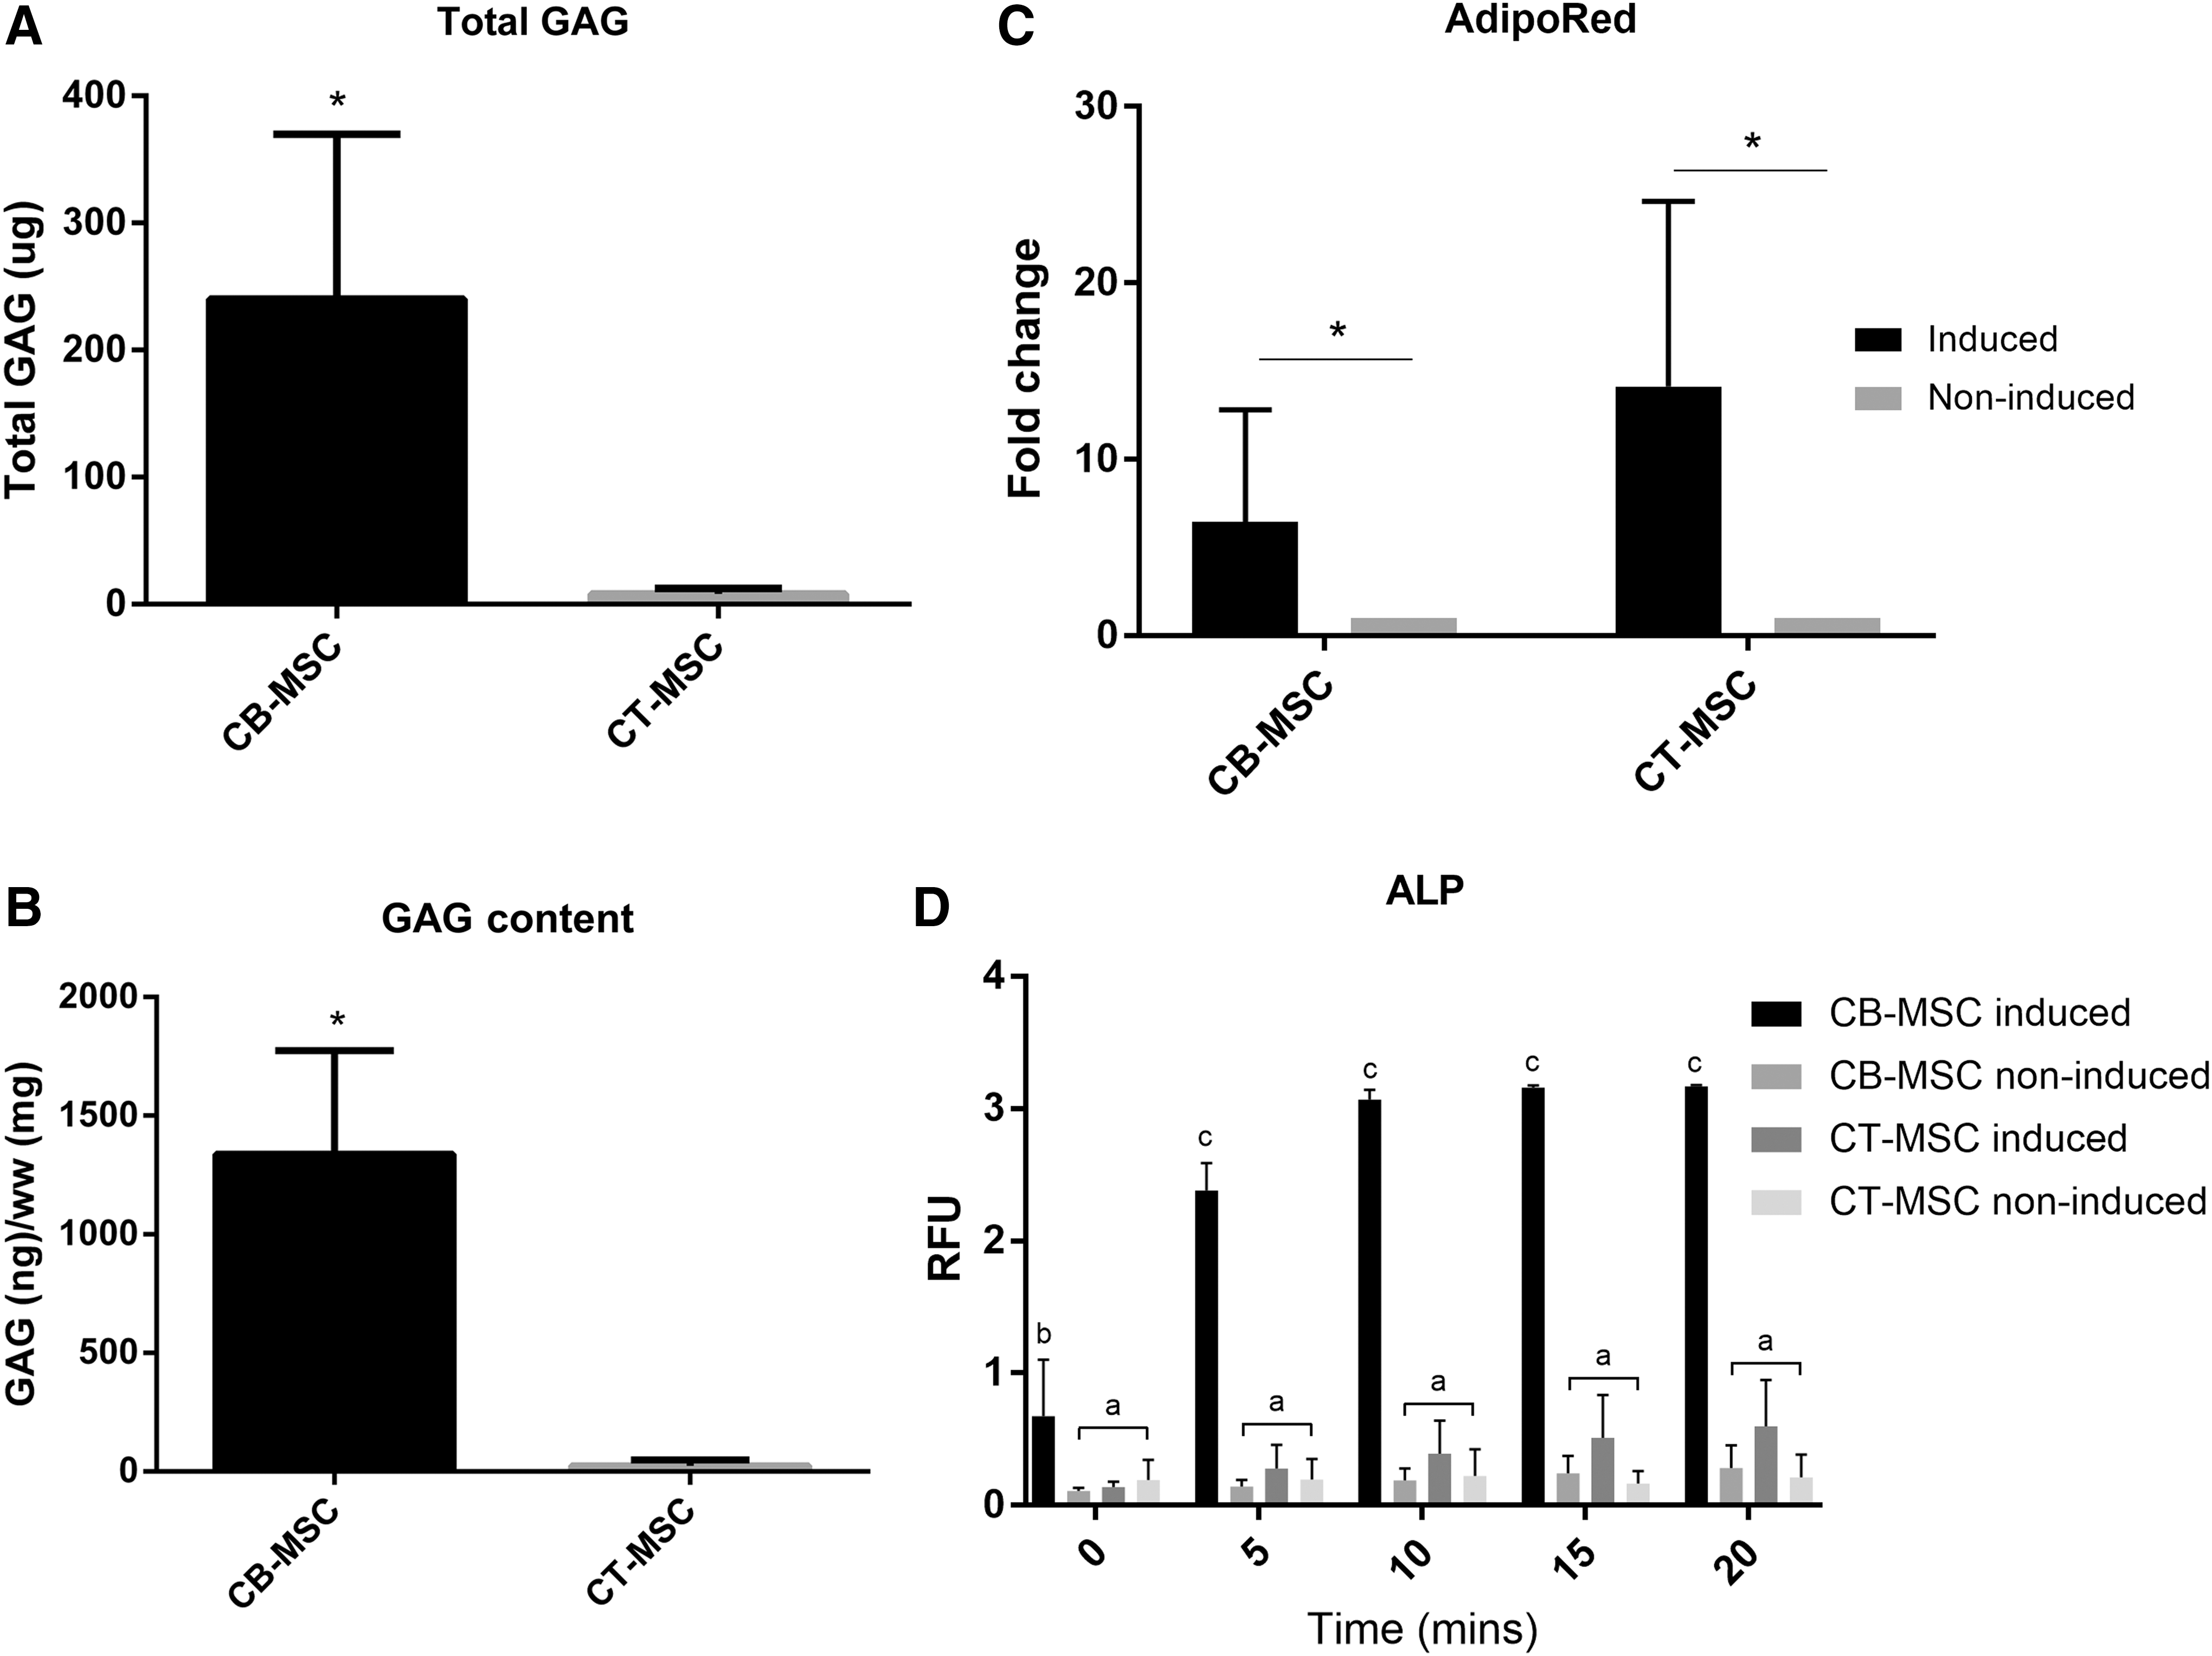
Quantitative analyses of trilineage differentiation capacity of CB- and CT-MSCs.
MNC suppression
To assess whether CT- and CB-MSCs have different immunomodulatory capacities, we evaluated their potential to suppress MNC proliferation in an MSA. Both CT- and CB-MSC cultures were capable of suppressing the proliferation of stimulated lymphocytes to the level of unstimulated lymphocytes (P < 0.0001 compared with stimulated lymphocytes; Fig. 5). No difference was observed between MSC sources.

MNC suppression assay to determine MNC proliferation suppression capacity of CB- and CT-MSCs. Concanavalin A (ConA)-stimulated peripheral blood MNCs were co-cultured with irradiated CB- or CT-MSCs and compared with stimulated MNCs only (positive control) or unstimulated MNCs (baseline proliferation). (n = 3 MSC donors). b P < 0.001 compared with positive control (a). MNC, mononuclear cell.
Discussion
Autologous MSC therapy has been offered as a clinical treatment for veterinary patients for more than 10 years [51]. With promising results from these autologous therapies, attention is shifting to mass-producing and banking MSCs in an effort to streamline and speed up the healing process, without having to wait several weeks for cell expansion. The use of allogeneic MSCs may offer the same advantages as autologous MSC therapy with the added benefit of standardized isolation, expansion, and creation of cell stocks for treatment immediately on diagnosis of an injury. Determining the best source of allogeneic MSCs depends on several factors, from tissue acquisition and ease of MSC isolation to the cells' potential for tissue repair and/or immunomodulation. Although the isolation and propagation of equine CB- and CT-MSCs has been previously characterized, a more in-depth analysis and comparison of their phenotype and progenitor/non-progenitor functions has yet to be performed [24,25,52].
In this study, we assessed cell isolation frequency, proliferation, surface marker expression, as well as the functional potency of CB- and CT-MSCs by using a variety of quantitative measures. Consistent with previous reports [16,53], we discovered that cord tissue contained a greater number of putative MSCs within the NC population derived from the tissue. We observed similar growth rates between CB- and CT-MSCs until passage 10, which is consistent with a previous report on PDT between equine CB- and CT-MSCs [23]. Robust replicative potential is not only considered a hallmark of MSCs but also necessary for the maintenance of multipotentiality [54]. This suggests that the reported greater proliferation potential of neonatal-derived MSCs versus adult-derived MSCs is linked to their greater differentiation potency [12,13,15,55 –57]. This may be due, in part, to the differential expression of genes associated with cell proliferation, cell cycle inhibition, and proteins related to Wnt signaling between adult- and neonatal-derived MSCs [58,59].
We observed that both CB- and CT-MSCs express the previously described “equine” MSC markers such as CD90, CD44, CD29, MHC-I, and CD105, and they were negative for CD73 and endothelial cell marker CD34. CD73 is often not found on equine MSCs [17,28,38,60], though it has been localized to surrounding vessels in adipose tissue in situ [48]. We also performed the first analysis of the expression of pericyte markers NG2, α-SMA, and CD146 on equine cord-derived MSCs. As MSCs are now speculated as being either derived from or very similar to pericyte cells in origin [42,61,62], we wanted to investigate whether pericyte markers were present on cord-derived MSCs, and whether there was a difference in expression between sources.
Interestingly, CB-MSCs were positive for CD146, and they showed mid- to low expression of NG2 and α-SMA; CT-MSCs showed low to no expression of all three markers. These findings are mostly in contrast with results seen on equine adipose tissue- and bone marrow-derived MSCs, where all pericyte markers were highly expressed [48]. This observation indicates that MSCs from different tissue sources do not all share the same phenotype, and may suggest different in situ origins of these various MSCs. Our isolation method of CT-MSCs involves removing the surrounding connective tissue from the umbilical vessels and carefully separating the adventitia from the umbilical arteries and vein. In horses, the adventitia is distinguishable from the media surrounding the vessels, which is not the case in the human umbilical cord [20]. Adventitial cells are distinct from pericytes, which surround endothelial cells of capillaries and microvessels, and adventitial cells typically do not express NG2, α-SMA, and CD146 [63]. Both pericytes and adventitia have been described as sources for MSCs [42,64]. Cultured CB-MSCs appear to be more heterogenous in nature in terms of pericyte marker expression (CD146+, NG2+/−,α-SMA−), where CT-MSCs appear to retain an adventitial cell phenotype (CD146−, NG2−, α-SMA−). It has been shown that α-SMA-positive human MSCs have low self-renewal potential [44]; this may point to why our equine neonatal MSCs are capable of sustained proliferation, and why they are expressed on some adult MSCs [48]. Although it has been shown that cultured bone marrow MSCs are positive for NG2 [65], the expression on cultured cord-derived MSCs is unknown. NG2 is a marker of microvascular pericytes [66]. The mid-level expression seen on our CB-MSCs may reflect a subpopulation of microvascular pericyte-derived cells, whereas CT-MSCs are only adventitial in origin and, thus, do not express NG2.
CD146 has been explored as a marker for multipotency in MSCs. One study found that human bone marrow-derived CD146+ MSC clones had greater potential for trilineage differentiation, whereas CD146− MSC clones were more likely to be unipotent [67]. CD146+ MSCs derived from human umbilical cords (of which only 12–25% of MSCs were positive) were found to be more chondrogenic [46]. It has also been suggested that CD146+ MSCs are more amenable to osteogenesis than CD146− cells [68,69]. This is consistent with our data showing that CB-MSCs, which are CD146+, have a greater capacity for osteogenic and chondrogenic differentiation than CD146− CT-MSCs. This was recently corroborated by another study comparing equine CB- and CT-MSCs; the authors found that CB-MSCs not only had greater osteogenic and chondrogenic potential but also had a higher gene expression of Mcam (which encodes the CD146 surface marker) [49]. Of note, we and others have found large variations in chondrogenic potency among MSC donors [14,70 –72]. As we obtained CB- and CT-MSC cultures from the same donors, cultured them in the same media, and they had a similar number of population doublings at time of trilineage differentiation (Supplementary Fig. S2), this variation in differentiation potential and CD146 expression is most likely due to MSC source. However, as these studies utilized a low number of samples (six individual cell cultures from three donors), we cannot definitively conclude that the significant differences observed between CB- and CT-MSCs are true of any given donor. Thus, it may be prudent to assess this CD146-chondrogenesis correlation further with a greater number of matched samples to see whether it is a determining factor in predicting chondrogenesis.
Although equine CB-MSCs and CT-MSCs appear to differ in phenotype and differentiation potential, we observed that they are capable of suppressing MNC proliferation equally, consistent with a previous report [73]. MSCs have been shown to regulate and/or inhibit T cells, B cells, and natural killer cells, giving them enormous potential for allogeneic use and/or for the treatment of immune-related diseases [74]. CB- and CT-MSCs were capable of suppressing mismatched, stimulated lymphocytes to a similar degree; however, this may be done via different mechanisms. Carrade et al. demonstrated that equine MSCs from solid tissues (adipose tissue, cord tissue) induced apoptosis of lymphocytes, whereas blood-derived MSCs stimulated cell cycle arrest [75]. This study provides a first look at comparing equine MSCs from different umbilical cord sources within the same donor for their in vitro lymphocyte suppression potential. As CB- and CT-MSC samples were frozen and thawed twice before assessing their immunomodulatory potential, these observations are not necessarily representative of a fresh non-frozen MSC product. However, from an allogenic cell manufacturing standpoint, cells are often thawed twice: first from a main cell bank from which vials are thawed and expanded to produce clinical dosages that are subsequently cryopreserved, and second when these cells are thawed and subsequently injected. We have previously shown that both freshly thawed as well as thawed and cultured CB-MSCs have similar lymphocyte suppressive properties [30], indicating their robustness in clinical use. More characterization with a greater number of samples and in vivo experiments are necessary to determine whether either source is functional and/or superior in suppressing adaptive and/or innate immune responses.
In summary, although CB has been shown in this study as well as others to have fewer putative MSCs than CT, their greater potential for osteogenesis and chondrogenesis may make CB a more promising source of MSCs for bone and cartilage tissue engineering. Though specific predictive markers/genes for MSC differentiation potential have yet to be determined, these data suggest CD146 as a possible candidate marker for chondrogenesis of equine MSCs. On the other hand, should immunosuppression be the focus, CT-MSCs may have more potential, as a greater number of low-passage CT-MSCs can be isolated and propagated for cell banking and future use.
Footnotes
Acknowledgments
The authors wish to acknowledge Cristobal Lopez Jimenez and Hamed Alizadeh for their help with cell culture. The Equine Guelph Research Foundation and the National Science Engineering Research Council Discovery Grant Program of Canada generously provided operating funds.
Author Disclosure Statement
Thomas Koch acts in a volunteer capacity as non-executive Director, Scientific Affairs (ex officio) of eQcell Therapies, Inc., Aurora, ON, Canada, a company for which T.K.'s research laboratory provides equine stem cell isolation and storage services. T.K. holds a minor non-controlling share in eQcell Therapies, Inc. The remaining authors declare no competing interests.
References
Supplementary Material
Please find the following supplemental material available below.
For Open Access articles published under a Creative Commons License, all supplemental material carries the same license as the article it is associated with.
For non-Open Access articles published, all supplemental material carries a non-exclusive license, and permission requests for re-use of supplemental material or any part of supplemental material shall be sent directly to the copyright owner as specified in the copyright notice associated with the article.