




Abstract
Human induced pluripotent stem cell-derived cardiomyocytes (hiPSC-CM) hold great promise for regenerative medicine and in vitro screening. Despite displaying key cardiomyocyte phenotypic characteristics, they more closely resemble fetal/neonatal cardiomyocytes, and further characterization is necessary. By combining the use of tandem mass tags to label cell lysates, followed by multiplexing, we have determined the effects of short-term (30 day) in vitro culture on hiPSC-CM protein expression. We found that hiPSC-CM exhibit temporal changes in global protein expression; alterations in protein expression were pronounced during the first 2 weeks following thaw and dominated by reductions in proteins associated with protein synthesis and ubiquitination. Between 2 and 4 weeks, proceeding thaw alterations in protein expression were dominated by metabolic pathways, indicating a potential temporal metabolic shift from glycolysis toward oxidative phosphorylation. Time-dependent changes in proteins associated with cardiomyocyte contraction, excitation–contraction coupling, and metabolism were detected. While some were associated with expected functional outcomes in terms of morphology or electrophysiology, others such as metabolism did not produce the anticipated maturation of hiPSC-CM. In several cases, a predicted outcome was not clear because of the concerted changes in both stimulatory and inhibitory pathways. Nevertheless, clear development of hiPSC-CM over this time period was evident.
Introduction
The use of human pluripotent stem cell-derived cardiomyocytes (hPSC-CM), derived from both embryonic (hESC-CM) and induced pluripotent stem cells (hiPSC-CM), for disease modeling and pharmaceutical screening has dramatically increased in recent years. Due to the limited regenerative capacity of the heart [1] and the scarcity of donor organs, hPSC-CM hold great potential for cardiac regenerative medicine.
A vast body of publications exists dedicated to the phenotypic profiling of hPSC-CM, and researchers now have an understanding of their basic functional characteristics. Their use in in vitro cardiotoxicity screening is progressively increasing, and they are now included in the comprehensive in vitro proarrhythmia assay (CiPA) paradigm for assessing compound arrhythmogenic potential [2]. Moreover, hPSC-CM have recently been successfully transplanted into nonhuman primates [3,4], highlighting their potential for heart repair. However, post-transplantation arrhythmia is currently the major barrier to their use in regenerative medicine and highlights the need for further characterization.
hPSC-CM exhibit key cardiomyocyte phenotypic characteristics including the expression of key ion channels [5], excitation–contraction coupling [6], and the presence of key sarcomeric proteins [7 –9]. However, their phenotype more closely resembles that of fetal cardiomyocytes [10], and transcriptomic analysis has confirmed that hiPSC-CM are developmentally similar to cardiomyocytes of a first trimester fetus [11], which has been confirmed at the protein level in hESC-CM [12,13]. However, as gene expression is not always reflected at the protein level due to variations in post-transcriptional mechanisms including protein stability, RNA processing and transport, and post-translational pathways [14], proteomics may be a better approach for hiPSC-CM characterization.
Recently, discrepancy between transcriptomic and proteomic data in hESC-CM has been reported, demonstrating the importance of a proteomic approach [12]. The use of proteomics in hPSC-CM biology is steadily growing in popularity. Recently, proteomic approaches have been used to investigate cardiac differentiation potential [15 –17], to map the protein changes that occur during the cardiac differentiation process [18], and to assess the level of maturity [19]. To date, these studies have concentrated on “home-made” hiPSC-CM differentiated in the author's laboratory. However, with the increasing use of hiPSC-CM for cardiotoxicity screening, there is a need for a greater understanding of the phenotype of the cells routinely used in these studies, and the proteome of these commercially available hiPSC-CM is yet to be characterized.
Evidence exists for temporal alterations in hiPSC-CM phenotype in vitro [8,19 –22]. Time in culture has been demonstrated to alter beta-adrenergic receptor expression and function [20 –22], contractility [8], together with calcium handling and action potential morphology [8,20]. Progressive sarcomeric rearrangements, increases in cell size, and multinucleation have also been reported [8,9]. Despite this, there is still no consensus as to the best time to use the cells for in vitro studies or transplantation.
hiPSC-CM are typically used 20–30 days after the commencement of cardiac differentiation, but age can vary from as early as 16 days to in excess of 100 days. Recently, it has been shown that drug responsiveness can be dependent on the maturation state of hiPSC-CM monolayers [23], which is of significant interest in the context of compound screening. hPSC-CM maturation is currently a topic that has generated a vast body of research, and approaches include addition of molecules with a known role in cardiomyocyte maturation [24,25], manipulation of culture substrate stiffness [26,27] and isotropy [28], three-dimensional culture [29], and electrical stimulation [19]. However, despite advancements being made in this field, researchers have not yet successfully completely recapitulated the adult cardiomyocyte phenotype in these cells.
Here, we performed proteomic analysis of commercially available hiPSC-CM post-thaw in cells aged 32–60 days to determine the effects of short-term in vitro culture on protein expression and investigated whether these proteomic changes were reflected functionally. We aimed to investigate temporal differences in protein expression of hiPSC-CM in vitro using a mass spectrometric approach, which is a powerful tool for large-scale protein identification and relative quantitation. Combining the use of tandem mass tags (TMT) to label cell lysates followed by multiplexing allows biological replicates, individual cell batches, and cell culture time points to be compared quantitatively at the protein level [30]. We performed TMT labeling proteomic analysis of hiPSC-CM post-thaw to determine the effects of short-term culture on protein expression and investigated whether these proteomic changes are reflected functionally.
Materials and Methods
Cell culture
hiPSC-CM (iCell Cardiomyocytes; Cellular Dynamics International; as described and characterized [5]) were thawed and cultured as per the manufacturer's instructions. Cells were frozen at day 30 after the commencement of differentiation. For optical assays and beating rate experiments, cells were seeded at 4.3 × 10⁴ viable cells/cm2 in 0.1% gelatin-coated glass bottom dishes (MatTek) to form a synchronous syncytium and maintained in culture for up to 30 days post-thaw (60 days after the start of differentiation). For proteomic analysis, cells were seeded at 3.6 × 10⁴/cm2 and at 1 × 10⁵/cm2 for mitochondrial bioenergetic analysis. Experiments were performed on three independent cell batches.
Preparation of whole-cell protein lysates
Cells were washed three times with phosphate-buffered saline before being lysed in a 0.5% SDS (sodium dodecyl sulfate) in 200 mM triethylammonium bicarbonate (TEAB) solution (pH 8.0). Samples were vortexed three times (1 min each), placing the tubes on ice between vortexes. Samples were then centrifuged at 15,000 g at 4°C for 30 min to remove cell debris. Lysates were stored at −80°C until use. Protein concentration was measured using a BCA assay (Cat No. 23227; Thermo Fisher), according to the manufacturer's instructions.
Proteomic analysis
The detailed workflow for sample preparation and quantitative proteomic experimental design is described in Supplementary Fig. S1. TMT labeling procedure was performed as per the manufacturer's recommendation (Cat No. 90066; Thermo Fisher). In brief, two sets of TMTsixplex labeling kits were used to label 12 samples (ie, C48H × 6 with three batches, C2W × 3, and C1M × 3). Equal amounts of protein lysate from each sample were reduced with tris(2-carboxyethyl)phosphine and alkylated with iodoacetic acid before an overnight acetone precipitation. Protein pellets were digested overnight at 37°C in 200 mM TEAB solution containing 2.5 μg trypsin (Promega), and resulting peptides from each sample were labeled with different isobaric tags (TMTs 126–131), allowing sixplexing scheduled for four TMT comparative studies (batch to batch, C48H vs. C2W, C48H vs. C1M, and C2W vs. C1M). For each study, labeled peptide mixture was injected onto an XBridge C18 column (5 μm, 4.6 mm inner diameter, and 25 cm long; Waters), for the first dimension high pH reversed-phase high performance liquid chromatography (RP-HPLC) separation (as previously described [31]) under a linear gradient consisting of mobile phase A (10 mM ammonium formate, pH 10.0) and up to 70% B (90% acetonitrile in mobile phase A) for 2 h at flow rate of 0.5 mL/min, using a Jasco system consisting an autosampler, semi-micro HPLC pumps, and ultraviolet detector. Eluted fractions were collected and concatenated (according to Wang et al. [32]) into 18 tubes and vacuum dried.
Nano-LC and tandem mass spectrometry (MS/MS) was performed using a U3000 direct nano system coupled with nano-electrospray and LTQ-Orbitrap Discovery mass spectrometer (Thermo). The HPLC fractions containing the mixture of sixplex labeled peptides were resuspended in 0.1% formic acid, and each was separated on a PepMap C18 reversed-phase nano column (3 μm, 100 Ǻ, 50 cm length; Thermo) under a column flow rate of 0.3 μL/min using linear gradient of 5%–25% for 180 min, 25%–32% for 20 min, and 32%–90% for 10 min of 95% acetonitrile and 0.1% formic acid. MS scan and MS/MS fragmentation were carried out in Orbitrap and LTQ, respectively, using two cycles of top three data-dependent acquisitions with dynamic exclusion mode enabled and total cycle time at ∼30 ms. The first cycle used collision-induced dissociation (CID) fragmentation generating spectra for peptide sequencing, and the second high-energy CID (HCD) generating spectra for both peptide sequencing and relative quantitation via report ions, that is, the tags.
Proteomic data analysis
Mass spectra processing, database searching, and quantitation were carried out using Thermo Proteome Discoverer 1.4 with built-in Sequest against UniProt human FASTA database, release 2014.04.10 (
Beating rate assessment
Beating rates were determined using a Nikon Eclipse TE2000E bright-field microscope with Digital sight camera and NIS Elements3.2 software. Beating rates were calculated using the time series graph tool in NIS Elements3.2 software. Cells were seeded as a synchronously beating monolayer and imaged for 30 s at 15 fps; after acquisition, a small region of interest (0.5–1 mm in diameter) was placed over a section of a cell with two distinct regions of contrast (eg, light and dark) that had visible intensity changes with each contraction. The intensity changes were plotted against time, and the numbers of intensity peaks were quantified to give a measure of contraction frequency.
Optical analysis of calcium transient and action potential morphology
Calcium transient morphology was investigated using the calcium-sensitive fluorescent dye Fluo-4 (4 μg/mL; Invitrogen). Cells were loaded in Dulbecco's modified Eagle's medium (DMEM) at 37°C, 5% CO2 for 20 min. Cells were then perfused with 37°C Tyrode's solution (140 mM NaCl, 6 mM KCl, 1 mM MgCl2, 5 mM HEPES, 2 mM CaCl2, 10 mM glucose) for 20 min to allow de-esterification of Fluo-4 and cell acclimatization. Cells were imaged with a Nikon Eclipse T62000 using a 40 × Nikon Fluo oil objective, 470 nm LED light source, and a 545 nm XF104 Omega dichroic with emission from LP545 nm. Action potential morphology was assessed using the voltage-sensitive fluorescent dye di-8-ANEPPS (Invitrogen), as previously described [33]. Briefly, hiPSC-CM were loaded with 5 μM di-8-ANEPPS in DMEM at 37°C for 20 min. 5 μM of blebbistatin was added 10 min before recording to inhibit excitation–contraction coupling and to prevent signal distortion due to motion artifact. Di-8-ANEPPS was excited using a 535-nm LED and emitted fluorescence collected through a 590-nm long-pass filter. Cells were electrically field stimulated at 1 Hz with a 20 ± 10 V stimulus of 5 ms duration. Images (128 × 128 pixels; pixel size 4.35 μm2) were recorded using a NeuroCMOS (Redshirt) camera using a × 40 oil-immersion objective at 0.5 kHz (calcium) or 1 kHz (action potential) for 5–10 s. Image sequences were analyzed using Optiq software (developed by F. Burton, University of Glasgow).
Mitochondrial bioenergetic measurements
Cellular respiration [oxygen consumption rate (OCR) and extracellular acidification rate (ECAR)] were assessed using an XFp extracellular flux analyzer (Seahorse Bioscience). Cells were incubated for 1 h in DMEM supplemented with glutamine, sodium pyruvate, and glucose in a non-CO2 incubator at 37°C before experiment. The XF Cell Mito Stress Test (Seahorse Bioscience) was used to measure the key parameters of mitochondrial respiration, using specific mitochondrial inhibitors and uncouplers. Oligomycin (1 μM), carbonilcyanide p-triflouromethoxyphenylhydrazone (FCCP) (0.5 μM), and a mixture of rotenone/antimycin A (both 1 μM) were injected sequentially according to the manufacturer's instructions. Before drug addition, basal OCR was measured. Oligomycin was injected to inhibit ATP synthase (complex V) and OCR was recorded. To determine the maximal respiration, the uncoupler FCCP was injected. Finally, a mixture of rotenone/antimycin A was injected to inhibit the flux of electrons through complexes I and III and to enable the calculation of spare respiratory capacity. All measurements were normalized to total protein concentration using the Pierce BCA Protein Assay Kit (Thermo Fisher Scientific).
Immunocytochemistry
Cells were fixed with 4% paraformaldehyde and permeabilized with 0.2% Triton X-100 before blocking with 4% fetal bovine serum. Cells were labeled with rabbit polyclonal anti-cardiac troponin T (1:300, ab45932; Abcam) and mouse monoclonal anti-sarcomeric α-actinin (A7811; 1:200). Primary antibodies were detected with Alexa 488- or Alexa 546-conjugated secondary antibodies (1:400; Invitrogen), and Hoechst 33342 was used for visualization of cell nuclei (0.5 μg/mL; Invitrogen).
Experimental design and statistical rational
All reagents were purchased from Sigma–Aldrich, unless otherwise stated. hiPSC-CM (CDI) were thawed and cultured in plating and maintenance media, respectively, as supplied. Data were plotted in GraphPad Prism Version 5.0 and expressed as mean ± standard error of the mean. n Values represent independent experiments. Comparisons between multiple conditions were analyzed using one-way analysis of variance with Bonferroni multiple comparison post hoc test, unless otherwise indicated. Student's t-test was used to assess differences between pairs of data. n Represents independent experiments, with three technical replicates per experiment. Differences at the level of P < 0.05 were considered statistically significant, and significance values are shown in the figure legends. The following labeling key was used: *P < 0.05, **P < 0.01, ***P < 0.001.
Results
hiPSC-CM exhibit temporal changes in global protein expression in vitro
We started by investigating the biological variation in hiPSC-CM in terms of their global protein expression and randomly selected three independent cell batches (2 × technical replicates per batch; see Supplementary Fig. S1 for workflow). Comparison of global protein expression revealed a nonsignificant 4.7% ± 2.7% variation in global protein expression between batches (n = 3; P > 0.05) (Fig. 1ai–iii). Proteins were considered expressed when they were identified and quantified in all three cell batches (six samples). A total of 1,972 proteins were identified (Supplementary Table S1). To investigate temporal changes in protein expression, we lysed cells 48 h, 2 weeks, and 4 weeks after plating. These time points correspond to cells at 32, 44, and 60 days postinitiation of cardiac differentiation, respectively. There were 1,763 proteins that were identified and quantified throughout the three TMTSixplex comparative experiments (Fig. 1b and Supplementary Table S1). Over the time course, there were 1,138 proteins that were consistently expressed throughout, with other unique proteins expressed during each of the three time periods (Fig. 1b). To identify temporal changes in protein expression during in vitro culture of hiPSC-CM, a fold change threshold of 1.2 was applied with a significance value of P < 0.05. Over the 30-day time course, there was a 16% change in protein expression, with the majority of changes occurring during the first 2 weeks of culture (Fig. 1ci–iii, di–iii); 971 proteins demonstrated modified expression with 480 of these being unique to this time point (Fig. 1e). The alteration in protein expression between 2 and 4 weeks postplating was subtler, with 297 proteins altered (109 proteins unique to the 4-week time point) (Fig. 1e).

Comparison of temporal differences in global protein expression in hiPSC-CM in vitro.
Canonical pathway analysis identified 23 pathways that were significantly altered between 48 h and 2 weeks in culture. The top five canonical pathways altered during this period revealed a net reduction in protein synthesis. Pathways associated with translation (tRNA charging, regulation of eIF4 and p70S6K signaling, and EIF2 signaling) were significantly downregulated, accompanied by increase in expression of proteins associated with the valine degradation pathway (Table 1ai). In addition, a net decrease in proteins associated with the protein ubiquitin pathway was also observed. Top pathways associated with molecular and cellular functions were related to cell death and survival, growth and proliferation, cell development and organization, and protein synthesis (Supplementary Table S2Ai). Principle pathways associated with physiological system development and functions were related to organismal survival, cardiovascular system development/function, and embryonic development (Supplementary Table S2Aii).
Temporal Comparison of Canonical Pathways in Human Induced Pluripotent Stem Cells-Derived Cardiomyocytes
Identification of the proteins with the greatest increase in expression revealed the calcium binding protein, calsequestrin 2, as the protein with the highest level of upregulation (6.14-fold) (Supplementary Table S2Bi). Other proteins in this list included proteins associated with myofibrillar myogenesis and the formation of cell–cell connections (nebulin-related anchoring protein) and cardiac muscle contraction (myosin light chain 2) (Supplementary Table S2Bi). Proteins associated with metabolite transport (glucose transport protein type 1 and monocarboxylate transporter 4) and glycolysis (aldolase A) also featured in this list (Supplementary Table S2Bi). Of the top 10 downregulated proteins, 4 are associated with the initiation and control of apoptosis (Supplementary Table S2Bii). Upstream regulator analysis revealed molecules with roles in the control of metabolism (INSR, PPARGC1A, miR-122) and those with roles in cell survival, proliferation, and cell–cell adhesion (miR-30C-5p, miR-21, SRF, MAX) (Table 1aii).
Canonical pathway analysis of proteins expressed between 2 and 4 weeks in vitro revealed a net increase in oxidative phosphorylation and decrease in glycolysis pathways, indicating a potential temporal shift in metabolic function (Table 1bi). A net decrease in proteins associated with apoptosis (Granzyme A signaling) and protein translation were also evident (Table 1bi). Protein kinase A signaling was also altered (Table 1bi) along with downregulation of histones, proteins involved in oxidative stress responses, and AKAP12. The top pathways associated with molecular and cellular functions were related to cellular development, movement, growth, survival and proliferation, as well as carbohydrate metabolism (Supplementary Table S3Ai). Investigation of pathways associated with physiological system development and function revealed skeletal and muscular system development and function and embryonic, organ, organismal, and tissue development as the top pathways affected (Supplementary Table S3Aii).
Interestingly, calsequestrin 2 was the protein with the largest increase in expression (3.64-fold) at this time point (Supplementary Table S3Bi). Other highly upregulated proteins were associated with fatty acid uptake and translation of proteins associated with oxidative phosphorylation, along with those associated with heart development, sarcomeric organization, and contraction (Supplementary Table S3Bi). The top 10 list of downregulated proteins consisted of proteins with roles in glycolysis, lipid and glucose uptake, and protein degradation (Supplementary Table S3Bii). Upstream regulator analysis demonstrated key roles for molecules associated with cardiac development, remodeling, and hypertrophy (MEF2C, TBX5, GATA4, PTEN, miR-133) along with metabolism (esrra, miR-122, PPARGC1A) and cell division (RB1) (Table 1bii).
hiPSC-CM exhibit temporal changes in contractile protein expression
We then investigated whether these temporal proteomic changes are reflected functionally and started by identifying significantly altered cardiac-specific pathways (Supplementary Fig. S2). Alterations in canonical pathways between 48 h and 2 weeks were predominantly associated with cardiac muscle contractility, muscle formation, and heart development. Between 2 and 4 weeks, these pathways were still significantly altered, but to a lesser extent. Pathways associated with ventricle contraction were significantly altered between 2 and 4 weeks, but not between 48 h and 2 weeks post-thaw (Supplementary Fig. S2).
Detailed analysis of the contractile proteins revealed differences in tropomyosin-associated protein expressions between 48 h and 2 weeks post-thaw. Tropomyosin 1 alpha (−1.7-fold) protein expression decreased, whereas tropomyosin 3 alpha 3 chain (1.5-fold), tropomyosin alpha 1 chain (1.3-fold), and tropomyosin beta chain (1.4-fold) increased (Fig. 2). Increases in both atrial (1.6-fold) and ventricular (2.7-fold) isoforms of myosin regulatory light chain 2 were present between 48 h and 2 weeks, which was mirrored between 2 and 4 weeks post-thaw, but to a lesser extent (Fig. 2ai). Between 48 h and 2 weeks postplating, expression of proteins associated with actin disassembly [cofilins 1 (−1.8-fold) and 2 (−1.5-fold)] was decreased along with palladin (−1.4-fold), which is associated with cytoskeletal organization and contraction during development [34] (Fig. 2a). The force transmitting protein, titin, was increased (1.7-fold) during the 2 weeks post-thaw and then stabilized between 2 and 4 weeks.
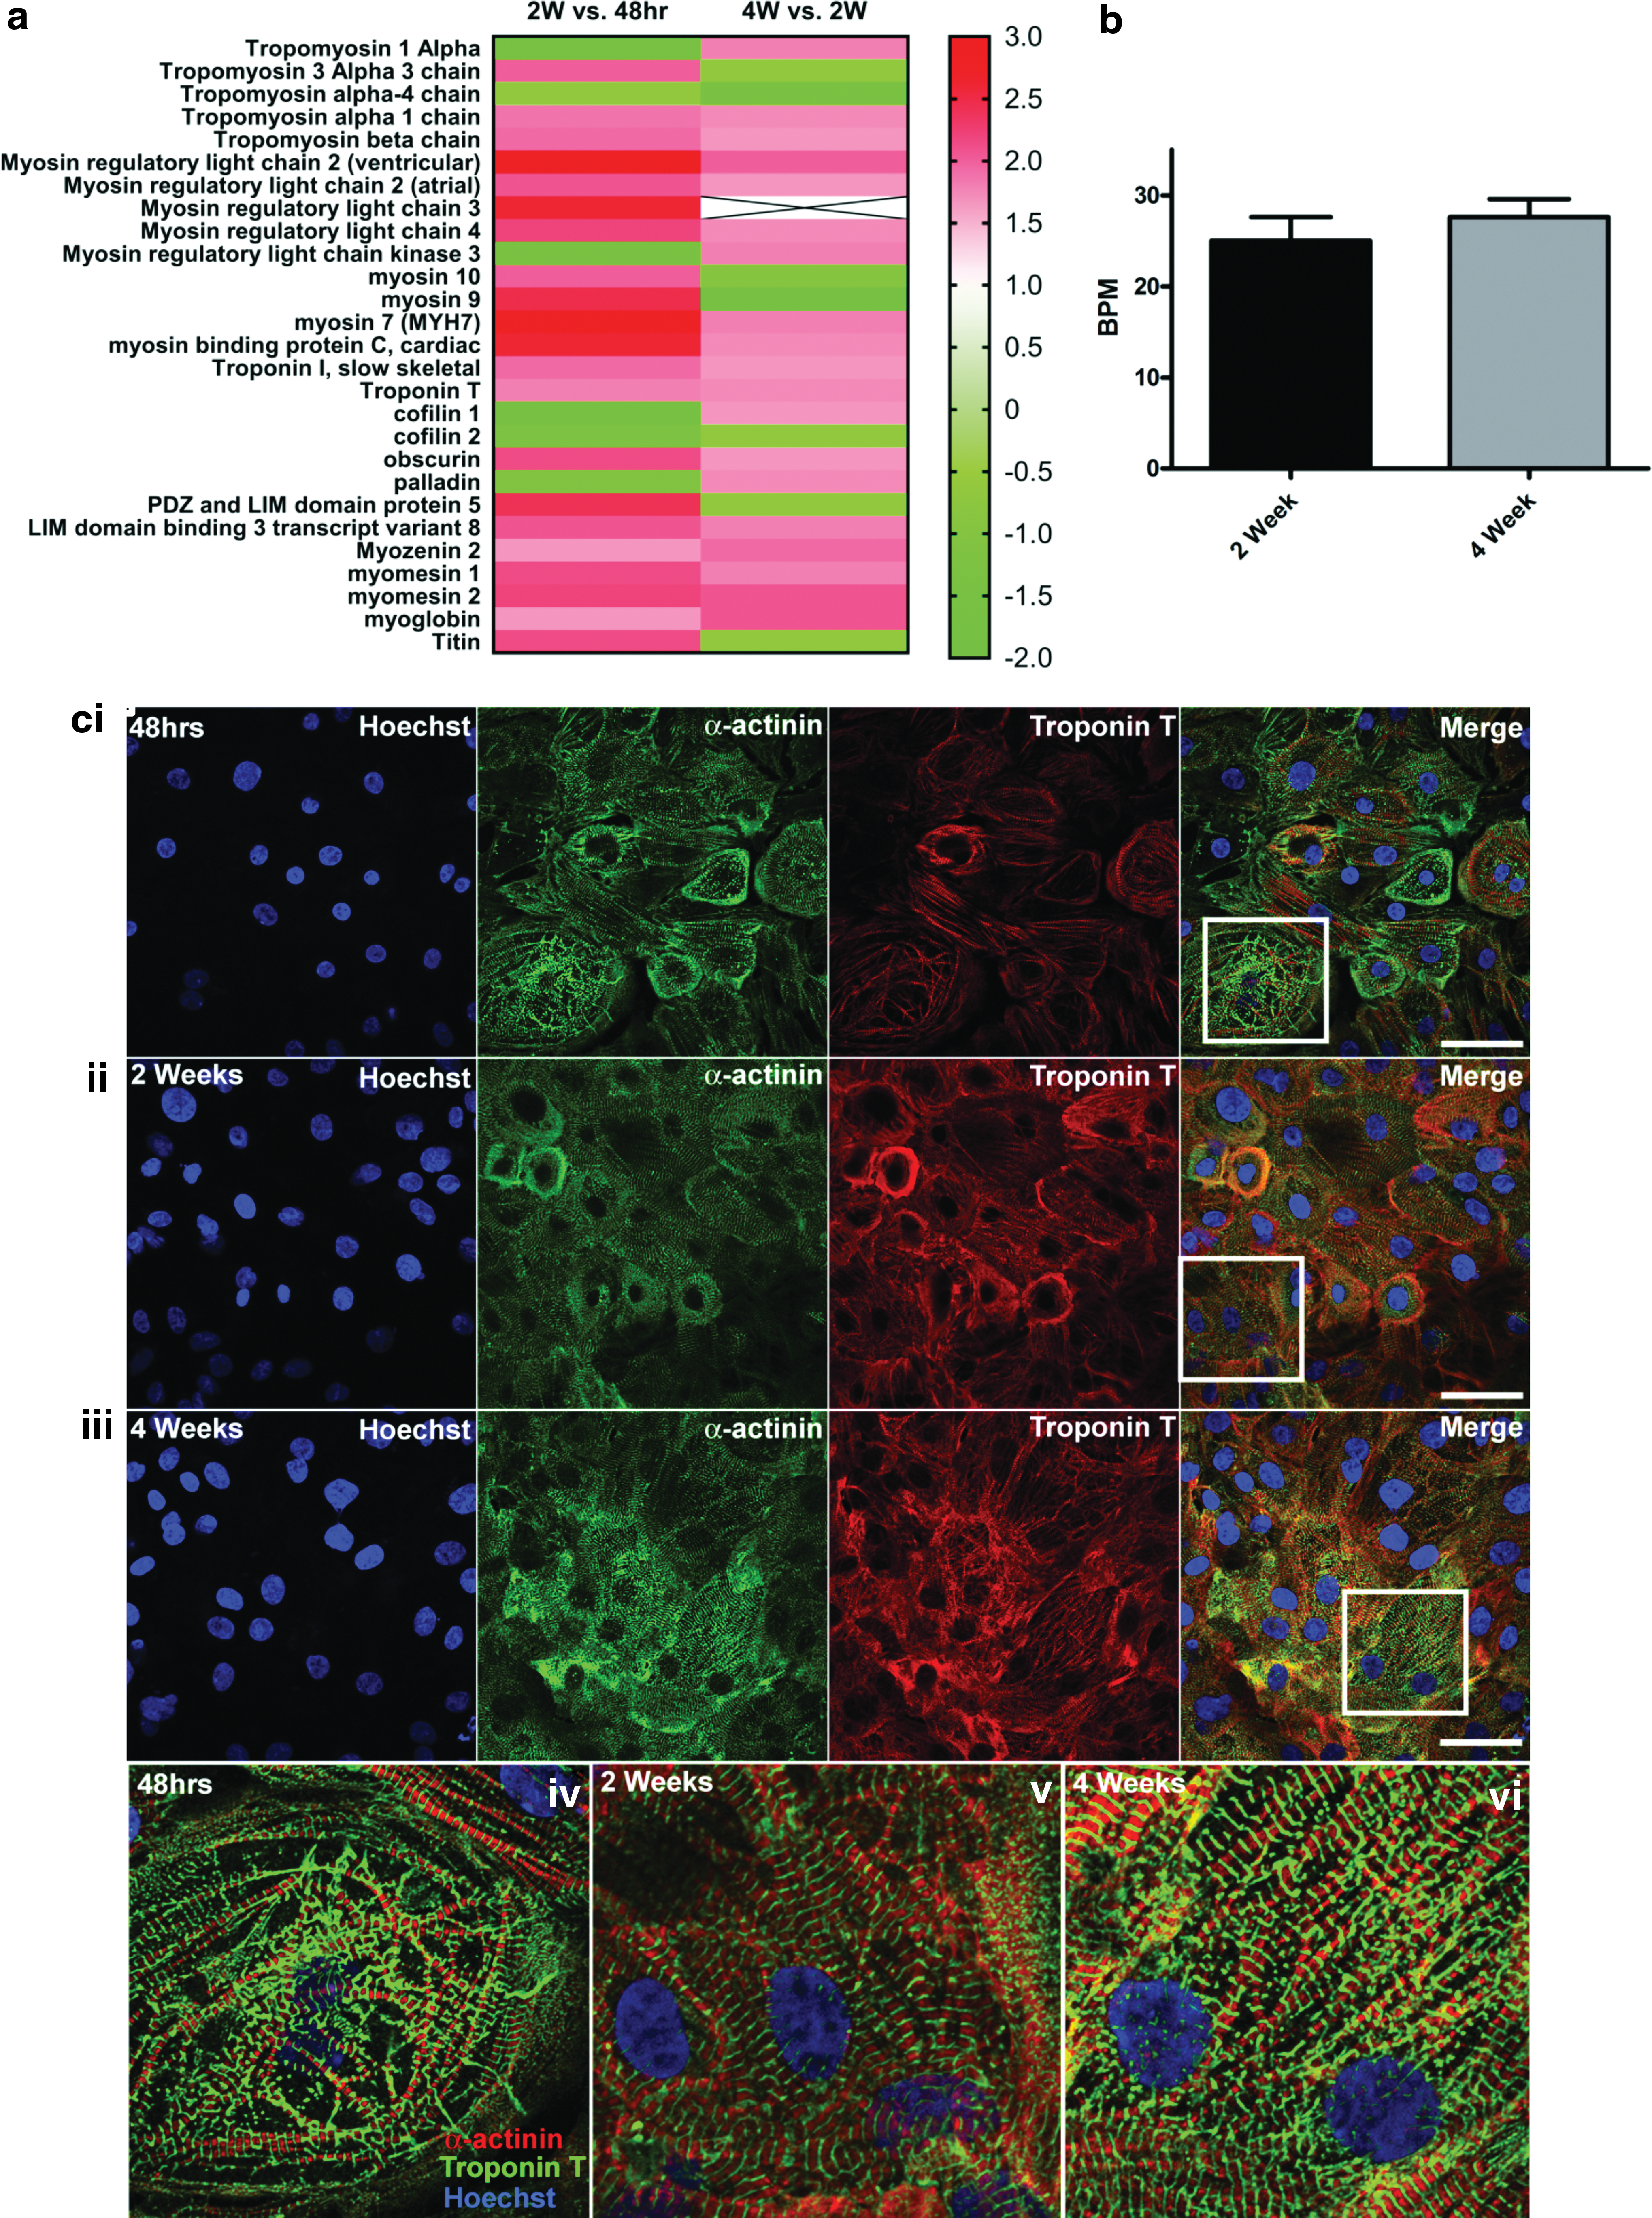
Temporal differences in contractile protein expression in hiPSC-CM.
Comparison of basal beating rate at 2 weeks (25 ± 2.6 beats per minute [BPM]) and 4 weeks (27.6 ± 2 BPM) of culture revealed no significant difference between time points (Fig. 2b; P = 0.43). Unfortunately, it was not possible to measure beating rate of cells 48 h postplating as they were 2 days post-thaw and not beating consistently at this time point. Immunostaining of cells after 48 h, 2 weeks, and 4 weeks in vitro confirmed the presence of troponin T and sarcomeric α-actinin (Fig. 2c). Preliminary immunocytochemical images suggested a denser network of troponin T-positive fibers accompanied by more organized sarcomeric structures (Fig. 2c).
Temporal increases in β1-AR gene expression and function have been reported between days 30 and 90 postdifferentiation [21,22]. The beta-adrenoceptors (β-ARs) themselves are too low abundance for general proteomic detection. However, analysis of downstream proteins associated with β-AR signaling revealed changes including time-dependent increased expression of adenylate cyclase 5, cAMP-dependent protein kinase regulatory and catalytic subunits, and G-protein beta or gamma subunits (Supplementary Fig. S3a). While the cyclase and kinase alterations would be predicted to enhance cAMP-dependent responses such as beating rate, the G-protein beta/gamma subunits could also enhance these via binding to Gs but could inhibit via Gi. It is therefore difficult to predict the final balance of effects.
We subsequently assessed changes in beating rate after application of the β-AR agonist isoprenaline (0.01 μM; 10 min) to establish whether the proteomic changes observed in Supplementary Fig. S3a are reflected functionally. Analysis of total β-AR (both β1-AR and β2-AR) responses revealed no significant change in maximum β-AR response (2 week: 186% ± 18% vs. 4 week: 227.5% ± 13%; P = 0.12) (Supplementary Fig. S3bi). Investigation of individual receptor subtype responses demonstrated β2-AR responses to be greater than β1-AR at both 2 weeks (β1-AR: 160.3% ± 9% vs. β2-AR: 239.3% ± 15%; P < 0.01) (Supplementary Fig. S3bii) and 4 weeks (β1-AR: 137.1% ± 4% vs. β2-AR: 208.8% ± 21%; P < 0.05) (Supplementary Fig. S3biii) post-thaw. AKAP proteins also known to affect the β1-AR:β2-AR ratio of responses were also altered between 2 and 4 weeks.
Time in culture alters the expression of proteins associated with excitation–contraction coupling in hiPSC-CM
We then assessed temporal changes in proteins associated with calcium handling and action potential morphology. There was a dramatic increase in calsequestrin 2 protein expression between during the first 2 weeks post-thaw, which was further increased during the 2- to 4-week period. Interestingly, this was the protein with the highest fold change at both time points studied (Supplementary Tables S2Bi and S3Bi). A decrease in sarcoplasmic reticulum Ca(2+) ATPase (SERCA) (−1.3-fold) expression was visible between 48 h and 2 weeks, which then stabilized between 2 and 4 weeks. Additionally, a subtle decrease in ryanodine receptor (−1.2) was present, followed by an increase (1.7-fold) between 2 and 4 weeks. The Nav1.5 sodium channel subunit remained stable during the initial 2 weeks but then increased between 2 and 4 weeks in vitro (1.3-fold) (Fig. 4a).
Calcium transient analysis revealed a subtle nonsignificant temporal decrease in time to transient peak (Fig. 3bii; P = 0.30). The time to 50% transient decay was modestly increased (Fig. 3biii; P = 0.05), whereas there was no difference in transient amplitude (Fig. 3biv; P = 0.59). Study of action potential morphology revealed a temporal decrease in time to maximum depolarization (Fig. 3ci, ii; P = 0.01). Time to 50% repolarization was also significantly decreased between 2 and 4 weeks (Fig. 3ciii; P = 0.05), and there was a subtle although nonsignificant decrease in action potential duration (APD50) (Fig. 3civ; P = 0.15).

Temporal changes in proteins associated with excitation-contraction coupling.
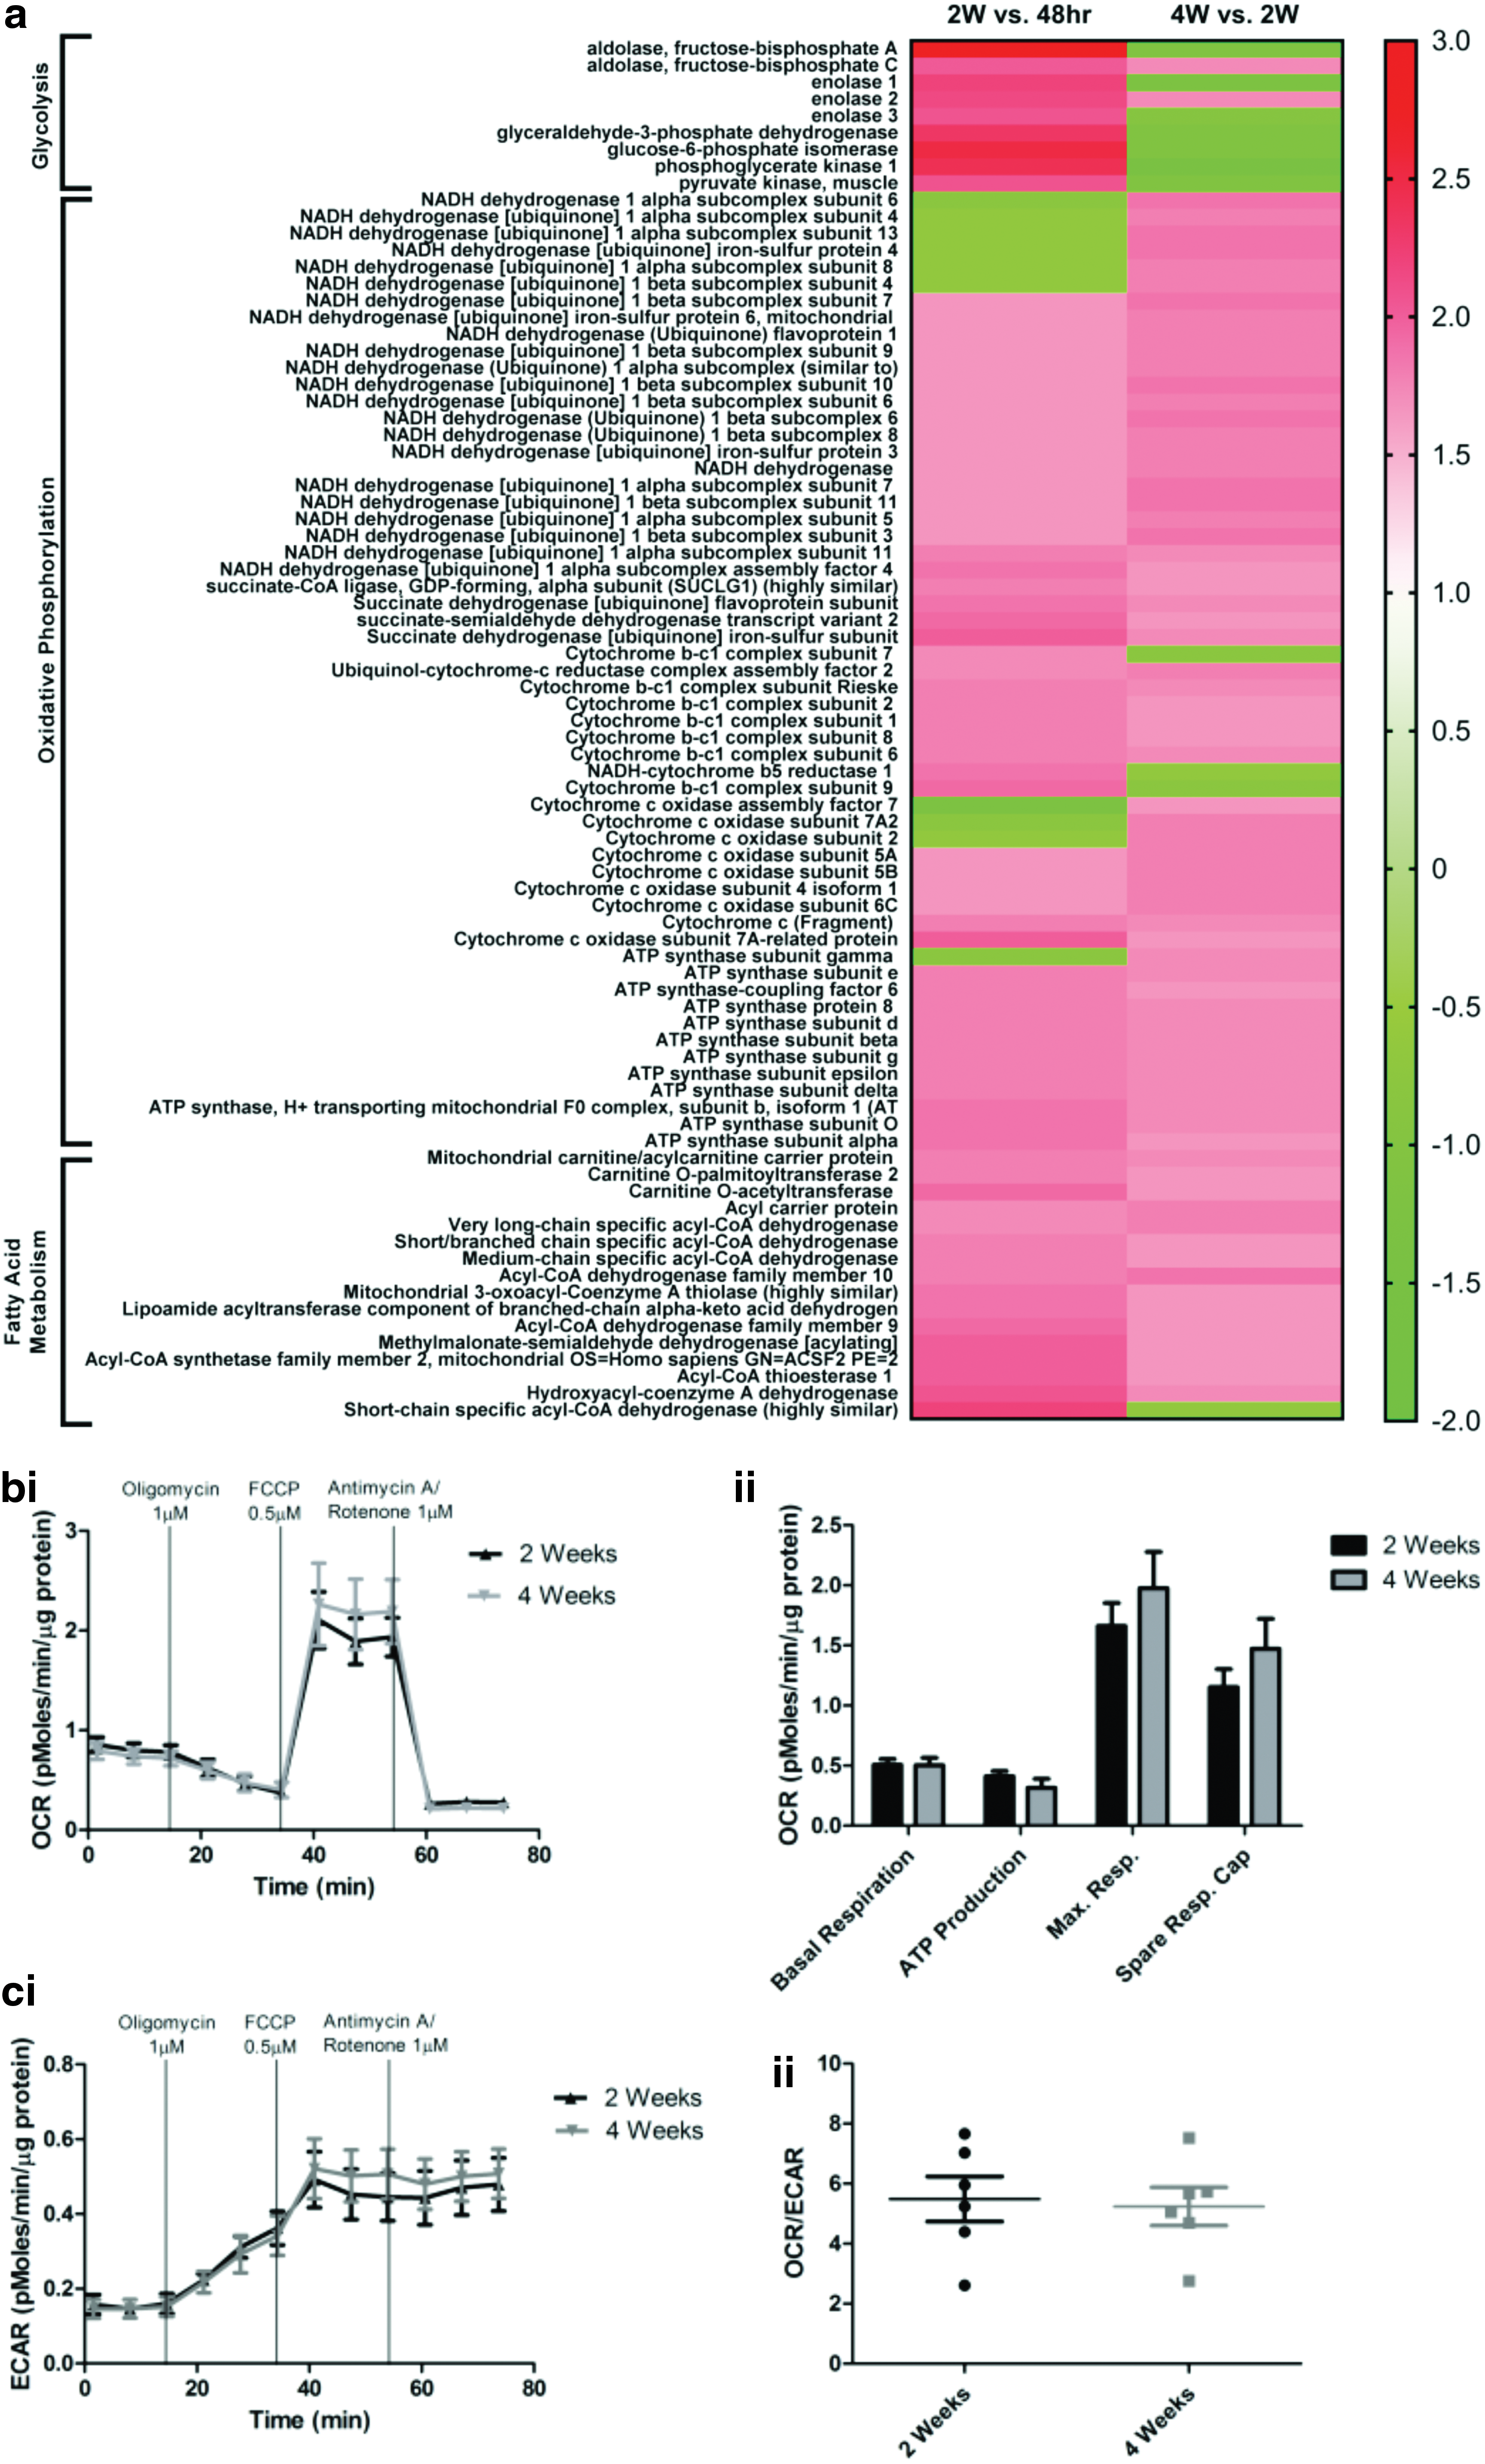
Temporal differences in metabolism-associated protein expression in hiPSC-CM.
Alterations in metabolic protein expressions are not mirrored functionally
As metabolic pathways were the top canonical pathways altered between 2 and 4 weeks in culture, we performed more detailed analysis of the proteins associated with glycolysis, oxidative phosphorylation, and fatty acid metabolism (Fig. 4a). Proteins involved in glycolysis, oxidative phosphorylation, and fatty acid metabolism were detected at all time points (Fig. 4a). Between 48 h and 2 weeks, there was a net increase in proteins involved in glycolysis, which was followed by a net decrease between 2 and 4 weeks. This was accompanied by a decrease in NADH dehydrogenase alpha subunits between 48 h and 2 weeks, followed by an increase between 2 and 4 weeks postplating.
Analysis of mitochondrial function revealed no temporal changes in basal respiration and ATP production (Fig. 4bi, ii). There was a trend toward a slight increase in maximum respiration and spare respiratory capacity; however, this did not reach statistical significance (P = 0.3 and P = 0.4, respectively). The fact that we observed an increase in expression of glycolysis-associated proteins between 48 h and 2 weeks post-thaw, which were subsequently downregulated between 2 and 4 weeks, accompanied by an increase in oxidative phosphorylation-associated proteins (Fig. 4a and Table 1bi) led us to investigate whether this was mirrored functionally. Calculation of ECAR as a measure of glycolysis revealed no significant difference between 2 and 4 weeks in vitro, although cells at 4 weeks had a slightly enhanced ECAR compared with those at 2 weeks (Fig. 4ci; P = 0.8). There was no significant difference in the ratio between OCR (measure of mitochondrial respiration) and ECAR between cells 2 and 4 weeks postplating (Fig. 4cii).
Discussion
In this study, we set out to characterize the proteome of hiPSC-CM and investigate temporal changes in protein expression in vitro over a 1-month period to gain a more in-depth knowledge as to the basal proteomic state of the cells. As expected, we observed temporal variations in hiPSC-CM protein expression; a net decrease in pathways associated with protein translation/synthesis and ubiquitination was evident during the first 2 weeks followed by a net increase in proteins associated with oxidative phosphorylation and accompanying decrease in glycolytic proteins during the second 2-week period.
Some changes, such as the β-AR response, did not have clearly predictable functional outcomes. Alterations in sarcomeric and sarcolemmal channel/transporter proteins were consistent with morphological and electrophysiological changes observed. However, we were surprised to see that other proteomic changes such as those involved in metabolism were not accompanied by functional improvement, despite the latter being previously reported in hPSC-CM in vitro over time courses ranging from 1 week to 3 months [8,20 –22]. The fact that global protein expression was similar between hiPSC-CM batches in our study gives confidence for their use in regenerative medicine and in vitro assays and supports previously published data comparing both batch variations and cell source/differentiation methods [35,36].
Our data point to global protein synthesis being a relatively early event during cardiac differentiation, before stabilization. This indicates that further external stimuli would be necessary to induce further global protein synthesis, which is of particular interest with regard to driving functional maturation. It cannot be ignored that some changes observed during the first 2 weeks in culture are most likely a consequence of recovery from the freeze-thaw process, particularly, the decrease in apoptosis-associated proteins, along with the myofibrillar myogenesis and cell–cell connection pathways, which were also seen to be upregulated during this time period. In our experience, hPSC-CM post-thaw can take 4–5 days to commence beating, and in some lines, it can take up to 10 days for a synchronous syncytium to form. Our analysis of contractile protein expression post-thaw revealed that proteins associated with sarcomere formation (and cytoskeletal organization during development) were increased, accompanied by decreases in proteins associated with actin filament disassembly, which supports this observation. The morphological analysis of sarcomere formation reflected well the proteomic observations.
Investigation into key proteins involved in excitation–contraction coupling revealed that the majority of proteomic increases to be during the 2- to 4-week post-thaw period. The only protein that increased throughout the whole experiment was the sarcoplasmic reticulum calcium binding protein, calsequestrin 2, which interestingly had previously been reported to be absent in hESC-CM [37]. Surprisingly, this was the protein that showed the greatest upregulation throughout the course of the experiment.
The increases in calsequestrin, triadin, ryanodine receptor 2, and L-type calcium channel delta subunits indicated that sarcoplasmic reticular calcium release should be more efficient; however, we were surprised to see only a minor decrease in the calcium release time (time to transient peak) and no change in calcium transient amplitude. Overexpression of calsequestrin in hESC-CM has been reported to increase calcium transient amplitude and increase the rates of both calcium release and reuptake/extrusion [38]. As our study was a comparative study, it is difficult to know the absolute protein expression levels and whether the 3.6-fold change during this time period would be sufficient to cause functional enhancement. The fact that calcium extrusion sodium-calcium exchanger (NCX) and reuptake (SERCA)-associated proteins did not change between 2 and 4 weeks in culture, coupled with increased expression of the SERCA-inhibitory protein phospholamban (which would be expected to oppose an acceleration of Ca2+ reuptake), could account for the smaller-than-expected increase in calcium reuptake/extrusion time. Increases in the rates of calcium release and reuptake/extrusion in hPSC-CM have been previously reported in hPSC-CM between days 80 and 120 postdifferentiation [8]. The cells used in our study were day 60 postdifferentiation after 4 weeks in culture, which could explain why only minor functional changes were seen and indicate that longer term culture could be beneficial.
The area where we saw proteomic changes mirrored functionally was in action potential morphology. Both time to maximum depolarization and time to 50% repolarization were significantly decreased, and the increase in expression of Nav1.5 likely contributes to this. A temporal shift toward a more hyperpolarized maximum diastolic potential has also been reported [8] and, although we did not investigate this in our study, it cannot be overlooked particularly as we observed temporal alterations in protein expression of Na+/K+ ATPase subunit alpha 3.
Proteomic changes in cells between 2 and 4 weeks in vitro were dominated by metabolic pathways and indicate a potential metabolic shift; a net increase in proteins associated with oxidative phosphorylation and accompanying decrease in proteins associated with glycolysis were observed. Of the upstream regulators identified during this time period, peroxisome proliferator-activated receptor gamma coactivator 1-alpha (PGC-1α; PPARCG1A), estrogen-related receptor alpha (esrra), and miR-122 are all associated with regulation of fatty acid biogenesis and metabolism [39]. PGC-1α in particular appears to have a pivotal role as PPAR signaling pathways are central components of this process and act as activators of fatty acid oxidation [40] and drive mitochondrial biogenesis [41,42]. In addition, PGC-1α expression is controlled by esrra [39], and PGC-1α has recently been highlighted in a proteomic screen of hESC-CM to play a role in transcription of genes associated with fatty acid metabolism and improve mitochondrial organization [12].
Metabolism is crucial for providing energy for contraction, and as energy demands increase, cardiomyocytes in vivo rely heavily on oxidative phosphorylation. In fetal hearts, cardiomyocytes are adapted to a low-oxygen environment and predominantly use glycolysis (and lactate) for energy production, and neonatally, there is a metabolic shift in response to the increased work load along with the increase in circulating fatty acids, a process that is key to cardiac development [43,44]. Evidence suggests that hiPSC-CM possess a degree of metabolic flexibility; when cultured in the presence of glucose, they rely primarily on glycolysis; however, when this is switched to galactose +/− fatty acids, the cells rely on mitochondrial oxidative phosphorylation for ATP production [45]. Our data point to hiPSC-CM in our study using predominantly oxidative phosphorylation due to the positive OCR/ECAR ratio. The fact that only a slight temporal increase in OCR was seen, despite an increase in oxidative phosphorylation-associated proteins, is likely due to the composition of the culture media, and further manipulation of energy substrates could be required to enhance or uncover metabolic maturation.
It has been suggested that metabolism and maturation may be linked [12,46], and a switch from anaerobic to oxidative metabolism, coupled with mitochondrial reorganization, has been reported to be important for murine ESC-cardiac differentiation and the formation of sarcomeres and contractility [46]. Although our proteomic data provide evidence of a temporal metabolic switch, the fact that this was not reflected functionally could actually be impeding or acting as a barrier to the further development/maturation of the contractile apparatus and warrants further investigation. Additionally, an inverse relationship between cell cycle and metabolism during cardiomyocyte maturation has been reported [47], with a role for oxidative metabolism in repression of the cardiac cell cycle being proposed [48] and could also explain why hPSC-CM proliferative activity decreases over prolonged time in culture [49].
The hPSC-CM basal transcriptome and proteome are similar to cardiomyocytes of a first-trimester fetus [11,12,50], and to date, maturation strategies have only pushed the transcriptome as far as cardiomyocytes of a second-trimester fetus [11]. The fact that temporal proteomic changes and functional enhancement appear to be discordant in some cases indicates that there could be a barrier to functional maturation. One possibility is that during development the functional changes from fetal-neonatal-adult cardiomyocyte are induced in response to increased physiological demands as in the case of metabolic metabolism and contraction. It is likely that in vitro the temporal changes observed are as a result of cells simply responding to and adapting to their environment, utilizing the metabolic substrates available and consequently adapting excitation–contraction coupling mechanisms. In our study, cells were cultured as two-dimensional monolayers, which have been shown to act as a potential barrier to maturation [27]. To further alter function and enhance maturation, researchers are currently adapting culture conditions to induce positive functional changes including the application of factors known to play a role during development (eg, triiodothyronine) [51], culture of hiPSC-CM on isotropic substrates [28], culture under electrical stimulation [19], and three-dimensional culture (eg, engineered heart tissue constructs) [29].
In terms of clinical relevance, our data are particularly interesting in the context of cardiac grafting as the recent primate transplantation studies have relied on frozen hPSC-CM due to the vast quantities needed [3,4]. Interestingly, in both of the primate transplantation studies, arrhythmias began in the early post-transplantation period and decreased after 2 months. This indicates that “a period of cellular adaptation also occurs in this setting as the cells integrate into the host myocardium” [3,4]. Our data suggest that the initial post-thaw period is associated with cellular adaptation dominated by organization of the cytoskeleton and contractile apparatus and decreasing global protein synthesis. This implies that products need a time of adaptation before implantation and also raises the possibility that any maturation strategies applied to the hPSC-CM might be compromised by freezing. By providing insight into the processes occurring post-thaw, we also present information important for in vitro high-throughput safety and drug discovery assays being used in Pharma, which rely heavily on the use of commercially produced cryopreserved cells.
Footnotes
Acknowledgments
This work was funded by the BHF Regenerative Medicine Centre RM/13/1/30157 (S.E.H.), and we thank NIBSC for financial support (J.X.W.). We thank Dr. Francis Burton (University of Glasgow and Clyde Biosciences) for the use of Optiq software for calcium transient and action potential image analysis. We also thank Liam Couch for assistance with producing action potential and calcium transient traces in  . This work used the computing resources of the UK MEDical BIOinformatics partnership—aggregation, integration, visualization, and analysis of large complex data (UK MED-BIO), which is supported by the Medical Research Council (grant no. MR/L01632X/1).
Author Disclosure Statement
No competing financial interests exist.
Supplementary Material
Supplementary Figure S1
Supplementary Figure S2
Supplementary Figure S3
Supplementary Table S1
Supplementary Table S2
Supplementary Table S3
References
Supplementary Material
Please find the following supplemental material available below.
For Open Access articles published under a Creative Commons License, all supplemental material carries the same license as the article it is associated with.
For non-Open Access articles published, all supplemental material carries a non-exclusive license, and permission requests for re-use of supplemental material or any part of supplemental material shall be sent directly to the copyright owner as specified in the copyright notice associated with the article.
