
Abstract
How hematopoietic stem cells (HSCs) maintain the balance of self-renewal and differentiation could be partially ascribed to asymmetric and symmetric division patterns. However, a simple and effective method to detect stem cell division patterns is lacking. In this study, we introduce a strategy to describe stem cells division patterns with high spatial resolution at the single-cell level. We show that the fate determinant, Numb, exhibits low expression levels in HSCs that increase upon the initiation of differentiation. Using this single-cell immunofluorescence technique, we found that HSCs mainly undergo symmetric self-renewal in the presence of only stem cell factor, but with the addition of trombopoietin this division pattern is transformed into a symmetric commitment dominant mode in vitro. In addition, our study indicated that the division pattern cannot be defined by cell size or the nuclear/cytoplasm ratio. These findings collectively demonstrate that this single-cell immunofluorescence technique provides a new biological strategy in stem cell division research, and can be more widely applied given its flexibility, easy operability, and inexpensiveness.
Introduction
Adult stem cells are characterized by the ability to both self-renew, which produces a new stem cell, and potential to differentiate into diverse cell types. One mechanism by which cells balance self-renewal with commitment is through regulation of asymmetric and symmetric division [1]. The current mechanisms of stem cell division among different species and tissues are not the same, but these mechanisms may undergo a common regulatory process [2]. The earliest studied example of division patterns in stem cells involve Drosophila germ line cells and neuroblasts [3]. Some conserved fate determinants such as Numb, Prospero, and Brat segregated during the asymmetric division (AD) of neuroblasts to confer asymmetric cell fates [4]. Consistent with previous publications, Reya and colleagues showed that the balance of hematopoietic stem cells (HSCs)' asymmetric fate can be regulated by extrinsic signals and pointed out that Numb could be used as a fate determinant [5]. Subsequently, Numb has been widely used as a recognized fate determinant in the study of division patterns of HSCs [6 –10]. Specifically, in the AD process, the different distribution of Numb in two HSC daughter cells leads to the production of one stem cell and one differentiated cell. This feature ensures that the HSC pool is stable while expanding the differentiated blood cells. Thus, to some extent, the division pattern determines the function of HSCs.
Studies on HSC division patterns are significant but limited. One important reason is that currently available assays for HSC division are relatively scarce. This limitation has been difficult to address in part because the number of HSCs in mammalians is extremely small and because the committed and uncommitted daughters after AD are not morphologically distinct. To some extent, to accurately assess the division pattern of such a heterogeneous population, the methods must be based on the single-cell level [11]. To date, many approaches are available for single-cell analysis in HSC research such as single-cell transplantation [12], single-cell culture [13], molecular barcoding [14], single-cell sequencing, imaging cells undergoing mitosis [5], live-cell imaging [15], in vivo paired daughter cell (PDC) assays [16], and proteomics methods, such as mass cytometry [17]. These methods have their own advantages and limitations in stem cell biological research [18]. Among the strategies described earlier, the methods currently used to determine division pattern of HSCs mainly include immunofluorescence of stem cells undergoing mitosis or live-cell imaging in terms of fluorescent proteins.
In this article, based on Vira V. Artym's “cell sandwich” technique [19], we developed an immunofluorescence technique based on the single-cell level that could better retain the original cell structure and strictly track every HSC's fate. In addition, compared with live-cell imaging assay, this technique can be easily used to calculate any related intracellular protein expression and location while studying cell division.
Materials and Methods
Mice
In all, C57BL/6 mice were between 6 and 8 weeks of age and were purchased from the State Key Laboratory of Experimental Hematology (SKLEH). The mice were maintained at a specific pathogen-free animal facility at SKLEH. The experimental procedures and protocols were approved by the Institutional Animal Care and Use Committees of SKLEH.
Isolation and cultivation of HSCs
BM cell immunostaining was performed according to standard procedures and samples were sorted on an Aria III flow cytometer (BD Biosciences). C-Kit+ cells were enriched using anti-CD117 magnetic beads (Miltenyi Biotec) and LS columns (Miltenyi Biotec). These cells were stained using a cocktail of biotinylated mAbs specific for CD3, CD4, CD4, B220, Mac-1, Gr-1, and Ter-119 (BD Biosciences); PE/cyanin7 (PE-cy7) conjugated anti-Sca-1 (eBioscience); APC conjugated anti-c-Kit (eBioscience) mAbs; and APC/cyanin7 (APC-cy7) streptavidin (eBioscience) mAbs. FITC anti-CD34 mAbs (eBioscience), PE anti-CD150 mAbs (eBioscience), and PercP-cy5.5 anti-CD41 mAbs (eBioscience) were added to obtain CD150+CD41−CD34−KSL cells. Single HSCs were deposited into 96-well plates at one cell per well containing 200 μL S-clone SF-O3 medium (Sanko Junyaku, Tokyo, Japan) supplemented with or without 50 ng/mL trombopoietin, and with 50 ng/mL stem cell factor, penicillin/streptomycin (Life Technology),
Production of “cell sandwiching”
In brief, a 1:1:8 mix of 10× DMEM, 10× reconstitution buffer (2.2 g of sodium bicarbonate and 4.8 g of HEPES in 100 mL of distilled water) and rat tail collagen type I (Sigma) was prepared as needed for the experiment. The neutralized collagen solution was adjusted to a pH range of 7.1–7.4 using ice-cold 2N NaOH or 2N HCl. The collagen solution was incubated on ice for 3 min and then the collagen solution was centrifuged at 10,000 rpm in a microcentrifuge at 4°C for 3 min to remove air bubbles. Then, 5 μL of ice-cold neutralized collagen solution was added to each well of a μ-slide angiogenesis chamber (ibidi, Germany). The chamber was placed in a wet box in 37°C and 5% CO2 incubator for 2 min to allow for collagen polymerization. When a single mother cell underwent cell division and gave rise to two daughter cells, the two daughter cells were transferred into the μ-slide chamber that contained polymerized collagen gel by micromanipulation (Narishige, Japan). The 40 μm diameter microneedles were prepared by a microinjector system (PN-30 puller and MF-900 microforge; Narishige). Then, 5 μL of neutralized collagen gel was added dropwise directly to the cells immediately after the transfer step described earlier. The chamber was placed into the incubator for 5 min to polymerize the second layer of collagen solution. Then, 40 μL of cell culture media prewarmed to 37°C was gently added to each well and the chamber was placed into the 37°C incubator for 30 min.
Immunofluorescence staining of cells in collagen matrices
Cell samples were fixed with 4% paraformaldehyde (Sigma-Aldrich) for 20 min at room temperature (RT). The samples were then permeabilized with 0.05% Triton X-100 (Sigma-Aldrich) for 10 min and blocked in 10% FCS (Sigma-Aldrich) in 1× phosphate-buffered saline (PBS) for 1 h at RT. Subsequently, cell samples were incubated with primary antibodies diluted in 0.05% bovine serum albumin in PBS overnight at 4°C. The primary antibodies used included rabbit anti-Numb (AB14140, 1:200; Abcam), goat anti-Numb (PA5-18000, 1:200; Thermo Fisher Scientific), and mouse anti-Musashi-2 (14-9677-82, 1:200; Thermo Fisher Scientific). Treatment with secondary antibody solutions was performed for 1 h at RT. Secondary antibodies used included Alexa Fluor 488 goat anti-rabbit (A11008, 1:250; Thermo Fisher Scientific), Alexa Fluor 647 donkey anti-goat (A32849, 1:250; Thermo Fisher Scientific), and Alexa Fluor 568 donkey anti-mouse (A10037, 1:250; Thermo Fisher Scientific). Finally, samples were counterstained with 1 μg/mL DAPI solution (Thermo Scientific). All steps were carefully performed to avoid washing away the collagen matrices. Images were obtained using a spinning disk confocal microscope (UltraVIEW VOX; PerkinElmer). Representative cells were acquired by the same devices equipped with 100 × objective and 0.5 μm Z steps.
Data analyses
Quantitative analyses were performed using Volocity (Version 6.0; PerkinElmer). Representative cells were processed and reconstructed into three-dimensional (3D) images by Volocity 6.0 and Imaris 6.32. GraphPad Prism 5.0 and SPSS 17.0 statistical software were used for statistical analyses. Comparisons between three independent groups were assessed by one-way analysis of variance with a Scheffe multiple-comparisons test. A P-value <0.05 was considered statistically significant (*P < 0.05, **P < 0.01, and ***P < 0.001). Data are presented as the mean ± standard error of the mean.
Results and Discussion
Previous studies have shown that Numb can be used as a cell fate determinant in HSCs [5]. To confirm the expression of Numb in HSCs, the CD150+CD34−CD41−KSL, Flt3+CD34+ KSL and KLS− populations corresponding to HSCs, MPPs, and HPCs were isolated from the bone marrow of C57BL/6J mice by fluorescence-activated cell sorting (FACS) (Fig. 1A). These populations of cells were fixed immediately, and Numb and Musashi-2 expression was assessed using indirect immunofluorescence assays. Consistent with previous studies [5,9,13,20 –22], opposite expression levels of Numb and Musashi-2 were found in bone marrow-derived HSCs. Specifically, low Numb expression and high Musashi-2 expression were observed. However, upon HSC differentiation of HSC, the expression of Numb was increased, and the expression of Musashi-2 was decreased (Fig. 1B, C). In addition, 3D reconstruction images indicate that Numb and Musashi-2 are mainly located in the cytoplasm (Fig. 1D). To exactly evaluate Numb protein level in two daughter cells from one HSC, we next performed PDC assays [23] followed by single-cell sorting. HSCs purified from mouse bone marrow cells were individually sorted into 96-well plates and cultured for 44–92 h in the presence of stem cell factor (SCF) and trombopoietin (TPO) or SCF only. Cell division was noted in 61.1% of HSCs after 44–48 h in the presence of SCF+TPO and 48.5% of HSCs after 88–92 h in the SCF group (Supplementary Table S1).
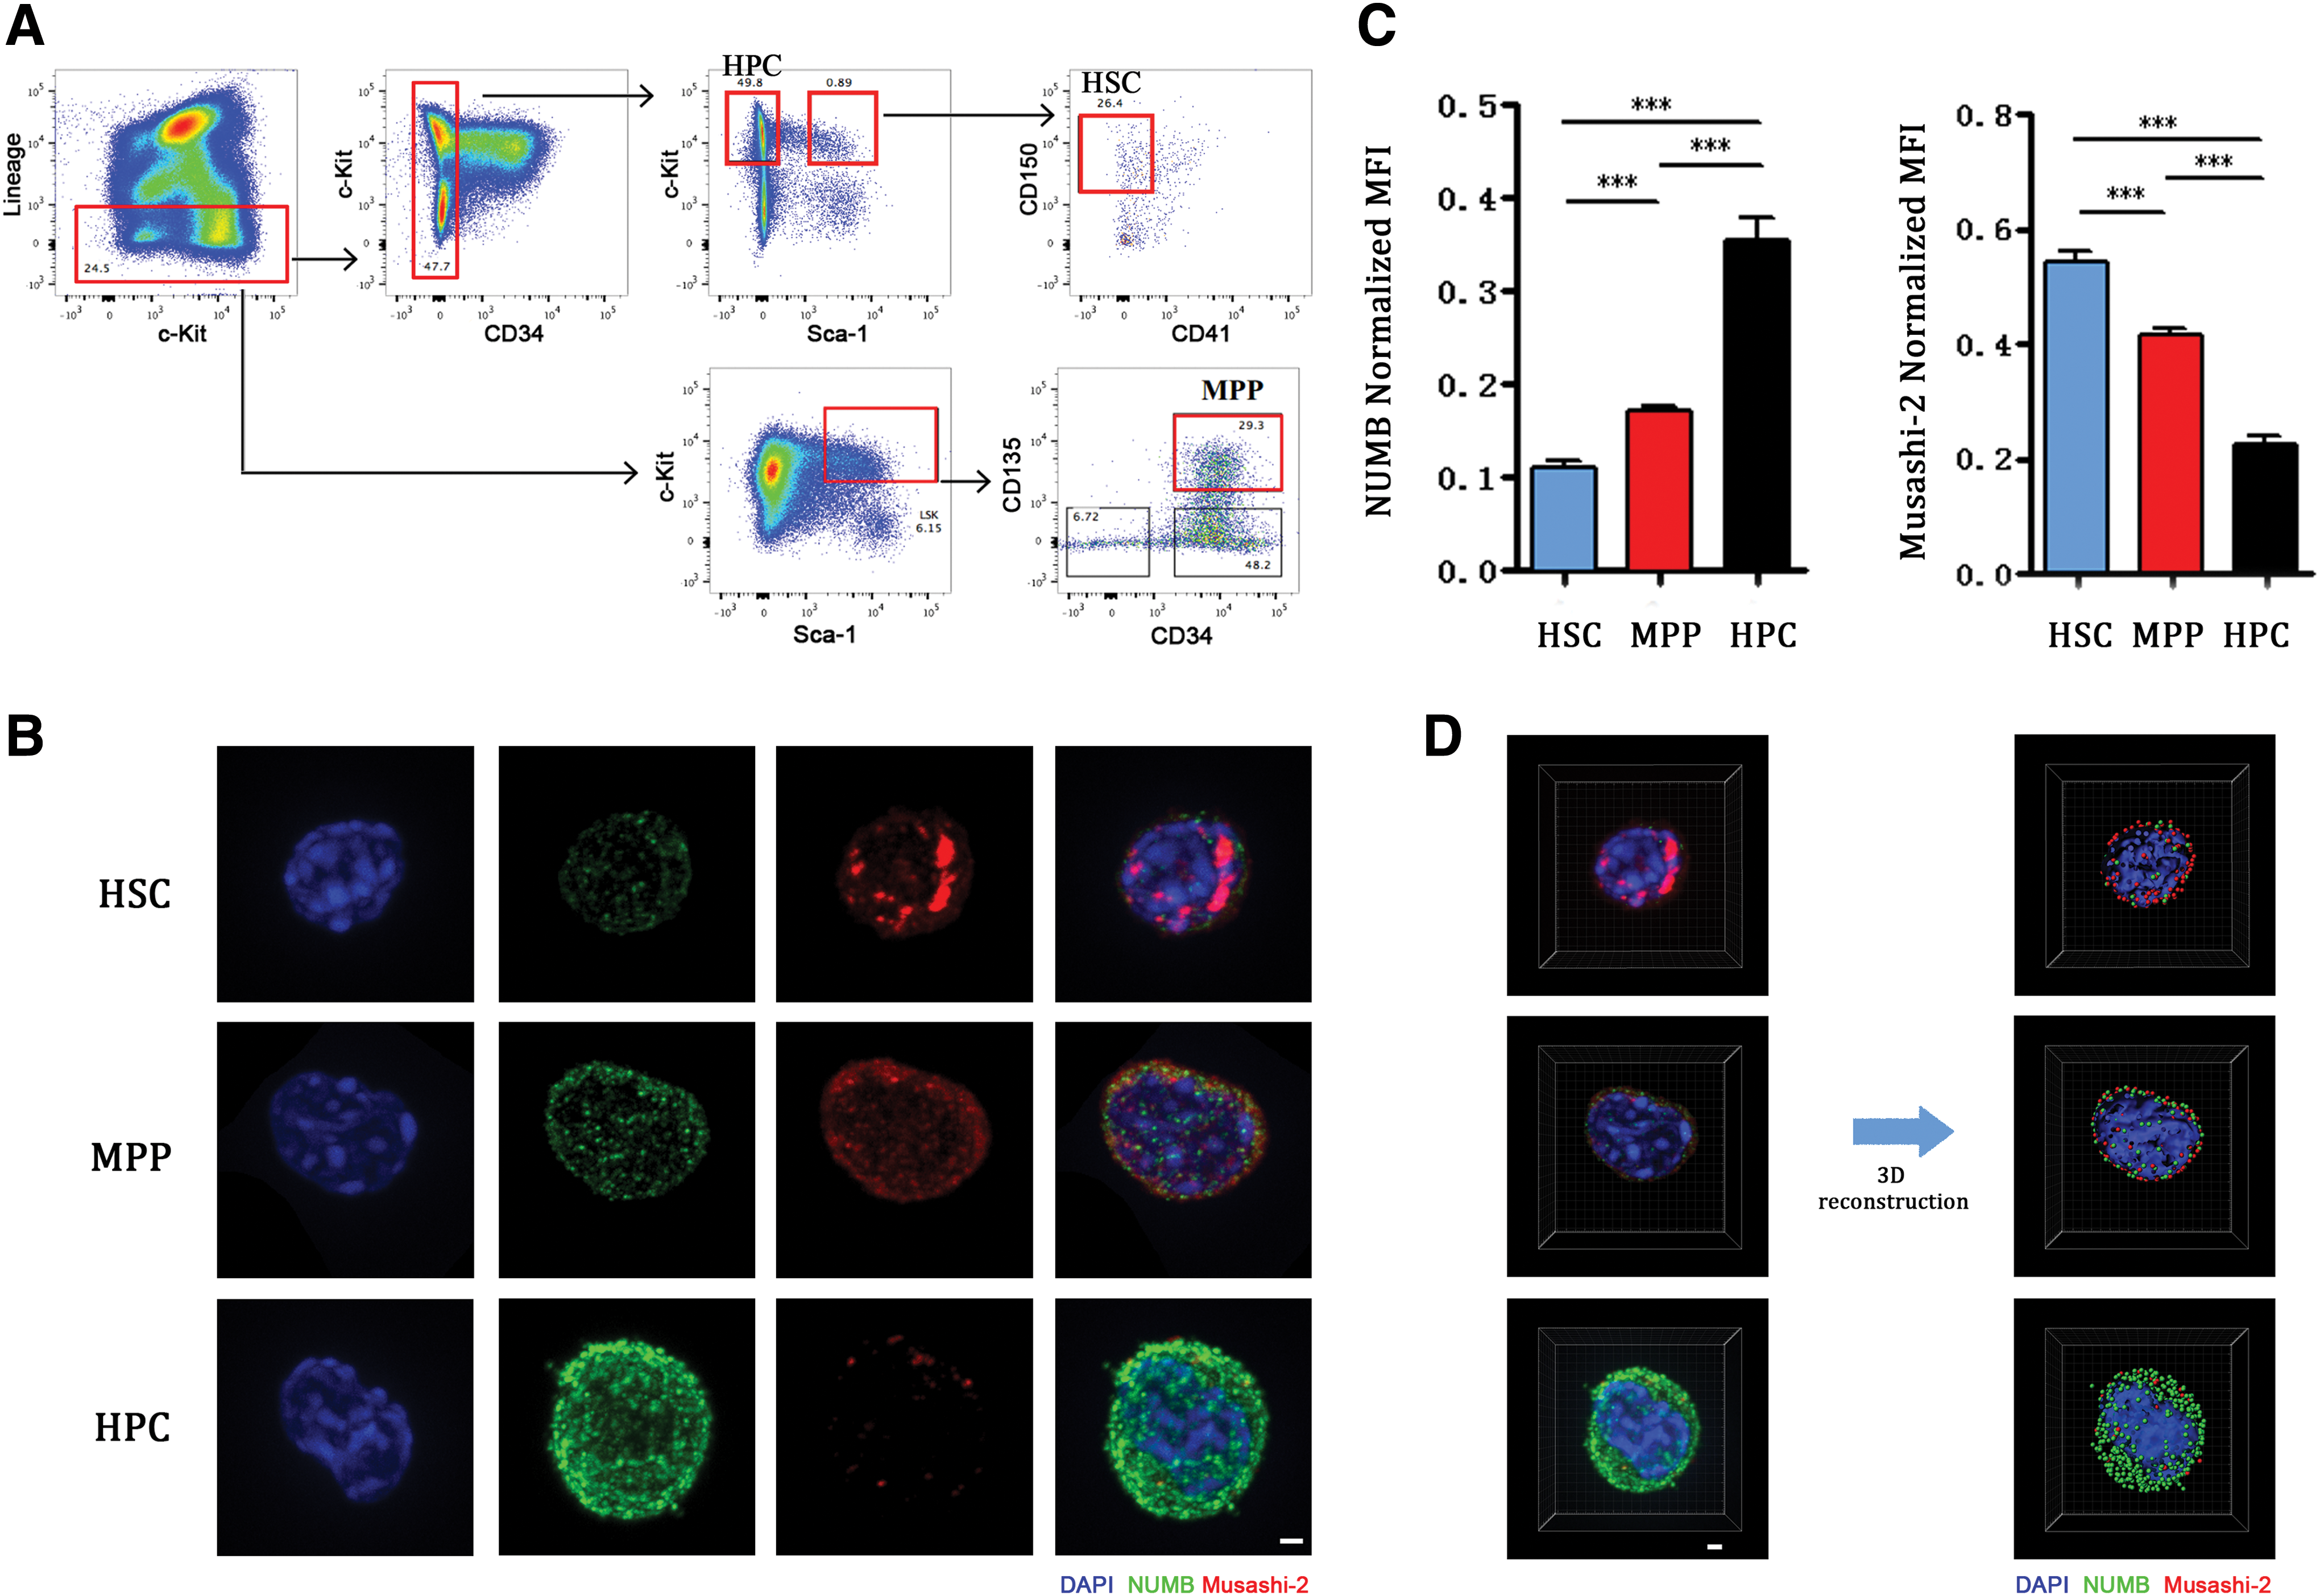
Analysis of Numb expression level in hematopoietic stem and progenitor cells.
To assess the division pattern of HSCs under different culture conditions, pairs of two daughter cells were transferred to the gel using a micromanipulator and “cell sandwiching” was performed for subsequent staining (Fig. 2). Symmetric and ADs were quantified in HSCs by staining for the cell fate determinant, Numb. Consistent with the previous standard, high Numb expression in both daughter cells marked symmetric commitment (SC), higher expression of Numb protein in one daughter cells indicated AD and low expression of Numb in both daughter cells indicated symmetric self-renewal divisions (SDs) (Fig. 3A). Division patterns of individual HSCs were quantified, revealing that HSCs underwent more SC (56.96%) than SD (17.72%) and AD (25.32%, a difference of twofold) in the presence of SCF and TPO in vitro (Fig. 3B; Supplementary Fig. S1). However, under only SCF culture conditions, HSCs underwent more SD (42.86%) than AD (32.14%) and SC (25%). These observations partially support the previous point that HSCs tend to exhibit more symmetrical commitment in vitro upon the addition of TPO [24]. However, inconsistent with a previous study [9], these different proportions of division patterns may be related to HSC sorting markers, culture medium composition and the addition of a microtubule polymerization inhibitor.
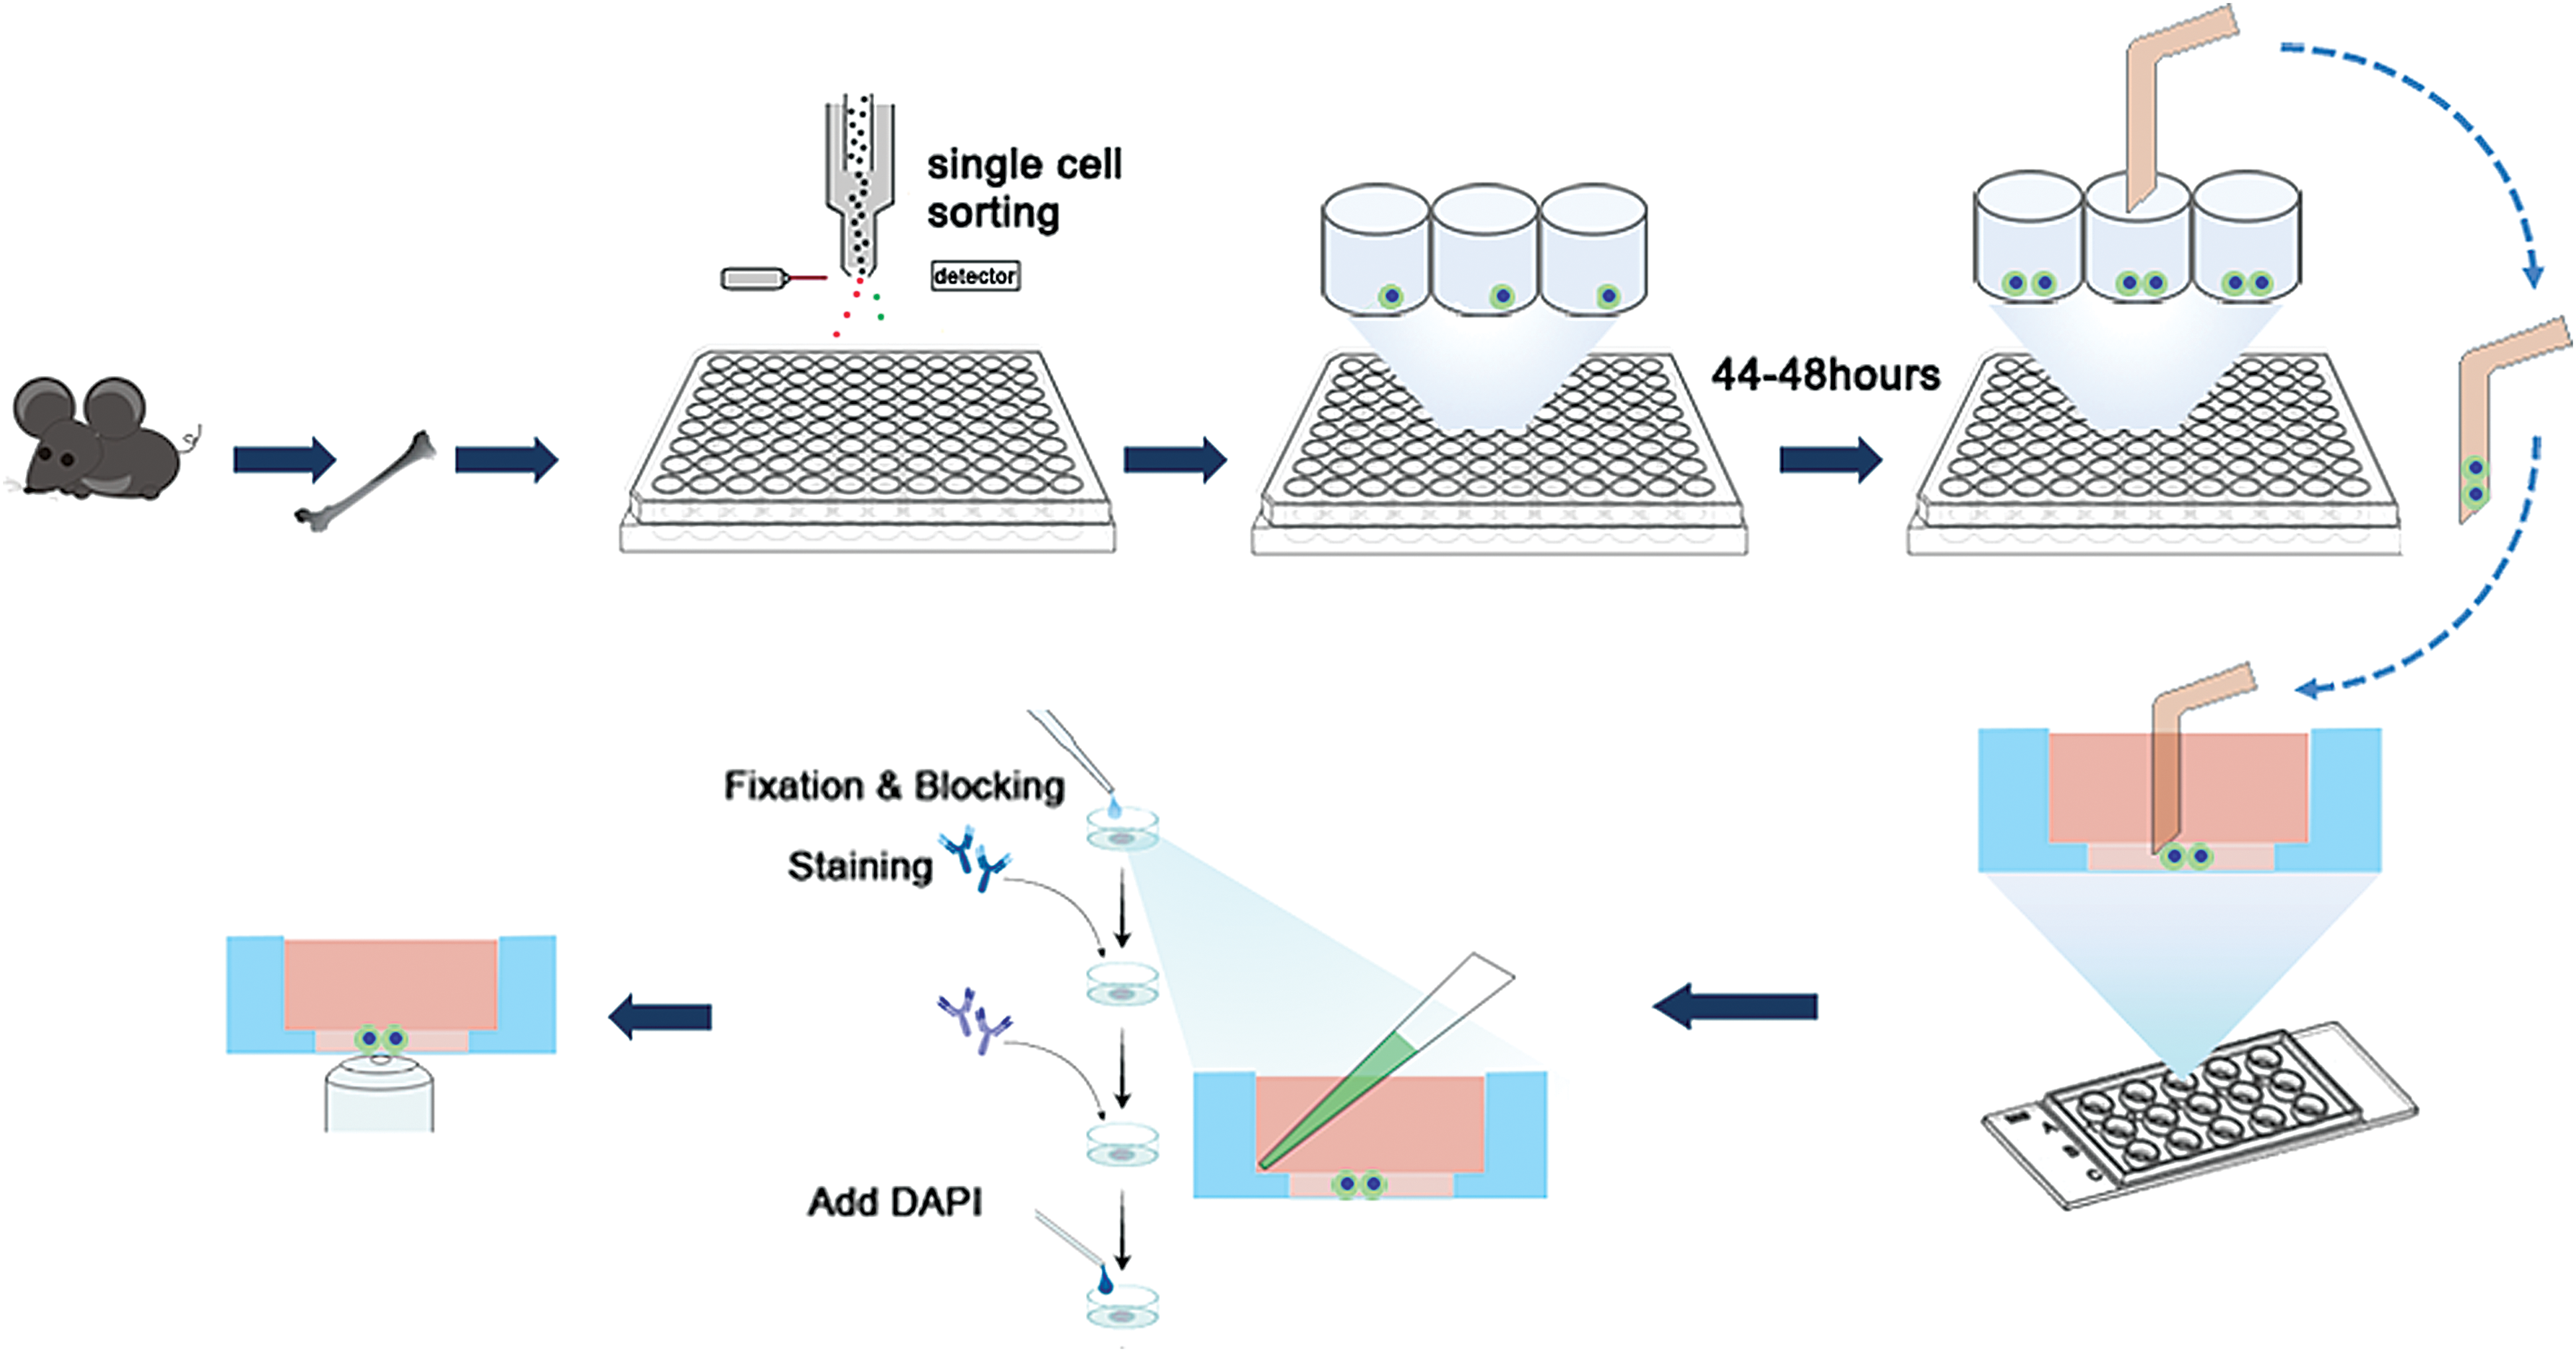
Strategy for PDCs staining. Single HSCs from C57BL/6J mouse were sorted into 96-well plates, one cell per well, and were incubated in the medium with or without TPO, and with SCF. After 44–92 h, during which interval the individual cells had divided once, pairs of two daughter cells were transferred into the μ-slide angiogenesis chambers that were coated by mix gel and then covered by gel immediately. After being cultured for a short time, samples are fixed and stained as usual. PDC, paired daughter cell; SCF, stem cell factor; TPO, trombopoietin. Color images are available online.
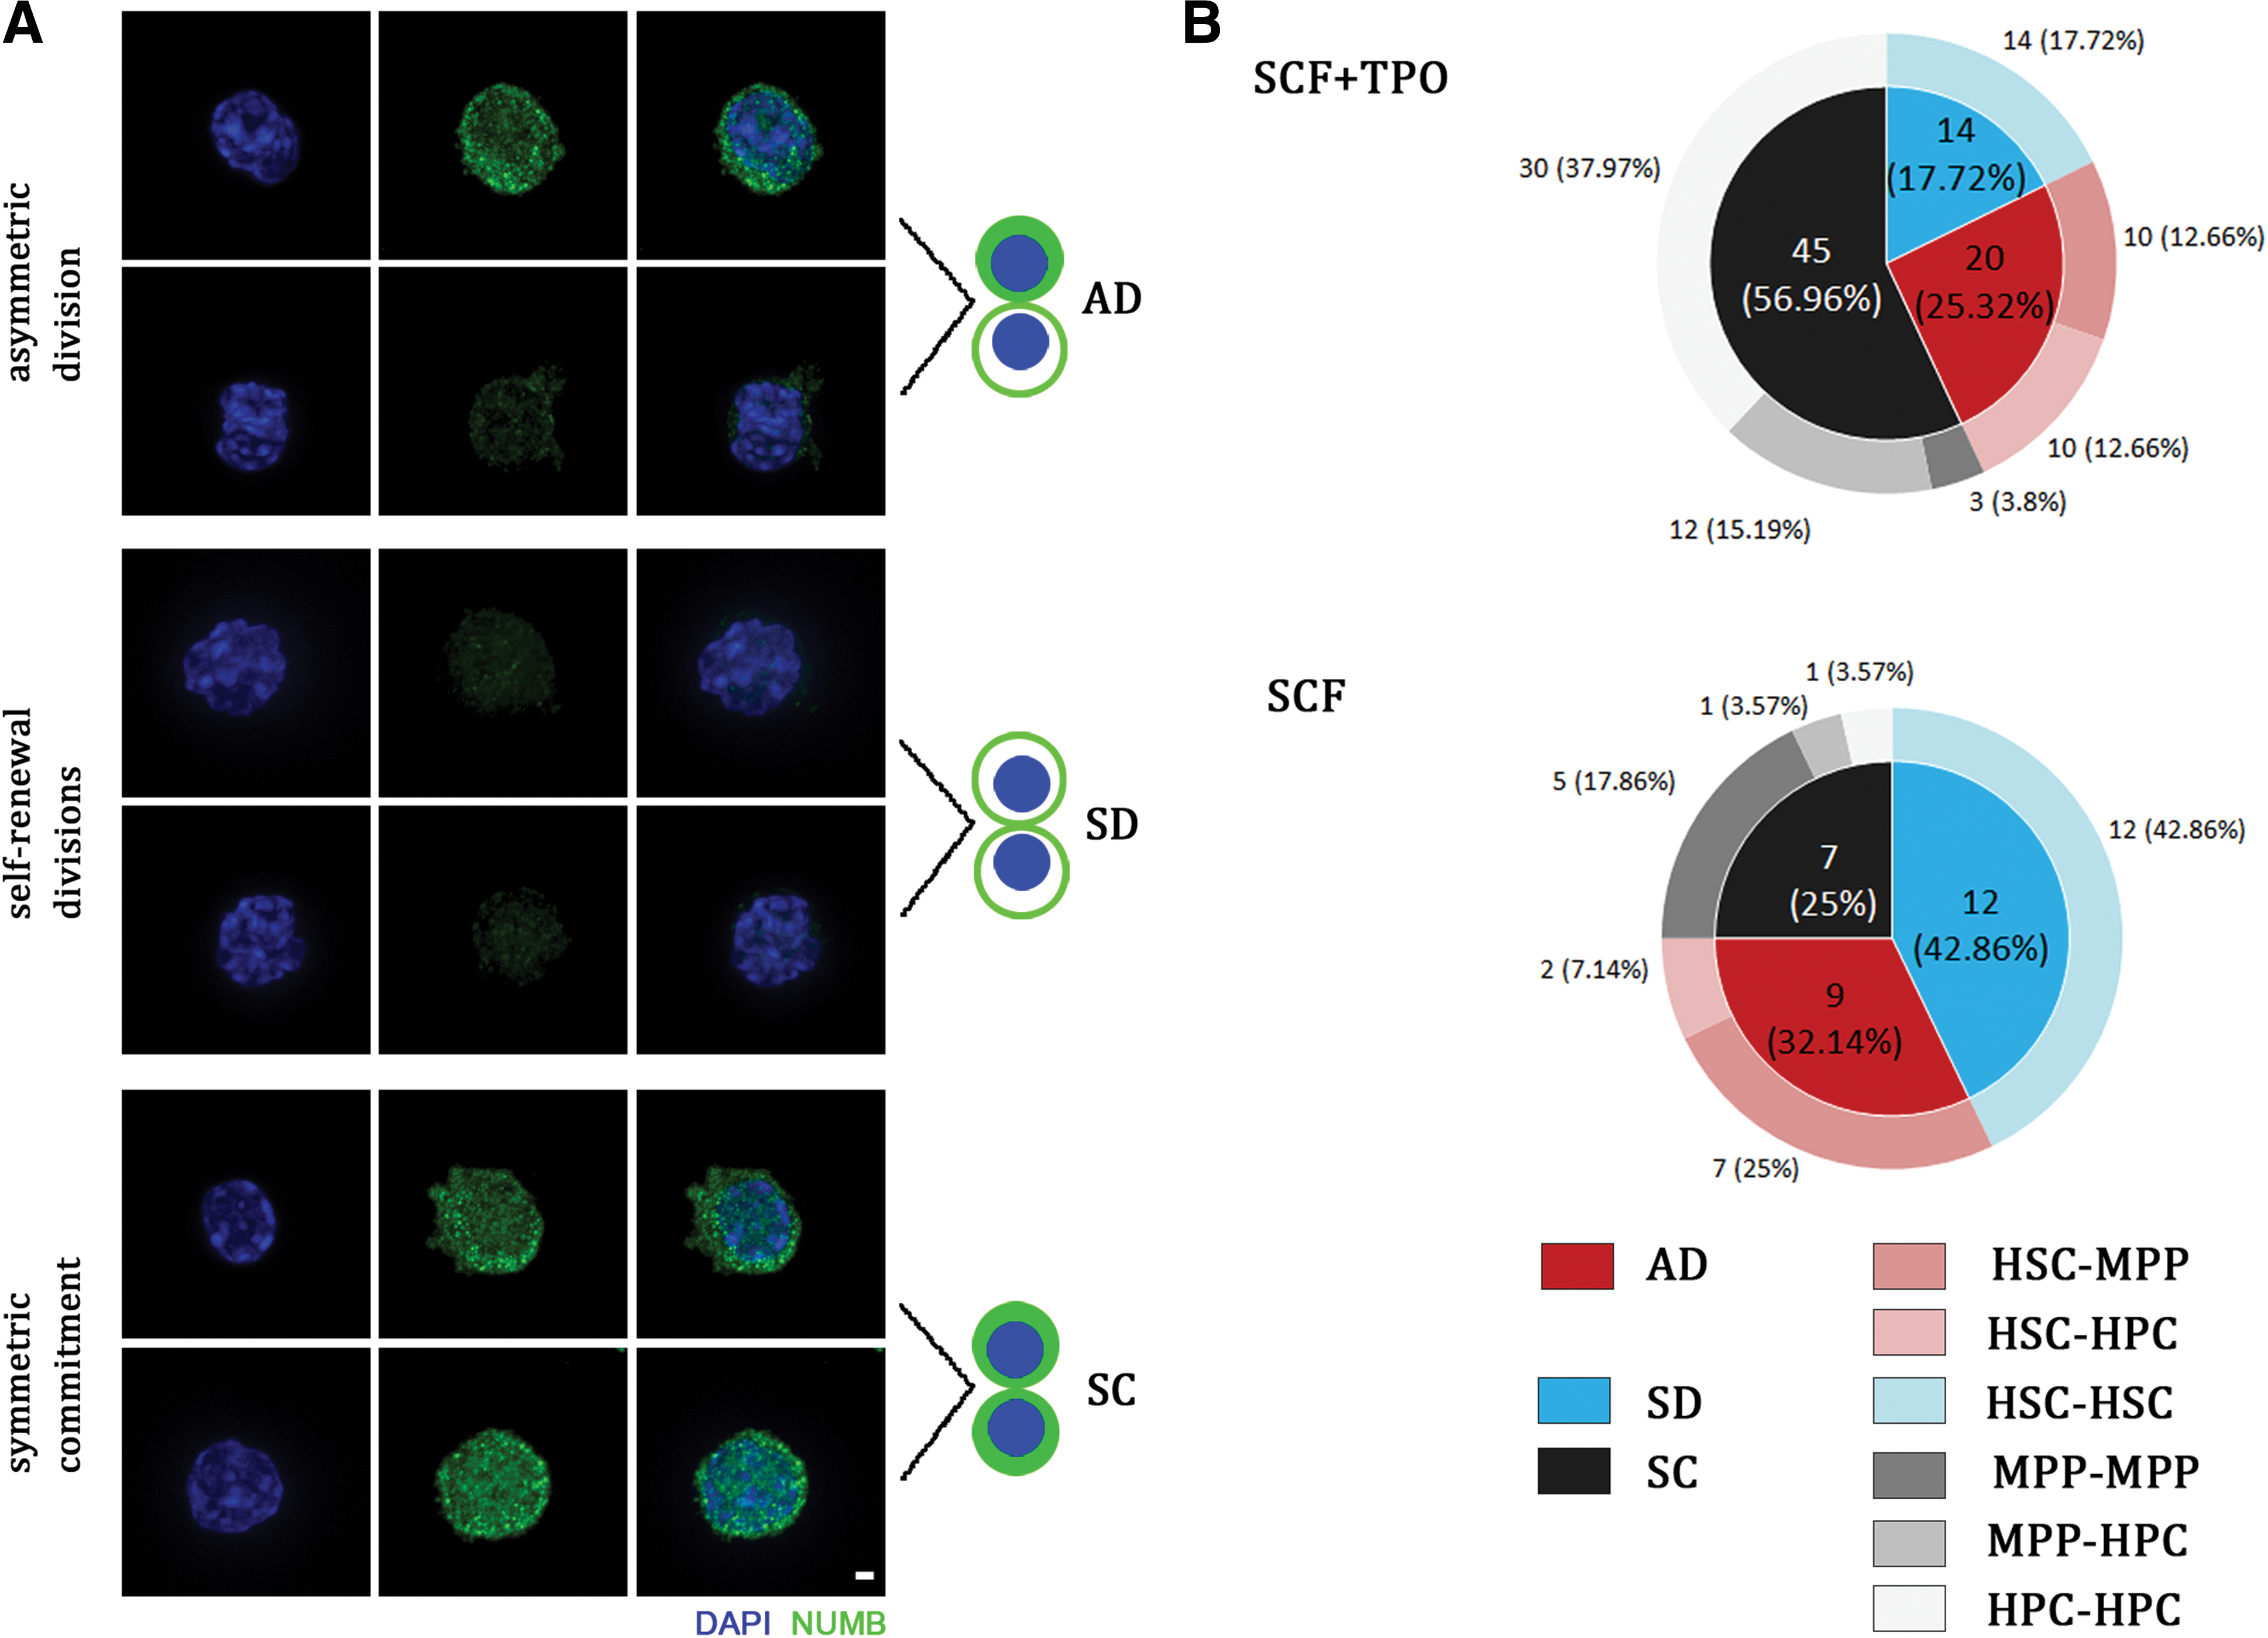
Analysis of division patterns of HSCs in vitro.
It is well known that HSCs are characterized by small size and a high nuclear/cytoplasm ratio (N/C ratio) [25]. Comparing the basic morphological features, such as size and N/C ratio of HSCs, MPPs and HPCs, we found that HSCs and MPPs exhibit more primitive morphological parameters compared with HPCs. The area of HSCs, MPPs, and HPCs are 65.00 ± 11.67 μm2, 74.96 ± 13.66 μm2, and 91.12 ± 34.38 μm2, respectively. The N/C ratio of HSCs, MPPs, and HPCs are 1.35 ± 0.34, 1.34 ± 0.35, and 1.15 ± 0.28, respectively (Fig. 4A, C). However, area and the N/C ratio cannot be used as parameters in the division pattern calculation given the lack of correlation among the phenotypes and these two morphological parameters (Fig. 4B, D). Our results indicate that upon HSCs maturity, some morphological features changed. For example, the area gradually increased, and the N/C ratio gradually decreased. However, division pattern analysis must be based on molecular markers rather than these morphological parameters.
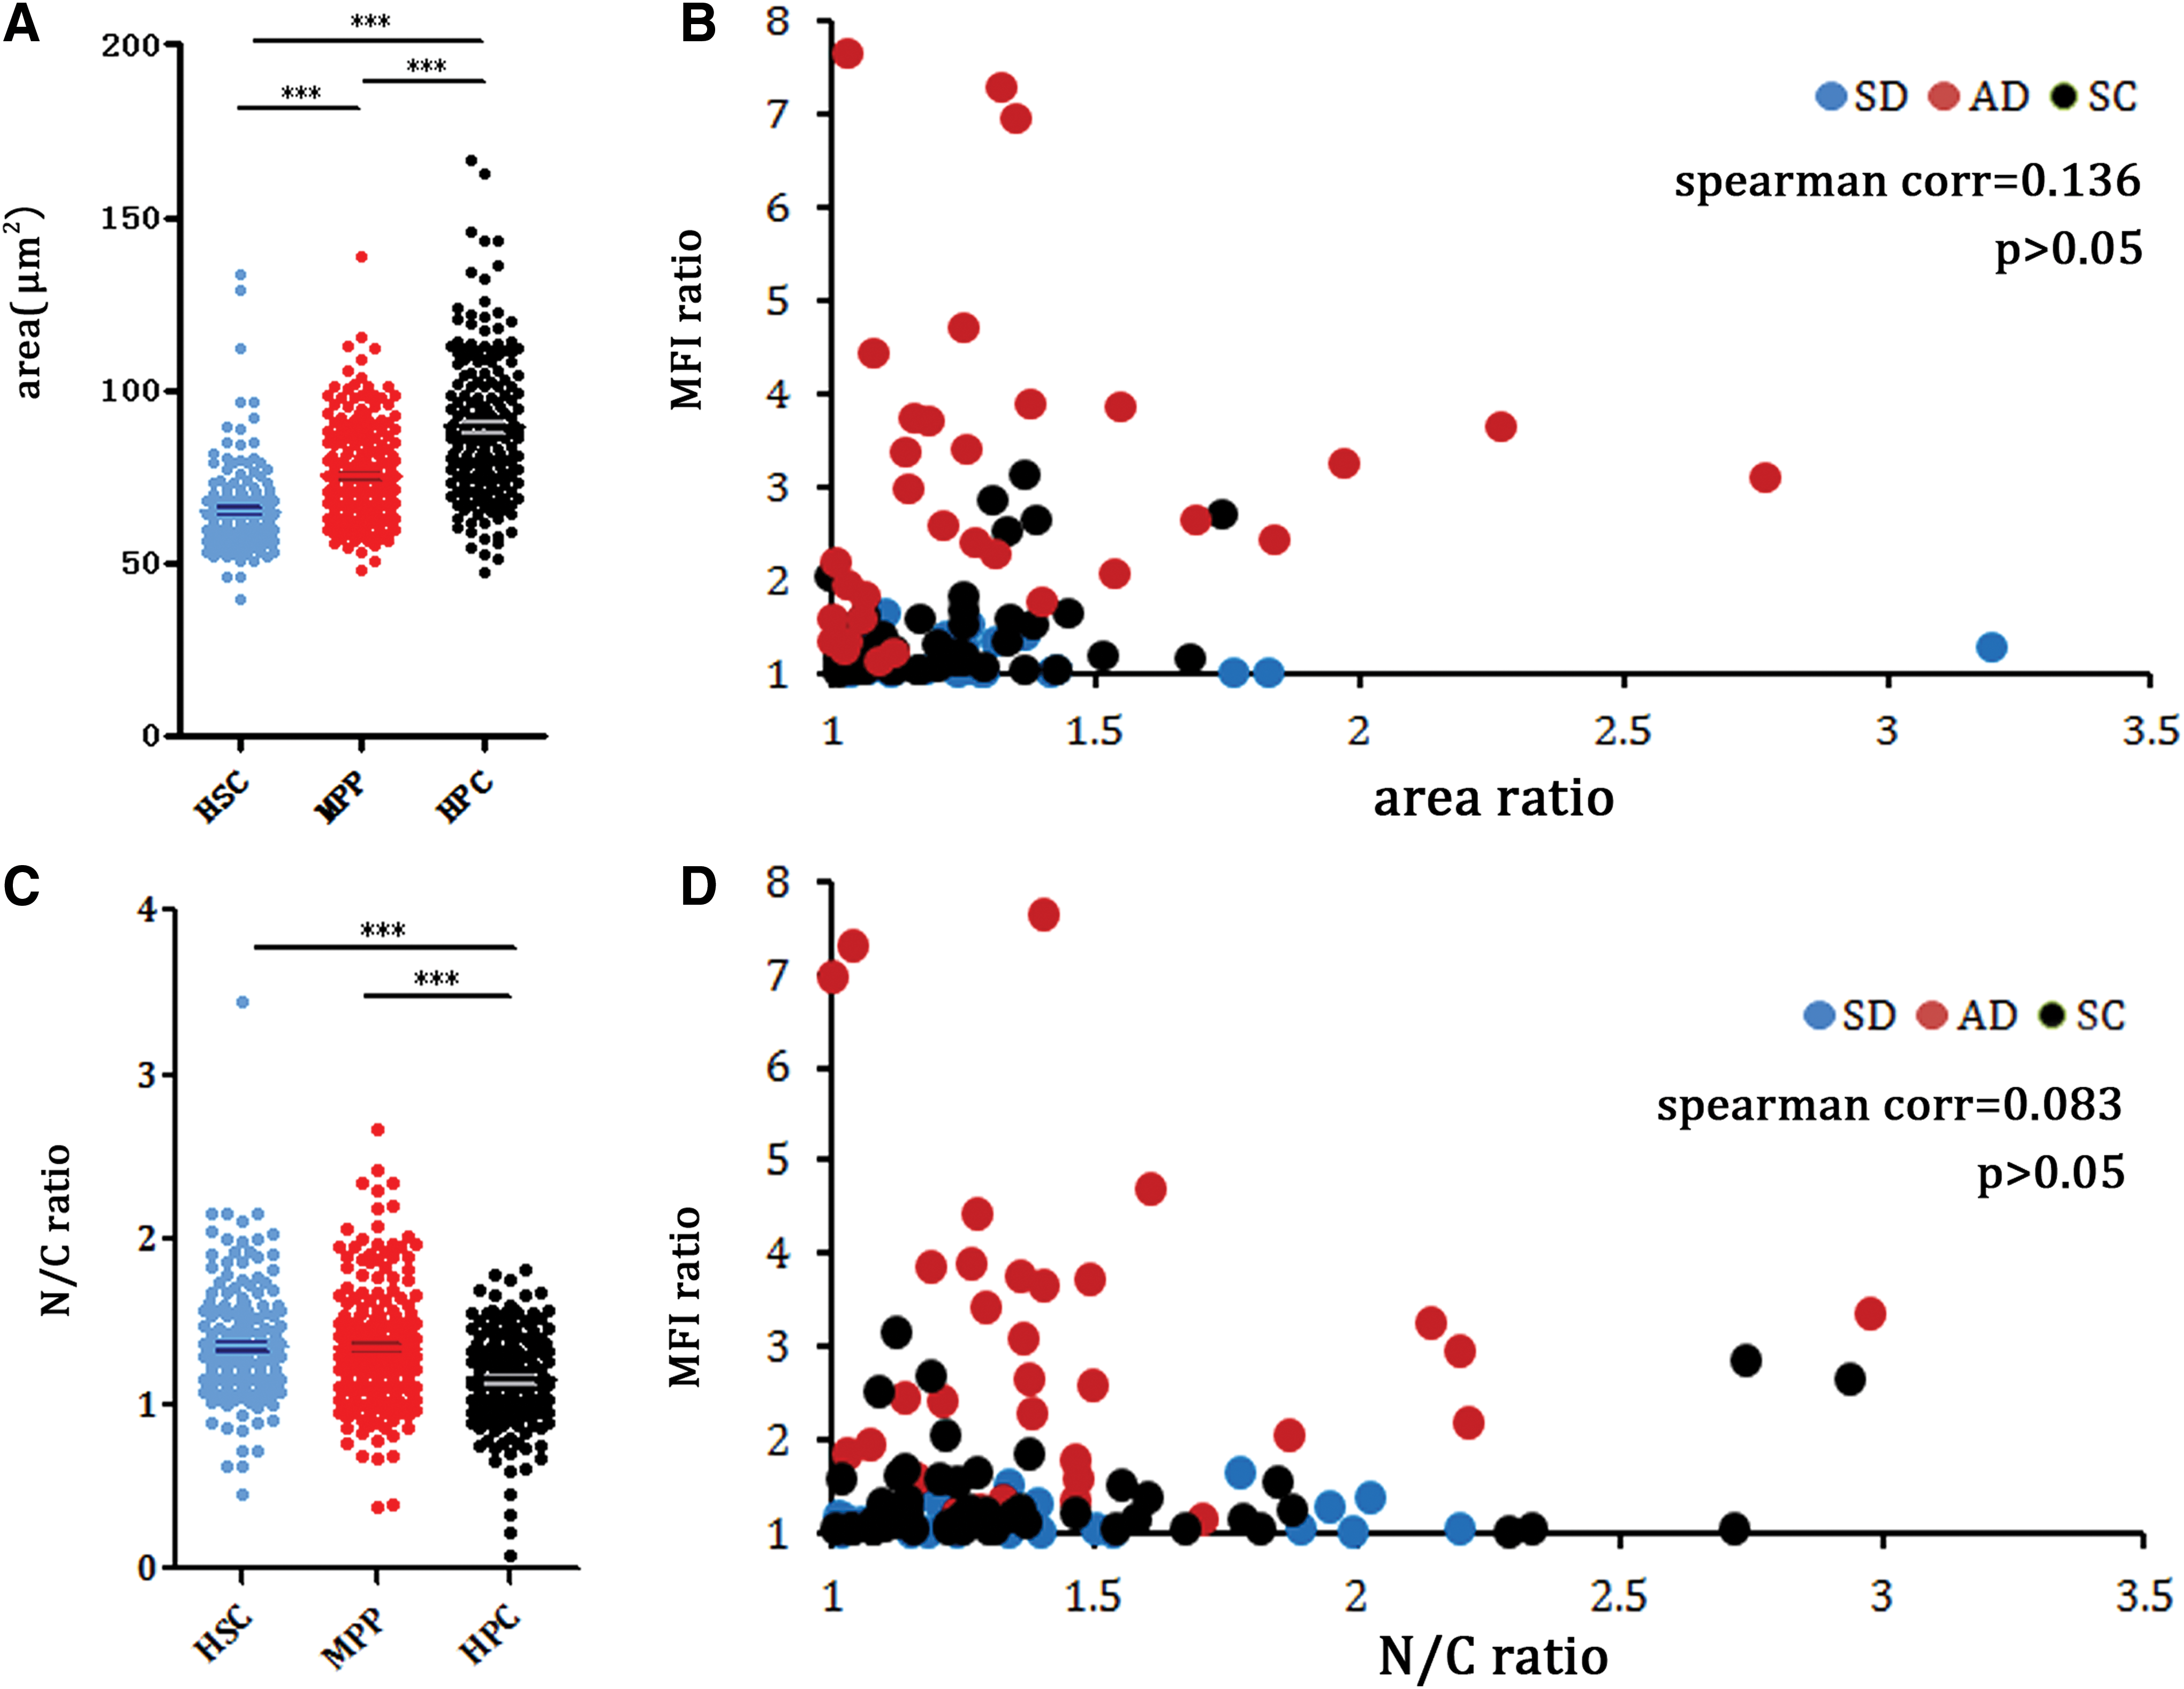
Analysis on the correlation between morphological parameters and division patterns. Mean areas
In this method, compared with a 96-well plate, a μ-slide can improve the stability of single-cell immunofluorescence (Supplementary Table S1), partly given the presence of a tiny step in the μ-slide well, which prevents misoperation. In addition, the μ-slide requires an extremely small amount of gel (only 10 μL); thus, it is easy to find two daughter cells quickly. In addition, to ensure that cells were maintained in the working distance of high numerical aperture oil-immersion 100 × objectives required for high-resolution confocal imaging, cells had to be embedded in the bottom of gel by micromanipulation and then immediately sealed with the second collagen layer. Compared with other quantitative single-cell approaches to stem cell research, this single-cell immunofluorescence method can be used to investigate and quantify the expression of various intracellular proteins and cytokines on a single-cell level, and exhibits important characteristics such as flexibility, easy operability, and inexpensiveness, which should facilitate wide application of this technique (Supplementary Table S2).
Conclusions
This single-cell immunofluorescence technique involves common procedures of cell sorting, micromanipulation, and staining. Using collagen I to fix the stem cells against the coverslip makes it possible to take pictures of every cell in 3D form. This method can be used to precisely calculate stem cells division patterns on a single-cell level and to investigate and quantify the expression of any related intracellular proteins and cytokines during this process. These advantages make the technique highly relevant for the prediction of stem cell fate before in vivo experiments are conducted.
Footnotes
Acknowledgments
We thank Hideo Ema for all his important comments and suggestions. We also thank Sen Zhang, Jinhong Wang, Shanshan Zhang, and Jinhua Liu for the help during the development of this immunofluorescence imaging method. This research was supported by the Fundamental Research Funds for the Central Universities (3332018113) and Open Project Program of State Key Laboratory of Experimental Hematology (ZZ13-05).
Author Disclosure Statement
The authors declare that there is no conflict of interests regarding the publication of this article.
Supplementary Material
Supplementary Figure S1
Supplementary Table S1
Supplementary Table S2
References
Supplementary Material
Please find the following supplemental material available below.
For Open Access articles published under a Creative Commons License, all supplemental material carries the same license as the article it is associated with.
For non-Open Access articles published, all supplemental material carries a non-exclusive license, and permission requests for re-use of supplemental material or any part of supplemental material shall be sent directly to the copyright owner as specified in the copyright notice associated with the article.