
Abstract
Interkinetic nuclear migration (INM) is a process by which nuclei oscillate between the basal and apical surfaces of epithelial cells in coordination with the cell cycle. The cytoskeletal machinery including microtubules and actin has been reported to drive apical INM; however, the role of nuclear proteins in this process has yet to be fully elucidated. Here, we investigated the function of a SUN-domain protein, Sun1, in zebrafish. We found that zebrafish sun1 is highly expressed in the ventricular zone of the brain. Knocking down sun1 with antisense morpholino oligonucleotides reduced the abundance of nestin- and gfap-expressing neural stem cells and progenitor cells. The live-cell imaging results showed that sun1 morphant cells migrated toward the basal side during the S phase but failed to migrate apically during the G2 phase. On the contrary, the passive stochastic movement during the G2 phase was unaffected. Furthermore, down regulation of sun1 was shown to reduce the expression of genes associated with the Notch pathway, whereas the expression of genes in the Wnt pathway was less perturbed. Findings from this research suggest that the Sun1-mediated nucleo-cytoskeletal interaction contributes to apical nuclear migration, and may thus affect exposure to Notch signal, thereby altering the composition of the progenitor pool in the embryonic neurogenesis of zebrafish.
Introduction
The position of the nucleus on the apical–basal axis is essential to many cellular processes such as cell fate specification [1]. During neurogenesis, the nuclei of polarized neural progenitor cells occupy various positions along the apical–basal axis of the neuroepithelia. Mitosis generally occurs close to the apical side of the tissue. After entering G1 phase, nuclei move toward the basal side, where they proceed through S phase. After this, cells move apically during G2 phase [2,3]. This process, known as interkinetic nuclear migration (INM), was first described by Sauer in 1935 [4]. Recent evidence suggests that INM is dependent on the process of nucleo-cytoskeletal coupling (ie, coupling the nucleus to cytoskeletal proteins) [5 –7]; however, the mechanisms that underlie this process have not been fully elucidated [3,8].
Sad1/UNC-84 (SUN) and Klarsicht/ANC-1/Syne/homology (KASH) protein pairs form the linker of nucleoskeleton and cytoskeleton (LINC) complex, which bridges the nucleoskeleton with cytoplasmic organelles [9 –11]. SUN-domain proteins are inserted into the inner nuclear membrane, whereupon their N-termini interact with nuclear lamins and their C-termini interact with KASH-domain proteins (eg, Syne1 and Syne2) in the perinuclear space [12]. The initial identification of the SUN domain was based on sequence alignment of Sad1 from Schizosaccharomyces pombe and UNC-84 from Caenorhabditis elegans [13]. Sad1 is a constituent of the spindle pole body, which contacts the telomere complex to form the bouquet arrangement seen in meiotic chromosomes [14]. Mps3p is a single SUN-domain protein in Saccharomyces cerevisiae that is required for nuclear envelope (NE) anchorage-dependent recombinational repair of double-stranded DNA breaks [15,16]. Previous complementation analysis of 17 unc-84 mutations in C. elegans revealed that two genetically separable functions are involved in nuclear and distal tip cell migration [13]. Matefin/SUN-1 (another SUN-domain protein in C. elegans), but not UNC-84, of C. elegans is required for attachment of the centrosome to the nucleus, despite a defect in nuclear migration was observed in unc-84 null cells [17,18]. Matefin/SUN-1 and ZYG-12 also play a conserved role in chromosome recognition and association during meiosis [19]. Another previous study determined that loss of function in the SUN-domain protein Klaroid did not affect viability or fertility of Dresophilia; however, it led to defective nuclear migration in neurons and non-neural cells that were undergoing differentiation [20].
Mammalian SUN homologs can be divided into two categories based on their localization and expression patterns. Sun1 and Sun2 are broadly distributed in mouse tissues, whereas Sun3 and Spag4 (sperm-associated antigen 4) are confined to mouse testis [10,21 –24]. Sun1 localizes to the nuclear rim in most cell types; however, in meiotic germ cells, it associates specifically with telomeres during the leptotene and diplotene stages of meiotic prophase I. Knockout of Sun1 impairs telomere attachment to the NE in mice, resulting in persistent double-strand breaks and inefficient homologous pairing or synapsis formation during meiosis [25,26]. Conversely, depletion of Sun2 did not cause meiotic failure or infertility in mice [27]. In addition, Sun1 and Sun2 play critical but partially redundant roles in the nuclear anchorage of skeletal muscle cells, INM, and radial neuronal migration during prenatal neurogenesis [27 –29]. Other previous research revealed that Sun3 helps form the sperm head by colocalizing with Spag4 and Nesprin1 to the posterior NE of spermatids [30 –32]. Together, results of these earlier studies suggest that SUN proteins have evolutionally conserved functions, which are related to the meiotic assortment of chromosomes and the positioning of the nucleus during development.
In this study, we used a zebrafish model to investigate the function of Sun1. Inhibiting sun1 expression using antisense morpholino oligonucleotides (MOs) was shown to induce considerable aberrations in embryonic neurogenesis. Cell-cycle analysis further revealed that apical nuclear migration was compromised in sun1 morphants, which appears to interfere with the expression of Notch-associated genes. These results suggest that sun1 contributes to INM and Notch signaling in the embryonic neurogenesis of zebrafish.
Materials and Methods
Animals
Zebrafish (Danio rerio) AB wild-type strain is sourced from Zebrafish International Resource Center. The transgenic strains Tg(-3.9nestin:GFP) and Tg(h2afv:GFP; EF1α:mCherry-zGem) used in this study were obtained from Strähle and colleagues and Masai and colleagues [33,34]. Zebrafish were maintained in the Zebrafish Core Facility of the National Health Research Institutes (NHRI, Taiwan) by following the regulations of the Institutional Animal Care and Use Committee (NHRI-IACUC-102101-A and NHRI-IACUC-103122-A) of NHRI, as well as AAALAC guidelines.
Cell culture
NIH3T3 cells were obtained from the American Type Culture Collection and maintained in high glucose Dulbecco's modified Eagle's medium (DMEM) (Gibco) containing 10% fetal bovine serum (Hyclone) and antibiotics.
Plasmids and mRNA preparation
Zebrafish sun1 (Sad1 and UNC-84 domain containing 1) gene from 5′UTR region (nucleotides −263 to 2,964) was amplified from total RNA of 24 hours postfertilization (hpf) AB embryos using primers: 5′-GGGGGAATTCTTTGGGATTTTCCTAGTAGTAATTGTTAGT-3′ and 5′-CGCGGATCCTTATTGAGCGTGAGGTTTGCCGTGGAC-3′. Messenger RNA of zebrafish sun1 was synthesized using mMESSAGE mMACHINE® SP6 transcription kit (Ambion), and a poly(A) tail was added using the a poly(A) polymerase (Fermentas). To construct the expression plasmid of zebrafish Sun1, the PCR product of zebrafish sun1 (nucleotides 1–2,964) amplified using primers: 5′-GGGGGAATTCATGGATTTTTCCCGTCTGCACACGTAC-3′ and 5′-CGCGGATCCTGATTGAGCGTGAGGTTTGCCGTGGAC-3′, was cloned in vector pcDNA3.1(−) (Invitrogen). The nucleotide sequence of EGFP was amplified from pEGFP-C1 (Clontech), and inserted in 3′ end of zebrafish sun1 gene cloned in pcDNA3.1(−).
Morpholino and mRNA microinjection
Antisense MOs that target the ATG initiation site of zebrafish sun1 (5′-AAATCCATGGTGACGCGCTGAGCTC-3′), a mismatch morpholino (5′-AAATCGATCGTGACCCGGTCAGCTC-3′), and antisense MOs target zebrafish p53 (5′-GCGCCATTGCTTTGCAAGAATTG-3′) were ordered from GENE TOOLS. Embryos were injected with the morpholinos or coinjected with sun1 mRNA at one-cell stage. Embryos were injected with an escalating dosage of mopholinos, and the maximal dosage that did not cause an overall toxicity to the embryos was determined as the final working dosage.
Quantitative real-time polymerase chain reaction
Total RNAs were isolated from zebrafish embryos using RNeasy mini Kit (Qiagen) according to the manufacturer's protocol. The extracted total RNAs were reverse transcribed using Superscript III reverse transcriptase (Invitrogen). Quantitative PCRs were performed using SYBR Green on a StepOne real-time PCR system (Applied Biosystems). Primer sets used for real-time polymerase chain reaction (RT-PCR) are listed in Supplementary Table S1. Specificity of the primers was determined by gel electrophoresis to ensure a single band in the PCR products. Fold change in the expression of the target genes in sun1 morphants relative to control was calculated as 2−(ΔCTsun1 − ΔCTcontrol).
Whole-mount in situ hybridization and tissue sections
Whole-mount in situ hybridization (WISH) was performed as described [35,36]. Embryos were mounted in 95% glycerol (Sigma-Aldrich)/phosphate-buffered saline (PBS) with 0.1% Tween20. Tissue sections (50 μm) were prepared by a Leica Vibratome (Leica). Images were captured by Zeiss Axio Scope.A1 microscope (Zeiss). Antisense mRNA probes for WISH were labeled with digoxigenin (Roche). The templates of sun1, nestin, gfap, jagged 1a, and nrarp-a were generated by PCR. Primers used in PCR for cloning the plasmids are listed in Supplementary Table S2. The templates of ascl1b and huc were generated by PCR with primers containing T7 promoter as listed in Supplementary Table S2. The templates of deltaA and notch3 are generous gifts obtained from Appel and colleagues and Lewis and colleagues [37,38]. Double fluorescent WISH for deltaA and nrarp-a was performed by following the protocol modified from Lauter et al. [39].
Terminal deoxynucleotidyl transferase dUTP nick-end labeling assay
Terminal deoxynucleotidyl transferase dUTP nick-end labeling (TUNEL) assay was performed using ApopTag® In Situ Apoptosis Detection Kit according to the manufacturer's protocol (Millipore; #S7160). In brief, embryos were fixed with 1% paraformaldehyde (PFA) in PBS overnight at 4°C. Embryos were postfixed with precooled ethanol:acetic acid 2:1, and were placed in TdT labeling solution in a humidified chamber for 2 h at 37°C. Nuclei of the embryos were counterstained with Hoechst 33342 overnight at 4°C. TUNEL-positive cells were imaged using a Leica TCS SP5 confocal microscope equipped with HyD detectors (Leica). Number of apoptotic cells was quantified using MetaMorph® microscopy automation and image analysis software (Molecular Devices).
Immunofluorescence and confocal microscopy
Cells/embryos transfected or injected with pcDNA3.1(−)-zSun1-EGFP expression plasmid were fixed with 4% PFA for 30 min at room temperature. After permeabilization with 0.1%–0.5% Triton X-100, cells/embryos were incubated with 1% bovine serum albumin in PBS for 30 min at room temperature to avoid nonspecific bindings. The mouse anti-EGFP (Millipore) primary antibody was applied to the cells/embryos, and an Alexa-488-conjugated secondary antibody (Molecular Probes) was used for immunofluorescent detection. Nuclei were stained with Hoechst 33342 (Molecular Probes). Cells were mounted on glass slides with ProLong Gold antifade reagent (Invitrogen). Fluorescent images were monitored using a Leica TCS SP5 confocal microscope (Leica). For live zebrafish confocal imaging, embryos were mounted in agarose on 35-mm glass bottom dishes (Nunc), which were placed in a humidified chamber maintained at 28°C. Images were processed using Imaris 7.2 and Imaris 8.4 softwares (Bitplane).
Statistical analysis
Statistical differences were analyzed using Student's t-test. In all cases, the criterion for significance (P value) was set as described in the figures.
Results
Zebrafish Sun1 localizes to the NE
Earlier studies reported that mammalian SUN-domain proteins functionally complement each other in neurogenesis and myogenesis. However, the function of SUN-domain proteins in other vertebrates had not yet been fully explored. Sun1 is the only annotated SUN-domain protein in zebrafish according to the Zebrafish Information Network. Aligning the protein sequences of zebrafish (i.e., D. rerio) Sun1 (zSun1, NM_001018135.2) with mouse and human counterparts revealed that the C-terminal SUN domain is >90% conserved between these species (Fig. 1A). The first 60 amino acids that contain nucleus-targeting sequences and the three transmembrane domains were also found to be conserved [40], with these sequences exhibiting >90% homology (Fig. 1A). To characterize the subcellular localization of zSun1, we injected a plasmid expressing GFP-zSun1 into one-cell embryos and performed confocal imaging at 24 hpf. Similar to mammalian Sun1 [40], zSun1 was shown to localize to the nuclear periphery in all examined cell types, including neuroepithelial cells and otic epithelium cells (Fig. 1B). We also examined zSun1 localization in mouse embryonic cell line NIH3T3, and observed that zSun1 is colocalized with lamin B1 at the nuclear periphery (Fig. 1C). These results indicate that the NE-targeting sequence in zebrafish has been preserved during evolution.
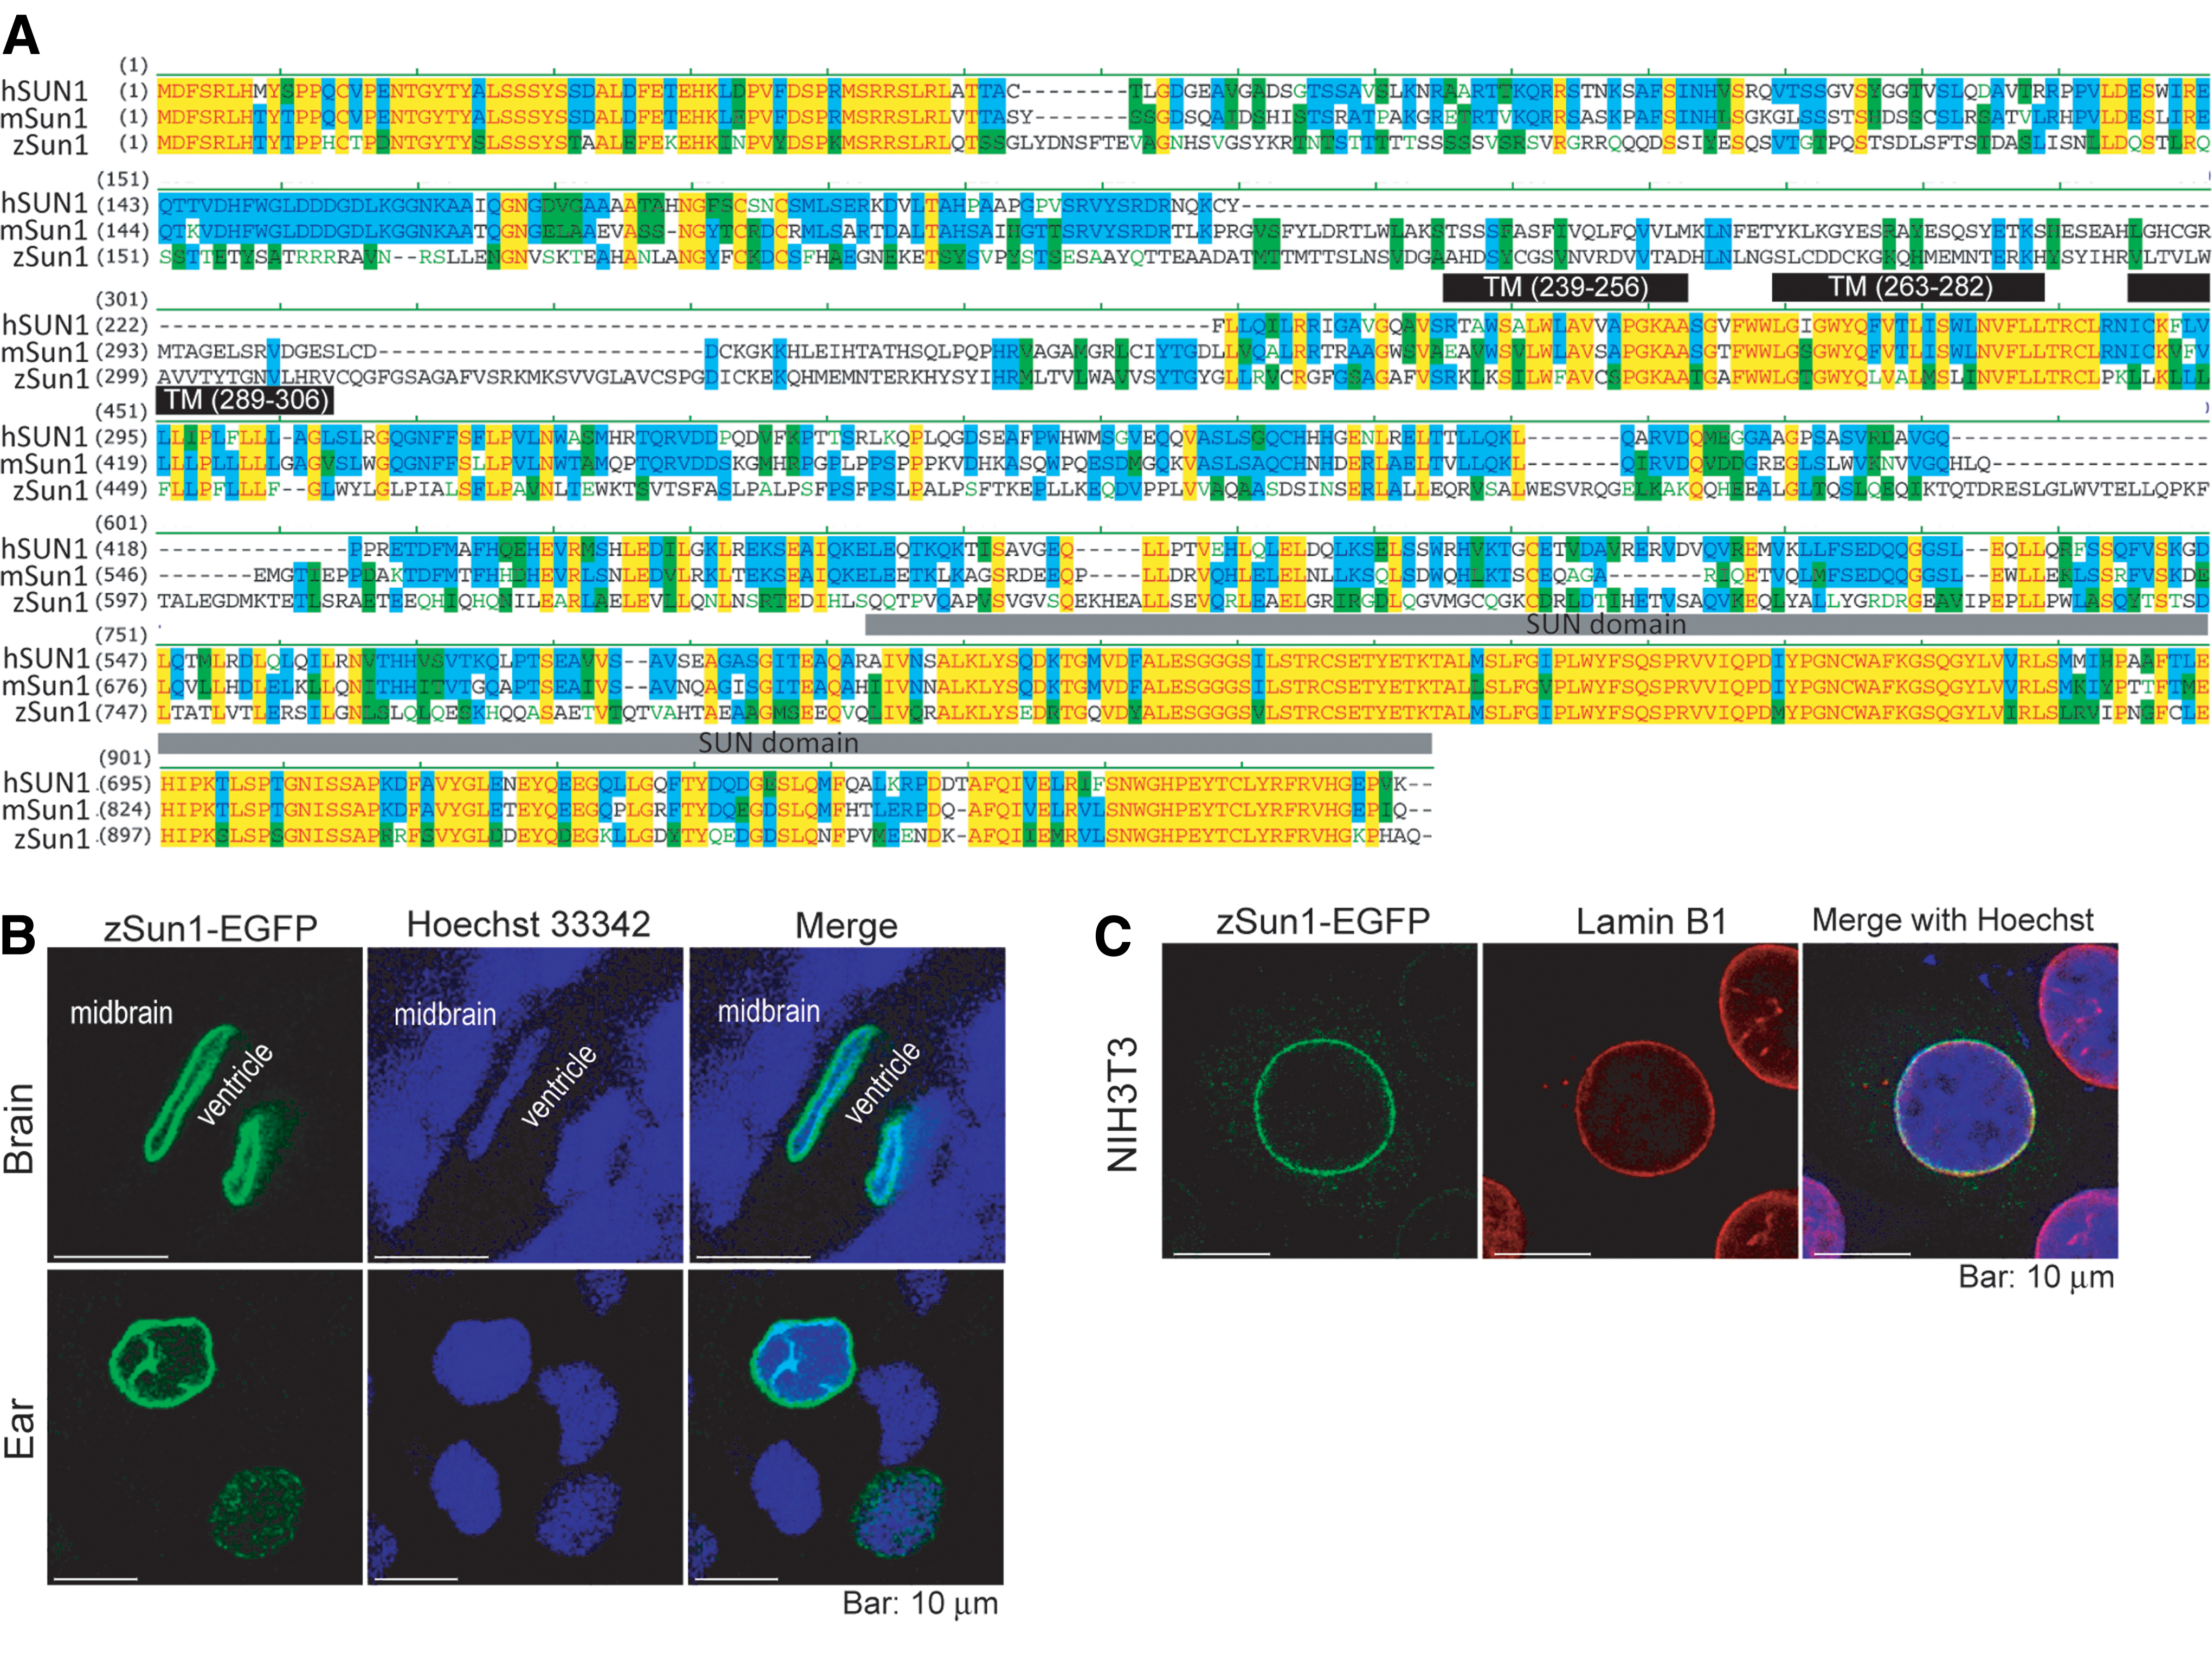
Sequence and subcellular localization of zebrafish Sun1.
The sun1 gene is required for neurogenesis in the brain of zebrafish
We began our investigation into the developmental role of sun1 in zebrafish based on its expression pattern during the embryonic development. Results of semiquantitative reverse transcription followed by PCR indicate that sun1 is supplied maternally, and gradually decreases between 0 and 8 hpf. The expression of sun1 begins to increase from 10 hpf, and reaches a plateau between 24 and 120 hpf (Fig. 2A). Whole-mount in situ analysis and observations of tissue sections further revealed that, at 24 hpf, sun1 is highly expressed in the ventricular zones (VZs) of the forebrain and midbrain, and is widely expressed throughout the developing central nervous system (Fig. 2B, C and Supplementary Fig. S1). However, at 36 hpf, sun1 expression became increasingly restricted to the VZ (Fig. 2B). The expression of sun1 was also observed in the retinal ganglion cell layer of the retina at 48 hpf (Fig. 2C).
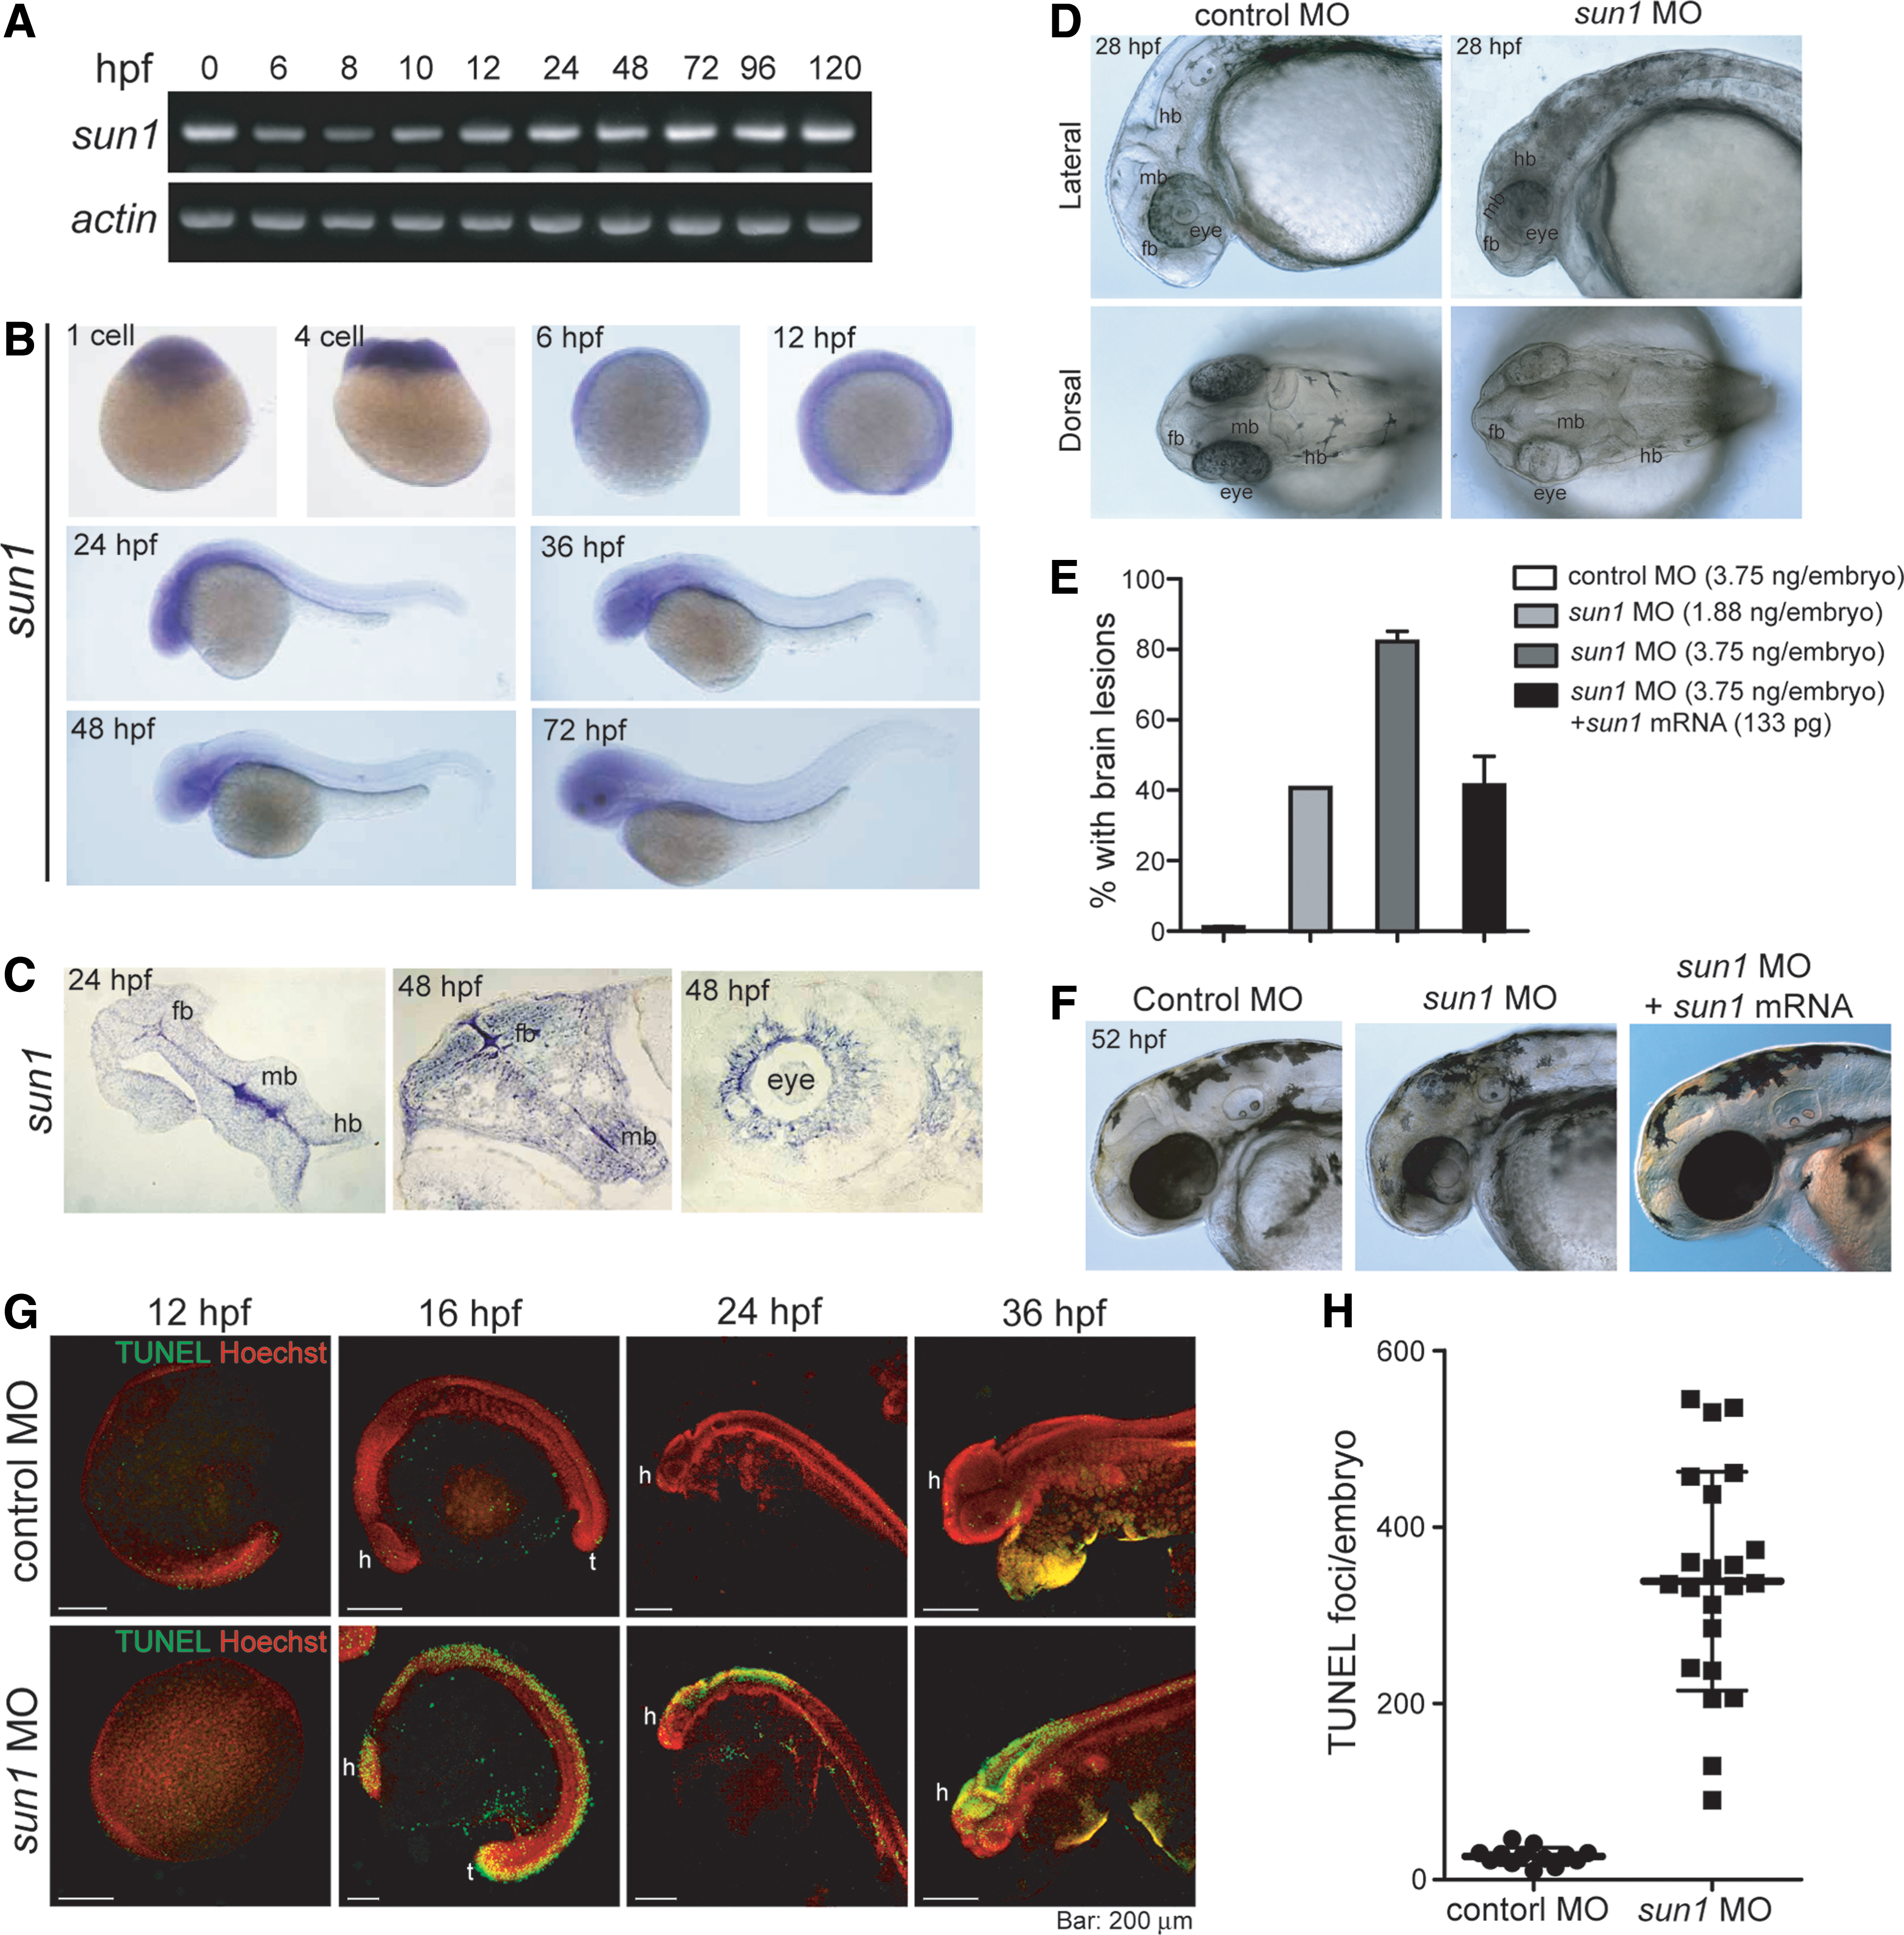
Sun1 knockdown in zebrafish embryos resulted in brain lesions.
To determine the physiological function of sun1, we knocked down sun1 levels using an antisense MOs, which block the ribosome binding site initiating ATG translation. Compared with mismatch control morphants, sun1 morphants presented notable dose-dependent signs of developmental aberrancies in the telencephalon, diencephalon, mesencephalon, and rhombencephalon of the brain (Fig. 2D, E). Furthermore, we consistently observed that ∼80% of embryos that had been injected with 3.75 ng sun1 MO developed gross brain lesions (Fig. 2E). To determine the specificity of the sun1 MO, we then coinjected a full-length sun1 mRNA into embryos, which resulted in reduced severity of brain lesions (Fig. 2E, F).
TUNEL assays were subsequently conducted to identify cell apoptosis induced by sun1 knockdown. Consistent with our macroscopic observations (Fig. 2D, E), apoptotic cells primarily appeared in the neural tube of sun1 morphants between 16 and 36 hpf (Fig. 2G, H). It is worth noting that at 12 hpf, the sun1 morphant cells were negative for TUNEL staining (Fig. 2G), which suggests that zSun1 is important to the neurogenesis of developing zebrafish after 12 hpf (corresponding with the six-somite stage).
We next examined whether sun1 MO-induced cell death is dependent on the expression of p53. After the coinjection of the sun1 MO in conjunction with a p53 MO [41], a slight reduction in cell death was observed (Supplementary Fig. S2A, B); however, the TUNEL-positive signals in the neural tube remained (Supplementary Fig. S2A). Furthermore, coinjection of p53 MO did not rescue the expression of the neuronal marker huc (Supplementary Fig. S2C). These findings suggest that a p53-independent defect is associated with neuronal survival upon loss of zSun1.
Sun1 depletion reduces the proliferation of neural stem cells and precursor cells
We next sought to identify the neural lineages affected by sun1 depletion. In zebrafish, expression of the intermediate neurofilament nestin gene serves as a marker for stem cells and proliferating precursors in the developing embryonic nervous system [42]. Zebrafish gfap is expressed in radial glial-like cells that give rise to transit-amplifying progenitors [34]; and ascl1b is expressed in proneural cells [43]. Results of whole-mount in situ analysis revealed that expression levels of nestin, gfap, and ascl1b were reduced in sun1 morphants (Fig. 3A). These results were verified using quantitative RT-PCR (qRT-PCR), which confirmed that the expression of nestin, gfap, and ascl1b was significantly decreased by sun1 depletion (Fig. 3B).

Proliferation of neural stem cells and progenitor cells is defective in Sun1 morphants.
The green-fluorescent protein (GFP) expressing tg[-3.9nestin:GFP] transgenic line is driven by a 3.9-kb upstream sequence and the promoter of the nestin gene. In this transgenic line, GFP expression was observed in both cycling cells and self-renewing progenitors, which is similar to previous results observed in neural stem cells [34]. To examine the sun1-associated proliferation of neural stem cells in real time, we recorded fluorescent signals in the tg[-3.9nestin:GFP] transgenic controls and sun1 morphants. At the 21-somite stage, in both the control and sun1 morphant, most of the GFP signals were detected in the neural tube of the posterior trunk (Fig. 3C). A minor GFP signal was detected in the VZ of the midbrain (indicated by arrow heads) and in the eye of control zebrafish; however, GFP signals were barely detected in sun1 morphants. As embryonic development proceeded through later stages, fluorescence in the midbrain and neural tube accumulated much more rapidly in the control zebrafish than in the sun1 morphants (Fig. 3C). These results indicate that sun1 is involved in the expansion of neural stem cells in the brain.
Sun1 morphants present defective apical migration during the G2 phase
Sun1 has been reported involving in nuclear anchorage and nuclear migration in a number of species [21,23,27 –29]. Our results suggest that sun1 depletion affects the proliferation of neural stem cells in zebrafish (Fig. 3). The proliferation of neural stem cells requires that nuclei move between the apical- and basal sides of neuralepithelia in coordination with the cell cycle (ie, INM); therefore, we investigated the relationship between the positioning of the nuclei and various phases of the cell cycle in both control fish and sun1 morphants. The double transgenic fish line, Tg(h2afv:GFP; EF1α:mCherry-zGem) [33], enabled us to visualize and differentiate among G1, S, G2, and M phases using live confocal microscopy. This double transgenic fish line expresses zebrafish H2avD (a variant of Histone H2A), which is tagged with GFP at the C-terminus, and also expresses the cell-cycle regulator Geminin, which is tagged with mCherry and is controlled by the EF1α promoter. H2A-GFP localizes to the nucleus and is expressed in all cells. mCherry-zGem is not expressed during the G1 phase and is expressed relatively weakly at the beginning of the S phase. However, the expression of this protein gradually increased to a plateau at the end of the S phase (Fig. 4A) [33]. When the fluorescent signals from GFP (pseudocolored green) and mCherry (pseudocolored red) were overlapped, green staining indicated that cells were in the G1 phase; yellow or light orange staining indicated that cells were in the S phase; and dark orange staining indicated that cells were in the late S or G2 phase (in this study, we labeled all dark orange cells as being in the G2 phase) [33]. In cases where high levels of mCherry and condensed GFP were observed, cells were considered to be in the M phase (Fig. 4A, B) [33].

Apical migration during interkinetic nuclear migration is defective in Sun1 morphants.
We conducted live-cell imaging of neuroepithelia from untreated or sun1 MO-treated Tg(h2afv:GFP; EF1α:mCherry-zGem) transgenic zebrafish from 16 to 18–19 hpf at intervals of 5 min (Supplementary Videos S1 and S2). Intriguingly, the nuclei of sun1 morphants were significantly more elongated than the nuclei of control zebrafish (Fig. 4B). After live-cell imaging, we compared the ratio of cells in each phase of the cell cycle at 16 and 18 hpf. The results revealed that 59.4% (n = 271) of cells in control zebrafish were in the S, G2, or M phase at 16 hpf, which demonstrates a high level of cell proliferation in the brain. The rate of proliferation was lower at 18 hpf than at 16 hpf, with the combined percentage of S, G2, and M cells dropping to 38.1% (n = 333). Specifically, we observed a drop in the number of cells in the G2 (8.5% at 16 hpf vs. 3.6% at 18 hpf) and M (6.3% at 16 hpf vs. 1.2% at 18 hpf) phases (Fig. 4C).
In terms of cell-cycle phenotype, the percentage of proliferating sun1 morphant cells was 35.4 at 16 hpf, which was less than the control. This level was maintained until at least 18 hpf, with 39.2% of cells in the S, G2, or M phase (Fig. 4C). Furthermore, unlike the control, which showed a lower number of cells in the G2 phase at 18 hpf than at 16 hpf, the number of sun1 morphant cells in the G2 phase at 18 hpf (11.5%) exceeded the number at 16 hpf (7.6%). Considerable levels of apoptosis were observed in sun1 morphant cells (Fig. 4A), and this observation is consistent with the results shown in Fig. 2G.
We next followed the positioning of cell nuclei in neuroepithelia during various cell-cycle stages. In control Tg(h2afv:GFP; EF1α:mCherry-zGem) zebrafish, cells first underwent INM (which involves basalward movement in the S phase and apicalward movement in the G2 phase) [44] before dividing at the VZ of neuroepithelia (Fig. 4D and Supplementary Video S1). Images of sun1 morphants revealed that all cells had entered the S phase and moved toward the basal side of neuroepithelia. However, upon entering the G2 phase, ∼67% (8 of 12) of sun1 morphant cells failed to move apicalward and succumbed to death (Fig. 4D and Supplementary Video S2).
Results of live-cell imaging were used to generate trajectories of the nucleus. We then measured mobility of the nucleus in the control and in sun1 morphant cells during the S and G2 phases. In mice, Sun1 is involved in postmitotic nuclear migration and INM during neurogenesis [27,28]; therefore, we expected to observe a reduction in the mobility of sun1 morphant cells. Contrary to this prediction, sun1 morphant cells in the S phase presented speed (ie, length of path/time interval, n = 251, 0.007734 ± 0.001872 μm/s), which exceeded that of control cells (n = 252, 0.006315 ± 0.001560 μm/s); however, the velocity (ie, displacement/time interval) of sun1 morphants did not differ from that of the control (0.003101 ± 0.001707 μm/s in sun1 morphant cells vs. 0.002876 ± 0.001599 μm/s in control cells; Fig. 4E, F). In the G2 phase, the speed of sun1 morphant cells (n = 28, 0.007225 ± 0.001883 μm/s) was similar to that of control cells (n = 26, 0.007552 ± 0.001940 μm/s), but the velocity was significantly lower (P < 0.014) (0.002615 ± 0.001165 μm/s in sun1 morphant cells vs. 0.003840 ± 0.001490 μm/s in control cells; Fig. 4E, F). Taken together, these results indicate that, in zebrafish, Sun1 may have different effects on basalward and apicalward migration. During the S phase, when nuclei move to the basal side, sun1 morphant cells are able to migrate to their destination; however, they may require additional steps (ie, an increase in the total length they traverse). In comparison, during the G2 phase, sun1 morphant cells remained mobile but failed to perform apical migration.
Notch signaling is perturbed in sun1 morphants
The Notch and Wnt signaling pathways are crucially important to the process of neurogenesis and the self-renewal of neural stem cells [45]. To determine whether sun1 is involved in these two signaling pathways, we employed qRT-PCR to characterize the expression of Notch-associated genes, such as hey1, jagged 1a, nrarp-a, and notch3; and of Wnt-associated genes, such as lef1, sox4a, cnntb1, and cdh1. Results of this analysis showed that these Notch-associated genes were down regulated >2-fold in sun1 morphants at 28 hpf (Fig. 5A), whereas the genes associated with the Wnt pathway were less affected (Fig. 5B). The expression profile of Notch-associated genes was further verified by whole-mount in situ analysis (Fig. 5C).
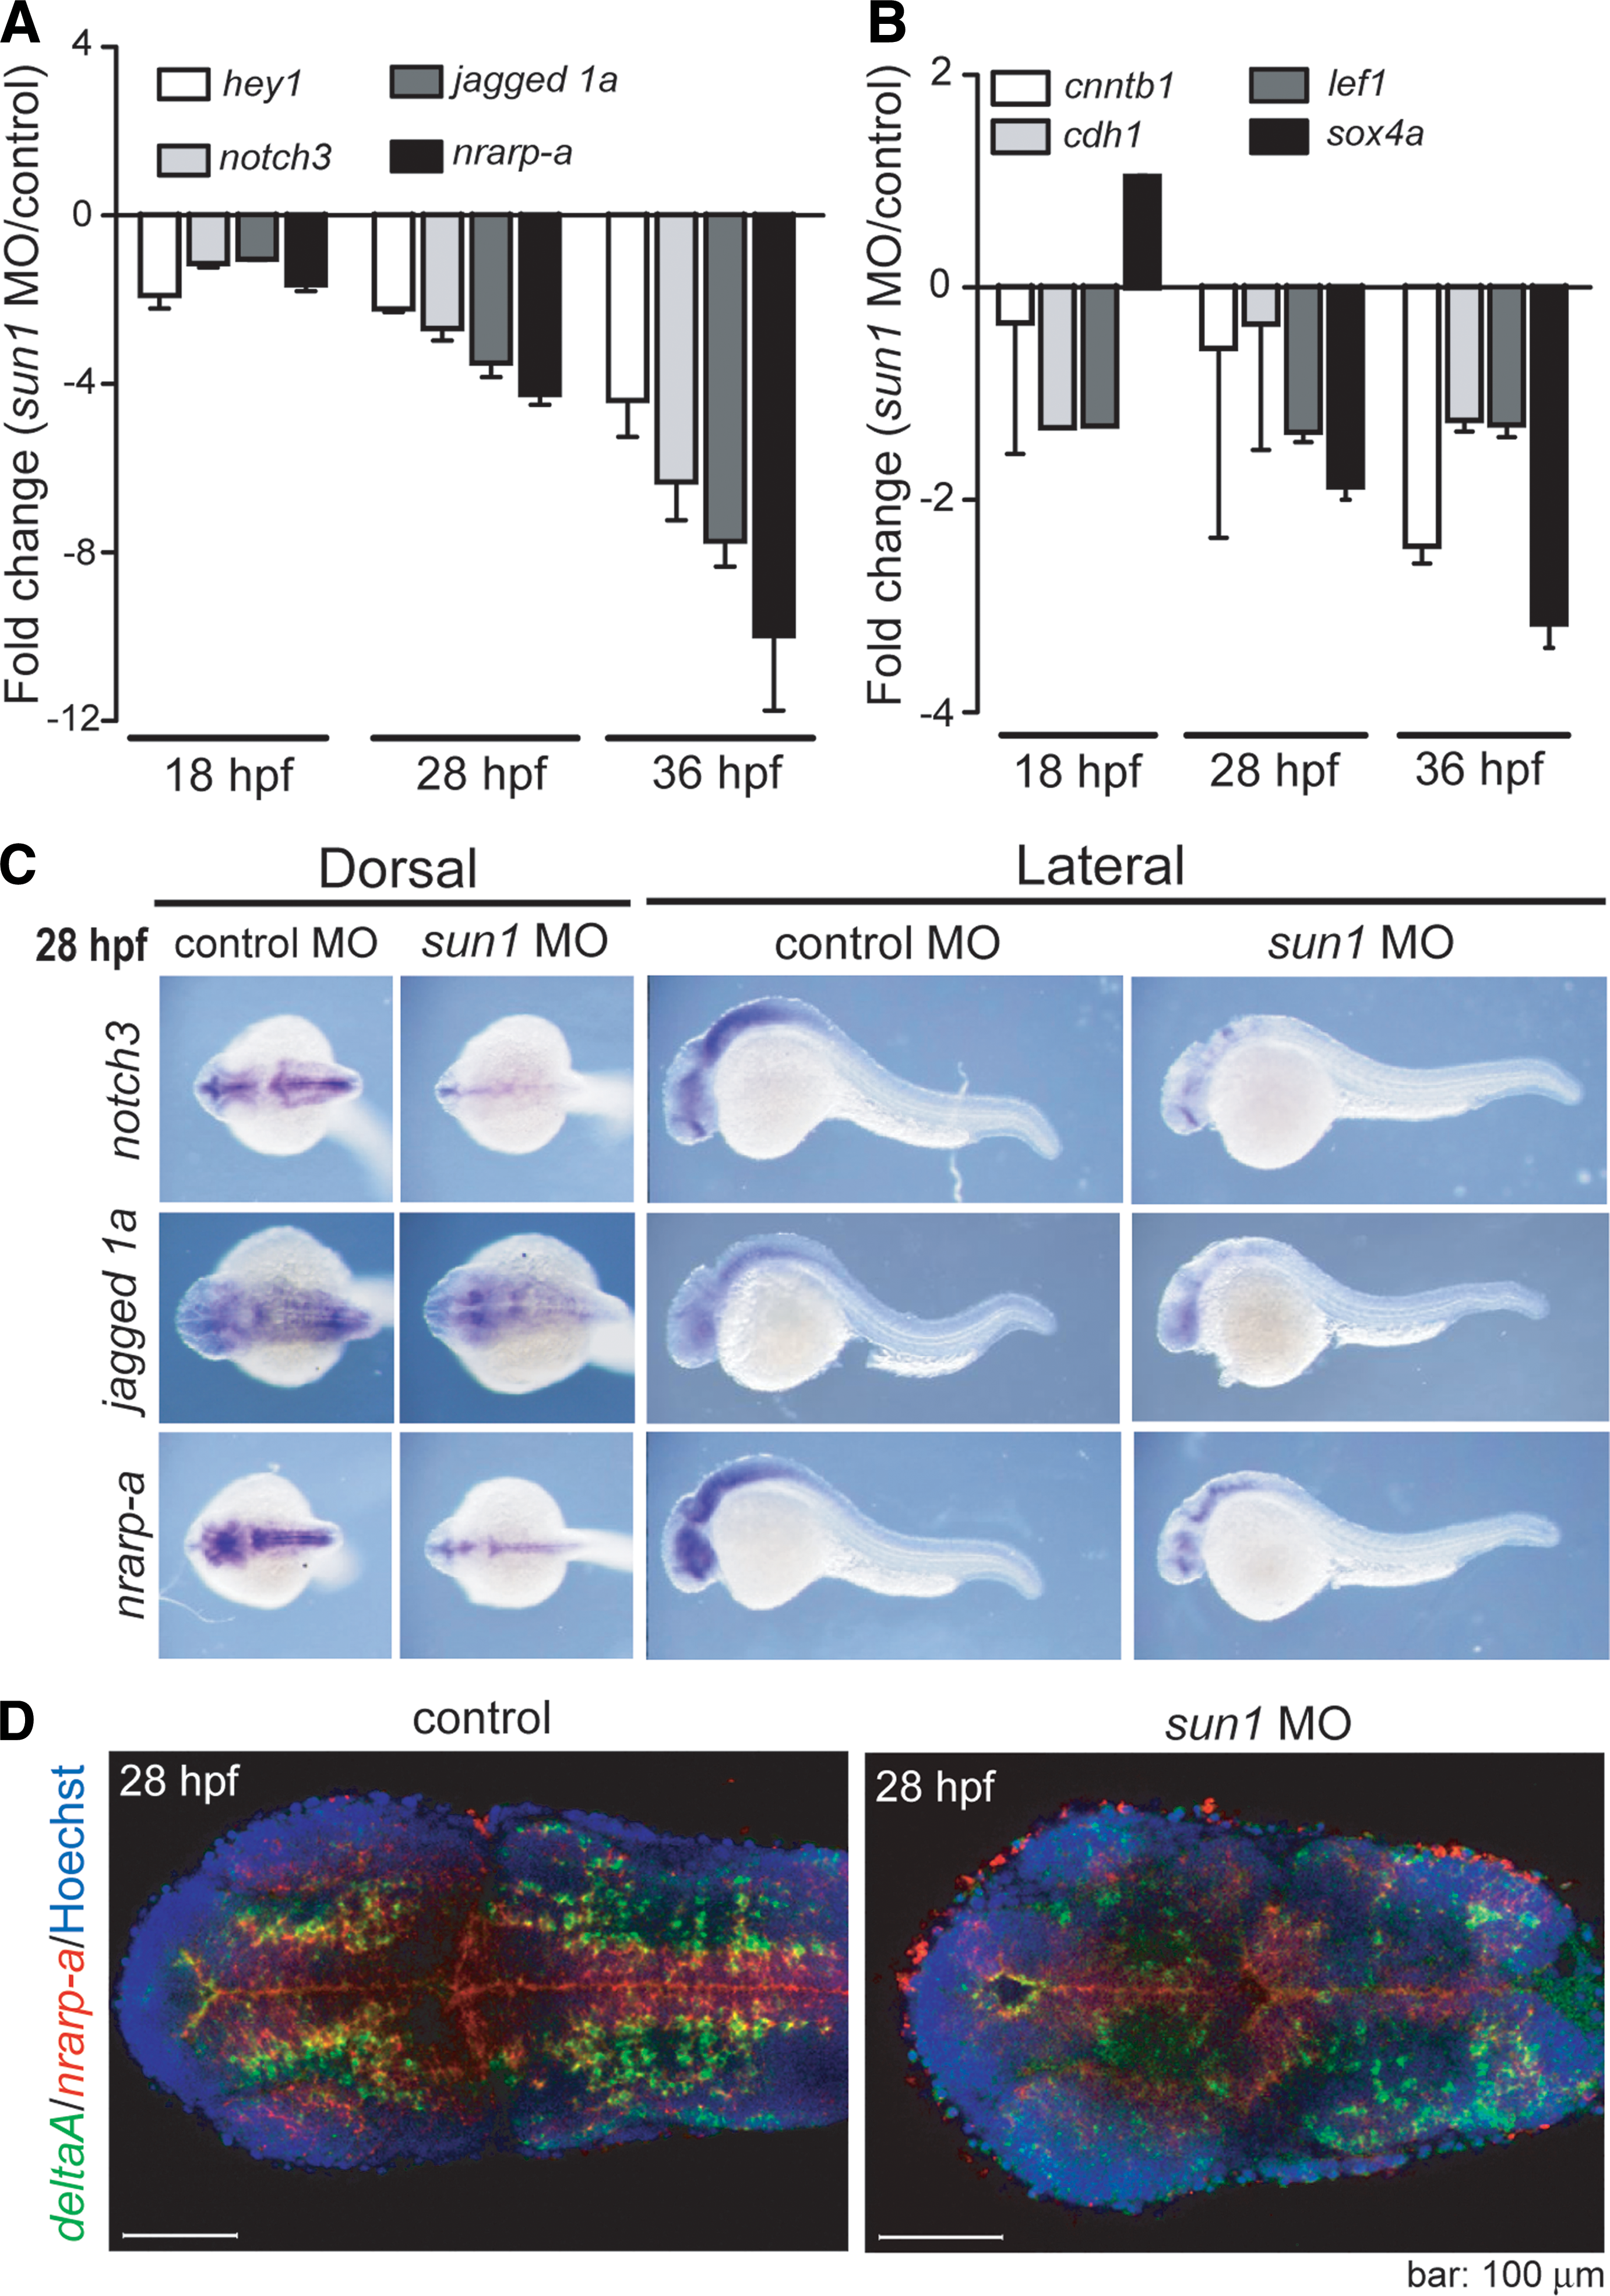
Notch signaling was affected by reduced sun1 expression.
Notch expression and Notch signaling activity have been shown to increase toward the apical side of the neuroepithelium, whereas Delta ligands of the Notch receptor are expressed by newly specified neurons in a gradient with the opposite orientation [45 –47]. Nrarp (Notch-regulated ankyrin repeat protein a) is an anankyrin-repeat protein that is transcriptionally regulated by the Notch signaling pathway [48,49]. Whole-mount fluorescent in situ analysis at 28 hpf revealed that, in control zebrafish, nrarp-a is expressed in the neural tube [50], whereas the Notch ligand deltaA is expressed in neural precursors and neurons [47], which are adjacent to nrarp-a-expressing cells (Fig. 5D). Consistent with our qRT-PCR results, the expression level of nrarp-a presented a significant reduction in the neural tubes of sun1 morphants (Fig. 5A, D). The pattern of deltaA expression was altered, such that a lower number of cells were proximal to the neural tube (Fig. 5D). These observations indicate that knocking down sun1 altered Delta-Notch signaling.
Discussion
INM is critical during vertebrate neurogenesis. Results of previous studies that employed pharmacological inhibitors, RNA silencing, or genetic knockout animals have suggested that actin and microtubules in the cytoskeleton are both involved in INM [2,6 –8,51–53]. INM is dependent on the process of nucleo-cytoskeletal coupling. In mice, LINC complex proteins Sun1/2 and Syne-1/2 are essential to the process of nuclear migration during neurogenesis and neuronal migration [28]. In this study, we determined that, during INM in zebrafish, zSun1 is required for apicalward, but not basalward, nuclear migration. Increased cell apoptosis was observed in sun1 morphant cells during the S/G2 transition of the cell cycle, which could alter exposure to Notch signals and lead to systemic effects on neurogenesis [46].
The similarity between zebrafish Sun1 and mammalian Sun1 in terms of genetic sequence and cross-species NE localization pattern (Fig. 1) indicates that the biological function of Sun1 has been conserved during evolution. Indeed, brain lesions are the most obvious external morphological defect in sun1 morphants (Fig. 2D, G); however, the affected cell types are different between zebrafish and mice. Mouse Sun1/2 is more strongly expressed in cells of the cortical plate [28]. Furthermore, although cortical lamination was severely damaged in Sun1/2 double knockout mice, neuronal proliferation appears to have been unaffected before embryonic day E12.5 [28]. In addition, in the brain of Sun1/2 double knockout mice, intermediate progenitor cells in the intermediate zone and subventricular zone showed signs of progressive depletion, but neural stem cells in the VZ did not [28]. Nonetheless, in this study, we observed that zebrafish sun1 is highly expressed in cells of the VZ (Fig. 2C and Supplementary Fig. S1). Nuclei of proliferating neural stem cells were displaced when sun1 was depleted, which in turn caused a decrease in survival rate (Fig. 3). This result is similar to findings of a previous study that investigated the phenotype of syne2a morphants. Specifically, in both the previous study and the current one, nuclear mispositioning is accompanied by a decreased survival in the neural lineage [1]. Deregulation in the timing and order of the cell cycle is tightly linked with cell apoptotic response [54]; therefore, the increased cell death in sun1 morphant cells that failed to migrate may not be due to the movement itself, but caused by prolonged cell-cycle arrest.
The differences between mice and zebrafish with regard to SUN-domain-depleted phenotypes may be due to intrinsic variations in brain lamination between species. In a more elongated mammalian neocortex, the initiation of apical movement during the G2 phase is mainly dependent on microtubules [3,5,7,52]. However, in shorter epithelia (ie, the neuroepithelia of zebrafish or the pseudostratified epithelia of Drosophila), the movement of nuclei is dependent on actomyosin contractions [6,8,55,56]. For example, Spear and Erickson [5], respectively, used colcemid and cytochalasin B to inhibit the polymerization of microtubules and actin. They discovered that, in neural tube slice preparations from chickens and in cortical slices from mice, apical nuclear migration during the G2 phase is microtubule dependent, whereas apical mitotic rounding requires actin [5]. Conversely, Norden et al. [6] demonstrated that interkinetic nuclear movement in the retinal neuroepithelial cells of zebrafish is largely driven by actin/actomyosin. Specifically, those researchers showed that this movement still occurs when the microtubule cytoskeleton is compromised, but is blocked when MyosinII activity is inhibited [6]. The function of the SUN-domain protein family on positioning and linking the nucleus to either microtubules or actin has been evolutionarily conserved [10]. Our findings emphasize the critical importance of the Sun1-mediated nucleo-cytoskeletal connection during the neurogenesis of short neuroepithelia in zebrafish.
Employing zebrafish as an animal model, Leung et al. reported that the apical movement of the nuclei in G2 phase drives the majority of all basalward nuclear movements, which occur during the G1 and S phases [44]. Similarly, another report indicates that contrast to G2 nuclei whose movements are rapid, persistently apically directed and actomyosin driven, many basal nuclear migrations during G1/S phase are passive [3]. It is worth noting that in zebrafish neuroepithelia, nuclei spend the majority of the cell cycle in S phase, less time in G1, with G2 and M being noticeably shorter [44]. The difference in the time duration between G1/S phases and G2 phase implicates that alternative mechanisms other than the active apical migration of G2 nuclei are responsible for the basal movement (either directional or passive) of the G1/S phase nuclei. In this study, we discovered that sun1 morphant G2 phase cells failed to undergo directed apical migration; however, they remained mobile, with stochastic speeds similar to those of control cells (Fig. 4E). Furthermore, we unexpectedly found that the speed of sun1 morphant S phase cells was slightly higher than that of the control, whereas the velocity of sun1 morphant cells did not differ from that of the control (Fig. 4E, F). A potential explanation for these observations is that cell nonautonomous movements in G2 phase nuclei may contribute to the stochastic nuclear motion during S phase.
The Notch and Wnt signaling pathways are known to facilitate the process of neurogenesis [45]. Our results reveal that genes associated with the Notch pathway are more strongly affected by the knockdown of sun1 than are genes in the Wnt pathway (Fig. 5). Wnt signaling proteins are involved in the earliest patterning signals associated with the formation of the neural plate primordium [57]; therefore, it is likely that zSun1 plays a reduced role in the development before the formation of the neural plate. Defective apical migration in sun1 morphant cells should alter cellular exposure to the Delta-Notch gradient, which is important in decisions pertaining to cell fate [45,46,57]. In addition, the increase in cell apoptosis that has been observed in sun1 morphants during apical migration (Figs. 2G and 4D) may alter the composition of the progenitor pool, which could in turn affect Notch signaling and Notch pathway activation [1,45,46,58].
In summary, our analysis into the loss-of-function phenotype associated with the LINC complex protein Sun1 provides insight into Notch signaling and the apical migration of neural stem cells in zebrafish. The nuclei adopt a variety of positions along the apical–basal axis to gain exposure to signaling cues. In future studies, it will be important to probe the nuances pertaining to the regulation of apical positioning and the means by which polarized signals are transferred to and integrated within the nucleus to impact neurogenesis [59].
Footnotes
Acknowledgments
We thank Dr. Ichiro Masai for providing Tg(h2afv:GFP; EF1α:mCherry-zGem) line, all the members in the NHRI Zebrafish Core for supporting fish maintenance, Yu-Hui Lee for technical assistance, and NHRI Core Facility for technical help on confocal microscopy. This work was supported by the Ministry of Science and Technology, Taiwan, R.O.C (NSC 101-2311-B-400-004-MY3, MOST105-2319-B-400-001, and MOST106-2321-B-001-017).
Author Disclosure Statement
No competing financial interests exist.
Supplementary Material
Supplementary Figure S1
Supplementary Figure S2
Supplementary Table S1
Supplementary Table S2
Supplementary Video S1
Supplementary Video S2
References
Supplementary Material
Please find the following supplemental material available below.
For Open Access articles published under a Creative Commons License, all supplemental material carries the same license as the article it is associated with.
For non-Open Access articles published, all supplemental material carries a non-exclusive license, and permission requests for re-use of supplemental material or any part of supplemental material shall be sent directly to the copyright owner as specified in the copyright notice associated with the article.