
Abstract
The regenerative capacities of mesenchymal stromal cells (MSCs) make them suitable for renal regenerative therapy. The most common delivery route of MSC is through intravenous infusion, which is associated with off-target distribution. Renal intra-arterial delivery offers a targeted therapy, but limited knowledge is available regarding the fate of MSCs delivered through this route. Therefore, we studied the efficiency and tissue distribution of MSCs after renal intra-arterial delivery to a porcine renal ischemia–reperfusion model. MSCs were isolated from adipose tissue of healthy male pigs, fluorescently labeled and infused into the renal artery of female pigs. Flow cytometry allowed MSC detection and quantification in tissue and blood. In addition, quantitative polymerase chain reaction was used to trace MSCs by their Y-chromosome. During infusion, a minor number of MSCs left the kidney through the renal vein, and no MSCs were identified in arterial blood. Ischemic and healthy renal tissues were analyzed 30 min and 8 h after infusion, and 1–4 × 10⁴ MSCs per gram of tissue were detected, predominantly, in the renal cortex, with a viability >70%. Confocal microscopy demonstrated mainly glomerular localization of MSCs, but they were also observed in the capillary network around tubuli. The infusion of heat-inactivated (HI) MSCs, which are metabolically inactive, through the renal artery showed that HI-MSCs were distributed in the kidney in a similar manner to regular MSCs, suggesting a passive retention mechanism. Long-term MSC survival was analyzed by Y-chromosome tracing, and demonstrated that a low percentage of the infused MSCs were present in the kidney 14 days after administration, while HI-MSCs were completely undetectable. In conclusion, renal intra-arterial MSC infusion limited off-target engraftment, leading to efficient MSC delivery to the kidney, most of them being cleared within 14 days. MSC retention was independent of the metabolic state of MSC, indicating a passive mechanism.
Introduction
Mesenchymal stromal cells (MSCs) have regenerative properties, which induce tissue regeneration in the injured kidney [1 –3]. MSCs secrete a variety of cytokines and growth factors that stimulate endothelial cell proliferation, enhance angiogenesis, and reduce endothelium permeability [4 –7]. Moreover, MSCs are able to reduce inflammation through the secretion of immunoregulatory mediators and induce anti-inflammatory M2 macrophages [8 –10].
Studies in rodents have shown that MSCs can improve renal function in a transplant model [11], and restore renal structure and function in an acute kidney injury model [12]. A swine renal artery stenosis model showed that MSCs are able to reduce fibrosis and inflammation of the renal medulla [13]. Moreover, in a porcine transplant model MSC treatment improved glomerular and tubular functions and protected the kidney from fibrosis [14].
As a result, several clinical trials are now trying to translate this success into an effective MSC therapy [15]. In these trials, the safety and efficacy of intravenous (IV) MSC infusion were investigated as a treatment for different renal diseases and to improve the outcome of kidney transplantation [2]. In the aforementioned animal and human studies, IV infusion of MSC was proven to be an easy and safe administration route. However, IV delivery of MSC has been shown to have some limitations. IV-infused MSCs do not specifically target the injured organ [16], which could lead to unwanted off-site effects. It has been shown that IV infusion of MSCs leads to entrapment of MSCs in the lung microvasculature, from where they are rapidly cleared by the immune system [17 –19].
Intra-arterial infusion is a promising option to deliver MSC specifically to injured organs, which increases MSC delivery efficiency compared with IV infusion [20,21]. This was demonstrated in a rat kidney transplantation model [22], and in kidney injury rat models of polycystic kidney disease [23] and glomerulonephritis [24].
Studies in an ovine model showed that administration of MSCs through the renal artery leads to their engraftment in glomerular and tubular capillaries [25]. In swine models, renal intra-arterial delivery of MSC has been shown to reduce inflammation and fibrosis and improved revascularization, restoring renal function [13,26]. In an acute kidney injury monkey model, MSCs infused through the renal artery were found in glomeruli and tubuli as well, and were able to restore renal function [27,28]. Moreover, a phase 1/2A human clinical trial has been carried out using renal intra-arterial infusion of autologous MSC without reporting any adverse effects [29].
Although renal intra-arterial MSC delivery is deemed feasible, the efficiency of MSC delivery is not known, which makes it difficult to study dose-dependent effects. In addition, the mechanisms behind the retention of MSC are unknown. To be able to better correlate renal intra-arterial-based MSC therapy with observed effects in clinical and preclinical studies, more detailed knowledge regarding MSC retention and localization is crucial. These key questions require answering to further understand the role of exogenously administered MSCs to the injured kidney and to explore the therapeutic use of MSCs for kidney repair.
In this study, renal intra-arterial MSC infusion was investigated in a porcine ischemia–reperfusion injury kidney model. This model allows us to study MSC delivery in human-sized kidneys, making it translatable to studies in humans. The goal of the study was to determine the efficiency and tissue distribution of MSC delivered through the renal artery as well as to elucidate the mechanism responsible for MSC retention and survival in the kidney after infusion.
Materials and Methods
Institutional regulations
Female pigs of Danish Landrace and Yorkshire crossbreed weighing 40 kg were used. Animal care and experiments followed guidelines by the European Union (directive 2010/63/EU) and local regulations. The Animal Experiments Inspectorate approved the study (reference number 2013-15-2934-00925 and 2017-15-0201-01367).
Isolation and expansion of MSCs
Subcutaneous adipose tissue was collected from healthy 40–60 kg male Danish landrace pigs during surgery as a waste product. In total, 4 g fat was cut in small pieces and washed twice with 30 mL Dulbecco's phosphate buffered saline (DPBS; ThermoFisher, Manhattan, NY) by centrifugation at 850g for 5 min. Adipose tissue was dissociated in 10 mL RPMI-1640 medium (ThermoFisher) containing 150 U/mL collagenase type IV (ThermoFisher) in a GentleMACS Octo tissue dissociator (Miltenyi Biotec, Bergisch Gladbach, Germany) using protocol 37C-mr-ATDK-1. After dissociation, 10 mL culture medium was added, and cells were pelleted at 650g for 10 min. Pellet was resuspended in 10 mL culture medium, and filtered through a 70 μm cell strainer and seeded in culture flasks.
Cells were cultured at 37°C and 5% CO2 until they reached 80%–90% confluency (∼7 days). Culture medium was replaced twice a week, and MSCs were subcultured until passage 3 before use or cryostored in 50% serum, 10% dimethyl sulfoxide (DMSO) in liquid N2. MSC culture medium consisted of minimum essential medium (Sigma-Aldrich) supplemented with 15% fetal bovine serum (FBS; Sigma-Aldrich), 50 U/mL penicillin +50 μg/mL streptomycin (ThermoFisher), and 2 mM
MSC characterization
Morphology of MSCs was observed with an axiovert 40C microscope (Zeiss, Oberkochen, Germany) coupled to a Zeiss CanonSLR camera (Zeiss), and their fibroblastic appearance was confirmed (Fig. 1A). MSCs (p3) were characterized by the expression and absence of specific membrane markers. About 1 × 10⁵ MSCs in 100 μL DPBS were incubated for 30 min with 1 μL antihuman CD29 (APC, catalog #17-0299-42; Biolegend), 1 μL CD44 (PE, catalog #17-0441-81; Biolegend), and 1 μL CD90 (BV421, catalog #561557; Biolegend), which are described to crossreact with swine species, and the absence of negative membrane markers was assessed with 5 μL antipig CD31 (FITC, catalog #MCA1746F; Bio-rad, Hercules, CA) and 5 μL antipig CD45 (FITC, catalog #MCA1222F; Bio-rad).
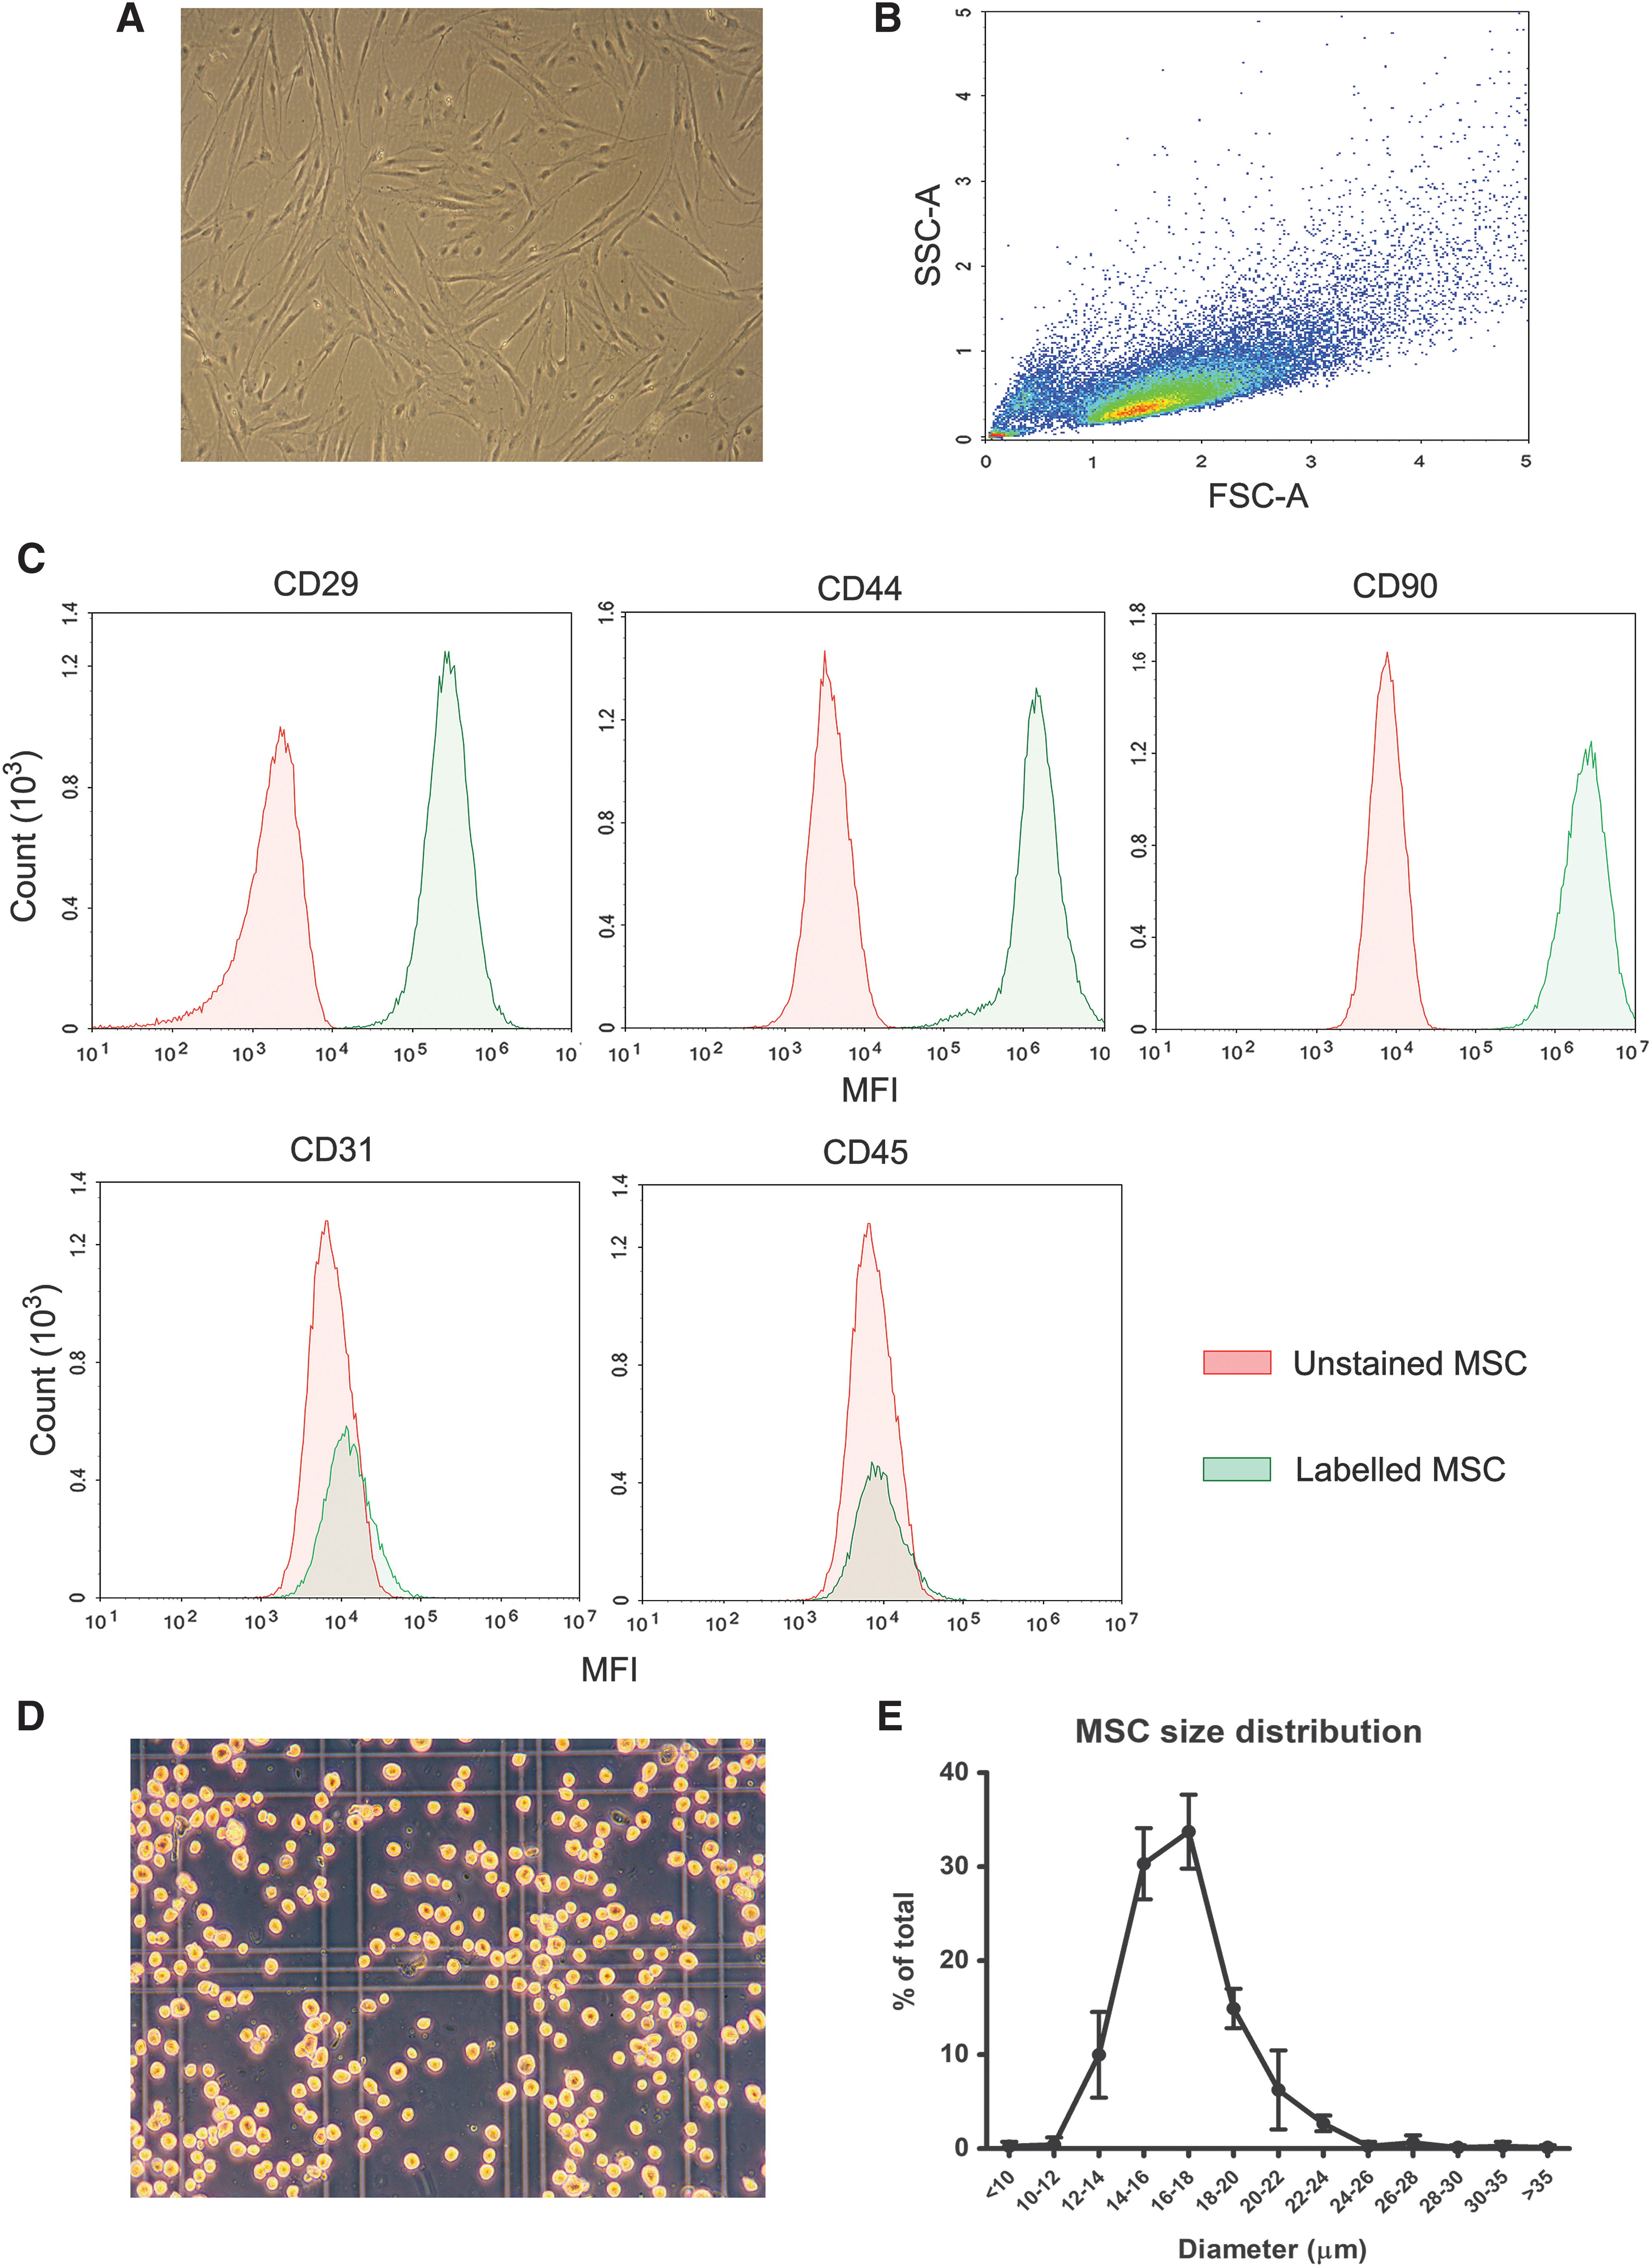
Porcine MSC characterization.
Next, the cells were analyzed by multiparameter flow cytometry using a Novocyte flow cytometer (ACEA Biosciences, Inc., San Diego, CA). All used MSC batches were >95% positive for CD29, CD44, CD90 and negative for CD31 and CD45 (Fig. 1B, C).
MSC size was measured directly after trypsinization. MSCs in suspension were transferred to a Burker-Turk counting chamber (ThermoFisher), and pictures were made under 100× magnification and analyzed by ImageJ software (National Institutes of Health, Bethesda, MD) using plugins ij_Geodesics and Cell Magic Wand. The grid of the counting chamber was used as a size reference. For each cell, the maximum and minimum diameter was determined, and the average diameter was used to express cell diameter. For each MSC batch, cell diameter was determined of ∼100 cells. The size of infused MSC ranged from 10 to 30 μm, and the median was 16–18 μm (Fig. 1D, E).
MSC labeling
MSCs were cultured until 90% confluency, trypsinized and labeled with Quantum dots (Qdot) 655 (ThermoFisher) using 1.5 μL of the reagent per million MSC according to manufacturer's protocol immediately before the infusion. Fluorescence was measured before each infusion to establish the gating strategy to identify the MSC. For labeling with PKH-26 (Sigma), MSCs were cultured as mentioned, trypsinized, and labeling was performed following the manufacturer's protocol.
Heat inactivation of MSC
MSCs were heat inactivated (HI) as previously described [30]. MSCs were resuspended in DPBS (1–2 × 10⁶/mL), and incubated at 50°C for 30 min and cooled down in ice for 5 min.
MSC administration
MSCs were pelleted by centrifugation (440g, 5 min) after trypsinization, heat inactivation, or labeling. MSCs were resuspended in DPBS and filtered over a 70 μm cell strainer. Before administration, cells were counted and visually inspected under a microscope to confirm a single cell solution.
Tissue dissociation
In total, 0.5 g of renal tissue were cut into small pieces and dissociated using a GentleMACS Octo tissue dissociator (Miltenyi Biotec). Renal cortical tissue was dissociated in 2.5 mL RMPI 1640 (ThermoFisher) supplemented with 100 μL enzyme D, 50 μL enzyme R, and 12.5 μL enzyme A of a multitissue dissociation kit 1 (Miltenyi Biotec) and run with protocol 37C_Multi_B. Renal medulla and lung tissue were dissociated in 2.5 mL buffer X supplemented with 25 μL enzyme P, 25 μL buffer Y, 50 μL enzyme D, and 10 μL enzyme A of a multitissue dissociation kit 2 (Miltenyi Biotec) and run with protocol 37C_Multi_E.
After dissociation, 8 mL RPMI-1640 were added, and the cell suspension was filtered through a 70 μm cell strainer and centrifuged at 500g for 7 min. Pellets were resuspended in 3 mL culture medium, and analyzed immediately or cryopreserved in 50% FBS and 10% DMSO.
Plastic-adherent fraction of dissociated tissue
In total, 500 μL cryopreserved dissociated tissue was thawed and seeded in a T75 culture flask (Nunclon delta surface; Thermo Scientific) with 10 mL MSC medium and incubated for 1 day at 37°C and 5% CO2. Medium was fully removed after 24 h, and cells were incubated for an additional 4 h. Before trypsinization, cells were washed twice with PBS (without calcium and magnesium; ThermoFisher) and detached using 2 mL 0.05% trypsin-ethylenediaminetetraaceticacid (ThermoFisher). Cells were pelleted by centrifugation at 440g for 5 min, and measured by flow cytometry or stored at −20°C for subsequent DNA isolation.
Y-chromosome PCR
DNA was isolated from 10 mg of kidney tissue or from cell pellets from the adherent fraction using a NucleoSpin Tissue DNA isolation kit (Macherey-Nagel, Düren, Germany) according to manufacturer's protocol. DNA was eluted in 100 μL water, and Y-chromosome was detected by quantitative polymerase chain reaction using primers directed to the male specific repeat (MSR) located on the porcine Y-chromosome as previously done by Gruessner et al. [31].
Primers directed to porcine S100C gene were used as a pig DNA control. Primer sequences were as follows: MSR forward 5′-CCA TCG GCC ATT GTT TTC CTG TTC A-3′, MSR reverse 5′-CCT CTG TGC CCA CCT GCT CTC TAC A-3′, S100C forward 5′-ATG CTG GAA GGG ACG GTA ACA ACA-3′, and S100C reverse 5′-GCT CAG CTG CTG TCT TTC ACT CGT-3′. qPCR mix consisted of 0.5 μL DNA, 10 pmol of each primer, and 1× KiCStart SybrGreen qPCR ReadyMix (Sigma-Aldrich Life Science) in a final volume of 25 μL. Samples were run in duplicate on a ABI 7300 (Perkin Elmer). The thermocycling program included an initial step of 2 min at 50°C, subsequently 10 min at 95°C, followed by a 40 time repeat two-step cycle involving 95°C for 15 s and 60°C for 1 min.
Anesthetics and surgical procedure
The pigs were sedated with intramuscular injection of Stresnil® (2.2 mg/kg) to allow vein cannulation. Intravenous (IV) administration of Ketamine (6 mg/kg) and Midazolam (0.5 mg/kg) allowed intubation and ventilation, keeping CO2 between 4.5 and 5.5 kPa. Anesthesia was maintained using IV-administered Fentanyl (15 μg/kg/h) and Propofol (3.5 mg/kg/h) preceded by a bolus of 7.5 μg/kg (Fentanyl) and 1.875 mg/kg (Propofol). A bolus of 1.5 L Ringer Acetate was administered within the first one and a half hour followed by a continuous infusion rate of 400 mL/h to maintain normal hydration and a mean arterial blood pressure ≥60 mmHg in all pigs. Introducers were inserted into the common carotid artery, external jugular vein, and femoral artery (Radifocus® Introducer II’ Terumo Europe, Leuven, Belgium). The experiments were conducted with or without renal ischemia.
MSC infusion during open surgery
The data presented in Figs. 2–4 were obtained from an open surgery procedure. After a midline incision and retroperitoneal exposure of the left kidney, a catheter was positioned in the aorta over a guidewire in the femoral sheet. The catheter was further inserted into the left renal artery where positioning was controlled by palpation. Ischemic injury was performed by clamping the renal artery and vein for 60 min. After removing the clamps or directly after catheterization of healthy kidneys, 10 million MSCs suspended in 25 mL DPBS were infused into the renal artery followed by a 5 mL DPBS flush both at a rate of 150 mL/h.
Intra-arterially delivered MSCs are retained in the kidneys.
MSCs are located mainly in renal cortex after infusion through the renal artery.
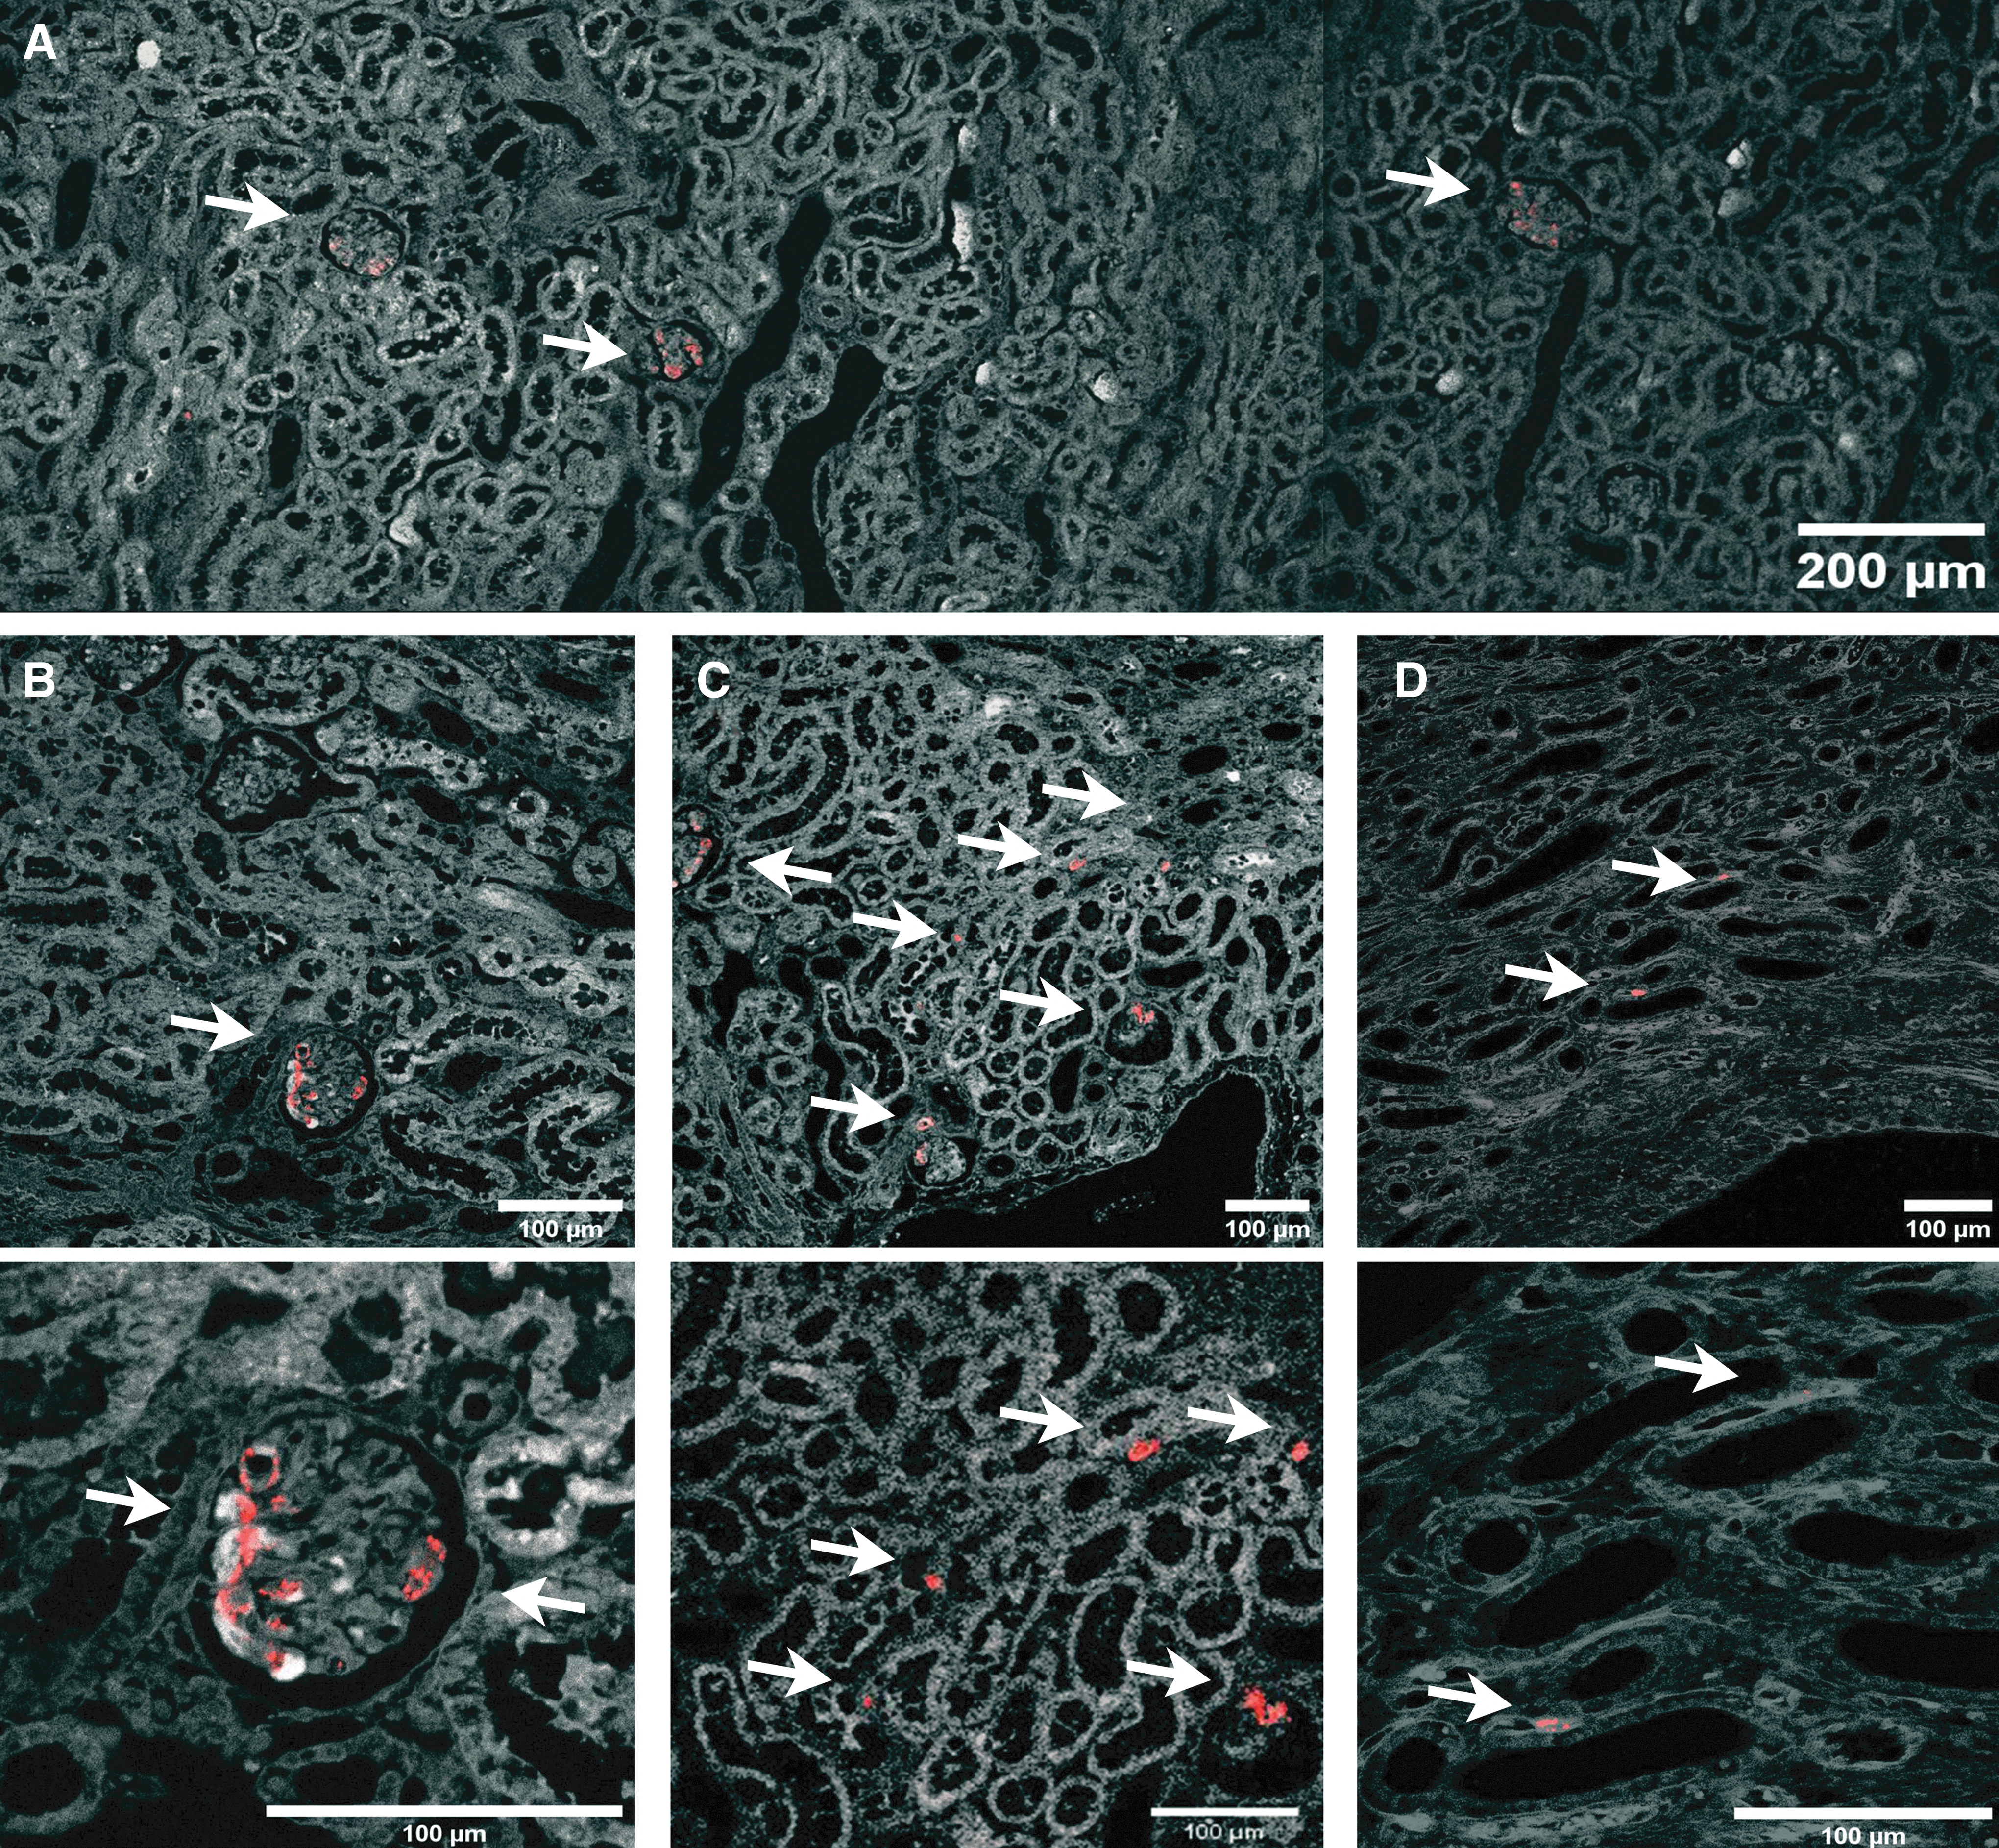
MSCs are found primarily inside glomeruli. Micrograph of healthy renal tissue. Arrows depict Qdot 655 red fluorescence from MSC. Pictures were obtained from healthy renal tissue 30 min after fluorescent MSC infusion.
In both healthy and ischemic kidneys, the renal artery catheter was removed after 10 min when MSC administration was finished. Blood was collected simultaneously from the carotid artery and renal vein before, during, and after MSC infusion. Bilateral nephrectomy was completed after either 30 min or 8 h follow-up, and the pig was terminated using an IV overdose of pentobarbital (100 mg/kg) while in general anesthesia. Both kidneys were weighted, and cut longitudinally and horizontally through the medial line after retrieval. Kidney weight ranged from 90 to 110 g in all pigs. One half of each kidney was used to obtain all tissue material used for analysis, and the other one was embedded in PELCO® cryoembedding compound (Ted Pella, Inc., Redding, CA) and cryopreserved. Each experimental group consisted of three pigs.
Noninvasive MSC infusion
The data presented in Figs. 6 and 7 were obtained from a noninvasive MSC delivery method. Over a guidewire in the femoral introducer sheath, a catheter was introduced into the aorta, and contrast agent (Iomeron 350 mg/mL, total volume used 40 mL) was administered using X-ray to ensure the correct positioning of the catheter in the renal artery. Hereafter, 10 million MSCs in 25 mL DPBS were infused into the renal artery followed by a 5 mL DPBS flush both at a rate of 150 mL/h. The renal artery catheter was removed after 10 min, when MSC administration was finished.
Bilateral nephrectomy was completed after 30 min (n = 3) or 14 days follow-up (n = 8 and n = 4 for MSC- and HI-MSC-infused kidneys, respectively), and the pig was terminated using an IV overdose of pentobarbital (100 mg/kg) while in general anesthesia. Kidney weight ranged from 90 to 110 g in all pigs.
MSC detection in kidney and blood by flow cytometry
Blood samples and renal tissue were analyzed using flow cytometry. Whole blood samples drawn from the renal vein and the carotid artery were directly analyzed. From the total dissociated kidney tissue, 400 μL were analyzed by flow cytometry. The fluorescence was measured by excitation with a 405 nm laser and detection with the 660/20 BP, 650 LP filter set in a Novocyte flow cytometer (ACEA Biosciences, Inc.). To avoid low-fluorescent cells from being measured and to speed up the measuring process, a fluorescence threshold (median fluorescent intensity = 5,000) was applied. Qdot-positive cells found in the cell suspensions were identified as the infused MSC.
To confirm that the Qdot-positive cells found in dissociated renal tissue and in whole blood were indeed the infused MSCs, simultaneous expression of CD29, CD44, and CD90 and absence of CD31 and CD45 were assessed as mentioned earlier for MSC characterization. The viability of MSC was assessed using the Zombie NIR™ Fixable Viability Kit (Biolegend). From the dissociated renal tissue, 100 μL were stained with Zombie NIR™ following the manufacturer's protocol and analyzed by flow cytometry. The total number of MSCs in kidney tissue or blood was estimated from the number of events and the volume measured from each sample. Flow cytometry data were analyzed using NovoExpress software (ACEA Biosciences, Inc.).
Confocal microscopy of renal tissue
Kidney biopsies, containing both renal cortex and medulla, of 1 cm3 formalin-fixed and paraffin-embedded renal tissue were cut into 3 μm thick slices. Images were obtained using a Leica SP5 confocal microscope (Leica Microsystems, Wetzlar, Germany). Renal tissue autofluorescence was used to identify specific kidney structures such as glomeruli and tubules. Qdot 655 signal was detected by exciting the samples at a wavelength of 405 nm and measuring fluorescence emission at 655 nm. Tissue autofluorescence was measured at 420 nm to identify different renal structures. Images were analyzed using Fiji from ImageJ.
Cell localization by three-dimensional cryoimaging
Half kidneys were embedded in mounting medium for cryotomy (PELCO cryoembedding compound, Ted Pella, Inc.) and frozen in liquid nitrogen. Frozen kidneys were kept at −80°C and shipped to BioInVision (OH). At BioInVision, quantification of engrafted MSC was performed based on detection of fluorescent signal.
Statistical analysis
The Mann–Whitney test was used for comparison of mean numbers of MSCs found in renal and lung tissue and MSCs found in the blood outflow from the renal vein. The Kruskal–Wallis test was used when more than two groups were compared at the same time. Data were analyzed using GraphPad Prism version 5.00 for Windows (GraphPad Software, La Jolla, CA).
Results
MSC quantification in blood and tissue
Qdot-labeled MSCs showed a high-fluorescent signal, which allowed clear identification of the cells by flow cytometry (Supplementary Fig. S1A). To demonstrate the feasibility of a flow cytometry-based detection technique of relatively low numbers of MSCs in large amounts of kidney and blood cells, Qdot-labeled MSCs were mixed with dissociated renal tissue and whole blood in vitro. Results showed that Qdot-labeled MSCs could be semiquantitatively measured in these samples (Supplementary Fig. S2B, C).
MSC detection after renal intra-arterial delivery
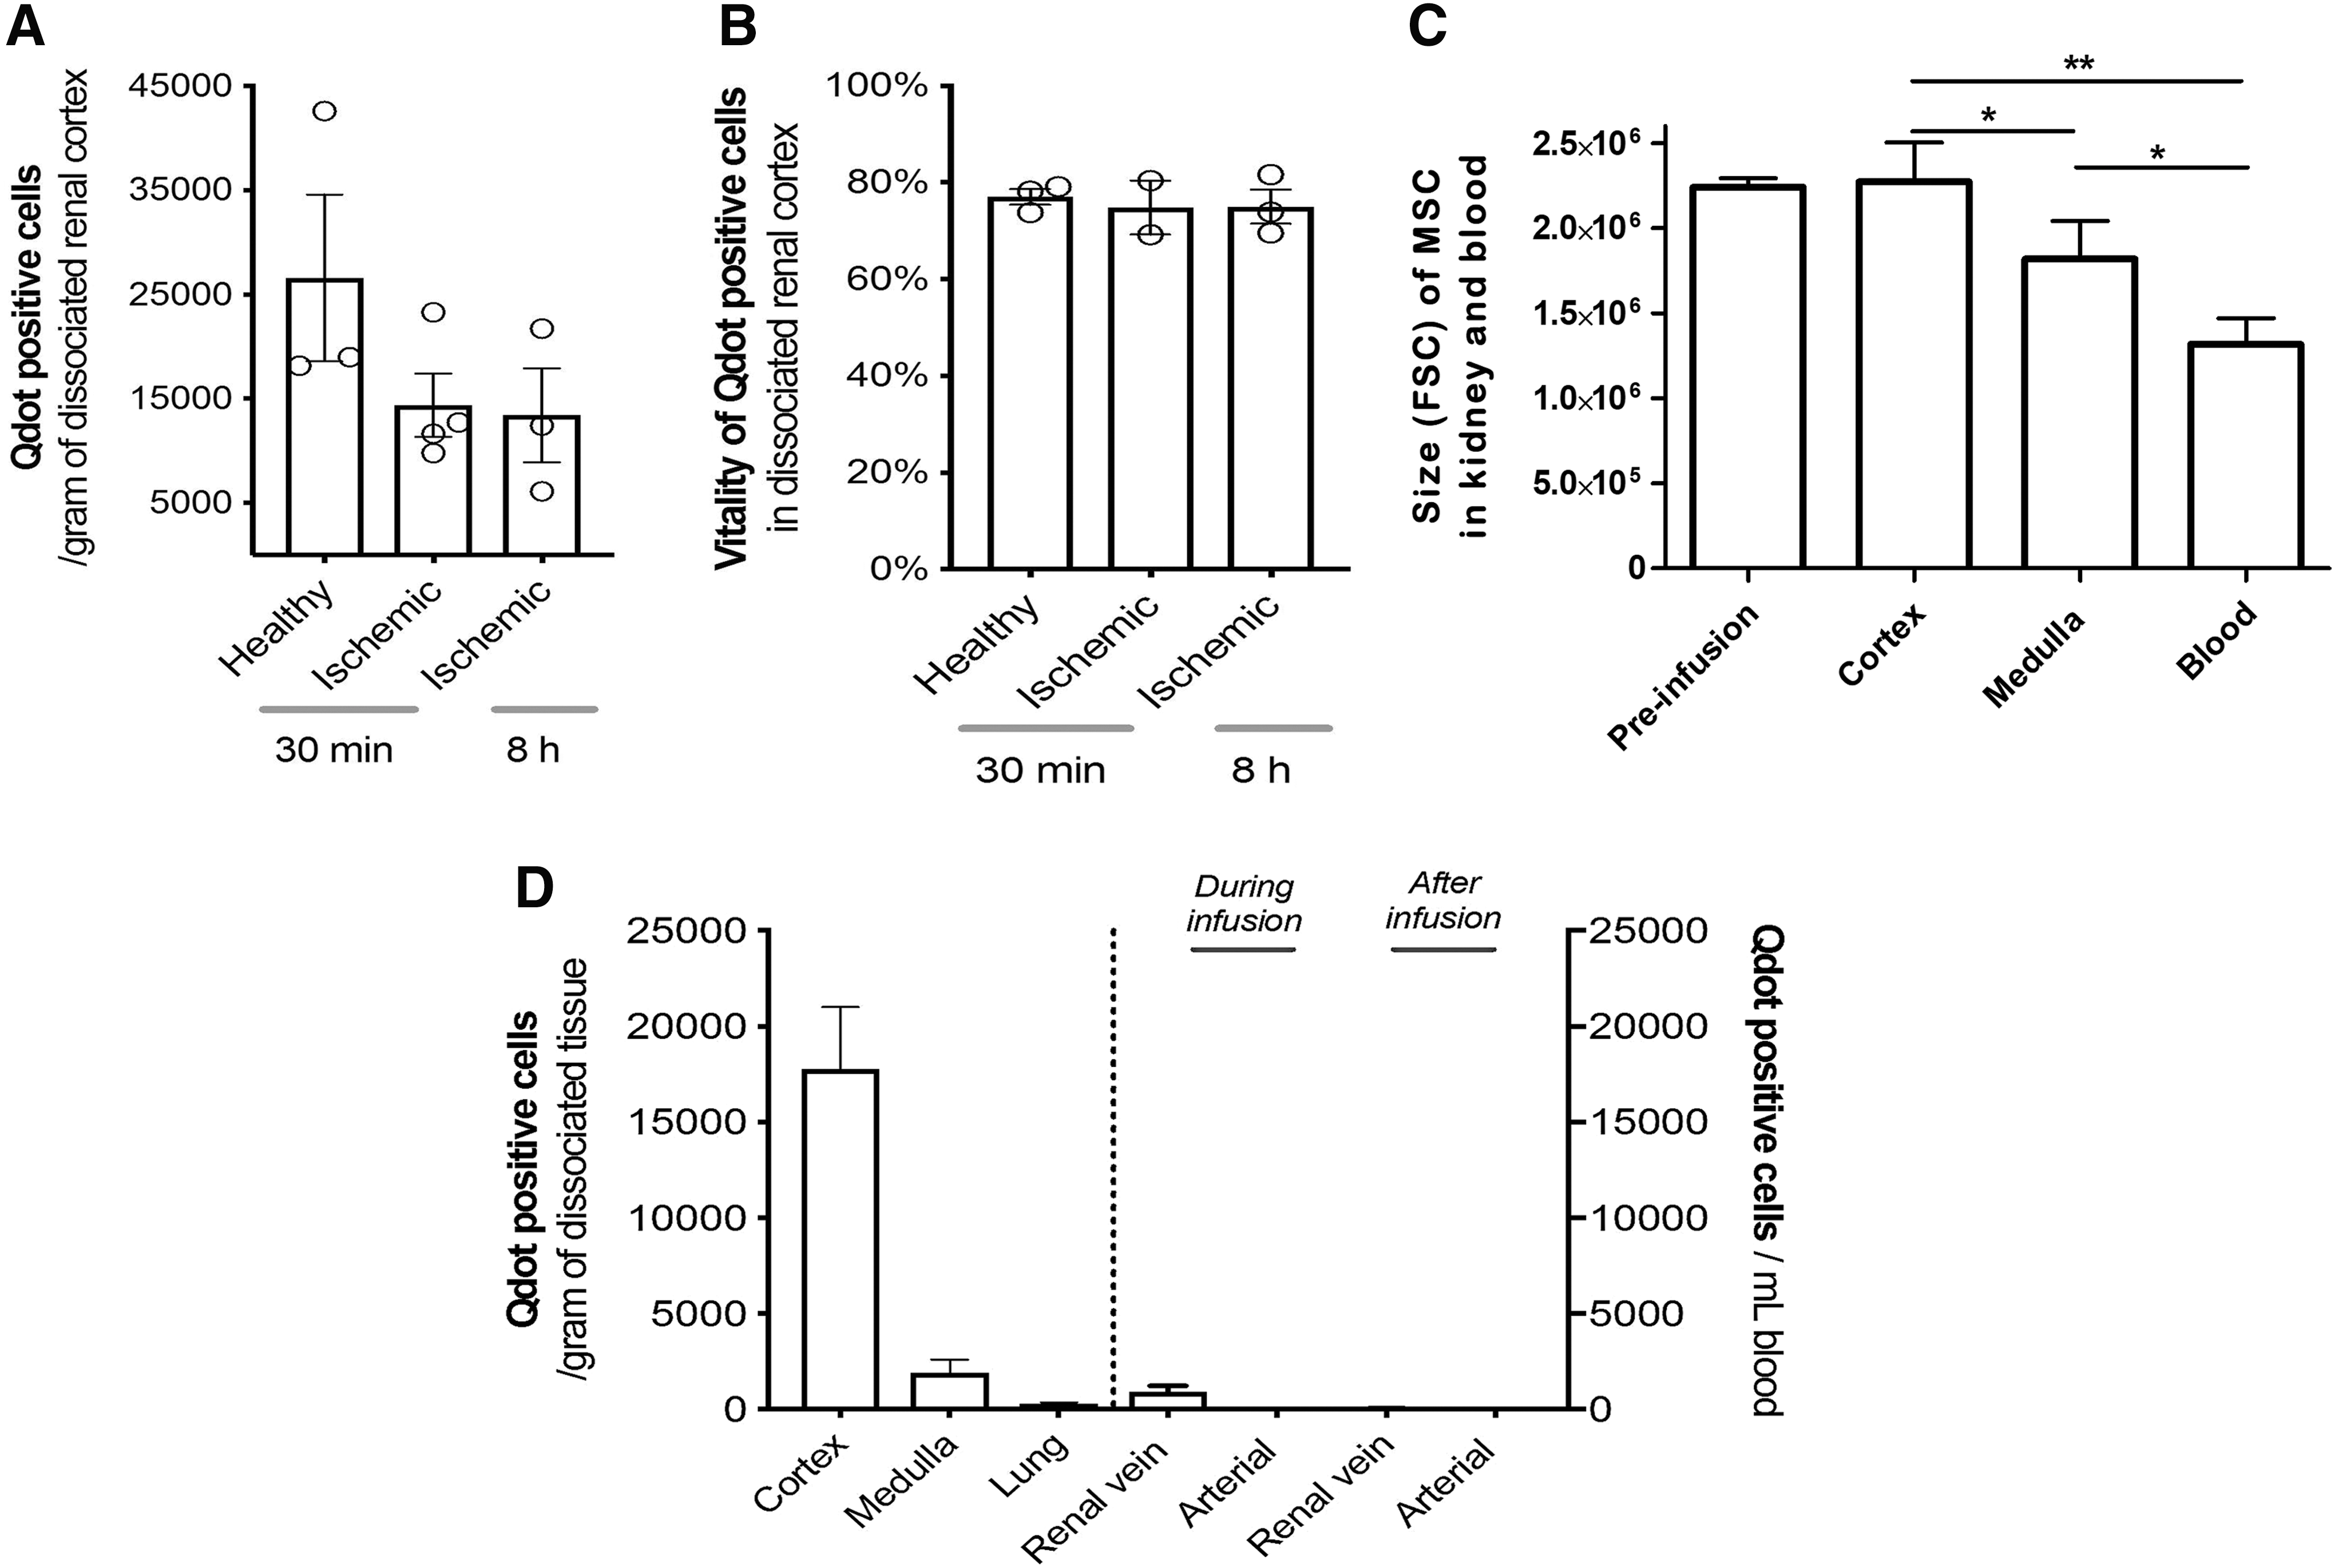
In total, 10 million Qdot-labeled MSCs were infused in vivo through the renal artery to healthy or ischemic kidneys, and 30 min after administration renal tissue was analyzed for the presence of Qdot-labeled MSCs. We observed that MSCs were successfully delivered to both healthy and ischemic kidneys (Fig. 2A, D and Supplementary Fig. S2B, C).
Measured MSCs were in the order of 1–4 × 10⁴ MSCs per gram of dissociated cortical tissue. To demonstrate that MSCs were stably retained in the kidney, the follow-up time of the ischemic group was extended to 8 h. This demonstrated that the majority of MSCs remained in the kidney at least up to 8 h. The viability of MSC in the kidney tissue measured by flow cytometry ranged from 70% to 80% in all three conditions (Fig. 2B). We observed that MSCs found in the renal cortex had a bigger size than those found in the renal medulla (Fig. 2C).
Qdot-labeled MSCs were also detected in dissociated renal medulla; however, MSC numbers were 10-fold lower than those found in the renal cortex. Lung tissue contained numbers 100-fold lower compared with renal cortex, with an average of 200 MSCs per gram of tissue (Fig. 1D).
During the experiments described above, blood samples from the renal vein and carotid artery were drawn to identify the presence of MSCs passing through the kidneys. During infusion, an average of 500 MSCs per milliliter were measured leaving the kidney through the renal vein. After the infusion stopped, hardly any MSC were found leaving the kidney (Fig. 1D and Supplementary Fig. S3A). In blood samples from the carotid artery, no MSCs were detected either during or after infusion (Supplementary Fig. 3B). The size of the MSC found in the renal vein outflow was smaller than those retained in the kidney, in both cortical and medullar tissues (Fig. 2C).
Qdot-labeled MSCs identified in blood and renal tissue were phenotyped to confirm MSC characteristics. Identified MSC expressed CD29, CD90, and CD105 and lacked the expression of CD31 and CD45 (Supplementary Fig. S4A–D).
Cortical localization of MSC after renal intra-arterial infusion was confirmed by three-dimensional cryoimaging
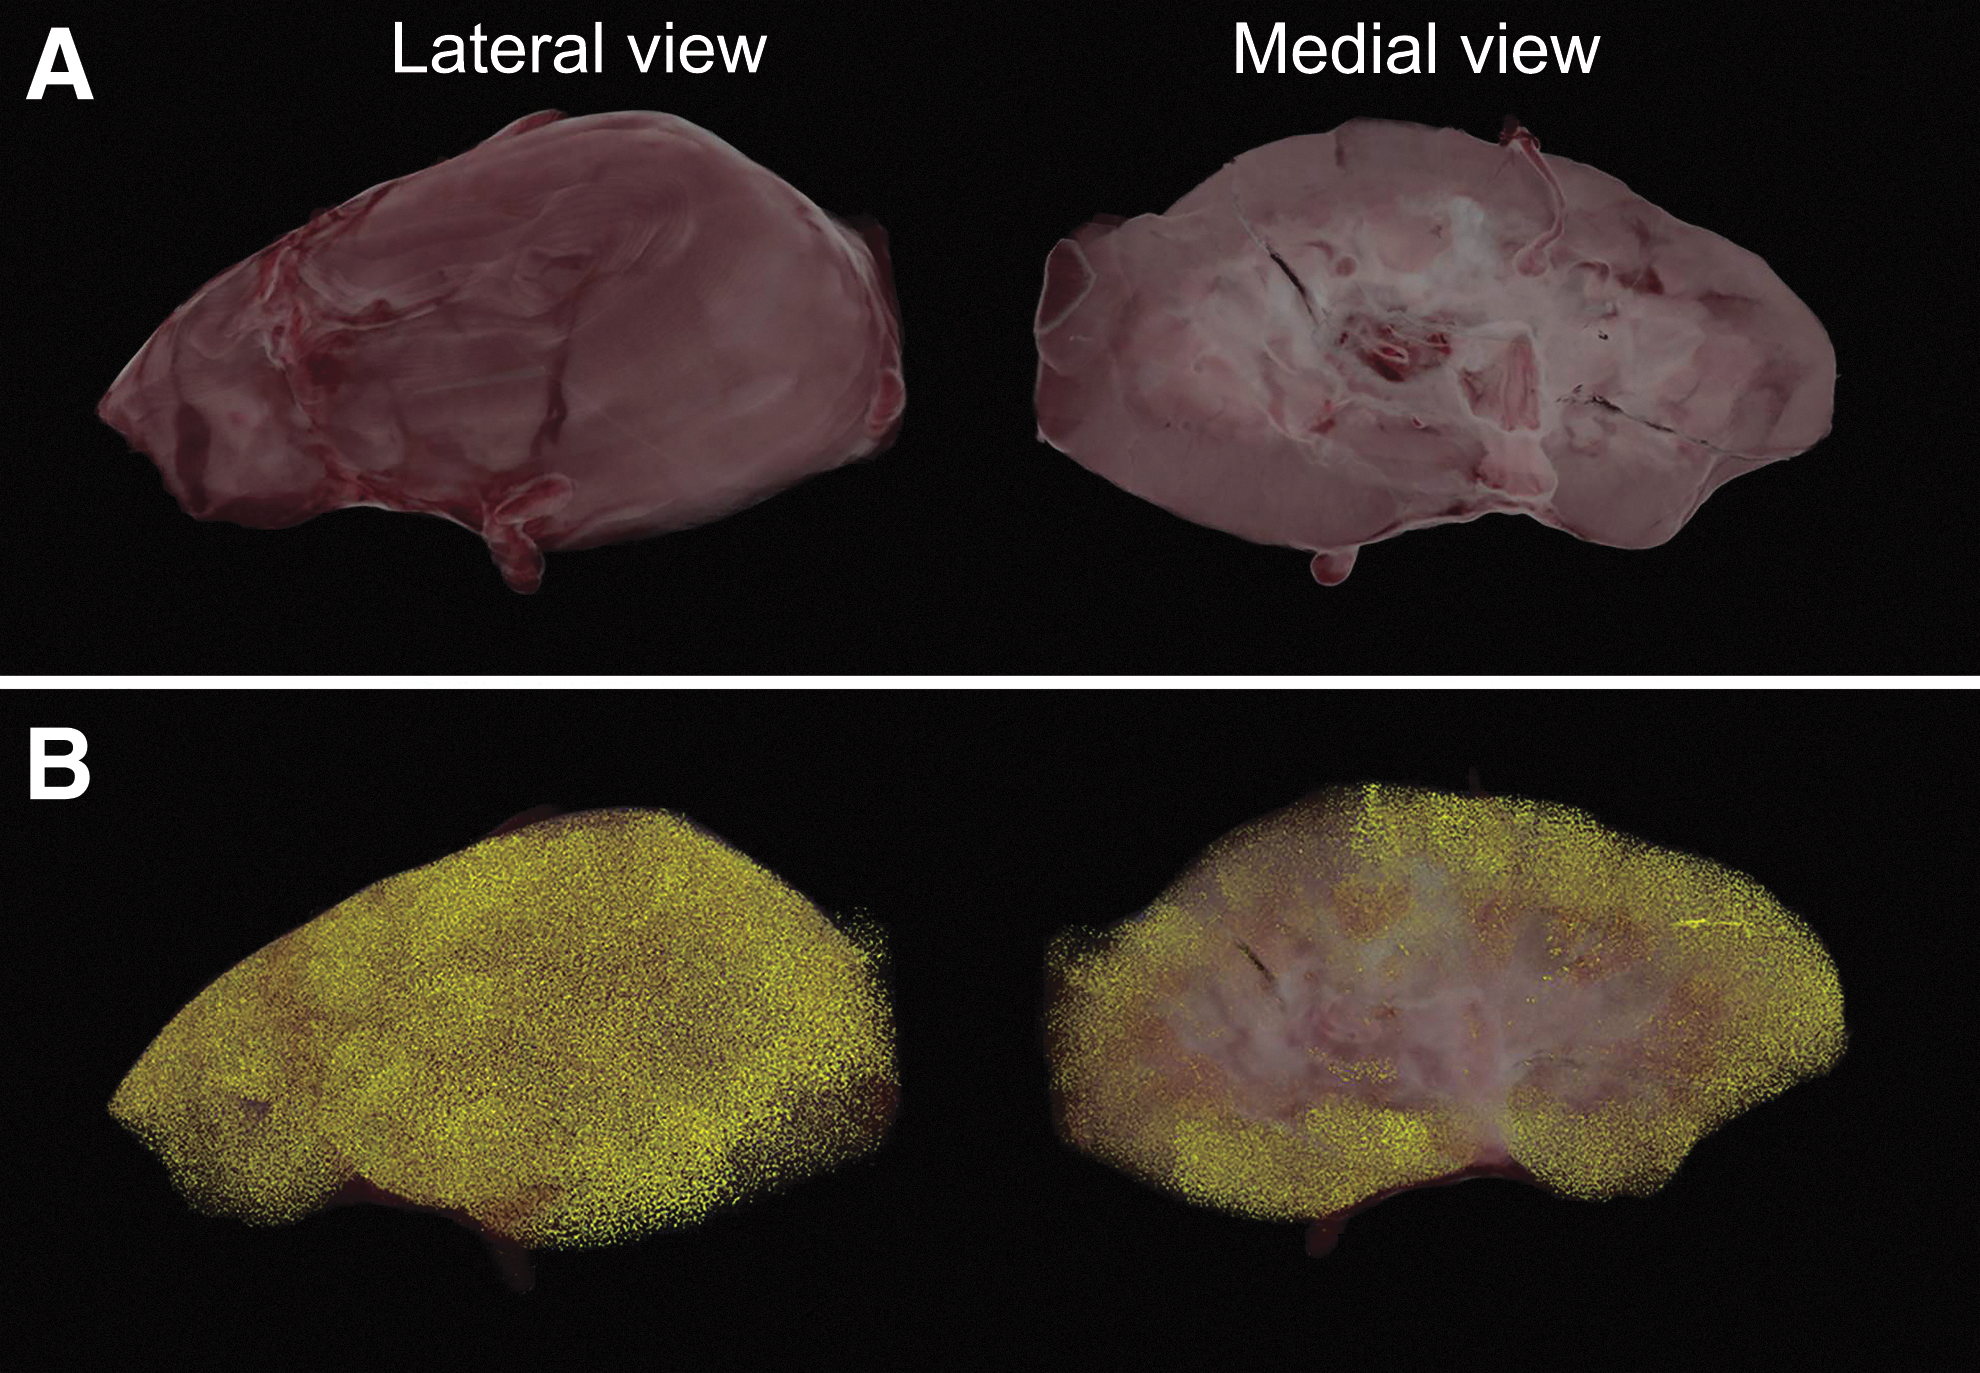
Three-dimensional (3D) cryoimaging was used to confirm the presence and localization of fluorescent MSCs in the kidney. Kidneys were collected 30 min after administration of 10 million Qdot-labeled MSC and cryoimaged. In Fig. 3A, a 3D volume rendering generated from brightfield data from the lateral and medial sides of the kidney are shown. Detected Qdot-positive MSCs were pseudocolored in yellow and rendered along with brightfield data. MSCs were mainly observed in renal cortical tissue (Fig. 3B), supporting the data obtained by flow cytometry.
MSCs are located mainly in glomerular structures
Confocal microscopy demonstrated that MSCs were localized mostly to glomerular structures in the renal cortex. There was no clear difference regarding the location of MSC observed in healthy and ischemic kidneys. Pictures shown in Fig. 4 were taken from healthy kidney tissue. Frequently, several MSCs were observed in single glomeruli (Fig. 4A–C). The frequency of MSC outside the glomerular structures was much lower. However, MSC could be identified around tubules in both the renal cortex and medulla (Fig. 4C, D, respectively).
MSC stay in the kidney through a passive mechanism
To study the mechanism responsible for MSC retention in kidneys, we examined the retention of inactivated MSCs in the kidney. HI-MSCs were generated by heating MSC to 50°C for 30 min, which made them metabolically inactive and therefore they lost their ability to adhere (Fig. 5).

HI-MSCs do not adhere to plastic in vitro.
Regular MSC or HI-MSC were infused in-vivo through the renal artery to healthy kidneys and MSC presence was assessed 30 min after administration by flow cytometry. HI-MSC were retained in similar numbers in the kidney as regular MSC (Fig. 6A).

MSC stay in the kidney through a passive mechanism.
Viability analysis of retained MSC confirmed that regular MSC infused to the kidney remained alive in the renal cortex, whereas infused HI-MSC were indeed non-viable (Fig. 6B). Dissociated renal tissue containing MSC was seeded in a culture dish to examine the adherent capacity of MSC in the tissue. Analysis of the adherent fraction of dissociated renal tissue demonstrated the presence of plastic-adherent Qdot-positive MSC, while only background fluorescence was detected in the HI-MSC group (Fig. 6C). Confocal microscopy and 3D cryoimaging of HI-MSC infused kidneys confirmed that HI-MSC were located in the same renal structures as regular MSC (Fig. 6D, E, respectively).
The majority of MSC are cleared from the kidney within 2 weeks
Male MSC were administered to female pigs which allowed male MSC tracing by a qPCR of a MSR located on the pig Y-chromosome. First, renal tissue was analyzed for the presence of Y-chromosome in kidneys harvested 30 min after infusion of 10 million MSC or HI-MSC. This demonstrated that both MSC- and HI-MSC-infused kidneys contained high amounts of Y-chromosome 30 min after MSC delivery (Fig. 7A).

MSCs are cleared from the kidney within 14 days.
The same experiment was repeated with 14 days follow-up. This showed that Y-chromosome could be detected 14 days after MSC infusion, whereas no such signal was detected in HI-MSC-infused kidneys. Although Y-chromosome DNA was detected after 14 days, the average relative amount at day 14 was ∼1% of the amount measured 30 min after infusion. Moreover, three of eight analyzed kidneys showed Y-chromosome DNA signal just above threshold.
Viability of the detected MSC was demonstrated as previously described by analyzing the plastic-adherent fraction of the dissociated renal tissue. This showed that dissociated renal tissue isolated 14 days after MSC delivery contained living, plastic-adherent male MSC, whereas no male MSC could be found in the plastic-adherent fraction of HI-MSC infused kidneys (Fig. 7B).
Discussion
In this study, we have tested the efficiency and tissue distribution of in vivo MSC infusion through the renal artery in a porcine ischemia–reperfusion injury model. We showed that targeted MSC delivery through the renal artery is a feasible route to deliver MSCs to the kidney. Upon infusion, MSCs are distributed throughout the kidney, located mostly in renal cortex, and particularly inside glomeruli. MSCs are retained in renal tissue presumably through a passive mechanism, and after infusion they survive for ∼8 h. The majority of MSCs were cleared from the kidneys within 2 weeks.
We show that renal intra-arterial-targeted infusion of MSCs minimizes off-target delivery as only small numbers of MSCs leave the kidney during infusion. Previous studies in animal models have simply associated the observed effects with the number of infused, but not delivered, MSCs to the injured kidney [25,32,33]. In our study, we actually quantify the number of MSCs delivered to the target tissue, which enables us to correlate observed effects with the MSC dose in future studies.
To do this, we used a semiquantitative flow cytometric method, which can be used to quantify MSC delivered to the kidney through renal intra-arterial infusion. Our approach using prelabeled MSC in combination with flow cytometric analysis of dissociated kidney tissue allowed us to have a good estimate of the absolute amount of MSCs that were retained in the kidney. Infusion of 10 million MSCs to the kidney resulted in numbers in the order of 1–4 × 10⁴ MSCs per gram of renal tissue delivered throughout the kidney, although the distribution was not completely homogeneous. Extrapolation of measured concentrations of MSCs using total kidney weight indicates that several million MSCs were delivered per kidney. This number points out that a significant amount of MSCs is not found back in the kidney.
However, it should be noted that the measured numbers are a minimum value, as part of the MSC might be lost during the tissue dissociation and analysis process. It is still unknown whether this number of MSCs is biologically relevant or therapeutically effective on the kidney. Therefore, our work paves the way for new studies to address this issue.
MSCs were retained mostly in glomeruli as demonstrated in other studies [24,25,32,33]. MSCs are relatively large, so they might simply get entrapped in the microcapillaries of glomerular structures in a similar manner to MSCs that are entrapped in the lung's capillary network after IV infusion [17]. However, the size of MSC used in our experiments averaged 16 μm, which is similar to some white blood cells, which are able to pass through the microcapillaries of glomeruli. Red and white blood cells can deform by altering their cytoskeletal structure to be able to flow through microcapillaries [34 –36]. However, MSCs are originally tissue-resident cells, which might be a reason not to have the same shape deformation capacities [37,38].
Moreover, HI-MSCs were retained in the same structures. These cells are not metabolically active and therefore unable to deform, which supports our hypothesis of a passive retention mechanism. We have shown that only bigger MSCs were found in the renal cortex, while smaller MSCs could pass through the glomerular microcapillaries and end up in the renal medulla or even leave the kidney. In a rat model, infused MSC stayed in the kidney, whereas other infused cell type, of the same size, failed to stay in renal tissue [24]. This fact suggests that MSCs are specifically retained by the kidney itself.
In the case that MSCs get stuck in the glomerular microcapillaries network, there might be some safety concerns as renal blood flow or function might be compromised. It has been reported in a rat model that after infusion of very high numbers of MSCs, parenchymal perfusion decreased, and it was restored to normality after 24 h [32]. Furthermore, several murine preclinical studies showed improved function of injured kidneys after delivery of MSC through the renal artery with no adverse effects [23,24,39]. Besides, a human clinical trial has not reported serious adverse effects upon renal intra-arterial infusion of MSCs and even showed, to some extent, improved kidney function [29].
MSCs have been shown to be short lived after IV infusion [17,18,40]. However, renal intra-arterial infusion of MSC seems to ensure longer survival of MSCs after infusion. In our study, MSC viability in the kidney 8 h after infusion was ∼70%–80%. However, after 14 days, most MSCs were cleared from the kidney. Nevertheless, large animal studies have shown the presence of MSCs up to 5 weeks after renal intra-arterial infusion [25], in contrast to our findings. In these large animal models, mostly autologous MSCs are used [25 –27,33], whereas rodent renal intra-arterial MSC infusion models usually employ allogeneic MSCs [21,23,24]. In both cases, similar survival of infused MSC was observed, which suggests that the origin of MSC does not affect survival after delivery.
From a logistic and translational point of view, the use of allogeneic MSC is more appealing as large numbers of therapeutic MSCs should be readily available for treatment. Our results confirm that infusion of allogeneic MSC is feasible in large animal models and enables survival of MSC in renal tissue.
The mechanism behind MSC retention after renal intra-arterial infusion is, so far, poorly understood. Although we have shown that retention of MSC in the kidney is independent of the metabolic status of the infused MSC, they could be actively attached by the glomerular endothelium. It has been described that MSCs can physically interact with endothelial cells through adhesion molecules present in their membrane, such as very late antigen 4 [41,42]. As HI-MSCs maintain the proteins expressed on their membrane, they may still be able to interact with the endothelium through this mechanism. The elucidation of the mechanisms behind the effects of MSC is essential to further develop MSC therapies.
However, conflicting data found in the literature defend both the paracrine secretion of cytokines [43,44] and the physical interaction with other cells [18,30] as the main mechanism of MSC action. This makes it difficult to draw a conclusion and therefore, additional experimentation is indeed needed.
Summarizing, renal intra-arterially infused MSCs are delivered particularly to the glomeruli and survive for ∼8 h after infusion. Their presence can potentially allow them to interact with injured tissue and elicit a regenerative response. To completely understand the potential of MSC therapy in kidneys, further studies are now starting to decipher the specific mechanisms of action of MSC after renal intra-arterial delivery, which will contribute to an improved MSC therapy for treatment of kidney injury.
Footnotes
Acknowledgments
This project is funded by the Lundbeck Foundation under grant application no. R198-2015-184 and Fabrikant Vilhelm Pedersen og Hustrus Legat under grant application no. 22720 2016.
Author Disclosure Statement
No competing financial interests exist.
Supplementary Material
Supplementary Figure S1
Supplementary Figure S2
Supplementary Figure S3
Supplementary Figure S4
References
Supplementary Material
Please find the following supplemental material available below.
For Open Access articles published under a Creative Commons License, all supplemental material carries the same license as the article it is associated with.
For non-Open Access articles published, all supplemental material carries a non-exclusive license, and permission requests for re-use of supplemental material or any part of supplemental material shall be sent directly to the copyright owner as specified in the copyright notice associated with the article.