
Abstract
Inflammatory conditions affect periodontal ligament (PDL) homeostasis and diminish its regenerative capacity. The complexity of biological activities during an inflammatory response depends on genetic and epigenetic mechanisms. To characterize the epigenetic changes in response to periodontal pathogens we have focused on histone lysine methylation as a relatively stable chromatin modification involved in the epigenetic activation and repression of transcription and a prime candidate mechanism responsible for the exacerbated and prolonged response of periodontal cells and tissues to dental plaque biofilm. To determine the effect of inflammatory conditions on histone methylation profiles, related gene expression and cellular functions of human periodontal ligament (hPDL) progenitor cells, a hPDL cell culture system was subjected to bacterial cell wall toxin exposure [lipopolysaccharide (LPS)]. Chromatin immunoprecipitation-on-chip analysis revealed that healthy PDL cells featured high enrichment levels for the active H3K4me3 mark at COL1A1, COL3, and RUNX2 gene promoters, whereas there were high occupancy levels for the repressive H3K27me3 marks at DEFA4, CCL5, and IL-1β gene promoters. In response to LPS, H3K27me3 enrichment increased on extracellular matrix and osteogenesis lineage gene promoters, whereas H3K4me3 enrichment increased on the promoters of inflammatory response genes, suggestive of an involvement of epigenetic mechanisms in periodontal lineage differentiation and in the coordination of the periodontal inflammatory response. On a gene expression level, LPS treatment downregulated COL1A1, COL3A1, and RUNX2 expression and upregulated CCL5, DEFA4, and IL-1β gene expression. LPS also greatly affected PDL progenitor function, including a reduction in proliferation and differentiation potential and an increase in cell migration capacity. Confirming the role of epigenetic mechanisms in periodontal inflammatory conditions, our studies highlight the significant role of histone methylation mechanisms and modification enzymes in the inflammatory response to LPS bacterial cell wall toxins and periodontal stem cell function.
Introduction
The periodontal ligament (PDL) is a unique, nonmineralized connective tissue localized between tooth root cementum and alveolar bone. The major functions of the PDL include tooth support, homeostasis, and protection of the underlying tissues from pathogens in the oral cavity and tissue repair. The PDL contains heterogeneous cell populations including PDL stem cells (PDLSCs) [1,2]. Periodontal stem cells are mesenchymal progenitor cells that have the ability to proliferate and differentiate and to participate in cementum, alveolar bone, and PDL regeneration after injury, periodontal therapy, tooth transplantation, and/or replantation, and orthodontic tooth movement [3 –6]. Compared with their neural crest precursors, PDL progenitors are committed progenitors characterized by the expression of collagen and RUNX2 genes as periodontal lineage marker genes [7].
Inflammation in the periodontium results from the host response to the oral biofilm and is the major cause of periodontal disease. If untreated and progressive, periodontal disease has deleterious consequences for the health of the dentition, including PDL destruction, alveolar bone loss, and ultimately tooth loss. On a biological level, inflammatory conditions diminish PDL homeostasis and its tissue regeneration capacity [8]. Although PDLSCs are present both in healthy and in diseased PDL tissues, inflammatory conditions affect the number, proliferation, and distribution of periodontal progenitors; enhance their migratory capacity; and impair their osteogenic potential [9 –13].
The onset of periodontal disease is characterized by an inflammatory response to the lipopolysaccharide (LPS) from the cell walls of the gram-negative bacteria that constitute the majority of the pathogenic periodontal microflora [14]. In response to LPS, PDL cells produce proinflammatory cytokines, chemokines, and matrix metalloproteinases, which are responsible for inflammatory infiltration and tissue destruction in the periodontium [15 –17]. LPS also modifies the differentiation potential of PDLSCs [18]. From a mechanistic perspective, LPS is a ligand of Toll ligand receptors, and activates nuclear factor kappa B (NF-κB) signaling through the toll-like receptor (TLR) pathway [19].
Previous studies have demonstrated that epigenetic regulation of gene expression affects the differentiation and function of mesenchymal stem cells (MSCs) [20 –23]. Several epigenetic mechanisms including histone modification, DNA methylation, and nuclear positioning control chromatin structure and regulate gene expression by modulating the accessibility for transcription factors to interact with the promoters and enhancers of the regulated genes [24]. Among these mechanisms, histone methylation is involved in both activation and repression of gene expression. Trimethylation of histone H3 at lysine-4, -36, and -79 (H3K4me3, H3K36me3, and H3K79me3) results in active marks, whereas trimethylation of H3 at lysine-9 and -27 (H3K9me3 and H3K27me3) indicates repressive marks [25,26]. Histone methylation studies in embryonic and other stem cells have identified regions that were marked for both H3K27me3 and H3K4me3 [27 –29]. Promoter regions that are bivalently marked for both H3K4me3 and H3K27me3 are indicative of genes that are poised for transcription and may be further methylated for repression or for activation of gene expression in MSCs [30].
In previous studies we have demonstrated that odontogenic lineage specification and progenitor differentiation are regulated by changes in histone methylation [31]. Furthermore, histone methylation is also affected by inflammation [32]. In this study, we have hypothesized that inflammation as it occurs during periodontal disease affects periodontal progenitor cell function by dysregulating gene expression of periodontal matrix genes and inflammatory response genes. To characterize the epigenetic response to periodontal pathogens in periodontal stem cells, we have analyzed H3K4 and H3K27 histone trimethylation in response to LPS exposure, and correlated our findings with data related to matrix protein and inflammatory response gene expression, cell function, and differentiation after LPS treatment.
Materials and Methods
Cell culture
PDL progenitor cells (PDLSCs) were isolated from human extracted third molars, and maintained in Dulbecco's modified Eagle's medium (DMEM; Gibco BRL, Gaithersburg, MD) supplemented with 10% fetal bovine serum (FBS; Atlanta Biologicals, Lawrenceville, GA), 100 U/mL penicillin, 100 μg/mL streptomycin, and 25 ng/mL amphotericin B in a 5% CO2 atmosphere at 37°C. This procedure followed the human subject regulations of Texas A&M University and University of Illinois. Inflammatory conditions were mimicked by adding 10 μg/mL Pg-LPS (InvivoGene, San Diego, CA) or Escherichia coli LPS (strain 0111:B4; Sigma-Aldrich Chemical, St Louis, MO) to the culture medium. To study the effects of LPS on osteogenic differentiation, human periodontal ligament stem cells (hPDLSCs) were subjected to a mineralization induction medium containing 10 nM dexamethasone, 50 μg/mL ascorbic acid, and 2 mM β-glycerophosphate and cultured for 14 or 28 days. Upon terminating the culture, cells were subjected to alkaline phosphatase (ALP) activity assays or alizarin red staining.
Chromatin immunoprecipitation-on-chip analysis
Sample preparation
PDL cells grown on 150-mm plates were crosslinked with 1.1% formaldehyde at room temperature. The reaction was stopped with 125 mM glycine. Cells were harvested, and pooled cells were then aliquoted, flash frozen, and stored at −80°C. For chromatin immunoprecipitation (ChIP) assays, nuclei were prepared from 1 × 10⁶ cells and resuspended in lysis buffer. After incubation on ice, nuclear lysates were sonicated to a size of 300 bp to 1 kb in a cup horn sonicator (Qsonica, Newton, CT). Sheared chromatin was centrifuged at 12,000 rpm and incubated overnight with 100 μL of DynaI beads (Invitrogen, Carlsbad, CA), prebound with 10 μg of antibody against each histone modification: histone H3 trimethyl K4 and histone H3 trimethyl K27 (ab8580, ab8898; Abcam, Cambridge, United Kingdom). An input fraction was kept aside for background normalization. Next, beads were separated on a magnetic stand and washed 5 times with RIPA buffer and once with 1 × Tris-EDTA buffer (TE). Bound protein–DNA complexes were eluted from the beads by incubating with the elution buffer at 65°C, followed by crosslink-reversal overnight at 65°C. DNA was purified by proteinase K digestion, phenol–chloroform extraction, and ethanol precipitation. The resulting pellet was resuspended in Tris buffer (pH 8.0). ChIP experiments were performed as triplicates.
ChIP-on-chip array
ChIP DNA quality and concentration were determined on a NanoDrop spectrophotometer. All samples were whole genome amplified. Dual-color labeling reactions were performed using the NimbleGen Dual-color labeling Protocol (ver 6.2). About 1 mg of IP and input DNA sample were labeled with Cy5 and Cy3, respectively. Labeled DNA was then purified and the labeling efficiency was determined by the NanoDrop spectrophotometer. Fifteen micrograms of the labeled immunoprecipitated DNA was pooled for hybridization with 15 μg of labeled input DNA placed on the 3X720K Roche Human ChIP-chip Promoter microarray and hybridized at 42°C for 20 h. The arrays represent 22,542 promoters based on Human genome 18 build (HG18) with a tiling of 3,200 bp upstream and 800 bp downstream to each transcription start site (TSS). Finally, the arrays were washed and scanned at a 2-mm resolution on a NimbleGen MS 200 Microarray Scanner. Data were processed through DEVA software using NimbleScan Software User's Guide (ver 2.6) and the Design files and genome annotations for HG18 Refseq promoters. A quality experimental metrics report was generated for each sample that met the guidelines set by Roche NimbleGen.
Raw data processing and gene annotation
Datasets corresponding to histone enrichment values in both immunoprecipitated and input samples were used to obtain Ratio.GFF files and merged to get average values for histone modification enrichment. These files were converted to wiggle files for visualization in an integrative genomics viewer (IGV) genome browser [31]. Software was used to obtain significant peaks that were mapped to 5,000 bp upstream and 1,000 bp downstream of the nearest TSS to generate a peak report [31]. Promoter information was used for downstream analysis [31].
ChIP-polymerase chain reaction analysis
ChIP-polymerase chain reaction (PCR) assays were performed with control and LPS-challenged experimental groups. All DNA samples obtained from ChIP were diluted to a concentration of 2 ng/μL. Real-time quantitative PCR was performed on an ABI 7500 FAST machine with 4 ng of ChIP DNA, and the total input was used as an internal reference for normalization. Enrichment for beads alone was used as a negative control. Data presented for each primer pair were obtained after subtracting the values obtained from the corresponding negative controls. The primer sequences are given in Table 1.
Human Chromatin Immunoprecipitation and Reverse Transcriptase-Polymerase Chain reaction Primer Sequences
ChIP, chromatin immunoprecipitation; PCR, polymerase chain reaction.
ALP assay, alizarin red staining, and light microscopy
To determine ALP activity, control and LPS-treated cells were washed and stained with ALP substrate (Roche Diagnostic, Indianapolis, IN). To determine mineralization potential, mineral deposits were detected after fixing with cold methanol and staining with 1% alizarin red solution. Phase-contrast images of control and LPS-treated hPDL cells were obtained using a Leica inverted microscope.
Colony-forming assay
Colony-forming assays were performed using hPDLSCs. Cells were cultured at a density of 104 per well in 6-well culture plate. After 7 days of culture, the cells were fixed with 4% buffered formaldehyde and then stained with 0.1% toluidine blue.
MTT cell proliferation assay
Human PDL cells were cultured in 96-well plates for 1–4 days. Before culture termination, cells were incubated in MTT solution (2 mg/mL of MTT in DMEM with 2% FBS) for 4 h. The MTT stained cells were lysed in HCl/isopropanol, and the absorbance was detected at 570 nm with background subtraction at 630 nm.
Cell migration assay
LPS was added into the culture medium in the lower chamber. The hPDL cells were seeded into each insert and allowed to migrate to the underside of the membrane for 24 h. BSA treatment was used as a control. The cultured cells were washed with phosphate-buffered saline (PBS) and cultured in growth medium. The nonmigrated cells on the upper surface of the membrane were removed and the migratory cells attached to the lower surface were stained with 4′ 6-diamidino-2-phenylindole (DAPI). The average number of migrated cells per field was counted using a Leica DMRX fluorescent microscope.
Cellular motility assay
The hPDL cells were grown to confluence on culture plate. A linear scratch was made using a sterile 200 μL pipette tip and the wells were washed 3 times with PBS. Six hours after the scratch, 10 μg/mL LPS were added to the cell cultures for 24 h. The remaining wound area was measured using ImageJ software [33].
In vivo subcutaneous implantation experiments
Twenty microliters of LPS solution (10 μg/mL) or 20 μL of PBS was applied to a collagen sponge (2 × 2 × 2 mm) and incubated at 4°C overnight to coat the scaffold surface, and then lyophilized [34]. The collagen sponges were mixed with hPDL cells and incubated at 37°C for 3 h [34]. The collagen sponges were implanted into the back of nude mice below the subcutis. The mice were killed 4 weeks after implantation and the implants were dissected and prepared for paraffin embedding histological examination [34]. This study followed the protocols approved by the Institutional Animal Care and Use Committees of Texas A&M University and University of Illinois.
Histological staining
Implants were deparaffinized, rehydrated in a descending ethanol series, and rinsed in deionized water. For hematoxylin and eosin staining, sections were dipped in hematoxylin for 5 min, placed in PBS for 5 min, dipped in eosin for 1 min, dehydrated in an ascending ethanol series, and finally cleared in xylene. Sections were mounted with cover slips using Permount (Fischer Scientific, Hampton, NH). Masson's Trichrome staining was used to mark collagen fibers. For this procedure, deparaffinized and rehydrated sections were refixed in Bouin's solution for 1 h at 56°C, stained in Weigert's iron hematoxylin working solution for 10 min, in Biebrich scarlet-acid fuchsin solution for 15 min, and then transferred to aniline blue solution and stained for 10 min. Collagen stained blue, nucleus stained black and muscle, cytoplasm, and keratin stained red. To determine the mineralization, the sections of undecalcified implants were stained with alizarin red as described previously.
RNA extraction and reverse transcriptase (RT) real-time PCR
Total RNAs were isolated from human PDL cells using the RNeasy® Plus Mini Kit according to the manufacturer's instructions (Qiagen, Hildin, Germany). Two micrograms of total extracted RNA was applied toward cDNA generation with the Sprint RT Complete Kit® (Clontech, Mountain View, CA). Real-time PCR was performed with sequence-specific primers, using SYBR green Master Mix and the ABI Prism 7000 Sequence detection system (Applied Biosystems, Carlsbad, CA). Reaction conditions were as follows: 2 min at 50°C (1 cycle), 10 min at 95°C (1 cycle), 15 s at 95°C, and 1 min at 60°C (40 cycles). Samples were normalized to levels of β-actin or GAPDH. The analyses were performed in 96-well plate reactions with 2 reference gene wells and 2 target gene wells per sample. To quantify relative differences in mRNA expression, the comparative CT method (ΔΔCT) was used to determine relative quantity. Values were graphed as the mean expression level ± standard deviation.
Statistical analysis
Comparison of the results in each experimental group was performed using an unpaired Student's t-test with Welch's correction for unequal variances. One-way analysis of variance with Dunnett post hoc test was used to evaluate significant differences among experimental groups. All calculations were performed using GraphPad Prism 6.
Results
Epigenetic mechanisms controlled the commitment of hPDLSCs
ChIP-on-chip analysis revealed the occupancy patterns of histone methylation marks H3K4me3, H3K9me3, and H3K27me3 on the promoter regions of the matrix proteins COL1A1, COL3A1, and the osteogenesis master gene RUNX2, as well as the inflammation-related genes CCL5, DEFA4, and IL-1β. The active mark H3K4me3 displayed higher enrichment levels at COL1A1, COL3A1, and RUNX2 genes (Fig. 1A), whereas the repressive marks H3K9me3 and H3K27me3 demonstrated higher occupancy levels at CCL5, DEFA4, and IL-1β genes in hPDLSCs (Fig. 1B).

ChIP-chip enrichment profiles of inflammatory and bone matrix genes in hPDL cells and comparison of histone modification patterns at osteogenic and inflammatory gene promoters after LPS treatment.
LPS increased H3K27me3 occupancy on the promoter regions of osteogenic genes and increased H3K4me3 occupancy on inflammatory response genes
In our hPDL cell culture system, inflammatory condition was mimicked by adding LPS to culture medium. Upon LPS stimulation, the occupancy of the repressive mark H3K27me3 was dramatically enhanced, whereas the enrichment of the active mark H3K4me3 was reduced on the promoters of COL1A1, COL3, and RUNX2 genes (Fig. 1C). In contrast, the inflammatory response genes CCL5, DEFA4, and IL-1β were predominantly marked with the active H3K4me3 mark, whereas there was no significant change in the occupancy of the repressive H3K27me3 mark on the promoters of CCL5 and DEFA4 genes in PDL-treated hPDLSCs compared with the control group (Fig. 1D).
Downregulation of osteogenesis-related gene expression and inhibition of osteogenic differentiation of hPDL cells after LPS challenge
In tandem to the increased occupancy of H3K27me3 on the promoters of COL1A, COL3A, and RUNX2 genes, LPS challenge resulted in a significant decrease in the expression of COL1A1 (P < 0.001), COL3 (P < 0.05), and RUNX2 (P < 0.001) compared with untreated control cells (Fig. 2A). Western blot analysis revealed that the expression of COL1A and RUNX2 proteins was reduced upon LPS challenge (Fig. 2B). LPS treatment also resulted in reduced ALP staining and alizarin red staining compared with control, indicative of an inhibition in mineralization (Fig. 2D, E). Colony-forming unit assays revealed that CFU-hPDL numbers were significantly reduced in LPS-treated hPDL cells versus controls (P < 0.05) (Fig. 2C, F). Finally, LPS treatment caused a gradual decrease in hPDL cell number in a time-dependent manner compared with the control group (Fig. 2G).

Effects of LPS challenge on the expression of osteogenesis-related genes and osteogenic differentiation of hPDL cells.
Upregulation of inflammatory response genes and changes in hPDL cell behavior after LPS challenge
In contrast to its effect on osteogenesis-related genes, LPS challenge resulted in increased expression of the inflammatory response genes DEFA4, CCL5, and IL-1β (Fig. 3A), matching our earlier data related to the enrichment of H3K4me3 mark on the promoters of CCL5, DEFA4, and IL-1β genes (Fig. 1). Western blot analysis demonstrated that the expression of CCL5 and IL-1β proteins was enhanced upon LPS challenge (Fig. 3B). LPS treatment also increased the number of DAPI-stained human PDL cells that migrated through the inserts in the transwell culture system (Fig. 3C). The relative number of migrated PDL cells was 4.8 times more (P < 0.05) in the LPS-treated group than that in the control group (Fig. 3D). In addition, our wound healing scratch assay demonstrated that after 24-h LPS challenge, there was 30% more wound closure than in non-LPS-treated controls (P < 0.05) (Fig. 3E, F).
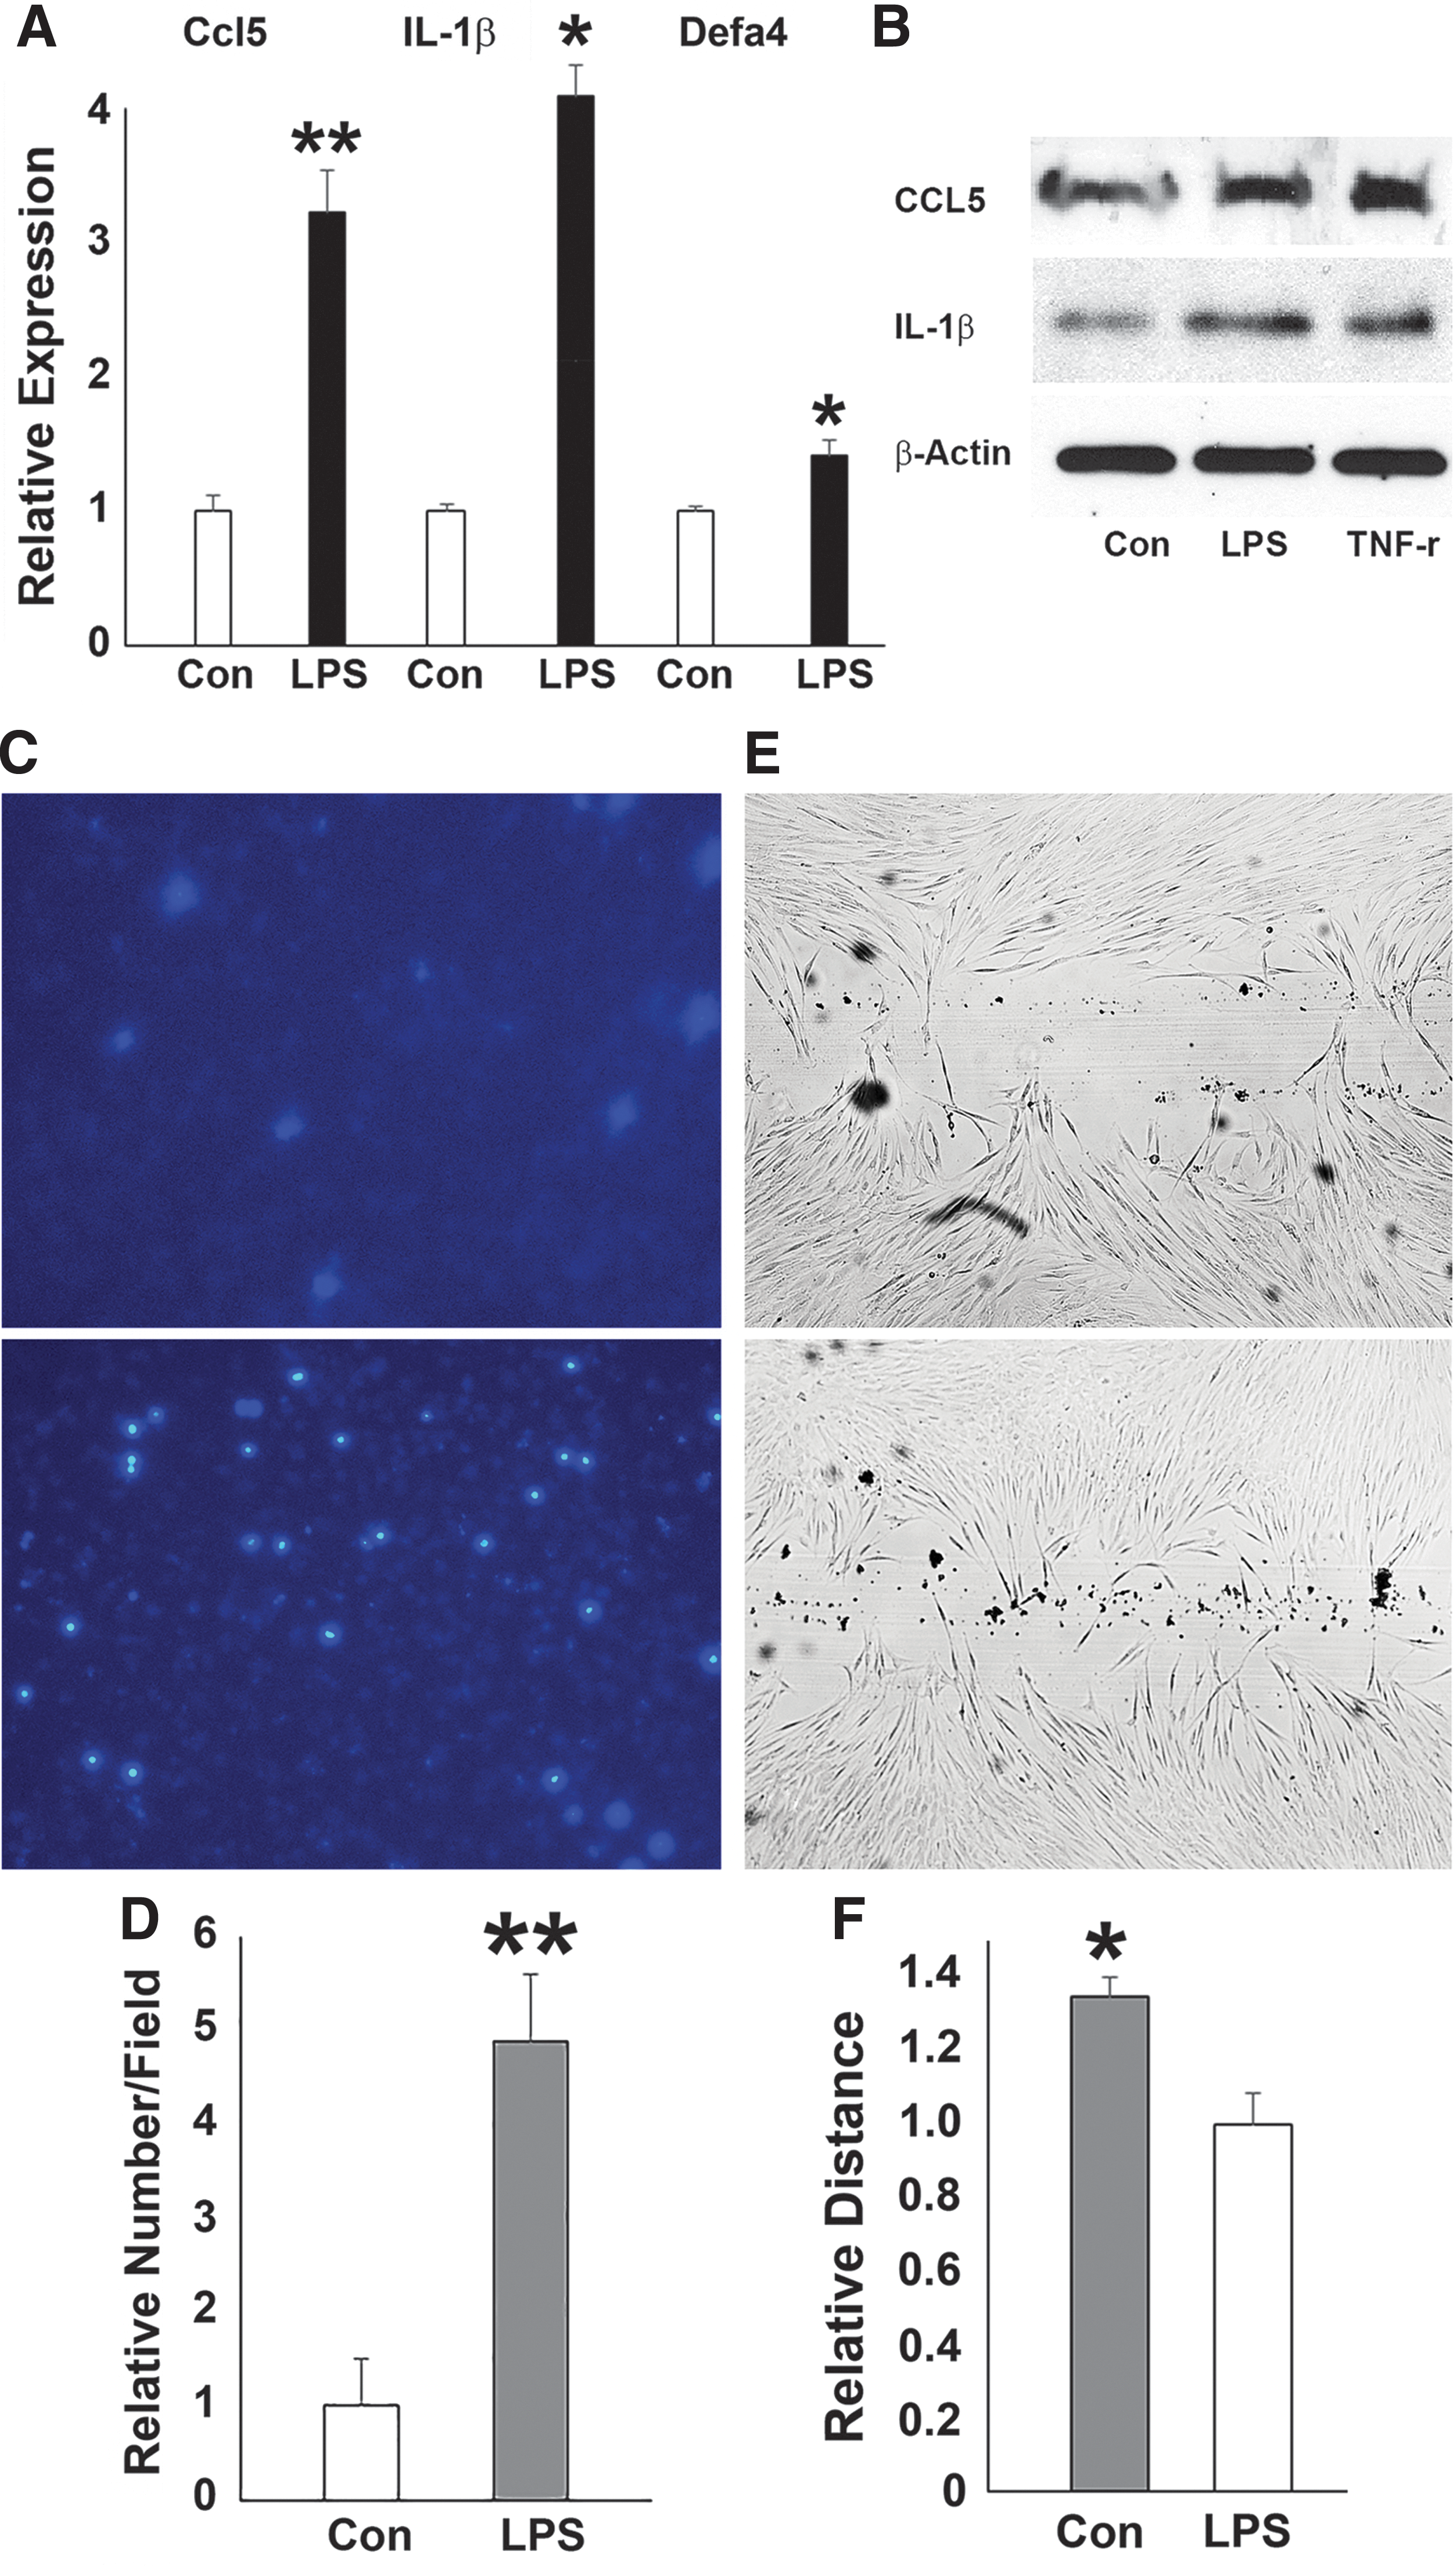
Effects of LPS challenge on the expression of inflammatory response genes, and hPDL cell behavior.
LPS caused scaffold infiltration with migratory cells and extracellular matrix remodeling in subcutaneous implants
To determine the in vivo effect of LPS on the differentiation and function of PDLSCs in implanted tissue scaffolds, subcutaneous collagen sponge implants were treated either with LPS or PBS (physiological control), seeded with PDLSCs, harvested after 4 weeks, and prepared for paraffin sections (Fig. 4). Morphometry on 10 randomly selected sections revealed a 2.5-fold increase in cell number including inflammatory cells in LPS-treated implants compared with the PBS-treated control group (Fig. 4A). Using Masson's trichrome staining as a means to identify collagen fibers, the effect of LPS on collagen synthesis and remodeling of the subcutaneously implanted collagen scaffold was assessed. The extracellular matrix of the LPS-treated group consisted of short and thin collagen fibrils compared with the long and thick fibers and the dense fiber meshwork of the control group (Fig. 4B). Furthermore, LPS treatment decreased the amount of alizarin red staining compared with the control, implying decreased mineralization potential among the hPDL cells grown on LPS-coated scaffold environments (Fig. 4C).

Effect of LPS on extracellular matrix remodeling, cell migration, differentiation, and function in vivo. Collagen sponges were treated with PBS or LPS and subcutaneously implanted into nude mice for 4 weeks.
Histone methyltransferases and demethylase affected PDL progenitor gene expression and cell function under inflammatory condition
Gene-specific changes in H3K4me3 and H3K27m3 enrichment under inflammatory condition suggest that H3K4me3 and H3K27me3 histone methyltransferases and/or demethylases may be involved in the regulation of periodontal progenitor gene expression and cell function. Here we have asked whether corresponding histone lysine methylation enzymes regulate trimethylation of the major active and repressive histone marks. Specifically, to determine whether SETD1 and/or KDM5B controls H3K4me3 levels or whether EZH2 and/or KDM6B controls H3K27me3 levels, we performed gene knockdown experiments using ON-TARGETplus small siRNAs specific for SETD1, KDM5B, EZH2, and KDM6B genes. Knockdown efficiency was 97% for SETD1B, 72% for KDM5B, 69% for EZH2, and 88% for KDM6B after 72 h of transfection. Knockdown of EZH2 upregulated the expression of COL3A1 (1.7-fold, P < 0.05) expression. Knockdown of KDM6B significantly reduced COL1A1 (1.5-fold, P < 0.05) and RUNX2 (1.3-fold, P < 0.05). These results indicate that osteogenic lineage and matrix proteins are regulated through modulating H3K27me3 levels. Knockdown of SETD1B downregulated CCL5 (1.2-fold, P < 0.05), DEFA4 (1.1-fold, P < 0.05), and IL-1β (1.2-fold, P < 0.05) expression. Overall, knockdown of SETD1/KDM5B or EZH2/KDM6B histone methylation enzymes resulted in highly unique changes in gene expression signatures (Fig. 5B). When applied in vitro, the specific reduction of SETD1B levels caused inhibition of LPS-induced PDLSCs migration (Fig. 5C, D). In contrast, a decrease in EZH2 expression resulted in enhanced ALP activity of LPS-treated PDLSCs, whereas no effect on cell migration was recorded (Fig. 5C, D). In addition, in vitro knockdown of KDM6B inhibited ALP activity in human PDL cells (Fig. 5D). Together, these data demonstrate that changes in histone methylation and demethylation enzymes affect matrix and osteogenic lineage gene expression, inflammatory response gene, and periodontal progenitor function.

Effects of SETD1 or EZH2 gene knockdown on cell function and gene expression.
Discussion
This study was undertaken to provide a baseline assessment of the epigenetic regulation of the periodontal host response after exposure to bacterial cell wall toxins (LPS). Changes in histone methylation patterns in PDL progenitors were determined after LPS treatment in cell culture or after seeding of cells on LPS-coated and control scaffolds. In response to LPS, H3K27me3 enrichment increased on extracellular matrix and osteogenesis lineage gene promoters, whereas H3K4me3 enrichment increased on the promoters of inflammatory response genes. On a gene expression level, LPS treatment downregulated COL1A1, COL3A1, and RUNX2 expression and upregulated CCL, DEFA4, and IL-1β gene expression. LPS also greatly affected PDLSC function, including a reduction in proliferation and differentiation potential and an increase in cell migration capacity. Together, these data suggest that LPS bacterial cell wall toxins affect gene expression in periodontal stem cells by modulating their histone methylation status, which in turn compromises periodontal stem cell function.
ChIP-on-chip analyses of hPDLSCs demonstrated high enrichment levels for the active H3K4me3 mark at COL1A1, COL3A1, and RUNX2 gene promoters, whereas there were high occupancy levels for the repressive H3K27me3 marks at DEFA4, CCL5, and IL-1β gene promoters. These data provide a first glance at the extensive level of epigenetic control of periodontal lineage commitment and immune response. Similar histone methylation patterns at matrix and mineralization genes were also observed in other odontogenic progenitor cells including dental follicle and dental pulp stem cells [31]. The odontogenic progenitor-specific activation pathway of gene expression may allow these cells to produce nonmineralized or mineralized dental tissues during tooth development and regeneration based on environmental cues.
In hPDLSCs, LPS downregulated the expression of osteogenesis-related genes such as COL1A1, COL3A1, and RUNX2 in PDL cells and decreased their osteogenic potential. Moreover, in subcutaneously implanted collagen sponges seeded with hPDLSCs, LPS increased cell infiltration, inhibited mineralization, and affected collagen matrix organization. The effects of LPS on periodontal matrix destruction are well-established [35,36]. In this study, we have correlated the effects of LPS on periodontal cell behavior and histone methyl mark enrichment on the promoters of osteogenic and inflammatory response genes. Specifically, we have discovered increased H3K27me3 occupancy on osteogenic and matrix gene promoters and increased H3K4me3 occupancy on inflammatory gene promoters upon LPS stimulation, providing a potential epigenetic mechanism by which these genes are regulated.
Our ChIP-on-chip of PDLSCs analysis indicated that in contrast to the active lysine methylation marks at extracellular matrix and mineralization gene promoters, inflammatory gene promoters were strongly repressed as evidenced by high levels of H3K9me3 and H3K27me3 enrichment. However, upon LPS challenge, the expression of inflammatory genes such as DEFA4, CCL5, and IL-1β was significantly increased, a trend echoed by a switch from repressive methyl marks to the active H3K4me3 marks on inflammatory gene promoters. On a cellular level, the effect of LPS on PDLSCs resulted in increased cell migration. Such behavior might be explained by the well-documented effects of proinflammatory cytokines and chemokines on proliferation, differentiation, and functions of stem cells and inflammatory cells [37 –39]. Together, our data indicate that LPS regulates inflammation-related gene expression and cellular functions through histone methylation.
Our data demonstrated that histone methyltransferases were directly involved in the regulation of gene expression in PDLSCs under inflammatory conditions and their corresponding cell function. Recent studies indicate that LPS and proinflammatory cytokines have a direct inhibitory effect on osteoblastogenesis of mesenchymal progenitors including PDLSCs [18,34,40,41]. These inflammatory factors inhibit both the expression and function of the osteogenic master genes RUNX2 and OSX [42]. In this study, RUNX2 gene expression was downregulated in PDLSCs after LPS treatment. This inhibitory effect of LPS on RUNX2 expression is associated with the increased enrichment of H3K27me3 on gene promoters (Figs. 2 and 3). The occupancy of H3K27me3 on the promoters of RUNX2 and OSX genes seems to play a critical role during osteogenesis because both histone methyltransferase and demethylase for H3K27me3 regulate osteoblast differentiation. Especially the H3K27me3 methyltransferase EZH2 has been shown to inhibit osteogenic differentiation of MSCs, whereas the H3K27me3 demethylase Jmjd3 has an opposite effect and promotes osteogenic differentiation [20,43 –45]. Other histone methylation modulating enzymes such as the H3K4 methyltransferases such as MLL1 [46], MLL4 [47] and COMPASS family members [48] are involved in the control of NF-κB-mediated gene expression by modulating H3K4 methylation states under inflammation conditions. Our study indicated that H3K27me3 labeling is absent or at low levels on the promoters of RUNX2 and COL1A1 and COL3A1 in committed PDLSCs, indicative of the removal of H3K27me3 from genes that have been upregulated upon stem cell commitment [49]. Increase in the enrichment of H3K27me3 on the promoters of these genes under inflammatory conditions suggests that inflammatory environments influence gene expression and functions of MSCs through histone methylation and classic epigenetic enzymes.
Footnotes
Acknowledgment
Generous funding by NIDCR grants F30 DE 024352 to M.F. and 1R01 DE019463 to X.L. is gratefully acknowledged.
Author Disclosure Statement
No competing financial interests exist.