
Abstract
Mesenchymal stromal cells (MSCs) hold great promise in the field of regenerative medicine due to their ability to create a variable localized anti-inflammatory effect in injuries such as Crohn's disease and osteoarthritis or by incorporation in tissue engineered constructs. Currently, the MSC literature uses rodents for preclinical disease models. There is growing interest in using naturally occurring disease in large animals for modeling human disease. By review of the canine MSCs literature, it appears that canine MSCs can be difficult to maintain in culture for extended passages and this greatly varies between tissue sources, compared with human and rodent MSCs, and limited lifespan is an obstacle for preclinical investigation and therapeutic use. Research using canine MSCs has been focused on cells derived from bone marrow or adipose tissue, and the differences in manufacturing MSCs between laboratories are problematic due to lack of standardization. To address these issues, here, a stepwise process was used to optimize canine MSCs isolation, expansion, and cryopreservation utilizing canine umbilical cord-derived MSCs. The culture protocol utilizes coating of tissue culture surfaces that increases cellular adherence, increases colony-forming units-fibroblast efficiency, and decreases population doubling times. Canine MSCs isolated with our protocol could be maintained longer than published canine MSCs methods before senescing. Our improved cryopreservation protocols produce on average >90% viable MSCs at thaw. These methods enable master-bank and working-bank scenarios for allogeneic MSC testing in naturally occurring disease in dogs.
Introduction
Multipotent mesenchymal stromal cells (MSCs) are a heterogeneous population of cells that includes stem, progenitor, and differentiated cells. MSCs were originally described in the 1960s as the fibroblastic population of adherent cells derived from bone marrow (BM) that are distinct from the hematopoietic cells found in that niche [1].
Since then, MSCs have been isolated from adult tissues, such as adipose tissue (AT) and BM, and extraembryonic tissues such as the placenta and umbilical cord (UC). Although there may be differences in the MSC populations isolated from each source that could impact their value for regenerative medicine applications, MSCs derived from UC have several advantages over adult tissue sources: UCs are collected nonsurgically from a discarded tissue, they can be collected with no risk or pain to the donor, and they are collected from individuals of a consistent young age [2,3]. Thus, UC-MSCs are a limitless and noncontroversial source of MSCs.
We [4,5] and others [6
–9] have isolated human UC-MSCs, cryogenically banked, and expanded the cells for potential therapeutic applications. For regenerative medicine applications, UC-MSCs might be preferred to adult tissue-derived MSCs due to age-related or disease-related changes that affect MSCs [10
–12]. UC-MSCs are in human clinical testing both in the United States and abroad (
Many factors affect the efficiency to generate MSCs. These factors include isolation method, donor pool, efficiency (cell yield per donor), expansion potential of isolated cells, medium formulation, cell plating density, passaging protocol, cryopreservation efficiency, characterization procedures, senescence, and thawing procedure. Based upon the lack of consistency in manufacturing between laboratories, we suggest that MSC protocols need to be both optimized and standardized.
Many common human genetic disorders and many naturally occurring diseases in humans have canine homologs, adding to the importance of canines as a model for human disease [25]. In addition, canines are an important model species for human anatomical injuries, especially those involving large joints [26]. Canine MSCs have been used as an experimental treatment for orthopedic injuries and show positive clinical results in pilot studies [27 –30]. A recent uncontrolled nonblinded clinical trial in 22 dogs indicated the safety and efficacy of neonatal MSCs in canines with arthritis for a 2-year follow-up period [31]. Canine MSCs are under-represented in the scientific literature compared with human and rodent MSCs [PubMed search February 11, 2019; search terms MSCs and (canine or dog) = 317; MSCs and human = 13,070; MSCs and (rat or mouse) = 8,821].
Here, barriers that impede canine MSC testing are addressed. First, some tissue-specific canine MSCs are slower to expand in culture or undergo senescence around passage 6 [13,17,22,25,28], with some groups surpassing six passages [32 –34]. Second, a consensus set of canine MSC antibodies for characterization has not been established [35]. Having a standardized panel of monoclonal antibodies for cell surface markers CD105, CD44, CD73, CD90, DLA class I and II, CD31, CD45, and CD34 would constitute a minimal set of MSC characterization antibodies. Third, trilineage differentiation has been demonstrated by some groups [17,25,28,36 –41], but not by other groups [19,22,32,42 –46], which suggests that standardized osteogenic, chondrogenic, and adipogenic differentiation protocols for MSCs are needed.
As we provided for human UC-MSCs [4,5], in this study we provide protocols for isolation, expansion, and characterization for canine UC-MSCs. Standardizing protocols may improve the ability to compare results across laboratories and enable clinical translation. Our methods provide healthy viable canine MSCs that can be cryopreserved, thawed, and expanded. The characterization standards for canine MSCs provided here are not comprehensive. However, the protocols provided here remove key barriers and, thus, enable canine UC-MSCs research.
Materials and Methods
UC collection
Institutional animal care and use committee (IACUC) reviewed and approved the current research. The current protocol was deemed an “exempt animal use activity” under guideline no. 21 exemption policy 2.3 “…studies that do not use live animals provided that the tissue is obtained from an IACUC-approved source and is discarded in accordance with all relevant state laws and institutional policies governing disposal of hazardous waste.”
Canine UCs donated after cesarean-section births with owner–informed consent were used. In brief, the dam was anesthetized and placed in lateral recumbence; the abdomen was shaved and surgically prepared for a lateral celiotomy approach to the uterus. The uterus was exteriorized, a single hysterotomy was made, and the pups were delivered. The UCs were separated from the placenta and placed in a sterile transport medium made from an isotonic neutral buffered solution supplemented with 1% antibiotic–antimycotic (Catalog No. 15240062; Gibco) and placed into a 4°C refrigerator. Cords were kept in a styrofoam cooler during transport. Once received in the laboratory, cords were refrigerated at 4°C until processing. All cords were processed within 5 days of birth. Donor breed information was recorded when provided by the clinic, but is not evaluated here.
Gelatin coating of tissue culture plastic
A solution of 0.1% w/w porcine skin gelatin (Catalog No. G2500-100G; Sigma Aldrich) dissolved in distilled water was sterilized and cooled before use. Gelatin solution was added to the flask or well and swirled for 10–15 s. Gelatin was removed and the plate or flask was air dried in the biological safety cabinet (BSC). The dried plates were sealed tightly and stored refrigerated until use, or they were used immediately after drying.
Isolation
UCs were collected from an entire litter and litter size was not considered as a variable. In contrast to human cords, puppies' cords have a complex vascular structure that arborizes making it difficult to determine the vascular material of an individual (boxes in Supplementary Fig. S1). Furthermore, the UCs from littermates were intertwined within the fetal adnexa tissue. The cords were stripped away from the adnexa without stretching or ripping (Supplementary Fig. S1), and pooled, then the length was measured for a desired amount per tube.
Processing of UCs and trimming were performed in the BSC. The cords were rinsed repeatedly in 37°C Dulbecco's phosphate-buffered saline (DPBS) containing 1% antibiotic–antimycotic (1% A/A; Catalog Nos. 14-190-250, 15-240-062; Gibco). The cord length was measured and it was cut into 0.25 cm sections, then transferred into a C-tube (Catalog No. 130-096-334; Miltenyi Biotech) containing 10 mL of 37°C enzyme solution. The length of UC placed in each C-tube was recorded and classified into <30 cm or >30 cm length. The enzyme solution contained 1 mg/mL hyaluronidase (Catalog No. 02151272; MP Biomedicals), 300 U/mL collagenase type I (Catalog No. 17-100-017; Life Technologies), and 300 U of deoxyribonuclease I (Catalog No. D4263-5VL; Sigma Aldrich) in Hank's balanced salt solution (Catalog No. MT21021CM; Corning).
The cord tissue weight was estimated by subtracting the weight of the C-tube with enzyme from the weight of the tube containing the enzyme and the UCs. The C-tubes were processed in a GentleMACS Dissociator (Catalog No. 130-093-235; Miltenyi Biotech) using standard program “C,” once. The C-tubes were centrifuged at 200 g for 5 min, then incubated at 37°C on a Pelco R2 rotator with a 1,051 sample platform at 12 rpm for 3 h. Next, the C-tubes were processed using the GentleMACS Dissociator standard program B, once, and the solution was filtered (100 μm cell strainer, Catalog No. 22-363-549; Fisher Scientific). The filter was washed with an additional 5 mL of DPBS with 1% A/A solution. The cells were pelleted by centrifugation (200 g for 5 min, room temperature), and the supernatant was discarded.
Red blood cells (RBCs) were lysed by resuspending the cells in 0.5 mL of culture medium and addition of 0.5 mL of lysing buffer (Catalog No. R7757-100ML; Hybri-Max, Sigma Aldrich). Cells were mixed by gentle pipetting for 60 s then diluted with 8 mL of DPBS with 1% A/A solution. Cells were pelleted by centrifugation (200 g for 5 min, room temperature), and the supernatant was discarded. Cell pellet was resuspended in 1 mL of 37°C ACB culture medium (recipe provided hereunder).
An aliquot was removed for live/dead cell count using acridine orange/propidium iodide staining solution (Catalog No. CS2-0106-5ML; Nexcelom Bioscience), on a Nexcelom Auto 2000 Cellometer (immune cells, low RBC program). Cells were plated at a density of 20,000—30,000 cells/cm2 on the gelatin-coated tissue culture T-75 flasks (Catalog No. 7202000; Corning) in ACB culture medium (ACB consists of Dulbecco's modified Eagle's medium (DMEM, high glucose; Catalog No. 11965092; Gibco) supplemented with 10% fetal bovine serum (FBS) (Catalog No. SH3007103; HyClone, GE Healthcare Life Sciences), 1% antibiotic–antimycotic (Catalog No. 15240096; Gibco), 1% Glutamax (Catalog No. 35-050-061; Gibco), with or without 10 ng/mL basic fibroblast growth factor (bFGF; Catalog No. PHG0264; Gibco).
Culture
After the first passage, canine UC-MSCs were plated at 20,000 cells/cm2 on tissue culture plates or flasks (with or without prior gelatin coating) using ACB cell culture medium warmed to 37°C. The cells were grown at 37°C, 5% CO2, condensing humidity in a Heracell 150i, or Nuaire AutoFlow 4950 incubator. Half of the volume of medium was replaced every 3 days until the cells reached 80%–95% confluency before passage.
Canine UC-MSCs were lifted with either TrypLE express (Catalog No. 12605028; Gibco) or 1.75% nattokinase (Catalog No. NATT100; Bulk Supplements) for 30 min at 37°C. Cells were dislodged with gentle tapping to completely remove them from the plate. If few cells remained adherent to the plate, an additional 5 min of incubation was used. Detached MSCs were collected and pelleted by centrifugation (200 g for 5 min at room temperature). The supernatant was discarded and the cell pellet was resuspended in 1 mL of fresh warm ACB medium. A live/dead cell count was performed at passage, and the cells were plated in fresh medium on gelatin-coated plates at a density of 20,000 cells/cm2, cryopreserved, or discarded. Population doubling time was calculated using the following formula:
Cryopreservation
To cryopreserve, UC-MSCs were suspended in 1:1 v/v ratio of ACB cell culture medium and freezing medium (Human Embryonic Stem Cell Cryopreservative, MTI-GlobalStem) at 0°C. MSCs were kept ice cold and immediately transferred to a controlled rate freezing apparatus (Mr. Frosty) and then onto the bottom shelf of a −80°C freezer. After 24 h, the vials were moved to the vapor phase of liquid nitrogen tank for long-term storage.
Trilineage differentiation
UC-MSCs between passages 6 and 10 were differentiated to chondrogenic, osteogenic, and adipogenic lineages after testing 3 different media for chondrogenic, 3 different media for adipogenic, and 2 different media for osteogenic lineages (Supplementary Figs. S2–S4). The formulations tested are given in Supplementary Table S1.
The formulations used in the article were high-glucose DMEM, 1% antibiotic–antimycotic, 10 ng transforming growth factor beta 1 (TGF-β1) (Catalog No. GF346; Sigma Aldrich), 1% FBS, 100 nM dexamethasone (Catalog No. D4902; Sigma Aldrich), 1 mM sodium pyruvate (Catalog No. 11360070; Gibco), and 40 μg
In brief, 12-well gelatin-coated plates (Catalog No. CC7682-7512; CytoOne) were used to plate UC-MSCs in triplicate at a lineage-specific density. For chondrogenesis, US-MSCs are concentrated to 8 × 10⁶ cells/mL, and a 5 μL droplet is plated in each well that causes the formation of a micromass of MSCs [4]. For osteogenesis, a density of 20,000 UC-MSCs were plated per well, and 76,000 cells per well were used for adipogenesis. Cells remained in culture for 24 to 48 h in standard cell culture medium before changing to differentiation medium. Half the volume of medium was replaced every 3 days.
After 14–21 days of differentiation, medium was removed and cells were washed using DPBS with calcium and magnesium (Catalog No. 14040-133; Gibco). The cells were fixed with freshly prepared 4% paraformaldehyde in 10 mM phosphate buffer (pH 7.4) for 30 min at room temperature, and then triple washed with DPBS. MSCs were stained with Oil Red O to visualize lipid droplets in adipocytes (Catalog No. HT904-8F0Z; Sigma Aldrich), or with Alizarin Red S to detect calcium crystal in osteocytes (Catalog No. A5533-25G; Sigma Aldrich), or with Safranin O to visualize sulfated glycosaminoglycans in chondrocytes (Catalog No. O0625-100G; Sigma Aldrich). After staining, brightfield images were captured using an Evos FL Auto microscope (Life Technologies).
Colony-forming unit-fibroblast assay
Canine UC-MSCs were plated at 50, 100, and 500 cells/cm2 in triplicate on gelatin-coated 6-well tissue culture plates (Catalog No. CC7682-7506; CytoOne) in ACB medium and incubated undisturbed for at least 3 days. The medium was changed every 3 days. Cells grew 10–14 days before fixation with ice-cold 100% methanol for 15 min. Methanol was removed and the plates were washed twice for 5 min with room temperature, sterile Sorenson's phosphate buffered saline (pH 7.4). The colonies were then stained with 1% w/v aqueous methylene blue for 20 min at room temperature, gently washed three times with distilled water, and air dried overnight.
The colonies were counted manually using 4–10 × magnification. Colonies were defined as “clonal” groups consisting of >10 cells. The number of colonies per well was averaged from the technical triplicates at each plating density. By dividing the number of cells plated by the averaged number of colonies, the colony forming efficiency was calculated.
Flow cytometry
Flow cytometry analysis of canine UC-MSCs was adapted from the human UC-MSC protocol we have previously published [5]. All antibody clones were previously tested for their use in immunophenotyping canine MSCs (Supplementary Table S2) or are in routine use by the Kansas State University Veterinary Diagnostic Flow Cytometry core for canines.
In brief, UC-MSCs were cultured until 90%–95% confluent, passaged using 1.75% nattokinase, and reconstituted in blocking buffer containing 1% bovine serum albumin (BSA). An aliquot was removed for viability and cell count, whereas the remainder of the cells were incubated in blocking buffer for 15 min at 4°C. Canine UC-MSCs were centrifuged (200 g for 5 min at room temperature) and reconstituted in 1% BSA with the addition of primary antibody at a dilution of 1:100 (Table 1). Canine UC-MSCs were incubated for 1 h at 4°C protected from light, washed, and centrifuged. If antibody was unconjugated, then secondary antibody was added to 1% BSA at a concentration of 2 μg/mL and incubated at 4°C for 30 min protected from light. Finally, cells were washed with 1% BSA and resuspended in 500 μL of 1% BSA and stored at 4°C protected from light until ran on cytometer.
Antibodies Tested in Flow Cytometry
DNA staining was based on published protocols [44,45]. In brief, canine UC-MSCs were cultured and passaged for flow cytometry analysis as previously described, then fixed in glacial ethanol for 1 h at −20°C. UC-MSCs were washed twice with DPBS. Then, 50 μg/mL of RNAse H (Catalog No. EN0201; Thermo Scientific) in DPBS was added to canine UC-MSCs for 30 min at 37°C. RNAse was removed by aspirating the supernatant after pelleting the cells using low-speed centrifugation (200 g for 5 min at room temperature). The cell pellet was washed with DPBS, and the UC-MSCs were resuspended in DPBS containing 50 μg/mL of propidium iodide (PI) (Catalog No. P3566; Invitrogen). The cells were stored at 4°C protected from light until they were analyzed on the cytometer.
The samples were analyzed on a BD LSR Fortessa X-20 SORP flow cytometer (BD Biosciences, San Jose, CA) equipped with 405, 488, 561, and 633 nm lasers and appropriate filters to detect all fluorophores listed in Table 1. Data were acquired, recorded, and analyzed utilizing BD FACSDiva 8.0 software (BD Biosciences). For multicolor labeled samples, the compensation matrix was calculated by the software from individually labeled UltraComp eBeads (ThermoFischer Scientific, Waltham, MA) and applied to the cell sample before data acquisition. Cells were identified by forward and side scatter properties and used as the primary gate to exclude debris and doublets. Unstained cells established background fluorescence and acted as a negative control for cell surface markers. At least 10,000 gated data points were recorded for all samples. Results were generated by overlaying the appropriate fluorescence channel of unlabeled and labeled cell samples.
For DNA analysis, cells were identified by setting the detection threshold to be based off fluorescence in a 610/20 bandpass filter, which would identify only PI stained cells. Positively identified cells were gated using pulse geometry to not only exclude doublets but also reveal the presence, if any, of cells with aberrant DNA content. A histogram was generated from the aforementioned gate for cell cycle analysis.
Reverse transcriptase-polymerase chain reaction
Reverse transcriptase-polymerase chain reaction (RT-PCR) was conducted as previously described [47]. In brief, total RNA was isolated using an RNeasy kit (Qiagen). RNA was treated with DNase before storage and measured using a NanoDrop spectrophotometer. Complementary DNA was synthesized from total RNA using Superscript III First-Strand Synthesis Supermix kit (Invitrogen) primed with oligo-dT 12–18 per the manufacturer's protocol. PCR was performed using a BioRad iCycler: initial denaturation at 95°C for 3 min, 30 cycles of (94°C for 1 min, 53°C–55°C for 30 s, and 72°C for 30 s), and the final extension at 72°C for 10 min. After PCR, the products were resolved on a 1%–2% agarose gel with 100 bp DNA ladder and imaged using ethidium bromine. Primer sequences and amplicon size are listed in Table 2.
Reverse Transcriptase-Polymerase Chain Reaction Primers
For sequencing, the amplicon of the anticipated size from a randomly selected MSC line was cut from the agarose gel (eg, CD34 409 bp, CD34 356 bp, CD73 422 bp, CD73 434 bp, CD90 440 bp, CD90 420 bp, CD105 424 bp, and CD105 378 bp), and the DNA was extracted and purified. Next, the DNA was cloned into a plasmid and expanded. After expansion, five to eight clones were selected and plasmid DNA was isolated and submitted to the KSU Integrated Genomics core for Illumina sequencing. The DNA sequences were checked for quality before alignment. The DNA sequences were aligned with canine sequences in PubMed.
Statistics
After validating that the analysis of variance (ANOVA) assumptions were met, it was used to evaluate significant main effects and/or interactions. After finding significant ANOVA terms, post hoc testing of planned comparisons was performed using either the Bonferroni correction or the Holm–Sidak method. Those data are presented as average ±1 standard deviation (SD). For pairwise comparisons, Student's t-test was used after confirmation of statistical assumptions. If the ANOVA assumptions were not met, then Kruskal–Wallis ANOVA on ranks was used. Those data are presented in box and whisker plots showing median and 25th and 75th percentile in the box and whiskers showing 10th and 90th percentile, with potential outliers indicated by circles. In text, the data are presented as average ±1 SD unless stated otherwise.
Regression analysis was conducted using Sigma Plot v12.5, and significant relationships were reported (regression line is plotted in cases of significant relationship). In one case, regression analysis indicated nonsignificant trends, and was indicated in text (no regression line is shown in graph). Throughout this article, the entire data set was used, and it included potential outliers. The original data set is available. SigmaPlot version12.5 (Systat Software, Inc.) was used for statistics and generating graphs. The graphs created using SigmaPlot were saved as EMF files. These EMF files were labeled and edited for clarity using ACD Systems of America's Canvas (version 15.5, build 1770) and rendered in TIFF format. In all cases, hypothesis testing was two-tailed and P < 0.05 was considered “significant.”
Results
Isolation of MSCs from canine UC
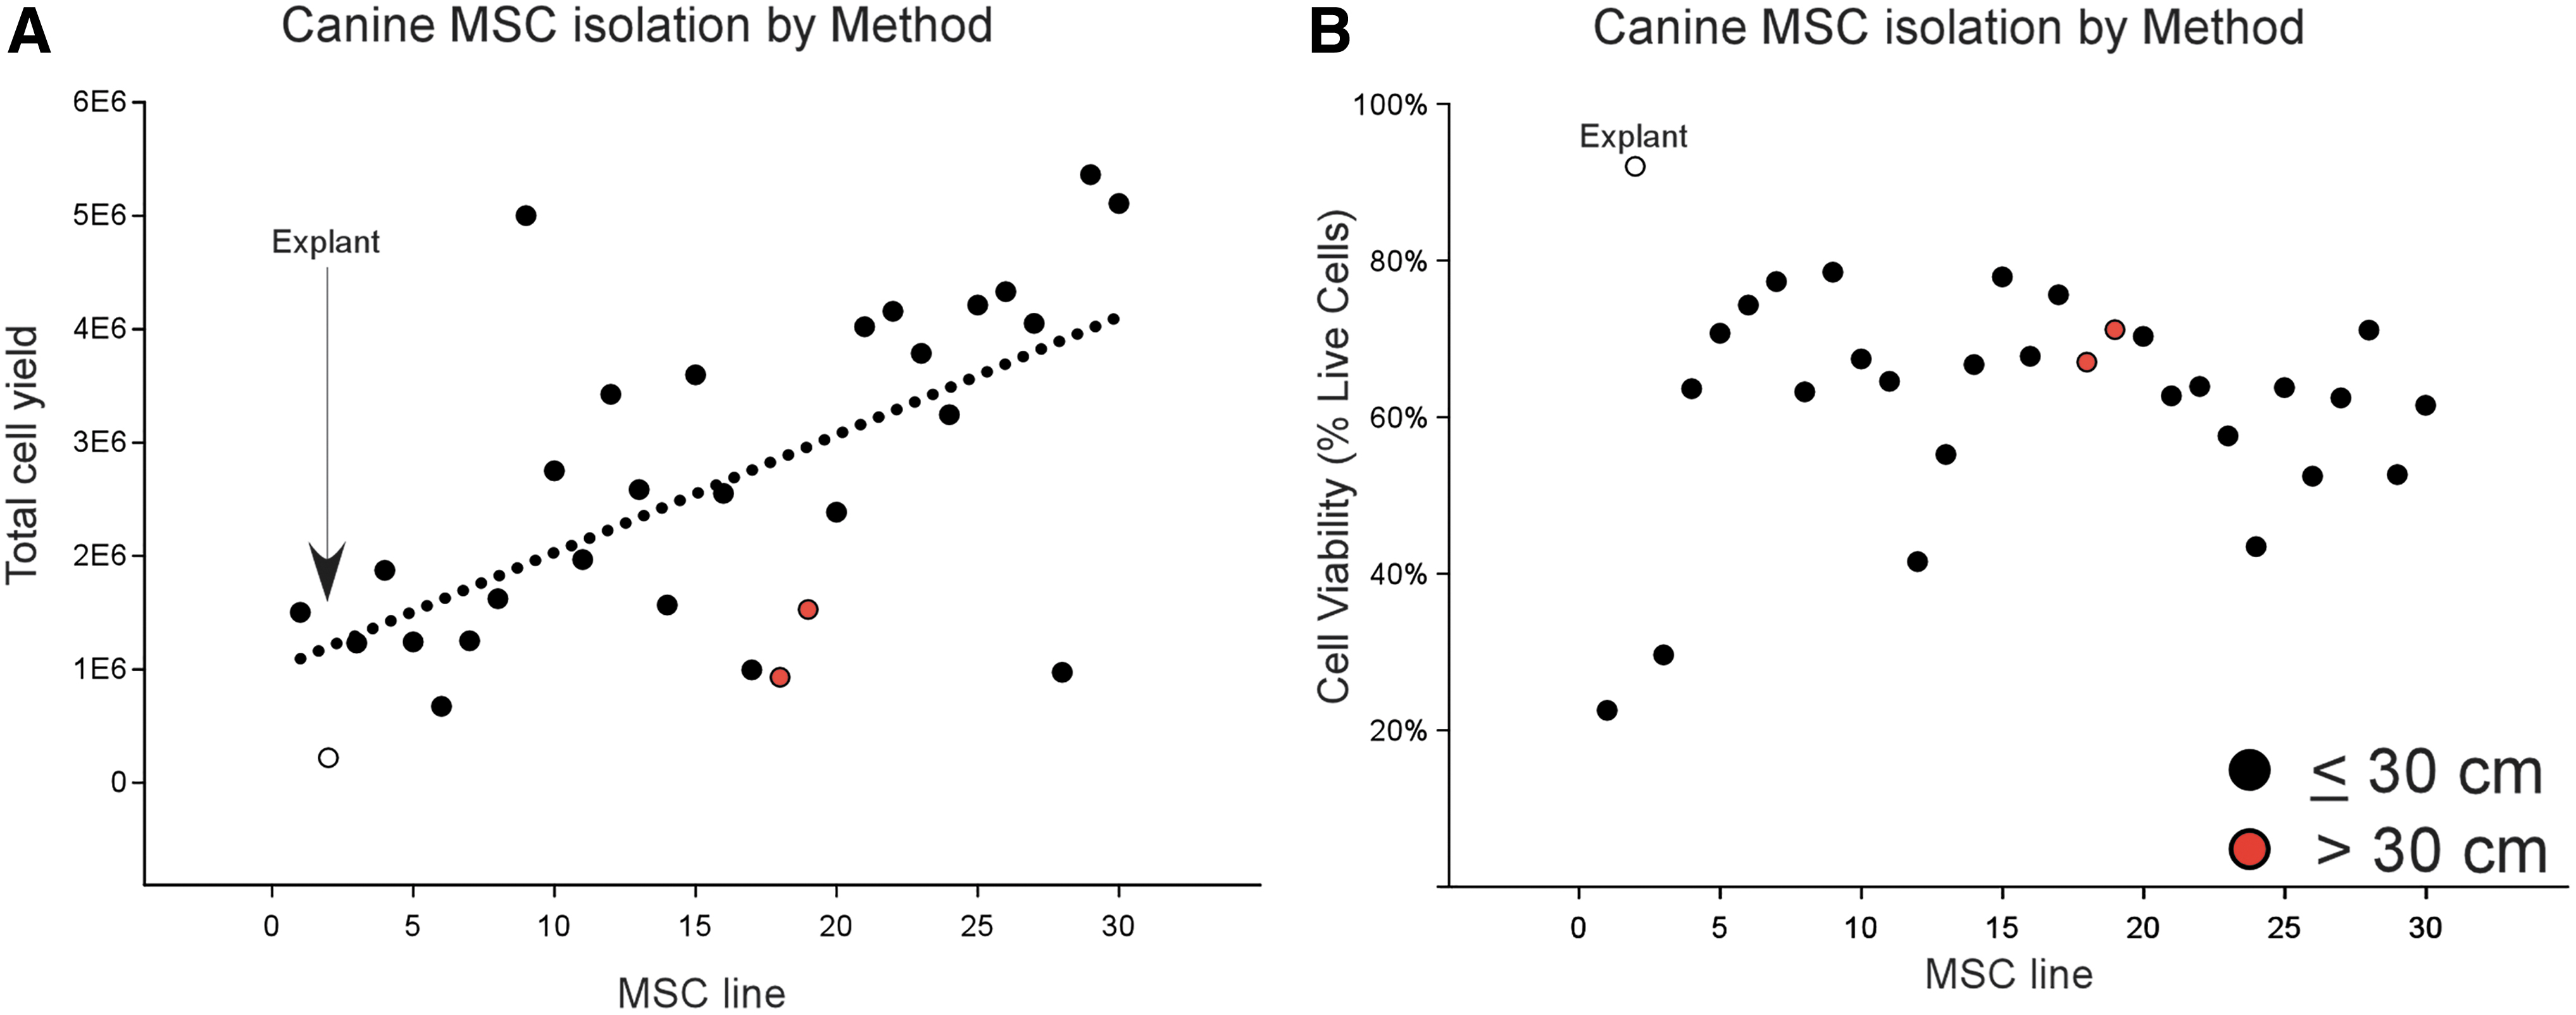
MSCs were isolated from UCs from 30 litters of pups. The schematic for processing canine UCs is shown in Fig. 1. When necessary the fetal placenta was trimmed away from the UC before processing (Supplementary Fig. S1). Two isolation methods were compared: the explant method and the dissociation method (Fig. 2A). The explant method involves mincing the UC into 0.2–0.5 mm pieces and adhering those pieces to the plastic plate before adding medium. The explant method produced the lowest cell yields but produced >90% viable cells (open circle shown in Fig. 2A, B). MSCs from the explant method did not expand after attaching to the culture plate. This method was not tested further, and the remaining UC from 29 litters were mechanically and enzymatic disrupted before culturing, as we described previously for human UC [4,5].

A schematic of the isolation procedure showing the major steps involved for obtaining MSCs from the canine UC. After cesarian section delivery, the cord is removed from each puppy and placed into storage solution. The noncord tissues are dissected and discarded using sterile technique. The length of the cord material is measured
Isolation efficiency from UC.
To evaluate the effect of tissue volume on cell yield and viability, either <30 cm of UC (black circles shown in Fig. 2A, B) or >30 cm of UC was loaded into the disruptor (red circles shown in Fig. 2A, B). The isolation yield and viability were not significantly changed by tissue volume. Although there was a significant trend for cell yield at isolation to increase over the course of this study (regression line shown in Fig. 2A), there was no significant trend in cell viability (Fig. 2B).
Stage 1
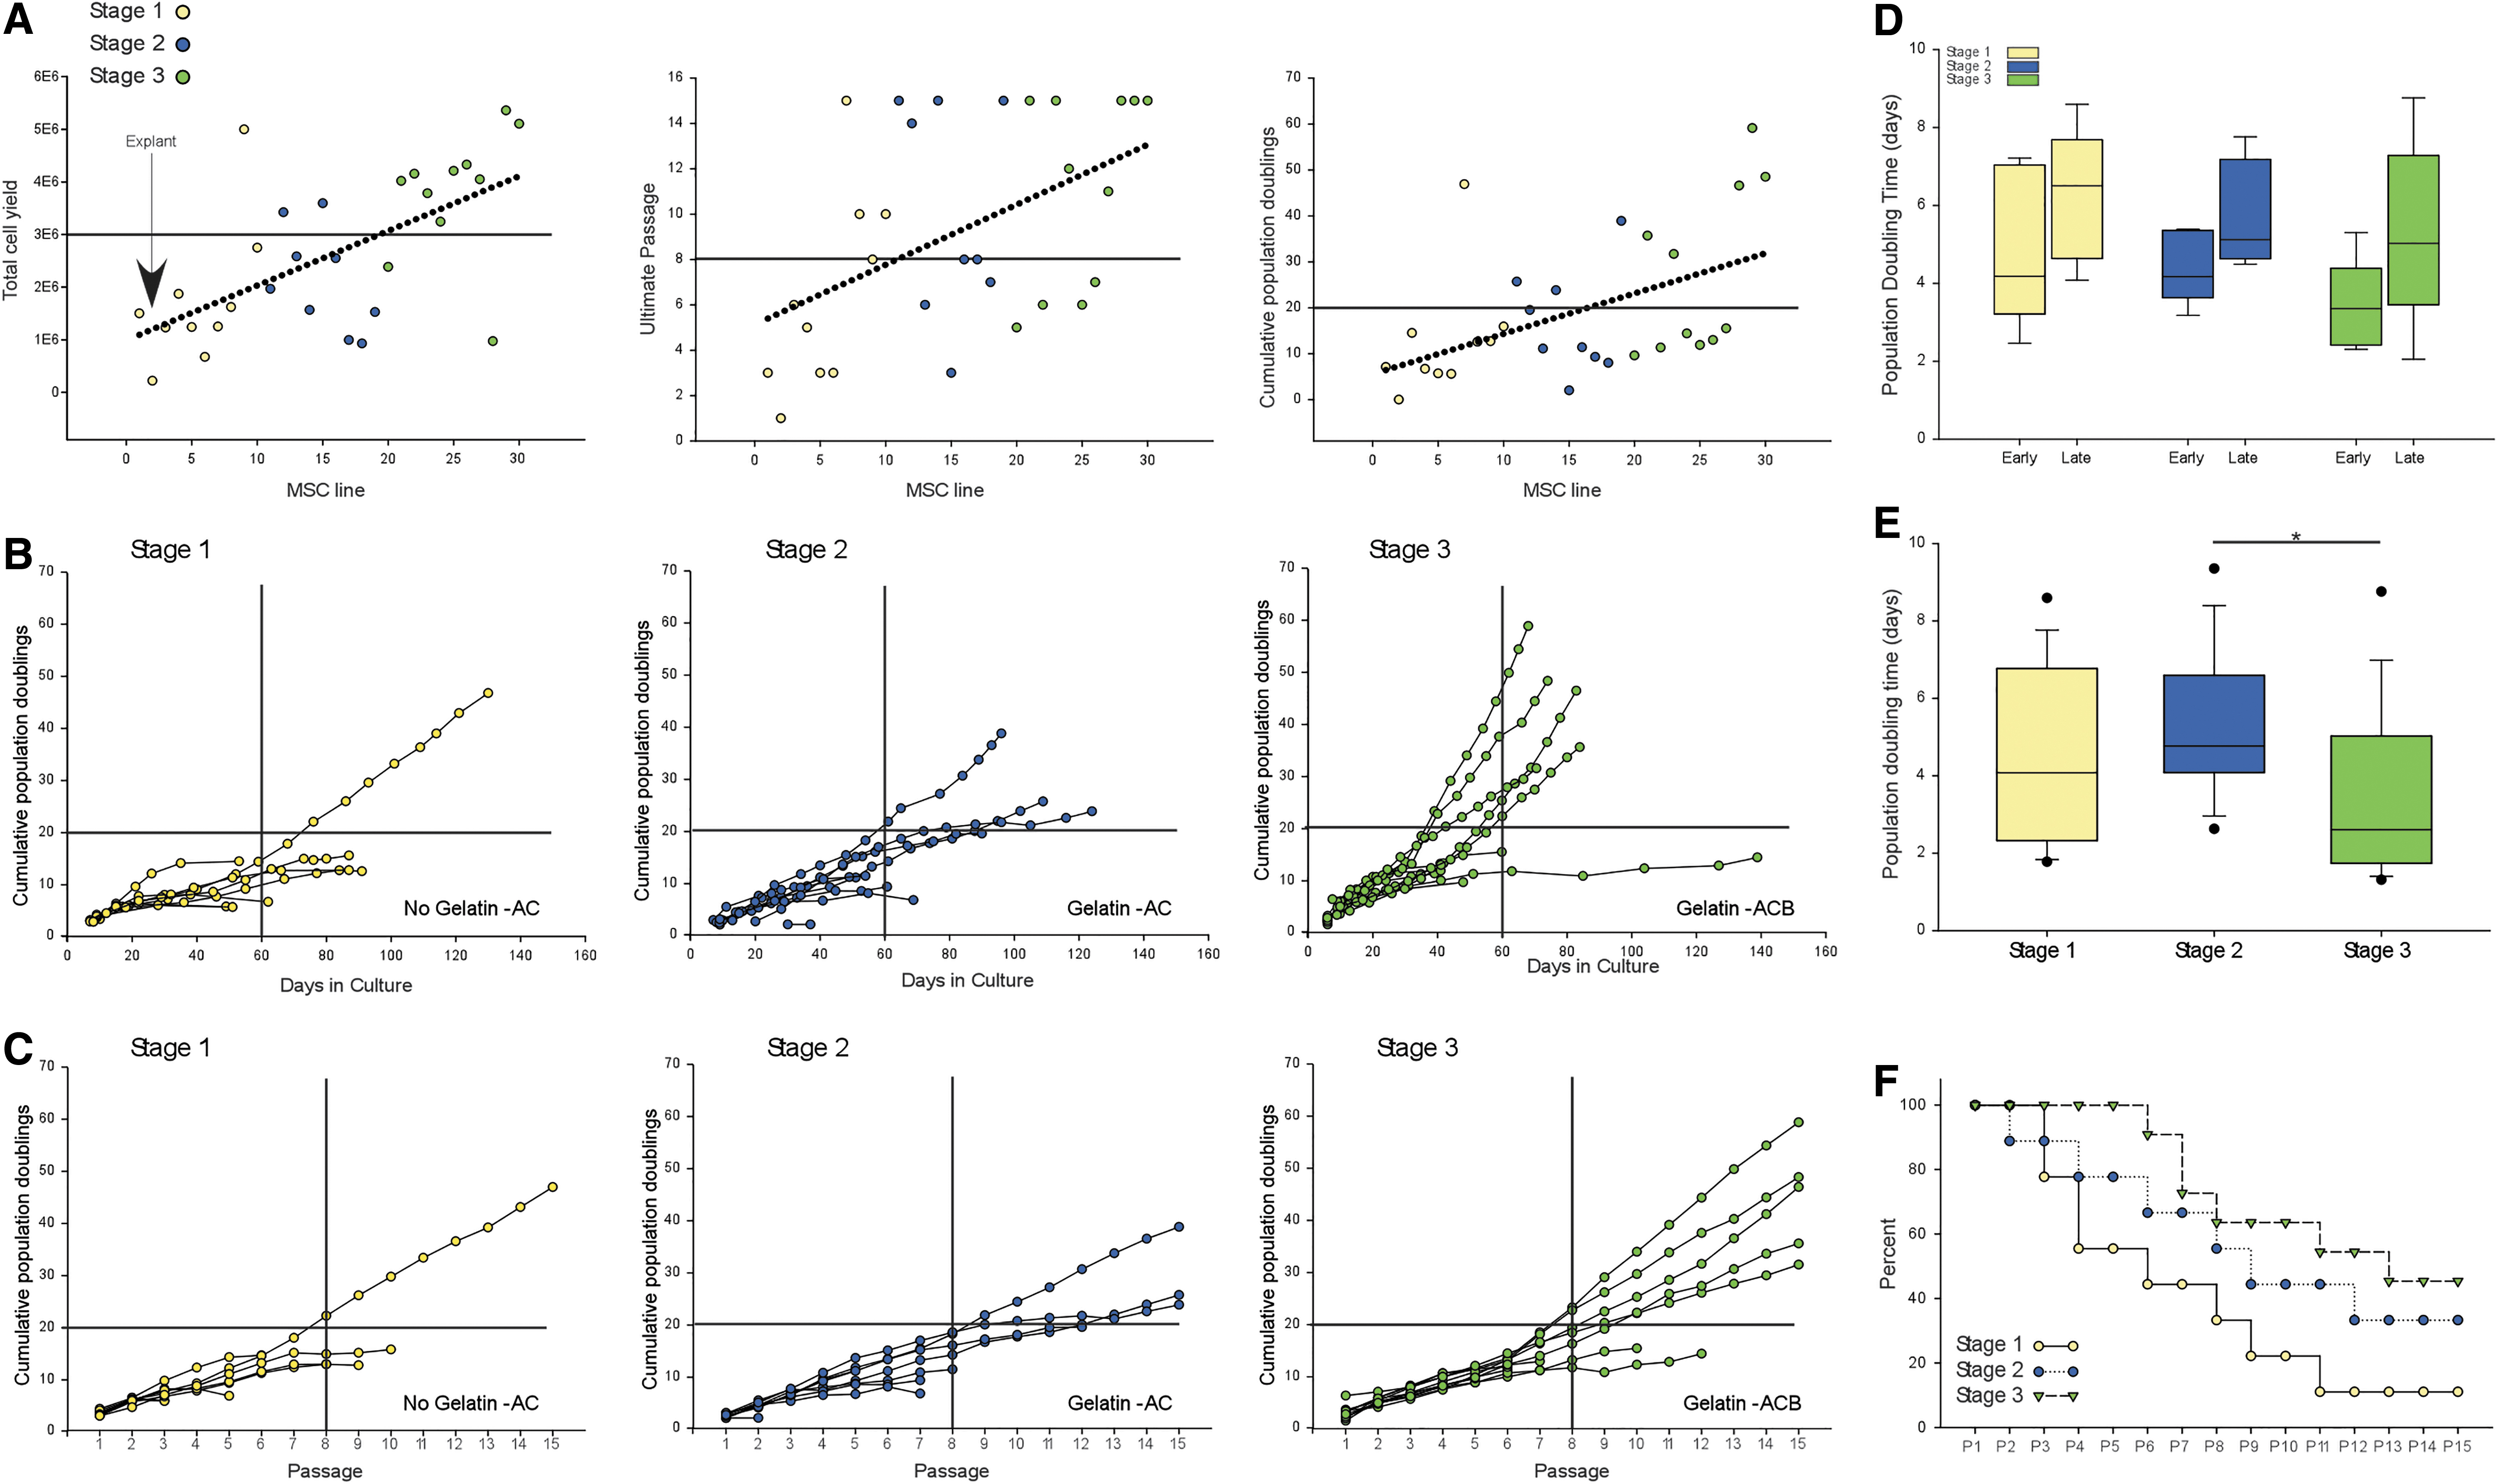
The first 10 canine UC-MSC lines were isolated and expanded using previously described protocols (labeled Stage 1 in Fig. 3). Specifically, the MSCs were plated on tissue culture plastic, exposed to 10% FBS containing DMEM and other standard supplements, and passaged using 0.025% trypsin-ethylenediaminetetraacetic acid (EDTA). Using these methods, only 1 MSC line of the 10 could be expanded beyond 20 cumulative population doublings (CPDs), 50% of the MSC lines were able to expand beyond 10 CPDs, and only 1 line of 10 was able to be expanded to 15 passages (Fig. 3B, C).
Stepwise improvement of canine MSC expansion.
In Stage 1, we learned that when compared with human UC-MSCs, canine UC-MSCs require higher plating density to expand (20,000 cells/cm2 for canine UC-MSCs vs. 10,000 cells/cm2 for human UC-MSCs). In Stage 1, we performed pilot experiments with different agents for lifting MSCs off the tissue culture plate for passage (discussed hereunder).
Stage 2
Two modifications in UC-MSC expansion were made in Stage 2. First, tissue culture plastic was modified by coating the plates with gelatin. Second, nattokinase was used for lifting the MSCs at time of passage [48,49]. In Stage 2, the expansion potential of UC-MSC was improved based upon the following observations: first, a significant positive trend line was found for the total cell yield, the ultimate number of passages reached by MSC lines, and the CPDs achieved (Fig. 3A). Second, 6 of 9 (66%) MSC lines expanded beyond 10 CPDs and 3 of 9 (33%) MSC lines expanded beyond 20 CPDs) (Fig. 3B). Third, 3 of 9 MSCs lines expanded to 15 passages without senescence (Fig. 3B, C).
Stage 3
One modification was made in UC-MSC expansion in Stage 3 compared with Stage 2: a growth supplement, bFGF, was added to the medium (ACB medium) together with plating on gelatin-coated plates [50 –52]. This modification further improved in UC-MSC expansion capability. This enhancement was indicated by better yield at initial isolation (9 out of 11 exceeded 3E6 cells at isolation) (Fig. 3A), and an increase to 9 out of 11 (90%) of the MSC lines expanding beyond 10 CPDs, 5 out of 11 (50%) of the MSC lines expanding beyond 20 CPDs, and 5 of 11 MSC lines expanded to 15 passages (Fig. 3B, C).
The faster growth than Stage 2 was indicated by 5 of 11 MSC lines reaching or surpassing 20 CPDs by 60 days of culture (Fig. 3B), and by significantly faster population doubling time, especially in the first five passages (labeled early in Fig. 3D). The relative efficiency to maintain MSCs by stage of development is shown in Fig. 3F.
Effect of gelatin-coated plates
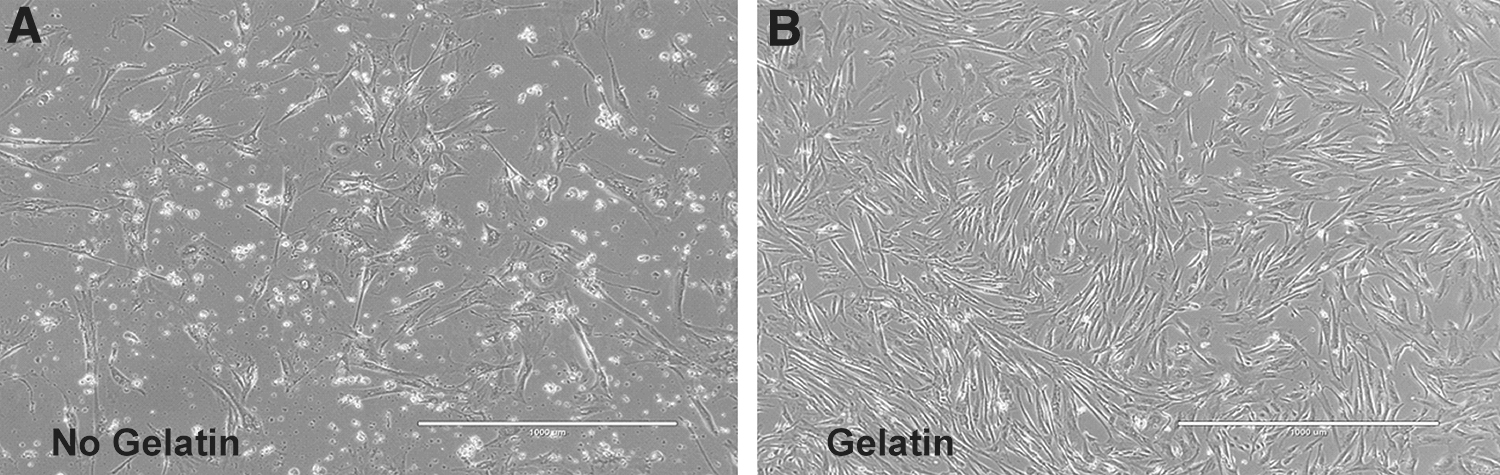
The effect of gelatin-coated tissue culture plates was apparent during culture based upon cellular morphology (Fig. 4) and cumulatively over passage (Fig. 5), but it did not significantly affect the growth rate of MSCs during the first five passages (comparing the population doubling time between Stages 1 and 2 shown in Fig. 3D), or over entire culture period (comparing Stages 1 and 2 shown in Fig. 3E).
Effect of gelatin coating of plates on canine MSCs morphology.

Effect of gelatin coating of plates on canine MSCs expansion.
Subjectively, UC-MSCs grown on gelatin-coated plates appear to experience less stress than MSCs grown on standard tissue culture plates (compare Fig. 4A and B). For example, UC-MSCs grown on tissue culture plastic had more debris, and more of the large flattened cells with stress fibers (Fig. 4A) than MSCs grown on gelatin-coated plates (Fig. 4B). This subjective observation was supported by other observations. As shown in Fig. 5A, there was a trend for MSCs grown on gelatin-coated plates to have greater CPDs, and as shown in Fig. 5B, there were significantly more passages until senescence when MSCs were grown on gelatin-coated plates. The attachment of MSCs to gelatin-coated plates also enhanced the colony forming fibroblast efficiency (Fig. 5C, D). As MSCs grew on gelatin-coated plates, a pattern in the arrangement of their cell bodies was observed when the same field was observed from day to day (Supplementary Fig. S5).
Comparing method of lifting cells for passage
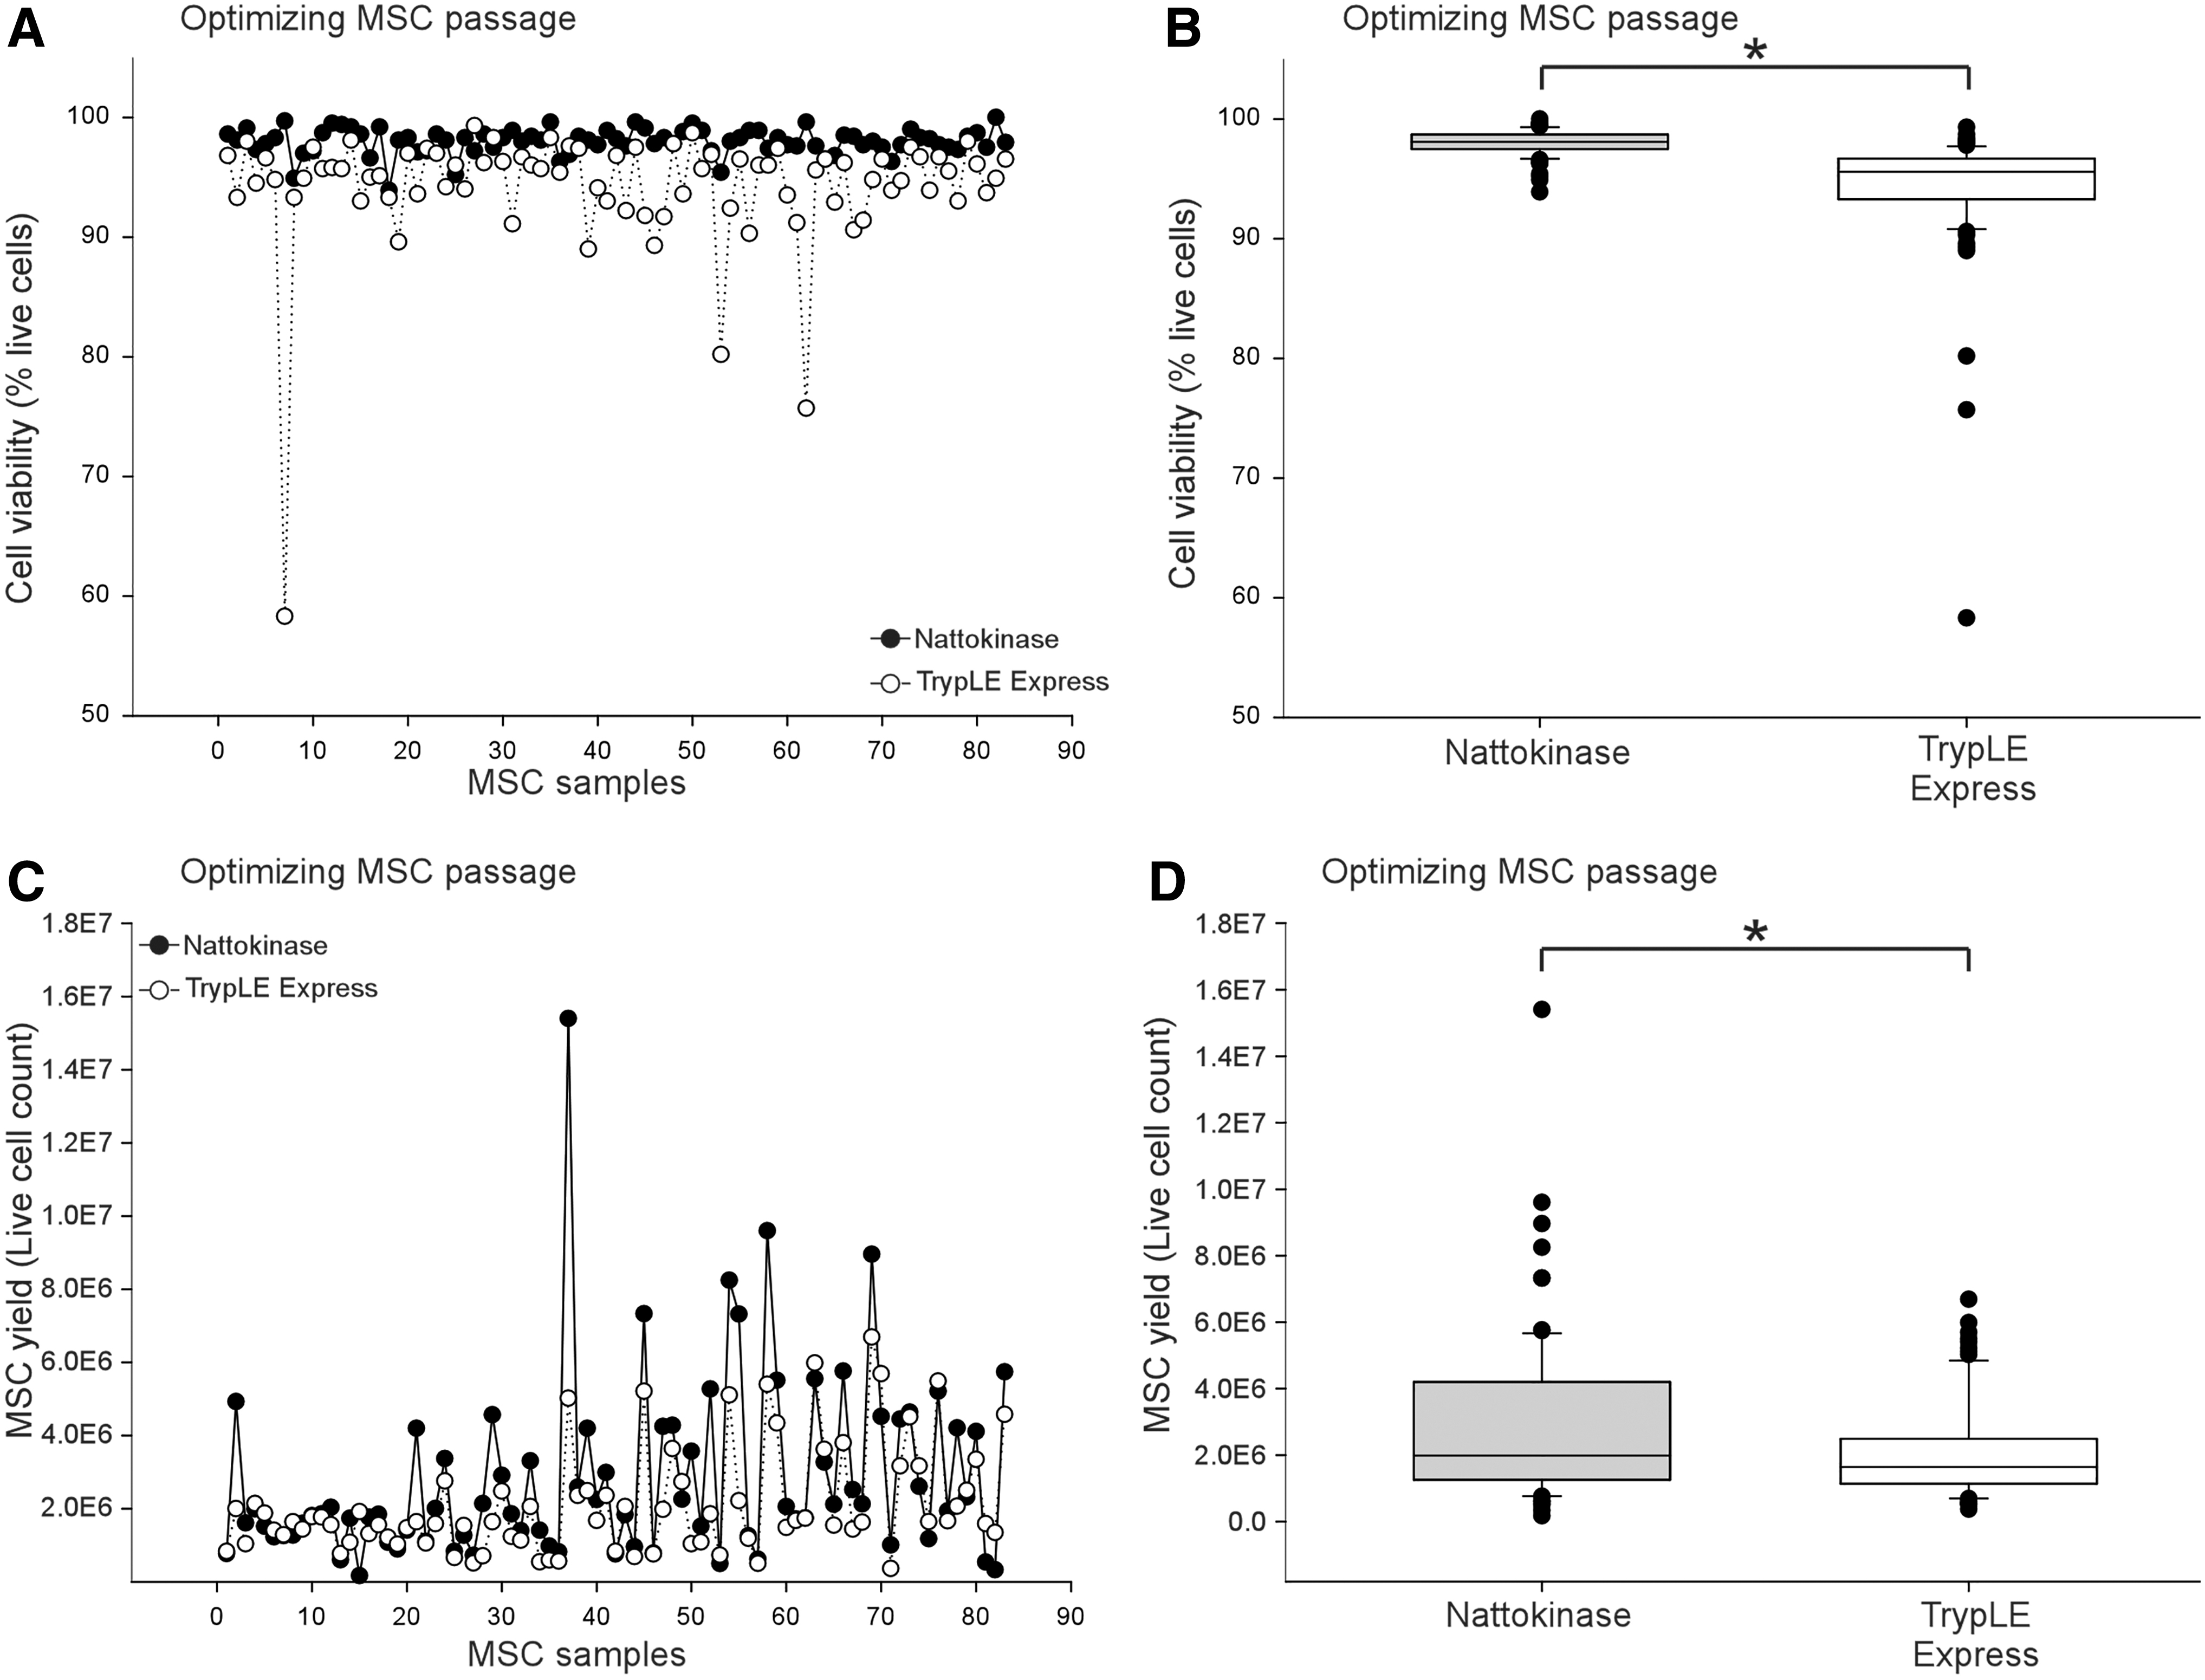
Based upon our experience with human MSCs (data not shown) [4] and based on the canine MSC literature, we assumed that 0.025% trypsin-EDTA was suitable for canine MSCs. To evaluate this hypothesis, pilot experiments were conducted using 0.025% trypsin-EDTA compared with TrypLE, dispase, TrypLE express, and 1.75% nattokinase. We determined that dispase, TrypLE, and Trypsin-EDTA negatively impact yield, viability, and downstream effects (comparison data not shown). Trypsin-EDTA and dispase were not successful and resulted in failure to proliferate after passage (data not shown). TrypLE was unable to efficiently lift canine MSC from the plate for passage (data not shown).
In contrast, nattokinase improved MSC viability at passage compared with TrypLE express (Fig. 6A, B). The difference between cell viability and MSC yield between TrypLE express (0.05%) versus nattokinase (1.75%) was significant (Fig. 6B, D). Nattokinase was used to lift MSCs in Stages 2 and 3.
Nattokinase improved MSC passage compared with TrypLE express.
Cryopreservation effects and ability to revive UC-MSCs from cryostorage
It appears that canine UC-MSCs are less robust than human UC-MSCs in terms of their expansion potential, response to chemical stress, and attachment ability. We then queried whether canine UC-MSCs were sensitive to cryopreservation and could be revived and expanded after cryostorage. To answer this question, 33 UC-MSC samples were frozen and stored for an average of 185 days (median 191 days, range 4–448 days, 25th percentile 34.5 and 75th percentile 292.5 days) in vapor phase liquid nitrogen then thawed and tested for viability. As expected, there was a significant drop in MSC viability of 7.9% ± 4.8% after thawing (Fig. 7A, B). Although viability decreased due to freeze/thaw, there was no significant effects of length of storage on change in MSC viability (Fig. 7C, D). Note that the regression line shown in Fig. 7D is not significant. All thawed cell lines expanded for multiple passages after thaw.
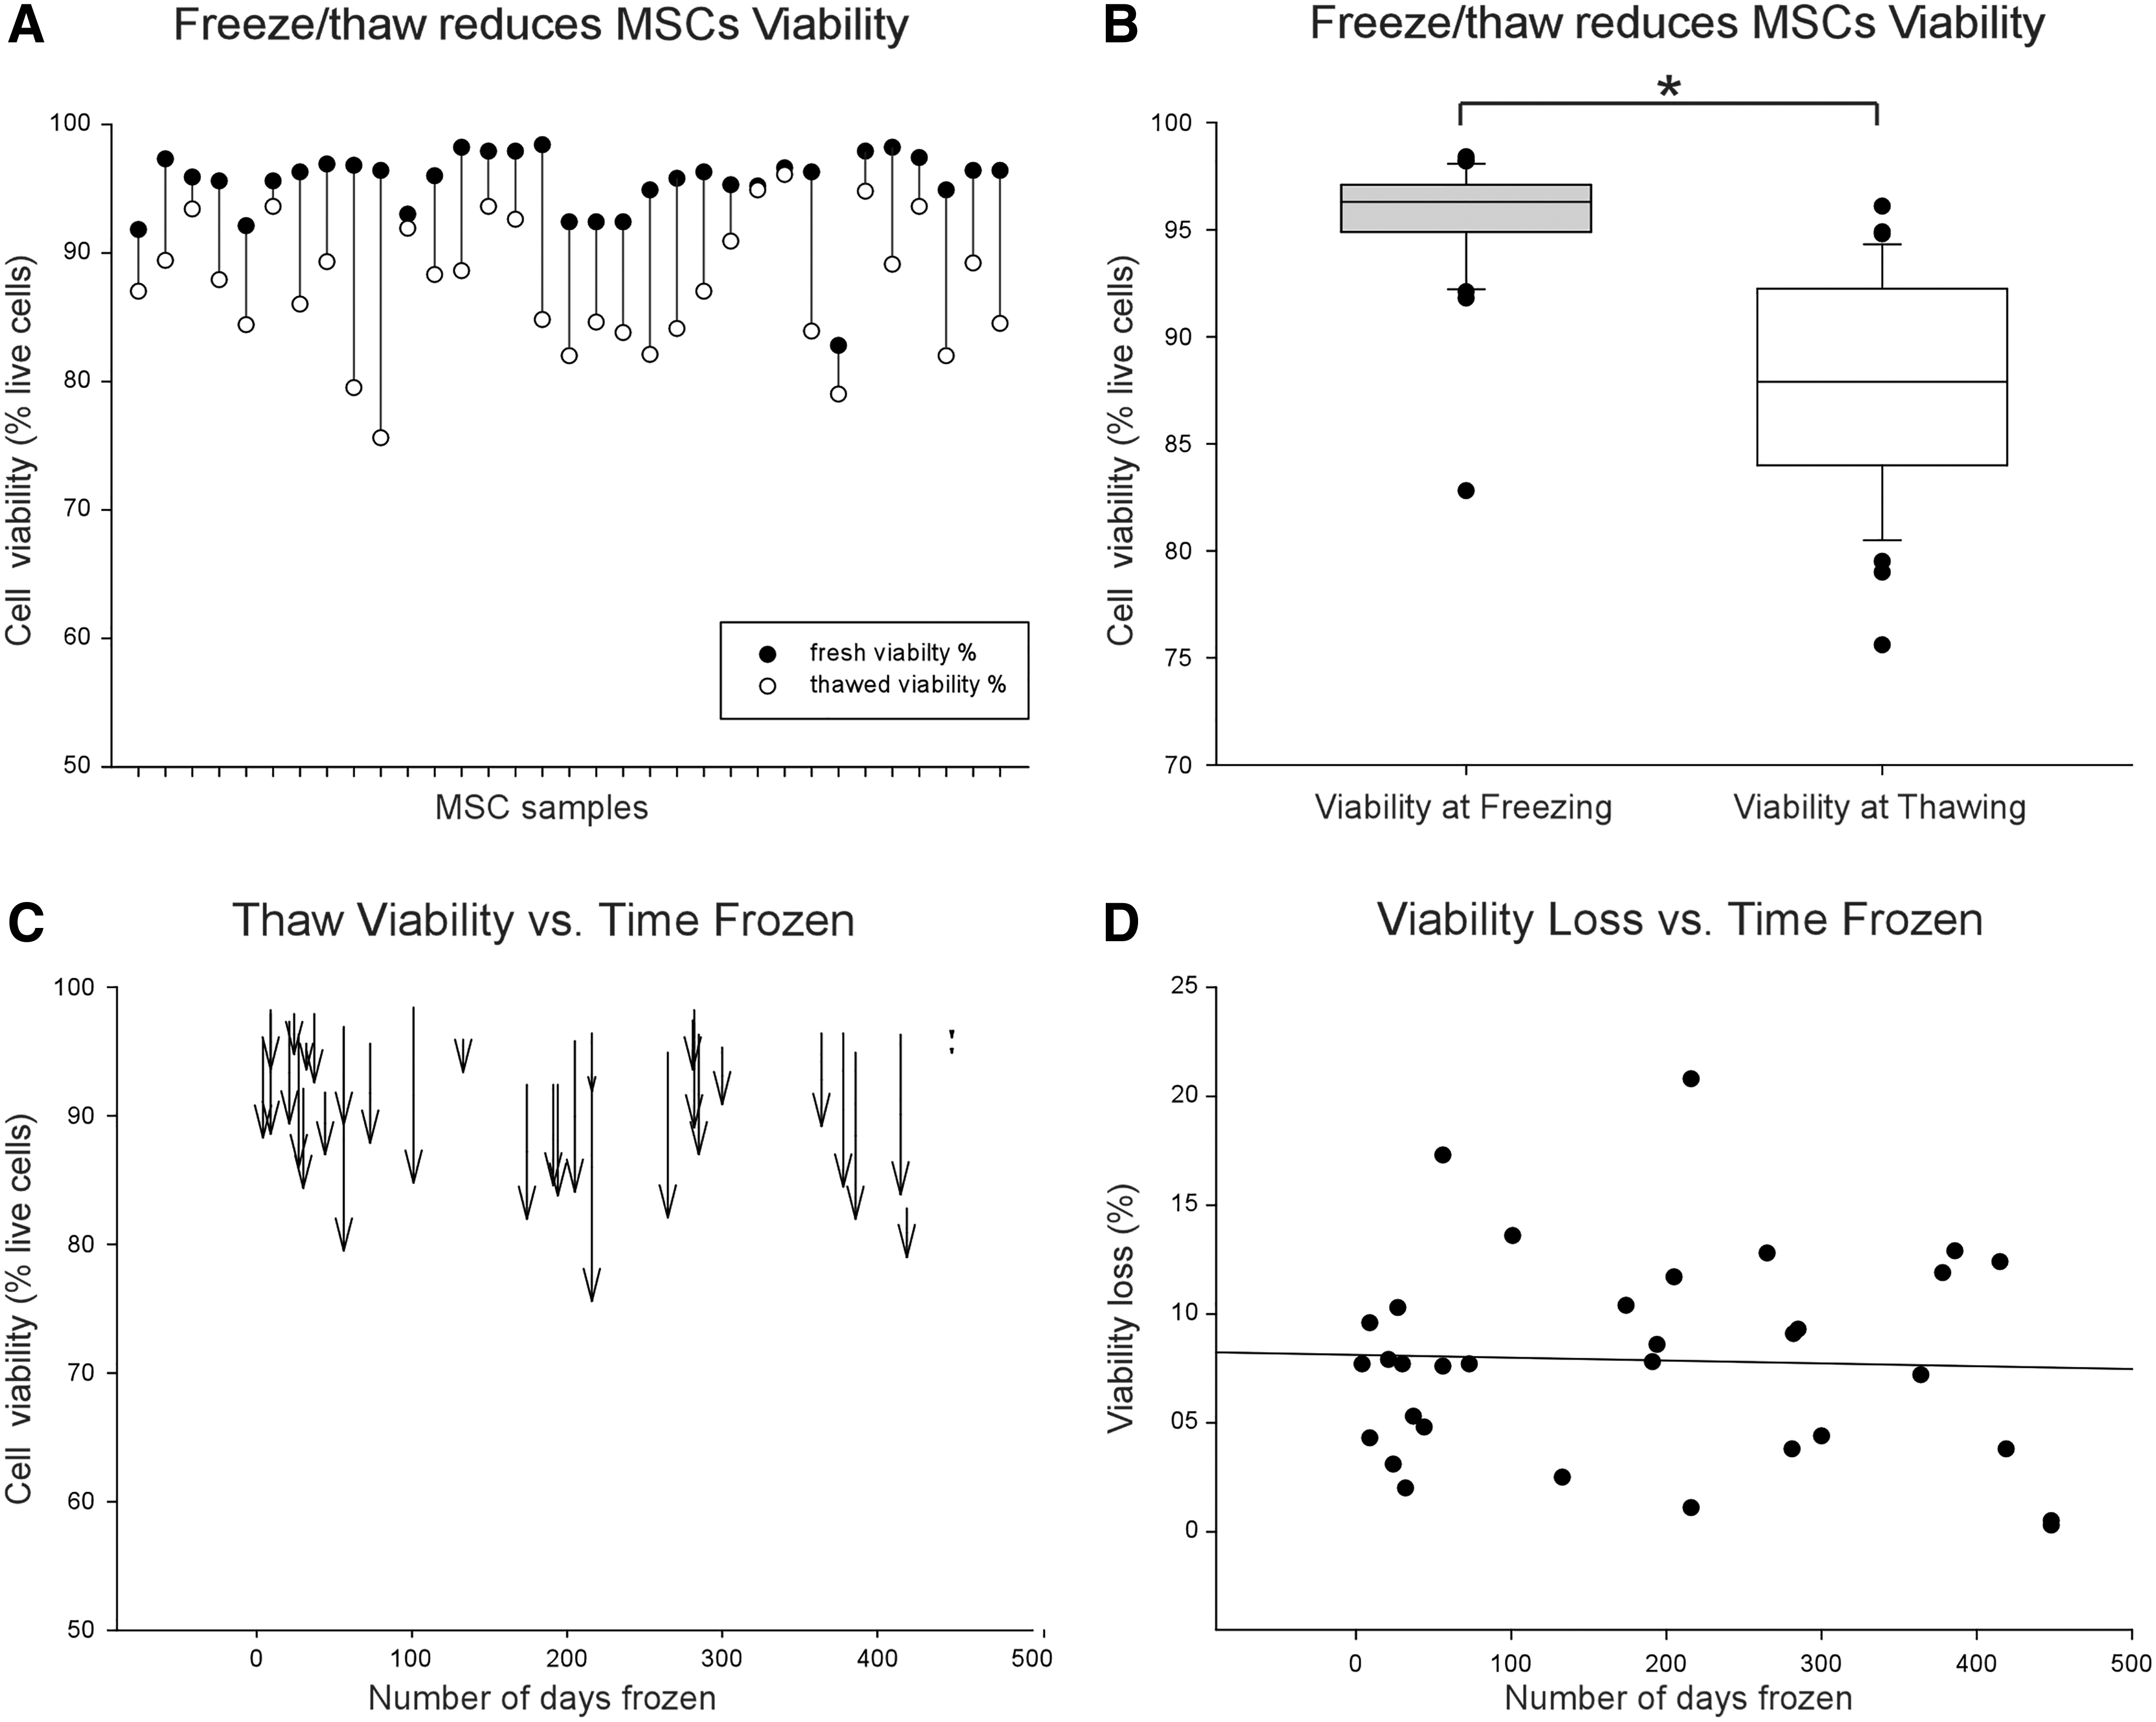
Cryostorage reduces the viability of canine MSCs.
Trilineage differentiation
Many articles in the canine MSC literature do not demonstrate trilineage differentiation, and for that reason, some have argued that differentiation to two lineages is sufficient to demonstrate multipotent progenitors in canine MSCs. In pilot testing, eight different differentiation methods gleaned from the literature were compared for trilineage differentiation (Supplementary Figs. S2–S4 and Supplementary Table S1). As shown in Fig. 8, canine UC-MSCs successfully differentiate to bone-forming, cartilage-forming, and fat-forming lineages. The efficiency to differentiate canine UC-MSCs to adipocytes was low, but this probably reflected cell loss during differentiation and further optimization is likely possible.
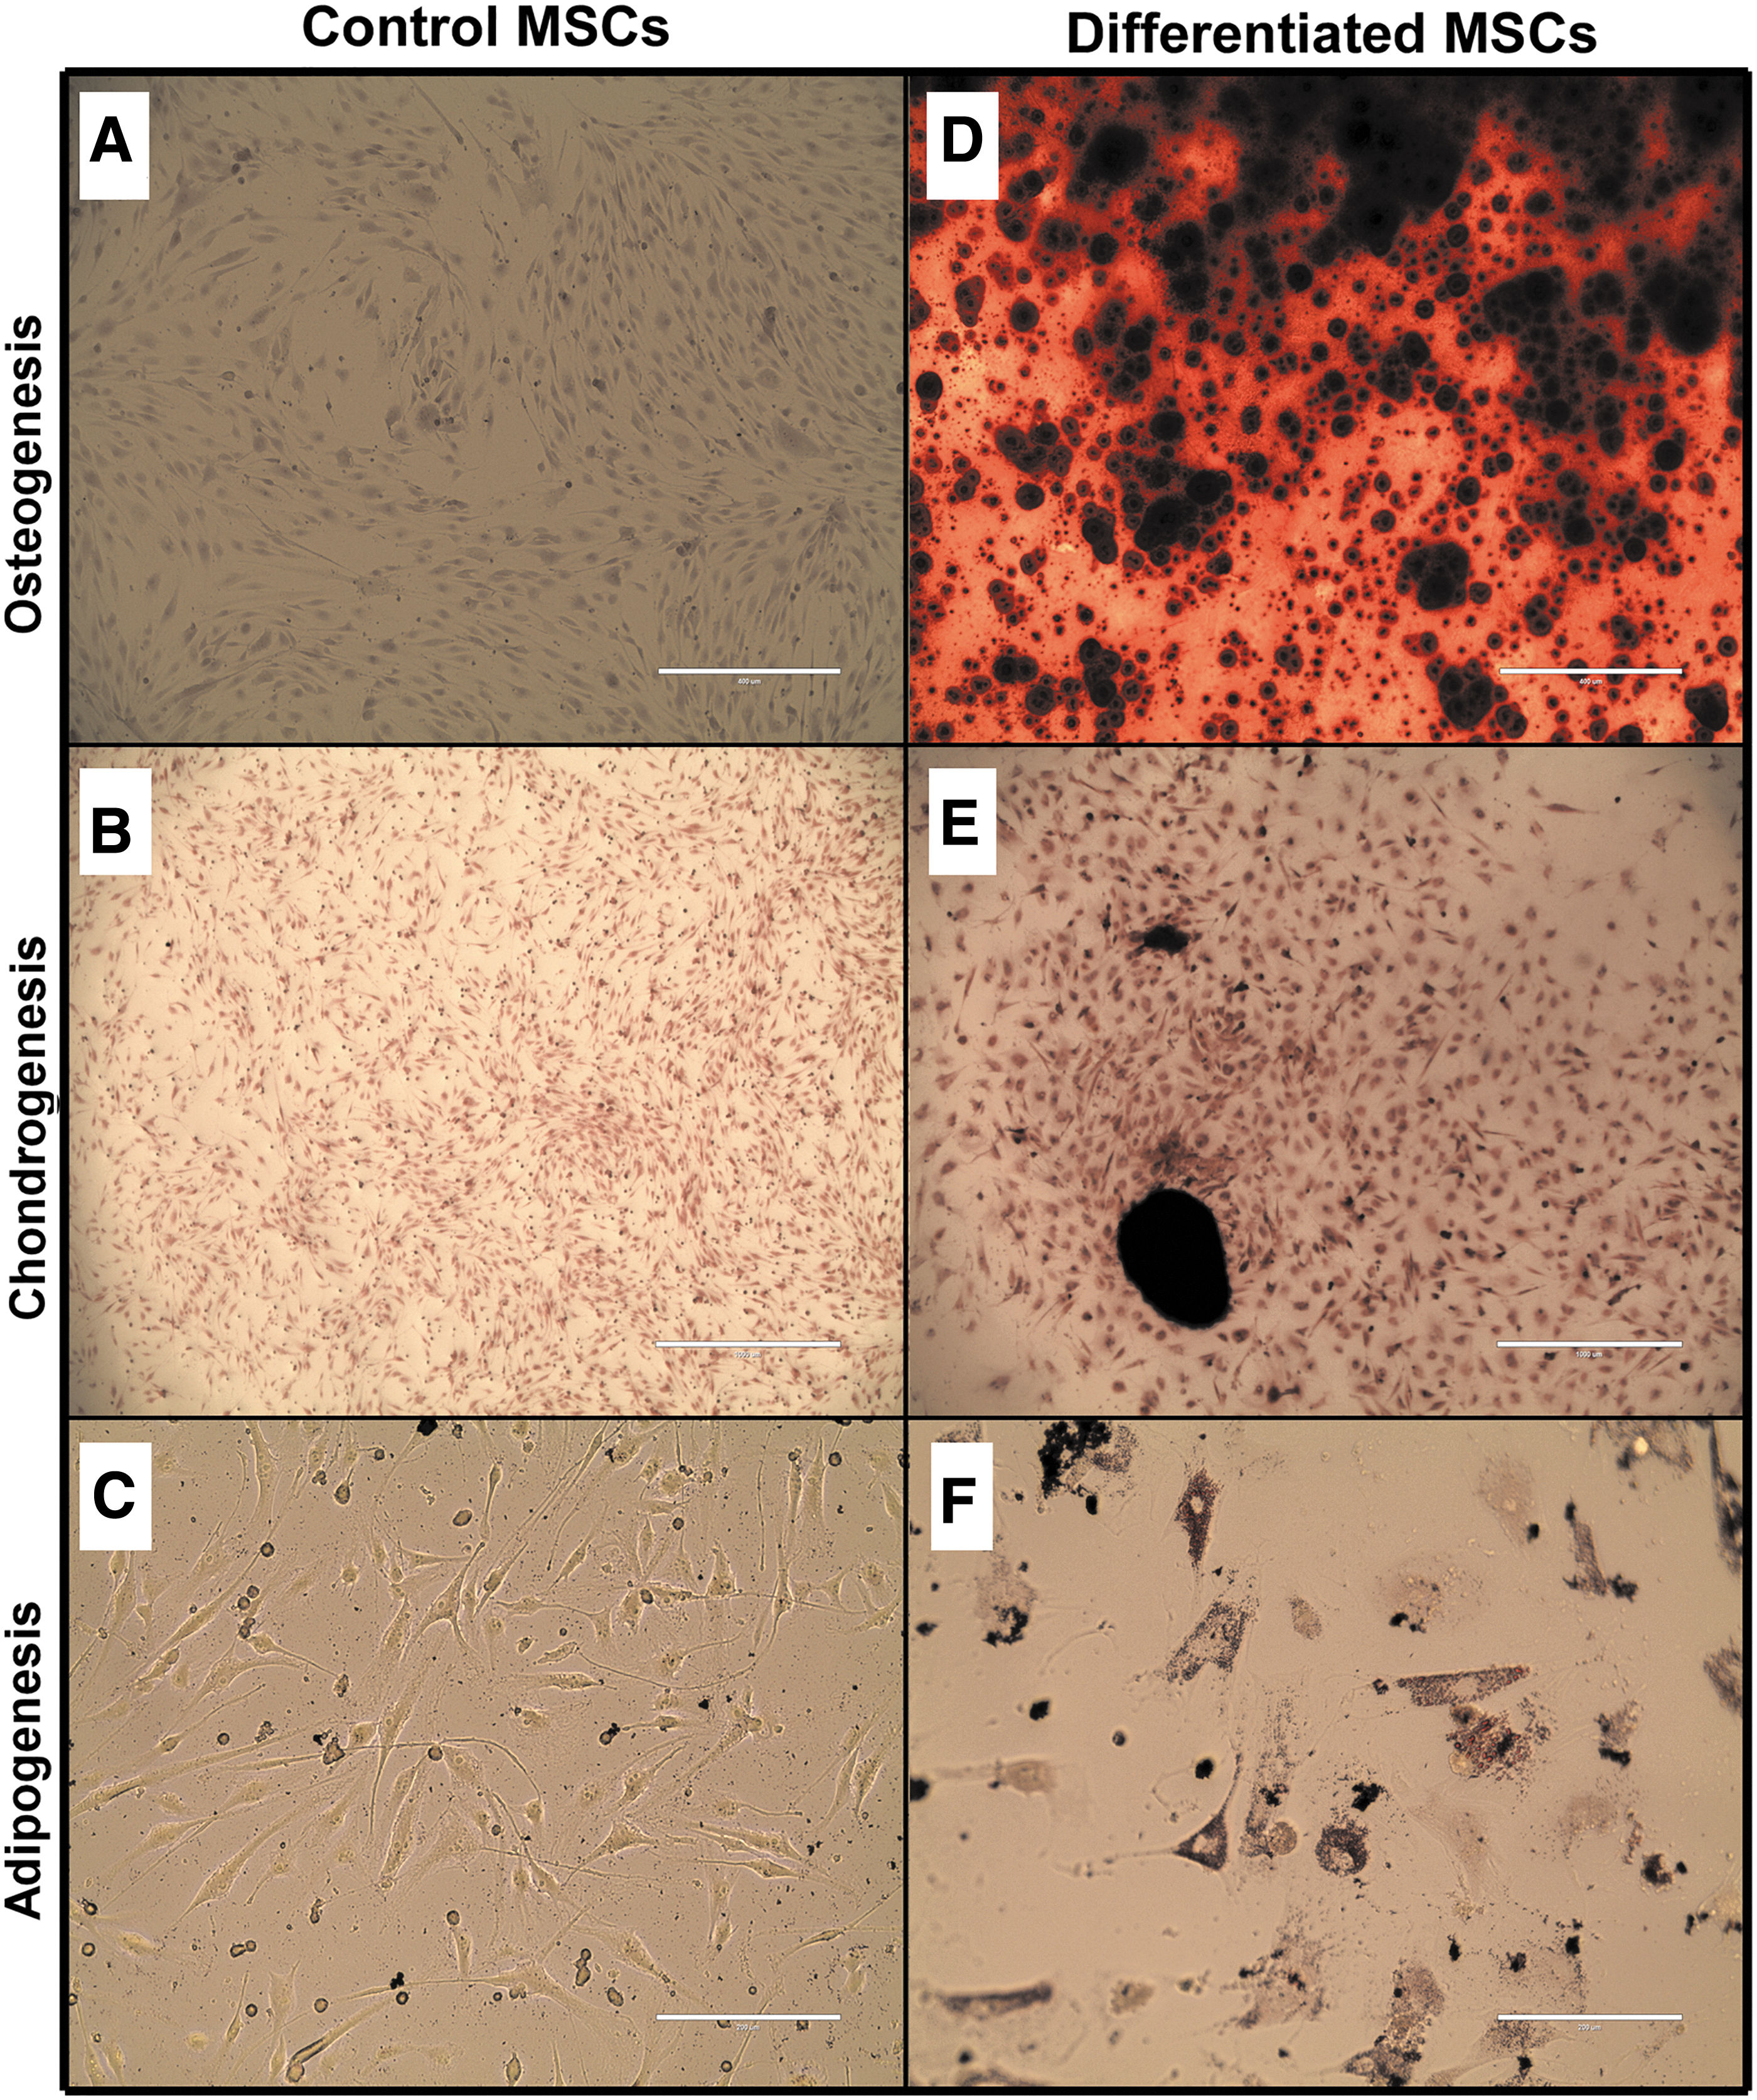
Trilineage differentiation of canine MSCs (line 30 at passage 5).
Immunophenotyping by flow cytometry
We performed extensive testing of antibodies to find those that work best for canine UC-MSCs (Table 1). While representative data are shown in Fig. 9, we validated the staining patterns provided here in two or three different canine UC-MSC lines at passages 5 to 8. Canine UC-MSCs positively labeled for CD90, CD73, CD44, and CD105, as indicated by the mean fluorescence intensity shift in the monomodal population of gated cells, but the size of the positive shifts was not as large as we have seen previously when working with human UC-MSCs [4,5,53]. We wondered whether the smaller shift was due to using a mouse antihuman CD90 (clone 5E10), instead of a canine-specific antibody. To address this concern, we repeated the flow cytometry using a rat anticanine CD90 (clone YKIX337.217).
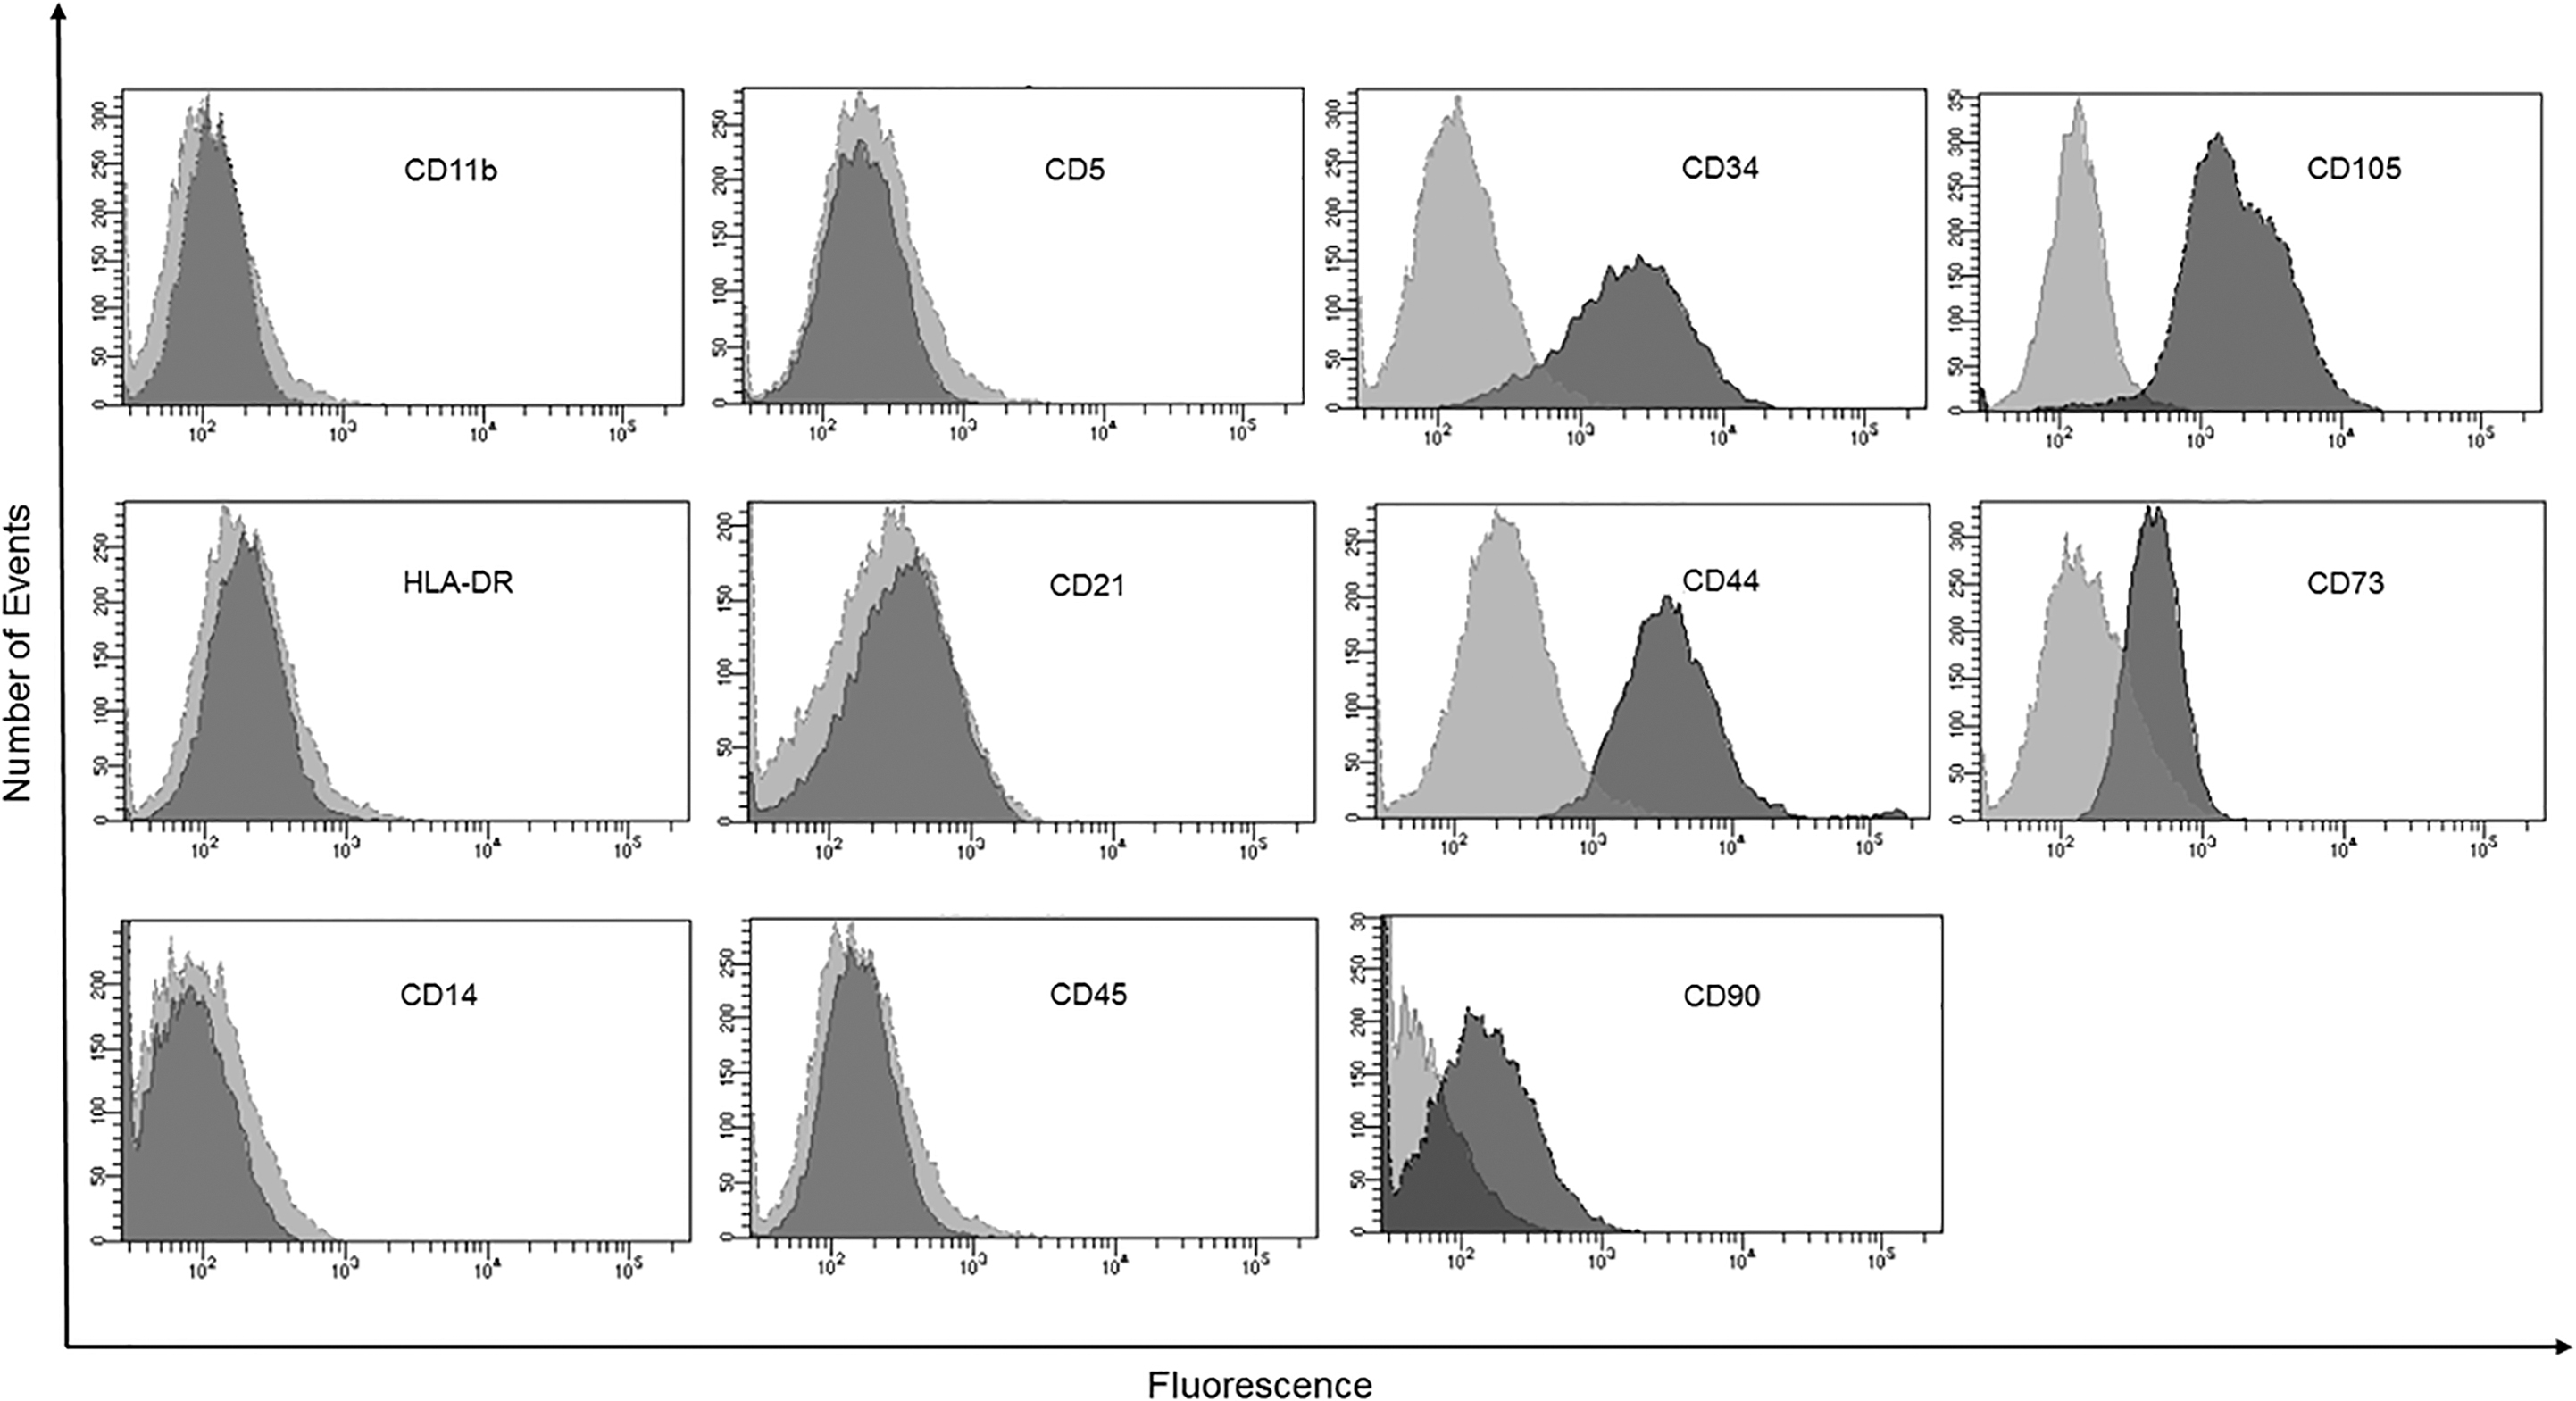
Immunophenotyping of canine UC-MSCs. Representative flow cytometry histograms with unstained cells (light gray) versus antibody labeled sample (dark gray) for two or three canine MSC cell lines, depending on surface marker. Based on the prominent shift in fluorescence intensity for the entire population, the data are interpreted as follows: MSCs were positive for CD34, CD105, CD44, CD73, and CD90. MSCs were negative for CD11b, CD5, HLA-DR (MHC-II), CD21, CD14, and CD45.
As shown in Supplementary Fig. S6, the positive shift in CD90 was not frankly affected by using a canine-specific rat anti-CD90 compared with the mouse human-specific anti-CD90. We conclude that the surface expression of canine UC-MSCs is less than that of human UC-MSCs. Another observation that confused us was that canine UC-MSCs displayed positive labeling for CD34, which is typically considered a hematopoietic stem cell marker. To confirm whether CD34 was expressed by canine MSCs, we performed follow-up experiments that are described in the next section. As expected, canine MSCs had negative labeling for MHC class II, CD11b, CD14, CD21, CD5, and CD45.
Confirmation of CD34 expression by RT-PCR
Since we observed CD34-positive labeling for canine UC-MSCs, we confirmed this by alternative means. Two PCR primer pairs, spanning an intron, were designed for CD73, CD90, CD105, CD34, and CD45 to perform RT-PCR on RNA samples obtained from 12 different canine MSC lines. As shown in Supplementary Fig. S7, canine MSCs express mRNA for CD73, CD90, CD105, and CD34, as indicated by the finding the appropriately sized amplicon after RT-PCR amplification for both primer pairs tested. As shown in Supplementary Fig. S6, both PCR primer sets confirm expression of CD73, CD90, CD105, and CD34 mRNA. However, the 434 bp PCR primer pair for CD73 showed multiple bands, a strong band between 400 and 500 bp of the expected product, and in lanes 2,3, and 11, a second, larger product, suggesting nonspecific amplification.
Therefore, we confirmed the specificity of the PCR findings for CD34, CD73, CD90, and CD105 by sequencing. The sequences were verified to be 99%–100% matches to the expected canine mRNA (Supplementary Table S3). In contrast, canine MSCs did not express mRNA for CD45 to a detectable amount. This suggests that the flow cytometry results are valid since 11 of 12 lines tested (>91%) of the canine UC-MSC lines expanded using our culture, and passage conditions express CD34 mRNA and protein.
Evaluation of cell cycle by flow cytometry
Canine UC-MSC ploidy and cell cycle partitioning were evaluated using flow cytometry, as shown in Fig. 10. The analysis of cell cycle revealed ∼78% of the cells in G0/G1, ∼16% cells in G2/M phase, and ∼8% of the cells in S phase. Note that no tetraploid or aneuploid cells were detected.
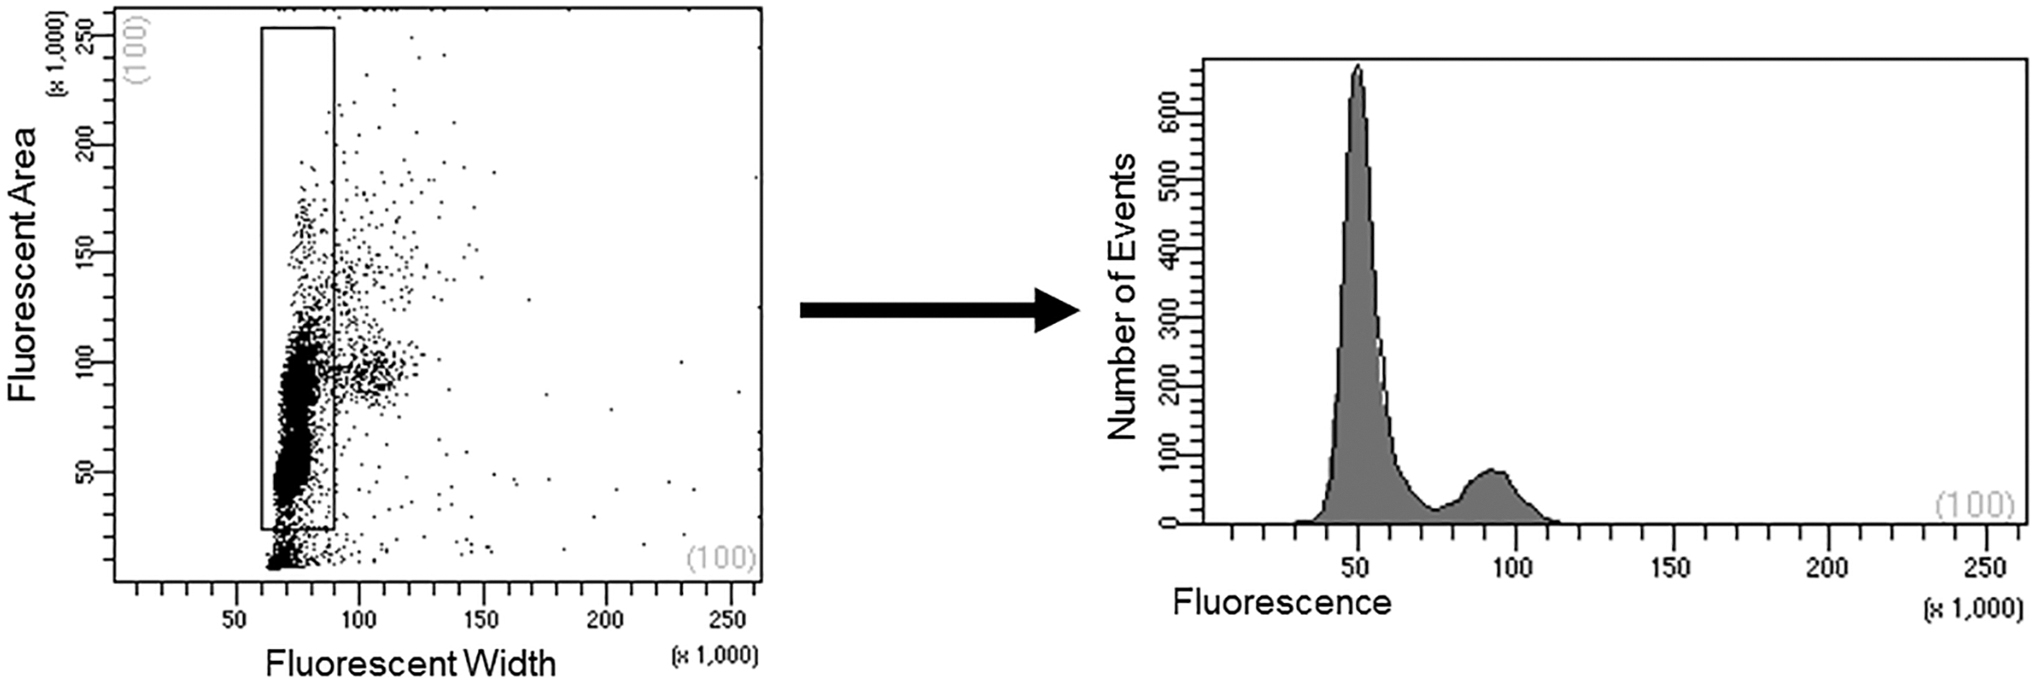
Flow cytometric analysis of canine MSC cell cycle and polyploidy. The left panel illustrates the gating strategy to exclude doublets and debris. The histogram in the right panel indicates the stage of cell cycle based upon DNA staining. The majority of canine MSCs (∼78%) were in the G0/G1 phase with fewer cells in the G2/M phase (16%), and 6% in the S phase.
Discussion
In this study, canine UC-MSC isolation and manufacturing protocols were generated using UCs from 30 litters. Five new findings encapsulate this study. First, the manufacturing of canine UC-MSCs was fundamentally different from that of human UC-MSCs. By using human UC-MSC manufacturing protocols on canine cells, as done in Stage 1, most lines cease proliferation or senesce rapidly, since only 50% of the MSC lines could be maintained beyond passage 4.
Second, canine UC-MSC manufacturing was improved by adding cell attachment factors, such as gelatin -coating to tissue culture plates. Study by Devireddy et al. had previously indicated that gelatin coating was important for canine MSCs when they are expanded in serum-free defined medium [54]. This study indicates that addition of this attachment factor extends the longevity of MSC culture and improves colony-forming unit-fibroblast efficiency when MSCs are grown with FBS-supplemented medium. When human MSCs are cultured in serum-free conditions, the addition of attachment factors is critical for their expansion [53].
These changes, represented here by shift from Stages 1 to 2, enabled 50% of the MSC lines expand to passage 8. Furthermore, use of gelatin coating significantly enhanced longevity of MSCs' self-renewal capability indicated by higher CPDs, and improved colony forming efficiency.
Third, an improvement was noted when nattokinase was used for lifting MSCs for passage. Nattokinase is a serine protease and a fibrinolytic enzyme isolated from Bacillus subtillis natto B-12 in traditionally fermented Japanese soybean. Previously, Carrion et al. reported that nattokinase could extract BM-derived MSCs out of a fibrin gel better than trypsin-EDTA or TryplLE [49]. We found nattokinase to be more effective for lifting canine MSCs than standard lifting agents, terms of yield, and viability. Lifting MSCs and passaging through trypsin-EDTA, dispase, or TrypLE reduced passage yield and viability. In short, nattokinase significantly improved cell viability and canine UC-MSC yield at passage.
Fourth, canine UC-MSC viability is reduced by cryopreservation, as expected. However, the impact of cryopreservation on canine UC-MSCs is no worse than that on human UC-MSCs (data not shown), and all 33 canine UC-MSC lines tested here re-entered the cell cycle and expanded after cyrostorage. Importantly, the length of cryostorage had no significant impact on revival viability or expansion capability of canine UC-MSCs.
Fifth, we evaluated antibodies to be used as a standardized panel for evaluation of canine UC-MSCs. While overcoming the early senescence of canine MSC was a critical hurdle, the next challenge is to characterize canine MSCs. This is called a challenge because no consensus set of antibodies has been described for canine MSC surface markers. In this study, we addressed this issue, and the monoclonal antibodies used in the canine MSC field were reviewed, and a list of antibodies that have been tested for canine MSC characterization is provided in Supplementary Table S2 [17 –19,22,31,32,37,45,46,54 –65]. Antibodies used here are highlighted on this list.
As can be seen when reviewing this table, the flow cytometry results using these antibodies were conflicting: Some of the antibodies performed well, meaning that they produced consistent results across different laboratories, and others were less consistent. In Table 1, the antibodies that worked in this study, and henceforth might be considered for a standard flow cytometry marker set for canine MSC immunophenotype characterization, are provided.
Two points raised by our flow cytometry study bear additional discussion. First, the positive shift for CD73 and CD90 staining was less than what we have seen in human UC-MSCs [52 –54]. We tested whether using an anticanine-specific CD90 would improve the flow cytometry positive shift, compared with the antihuman CD90. As shown in Supplementary Fig. S6, the positive shift was not frankly different, suggesting that the expression of CD90 was not as high in canine MSCs.
Second, canine UC-MSCs appear to express CD34. This observation is controversial, since it is in contrast to the International Society for Cell and Gene Therapy (ISCT) consensus marker set for human MSCs [35]. However, it should be noted that three other laboratories have reported CD34 staining of canine MSCs, while most laboratories do not observe CD34 staining (Supplementary Table S2). Note also that the flow cytometry results for CD34 were confirmed by RT-PCR, and 11 out of 12 UC-MSC lines expressed CD34 mRNA (shown in Supplementary Fig. S6), and further verified by DNA sequencing of the amplicons (data not shown). Together, this suggests that our cell source, culture, and passaging conditions result in CD34 expression by UC-MSCs. These five new findings indicate the importance for optimizing cell culture conditions and may have downstream impact on the clinical testing of canine UC-MSCs.
In the human MSC field, commercial human MSC flow cytometry characterization kits provide as a “standard” for comparison of MSC surface markers per the ISCT definition across the field. In contrast, no standardized antibody kit is available for the canine to facilitate between laboratory MSC comparisons. Canine MSCs positive surface marker expression, for example, the shift in mean fluorescence intensity, is less robust than that observed in human MSCs. Specifically, the shift in fluorescence intensity for canine MSCs for markers CD73, CD90, CD105, and CD44 is smaller than that observed in human MSCs. This could be due to differences in the affinity of the antibody for canine versus human molecule, or differences in the expression level between species, or due to cell culture-related “artifact.”
Canine UC-MSCs were negative for hematopoietic markers CD45, CD5, CD21, CD14, and CD11b, and for HLA-DR (MHC class II), like human MSCs. Review of the literature provided in Supplementary Table S2 revealed that some laboratories reported CD34-positive canine MSCs [22,42,59,63], and other laboratories, using the same CD34 clone, find no MSCs staining for CD34.
Our review found that CD34-positive cells did not break cleanly such that CD34 expression was found only in tissue-specific MSCs, or only in early passage MSCs. For example, one article found CD34-positive cells in 18.4% AT-derived MSCs and in 3.6% BM-derived MSCs [22]. Another article reported 29.2% CD34-positive AT-derived MSCs [59]. A third article shows that CD34 expression (10%) AT-derived MSCs compared with 1% of the MSCs were CD105 positive. Finally, Ryu et al. indicated that CD34 was expressed at low level in passage 1 AT-derived MSCs, but the expression was lost by passage 7 [63].
Based upon our results and the previous reports, some possible explanations for the disparity in CD34 expression can be considered. First, the observed CD34 staining here is real and CD34 expression in MSCs may be induced by culture or passaging conditions used here, since CD34 antibody clone we used performs consistently with high specificity in canine peripheral blood and BM immunophenotyping (K.K. and N.S., pers. comm.). Flow cytometry results for CD34 are supported by our RT-PCR (shown in Supplementary Fig. S6) and DNA sequencing results (data not shown), which demonstrated CD34 expression in 11 of 12 canine UC-MSC lines.
Second, as indicated by 3D cell culture work, it is possible that cell–substrate and cell–cell interactions may alter surface marker phenotype [66 –68]. Follow-up study is needed to determine whether CD34 expression is due to using UC-MSCs, and to determine whether MSCs from other tissue sources can be induced to express CD34 by altered culture conditions.
Previous reports indicated that expanding canine MSCs was problematic, for example, that canine MSCs cannot proliferate beyond passage 7, and that canine MSCs must be characterized around passage 3 [60]. Some previous studies did not demonstrate trilineage differentiation or they performed RT-PCR to demonstrate gene expression in lieu of flow cytometry. We attribute these “problems,” for example, lack of multi-lineage differentiation, loss of differentiation potential, and to senescence associated with inappropriate cell attachment and passaging conditions. This was supported in our pilot studies (data not shown) where UC-MSCs from Stage 1 failed to differentiate or did so at very low efficiency whereas UC-MSCs from Stages 2 and 3 were able to differentiate at high efficiency.
Canine UC-MSCs have different medium requirements than human UC-MSCs, and that the addition of bFGF to the medium formulation significantly improved population doubling time and longevity in culture such that lines could be maintained beyond passage 11. The addition of bFGF is known to have a mitogenic effect on MSCs of other species [50 –52]. In summary, we demonstrated that bFGF not only improved growth rate, but it also may play a role in preventing UC-MSC senescence and improving differentiation efficiency.
Canine UC-MSCs were capable of differentiation to bone-, cartilage-, and fat-producing cells. Note that trilineage differentiation of canine MSCs is a point wherein laboratories have not consistently demonstrated the ISCT MSC definition. While saying this, we also observed low efficiency to differentiate UC-MSCs to adipocytes.
We suggest that trilineage differentiation be adopted as part of standard for defining canine MSCs to meet the ISCT “multipotent cell” definition. We also suggest that further refinement in differentiation protocols would improve compliance. Note that more recently the ISCT released revised MSC characterization criterion that includes functional bioassays. We consider the addition of a functional bioassay important for canine UC-MSC characterization but it is beyond the scope of the present report.
Canine MSCs derived from different tissues such as AT, BM, or tissues discarded at birth such as placenta, amniotic membranes, or UC have been compared by others. In that regard, the advantages of MSCs derived from UC are clear. For example, MSCs from the UC are isolated from subjects of a consistent young age, and there is the potential to create banks of allogeneic cells for clinical use. Therefore, manufactured and banked UC-MSCs have the potential as an off-the-shelf allogeneic product, similar to UC blood hematopoietic stem cells. In that regard, this report provides an important contribution to the canine MSC literature.
MSCs are widely investigated in the field of regenerative medicine, as indicated by the number of MSC clinical trials listed on the
In conclusion, this report addresses some limitations associated with manufacturing canine MSCs for clinical applications. Although significant improvements are reported here, further optimization might be possible. The knowledge gap between human UC-MSCs and canine UC-MSCs should be closed to maximize the usefulness of this companion animal species as a model for human UC-MSC clinical translation.
Footnotes
Acknowledgments
We thank Drs. Charan Ganta (Kansas State University) and Dori Borjesson (University of California, Davis) for critically reading an earlier draft of this article and providing input. We thank Dr. Kent Law and his staff from Symbioun, Inc. (Abilene, Kansas) as well as Dr. Jeannie Binns and her staff at NEK Veterinary Services Group (Hiawatha, Kansas) for their crucial role in the collection and donation of discarded canine UC tissue. The authors acknowledge the artistic support of Ellen Weiss for producing the graphics in ![]() .
.
Author Disclosure Statement
The authors have nothing to declare. The intellectual property reported here has been disclosed to Kansas State University's Institute for Commercialization and a patent disclosure has been filed.
Funding Information
This study was supported by the State of Kansas to the Midwest Institute for Comparative Stem Cell Biotechnology.
Supplementary Material
Supplementary Figure S1
Supplementary Figure S2
Supplementary Figure S3
Supplementary Figure S4
Supplementary Figure S5
Supplementary Figure S6
Supplementary Figure S7
Supplementary Table S1
Supplementary Table S2
Supplementary Table S3
References
Supplementary Material
Please find the following supplemental material available below.
For Open Access articles published under a Creative Commons License, all supplemental material carries the same license as the article it is associated with.
For non-Open Access articles published, all supplemental material carries a non-exclusive license, and permission requests for re-use of supplemental material or any part of supplemental material shall be sent directly to the copyright owner as specified in the copyright notice associated with the article.