
Abstract
Mesenchymal stromal cells (MSCs) are known to stimulate the survival and growth of endothelial cells (ECs) by producing paracrine signals, as well as to differentiate into pericytes and thereby support blood vessel formation and stability. On the other hand, cells with an EC-like phenotype have been found within the CD14+ and CD34+ cell populations of peripheral blood (PB) mononuclear cells (MNCs). The aim of this study was to investigate the proangiogenic differentiation potential of human MSC-MNC co-cultures. Bone marrow-derived MSCs (2,500 cells/cm2) were co-cultured with MNCs (50,000 cells/cm2), which were isolated from the PB of healthy donors. MSCs and MNCs cultured alone at same cell densities were used as controls. Cells in MNC fraction and in co-cultures were isolated for CD14, CD34, and CD31 surface markers with magnetic-activated cell sorting. Co-cultures were analyzed for cell proliferation and morphology, as well as for the expression of various hematopoietic, endothelial, and pericyte markers by immunocytochemistry, quantitative PCR (qPCR), and flow cytometry. Vascular endothelial growth factor (VEGF) expression and secretion was measured with qPCR and enzyme-linked immunosorbent assay, respectively. Our results show that in co-cultures with MSCs, CD14+CD45+ MNCs differentiated into spindle-shaped, nonproliferative, EC-like, myeloid angiogenic cells (MACs) expressing CD31, but also into pericyte-like cells expressing neural/glial antigen 2 (NG2) and CD146. Functionality of the isolated MACs was demonstrated in co-cultures with human umbilical vein endothelial cells, where they supported the formation of tube-like structures. NG2+ cells of MNC-origin were found among both CD34−CD14+ and CD34−CD14− cell populations, indicating the existence of different subtypes of pericyte-like cells. In addition, VEGF was shown to be secreted in MSC-MNC co-cultures, mainly by MSCs. In conclusion, MSCs were shown to possess proangiogenic capacity in MSC-MNC co-cultures as they supported the differentiation of functional MACs, as well as the differentiation of pericyte-like cells of MNC origin. This phenomenon was mediated at least partially via secreted VEGF.
Introduction
Neovascularization is an important issue in regenerative medicine and tissue engineering, but efficient vascularization and finding an optimal endothelial cell (EC) source remains a challenge. Endothelial progenitor cells (EPCs), which arise from hematopoietic stem cells, were originally identified among the peripheral blood (PB) mononuclear cell (MNC) fraction [1], more precisely in the CD14+ [2,3] and CD34+ [4] cell populations. Since then, the research on PB-derived EPCs has evolved substantially and it has been demonstrated that not all those PB-derived cells, which are capable of promoting neovascularization, are true EPCs [5,6]. Because there appears to be diverse EPC subtypes with different phenotypes and biological functions, their definitions and nomenclature have recently been specified [7]. The current consensus states that there are at least two distinct groups of cells: myeloid angiogenic cells (MACs; also known as circulating angiogenic cells, CACs), which display a mixed endothelial/monocytic/hematopoietic phenotype and enhance angiogenesis in a paracrine manner, as well as endothelial colony-forming cells, which have high proliferative potential and intrinsic tube-forming capacity in vitro [7]. Both of these cells seem an interesting EC source because of their easy access from PB and the possibility to use autologous cells for vascularization of tissue-engineered transplants [8].
Bone marrow-derived mesenchymal stromal cells (MSCs) are another attractive cell source for regenerative medicine and tissue engineering because of, for example, their differentiation capacity [9]. The mechanisms by which MSCs exert their therapeutic potential depend on their key properties: The cells can secrete soluble factors that are capable of stimulating the survival and recovery of injured tissues; they are home to sites of damage and attenuate exaggerated immune responses [10]. For example, the important connection between MSCs and ECs in vascular regeneration has been demonstrated in several studies. The MSCs can stimulate the differentiation of ECs through the production of paracrine signals, including vascular endothelial growth factor (VEGF), which is the key factor in the crosstalk between ECs and MSCs [11 –13]. VEGF mediates its cellular responses by binding to receptors vascular endothelial growth factor receptor 1 and 2 (VEGFR1 and VEGFR2) [14,15] but it has a higher affinity to VEGFR1 [16]. In addition, MSCs appear to support angiogenesis by differentiating toward the pericyte lineage when co-cultured with ECs [17,18]. It has been suggested that pericytes and MSCs could have the same origin or even be the same cells, as culture-expanded pericytes have been shown to express all the classical MSC markers [19]. On the other hand, it has been indicated that even if pericytes represent an MSC subpopulation, the pericyte-like behavior is not an intrinsic characteristic of MSCs [20]. Interestingly, the existence of hematopoietic pericytes having a monocytic origin has been hypothesized and it has been proposed that different pericyte populations might have specialized functions during angiogenesis [21].
Co-cultures have been implicated as a potential tool for generating tissue-engineered microvessels [8]. As MSCs can undergo pericyte differentiation and MNCs contain cells with EC-like differentiation potential, co-cultures of these cells are of interest when addressing the significance of cell-to-cell communication in vascularization. We have previously established an MSC-MNC co-culture setup and shown that when cultured together, these cells, indeed, possess angiogenic potential [22], which is reflected in the expression profiles of various proangiogenic factors [23]. However, the contribution of each cell type and whether there exist specific cellular subtypes that are capable of EC-like and/or pericyte-like cell differentiation in the MNC fraction remained unknown.
Thus, the aims of the current study were to investigate the cellular phenotypes in our MSC-MNC co-culture setup in more detail and to analyze the cellular components of the MNC fraction by using magnetic-activated cell sorting and flow cytometry analysis. For cell sorting, CD14, CD34, and CD31 were selected as specific surface markers, since they are known to be expressed by PB-derived cells with angiogenic potential. Various hematopoietic, endothelial, and pericyte markers were used to characterize cell populations in co-cultures. Cell functionality was evaluated by tube-formation and angiogenesis assays in co-cultures with human umbilical vein endothelial cells (HUVECs). In addition, as VEGF is a known mediator of MSC-EC crosstalk, we studied VEGF secretion in MSC-MNC and MAC-HUVEC co-cultures.
Materials and Methods
Cell cultures
Human MSCs were isolated from iliac bone marrow of a 21-year-old healthy female donor after signed informed consent under the protocol approved by the Ethics committee of the Helsinki University Central Hospital, Finland. The cells were expanded and stored in liquid nitrogen, as previously described [24]. The MSCs were identified according to internationally verified criteria [25] and cultured under previously optimized conditions [26]. Cells at passages 5 to 6 were used for the experiments.
The MNCs were isolated by gradient centrifugation (Ficoll-Paque Plus) from PB samples (average volume 40 mL) drawn from three healthy donors: a 33-year-old female, a 25-year-old male, and a 29-year-old male. The local Ethical Committee of University of Turku approved the protocol, and all volunteer donors signed an informed consent.
The MSCs were plated into 96-well or 24-well culture plates (2,500 cells/cm2), chamber slides (2,500 cells/cm2), or T25 cell culture flasks (1,000 cells/cm2). The MSCs were first cultured in basal medium containing α-MEM (41061037; Thermo Fisher Scientific), 9% fetal bovine serum (FBS, US-origin, 16000044; Thermo Fisher Scientific), and 100 IU/mL of penicillin and 100 μg/mL of streptomycin (Gibco) for 3–4 days; thereafter, the MNCs were isolated and added to the cultures in the ratio of 1:20 (MSC:MNC). The MSCs and MNCs cultured alone were used as controls. All cultures were performed in basal medium. Half of the media was changed every 3 to 4 days, and the cells were cultured for a total of 7 or 14 days. Three biological replicates were included; each experimental group consisted of three or four parallel samples (cell culture wells or flasks), and each experiment was repeated three times.
Green fluorescent protein (GFP)-expressing human umbilical vein endothelial cells (GFP-HUVECs) (IncuCyte® Cytolight Green HUVECs, Cat. No. 4453; Sartorius) were expanded and maintained in Endothelial Cell Growth Medium 2 (EGM-2, C-22011; PromoCell), and cells at passages 4 to 8 were used for the experiments.
Cell viability and proliferation assay
Alamar Blue assay (Invitrogen) was used to analyze cell viability and proliferation. The assay was performed according to the manufacturers' instructions every 4 days in MSC-MNC co-cultures and monocultures. The cultures were incubated with Alamar blue solution for 30 min before the fluorescence at 550–580 nm was measured (HIDEX Chameleon Plate Reader; Hidex Ltd., Turku, Finland).
Magnetic-activated cell sorting
Cell sorting was performed with magnetic beads according to the manufacturer's instructions (Miltenyi Biotec). After isolating the whole MNC fraction by using Ficoll gradient centrifugation, magnetic nanoparticles coated with antibodies against CD14 or CD34 were incubated with MNCs for 15 min (CD14) or for 30 min (CD34) at +4°C. CD14 microbeads (130-050-201; Miltenyi Biotec) were added as 20 μL per 107 cells, and CD34 microbeads (130-046-702; Miltenyi Biotec) were added as 100 μL per 108 cells. Solution of beads and cells was transferred to an LS column (130-042-401; Miltenyi Biotec) in a strong magnetic field (Miltenyi Biotec), causing the cells expressing the antigen to remain in the column. Cells negative for the given surface antigen were collected as the flow through, and the positive cells were collected by removing the column from the magnetic field and eluting with a cold buffer [phosphate buffered saline (PBS) +1% FBS]. The sorting success was confirmed by flow cytometry, as described later. Double isolation was performed by first incubating MNCs with CD34 microbeads; after that, CD34− cells were incubated with CD14 microbeads as described earlier. Cells were counted and plated in co-cultures with MSCs in a 1:20 ratio in basal medium. The co-culture of MSCs with an unsorted MNC fraction (1:20) was used as a control.
To isolate CD14+CD31+ cells for the functional assays, MSCs and MNCs were co-cultured for 7 days. After cell detachment by Accutase (Life Technologies), isolation for CD14 was first performed as described earlier; thereafter, the CD14+ cells were subjected to CD31 isolation according to the manufacturer's instructions (130-091-935; Miltenyi Biotec). CD14+ cells were centrifuged 300 g for 3 min, and they were resuspended in 60 μL of Endothelial Cell Growth Medium (EGM, C-22010; Promocell); 20 μL of FcR Blocking Reagent was added. The mixture was vortexed briefly before 20 μL of CD31 microbeads were added to the mixture. Cells were incubated with the microbeads for 15 min in +4°C. After incubation, 1 mL of EGM was added to the mixture and centrifuged at 300 g for 3 min. The cell pellet was resuspended in 1 mL of EGM and transferred to an LS column in a strong magnetic field. The CD14+CD31+ cells were then collected by removing the column from the magnetic field and eluting with EGM. The sorting success was confirmed by flow cytometry, as described later.
Flow cytometry analysis
Cells were detached by Accutase, washed with PBS with 0.1% FBS, and filtered through 35-μm pore cell-strainer snap caps (Corning Incorporation, Durham, NC). Before staining, cells were transferred to a 96-well plate and Fc receptors were blocked with Human BD Fc Block reagent (BD Biosciences). Cells were stained with the following fluorochrome-labeled anti-human monoclonal antibodies (from BioLegend, San Diego, CA, unless otherwise stated): CD14 APC/Cy7 (clone 63D3), CD45 PE (clone 2D1), CD31 Brilliant Violet 711 (clone WM59), CD34 Brilliant Violet 421 (clone 561), CD146 APC (clone P1H12), and neural/glial antigen 2 (NG2) Alexa Fluor 488 (clone 9.2.27; Invitrogen, Thermo Fisher Scientific). Cells were washed with PBS, after which flow cytometric analysis was performed by using BD LSR Fortessa (BD Biosciences) and results were analyzed with Flowing Software (Turku Centre of Biotechnology, Turku, Finland). Spindle-shaped MNCs in co-cultures were located within the MSC population by gating first on CD45, followed by CD14 expression. Characterization of MACs was carried out by first gating CD14 and CD31 double-positive cells and then determining the percentage of CD45+ and CD34− cells in bivariate analysis. Results were expressed as the median fluorescence intensity (MFI), normalized to the respective unstained control. The percentage of cells expressing a specific phenotype was calculated according to the number of cells in the dot plot quadrants.
Immunocytochemistry
Cells were cultured in eight-well chamber slides (Millicell EZ; Merck) and after 7 and 14 days of culture, they were fixed with 3% paraformaldehyde. Samples were blocked with 3% bovine serum albumin (BSA) in PBS for 1h at room temperature and incubated overnight at +4°C with a primary antibody. Antibodies were diluted in 1% BSA in PBS. Monoclonal antibodies against the following antigens were used: rabbit anti-VEGFR1 (1:200, ab32152; Abcam), mouse anti-CD31 [platelet endothelial cell adhesion molecule (PECAM-1), 1:200, ab9498; Abcam], rabbit anti-platelet derived growth factor receptor beta (anti-PDGFRβ, 1:100, ab32570; Abcam), mouse anti-alpha smooth muscle actin (anti-α-SMA, 1:200, ab7817; Abcam), and rabbit anti-NG2 (1:100, ab183929; Abcam). For the detection of intracellular α-SMA, the cells were first permeabilized with 0.2% Triton X-100 in PBS for 10 min on ice and then washed three times for 5 min with PBS before blocking the unspecific binding of the antibody. Negative controls were conjugate controls, that is, primary antibody was omitted but secondary antibody was included. After the incubation with primary antibodies, cells were washed three times for 5 min with PBS and incubated with secondary antibodies in 1% BSA in PBS (1:1,000) for 1 h at room temperature in the dark. Goat anti-mouse (ab150113; Abcam) or goat anti-rabbit (ab150080; Abcam) were used as secondary antibodies, and mounting medium with DAPI (Vector) was used to mount the samples and to stain the nucleus.
Real-time quantitative PCR
Cells for RNA samples were cultured in T25-flasks, and total RNA was extracted by using GenEluteT Mammalian Genomic DNA Miniprep Kits (Merck) according to the manufacturer's instructions. RNA quality was checked by Nanodrop Spectrophotometer (Thermo Fisher Scientific), and deoxyribonuclease I (DNase I; Merck) was used to purify the RNA samples before reverse transcription. cDNA was synthesized from equal amounts of mRNA by using SensiFAST cDNA Synthesis Kit (Bioline). Specific primers were purchased from Metabion, and primer concentration in quantitative PCR (qPCR) was 25 nM. A list of primers is provided as a Supplementary Table S1. SensiFAST™ SYBR No-ROX Kit was used for real-time qPCR reaction according to the manufacturer's protocol. Beta-actin was used as a housekeeping reference gene, and results were analyzed by using MSCs alone as the calibrator.
Real-time cell imaging (IncuCyte)
MSCs and MNCs were co-cultured in 24-well culture plates, as described earlier. Morphological changes were evaluated by a real-time cell imaging system (IncuCyte® ZOOM or IncuCyte® S3; Sartorius). Images were automatically acquired and registered by the IncuCyte software system, and updates were recorded at 2 h intervals with a 10 × objective. Changes in cell morphology (transformation into spindle-shaped cells) were quantified from IncuCyte images by using ImageJ program. Each experimental group, consisted of four parallel samples (wells) and four images (each with an area of 2.3 mm2) were recorded from each well with IncuCyte. ImageJ settings were automatically configured in such a way that only the smaller, spindle-shaped cells on top of MSCs were counted. The number of spindle-shaped cells was determined as an average of those four images per well from a total of four parallel wells.
IncuCyte® Angiogenesis Analysis Software Module (Cat. No. 9600-0011) was used to demonstrate the functionality of the proposed MACs. A ninety-six-well plate was coated with fibronectin (1 μg/mL, 356008; Corning), and GFP-HUVECs (1,000 cells/well) were allowed to adhere overnight. The next day, isolated CD14+CD31+ MACs (2,000 cells/well) were added to the wells. HUVECs cultured alone were used as control. Cells were cultured in EGM up to 14 days, and images were taken every 6 h with a 4 × objective on IncuCyte. The images were used to analyze the number of networks and network branch points, as well as the network length per mm2.
Three-dimensional tube formation assay
Fibrin Gel In Vitro Angiogenesis Assay Kit (ECM630; Sigma Aldrich) was used to further evaluate the capacity of MACs to support the three-dimensional (3D) tube formation by HUVECs. A mixture of fibrinogen solution (30 μL/well) and thrombin solution (20 μL/well) was dispensed to the 96-well plate, and the plate was placed at 37°C for 15–60 min to polymerize. GFP-HUVECs (5,000 cells/well) were added to the plate and allowed to adhere overnight. CD14+CD31+ MACs (5,000 cells/well) were added to the wells and allowed to adhere for 2 h before adding a mixture of fibrinogen and thrombin solution (50 μL/well). Cells were cultured in EGM for 4 to 7 days, and HUVECs cultured alone were used as control. Light microscopy was used to follow the formation of tube-like structures.
VEGF enzyme-linked immunosorbent assay
To assess the presence and levels of VEGF in cell cultures, a solid-phase sandwich enzyme-linked immunosorbent assay (ELISA, human VEGF ELISA kit, KHG0111; Invitrogen, Thermo Fisher Scientific) was used. The assay was performed according to the manufacturer's instructions on mediums collected from cell cultures on days 3, 7, 11, and 14 of culture and stored at −80°C until analysis. Absorbance was measured with an ELISA plate reader at 450 nm, and VEGF concentration in the samples was quantified based on the assay standard curve. Basal culture medium (α-MEM for MSC-MNC co-cultures and EGM for MAC-HUVEC co-cultures) was included as a background control. Normalization to cell numbers was done by dividing VEGF concentration by total cell number in the same culture for each time point, and the result was presented as VEGF (pg/mL) per 1,000 cells.
Statistical analysis
Statistical analyses were conducted by using GraphPad Prism 8 software. The statistical significance of the differences between the groups was assessed by using unpaired t-test or one-way-analysis of variance followed by Bonferroni multiple-comparison test. All the experiments were repeated three times and to reduce experiment-to-experiment variations from qPCR measurements, data from each experiment were normalized by dividing all values from each experiment with the highest value of that experiment. Data are presented as mean ± SD. Statistically significant differences are referred to as *P ≤ 0.05, **P ≤ 0.01, ***P ≤ 0.001, and ****P ≤ 0.0001.
Results
Spindle-shaped EC-like cells are formed in the co-cultures of MSCs and MNCs
When MNCs were cultured alone, the cells had a rounded, monocyte-like morphology (Fig. 1A) but the formation of spindle-shaped cells was observed in the MSC-MNC co-cultures (Fig. 1B). Quantification confirmed that the number of the spindle-shaped cells was significantly increased in the co-culture on both days 7 and 14 (Fig. 1C). This observation led us to characterize the cells in more detail for CD31 and VEGFR1 expression by immunohistochemistry. In the analysis, MNCs were identified as the cells having a smaller and brighter nucleus (see eg, Fig. 1D, H) than MSCs, which have a larger and less densely stained nucleus (see eg, Fig. 1E, I). The MNCs were shown to be positive for CD31 and VEGFR1, both alone (Fig. 1D, H) and in co-cultures with MSCs (Fig. 1F, J), whereas MSCs did not express these markers, neither alone (Fig. 1E, I) nor in co-cultures (Fig. 1F, J). This observation is in line with qPCR results, which confirmed that cd31 was significantly more expressed in MNCs compared with MSCs (Fig. 1L).

Real-time cell imaging system (IncuCyte) was used to observe morphological changes of the cells, and images of MNCs and MSC-MNC co-cultures on day 7 are presented
Upregulation of cd31 (Fig. 2A), vegfr1 (Fig. 2B), and vegfr2 (Fig. 2C) markers was further demonstrated by qPCR in the MSC-MNC co-cultures compared with plain MSCs, indicating EC-like cell differentiation potential of co-cultures. There was no difference in the mRNA expression of vegf on day 7 but its expression was slightly downregulated in the co-culture on day 14 (Fig. 2D). The observations on cell morphology and CD31 expression were confirmed by flow cytometry analyses, where forward and side scatter plots demonstrated MNCs undergoing a significant change toward the spindle-shaped morphology in co-cultures with MSCs (Fig. 2E–G). CD14+CD45+ gated cells clearly proved this phenotypical change, as increased cell size and granularity was observed over time in the presence of MSCs (Fig. 2H–J). The flow cytometry analysis was in agreement with immunocytochemistry and qPCR results, as it showed a two- to three-fold increase in CD31 expression by CD14+CD45+ spindle-shaped cells in co-cultures over time (Fig. 2K).
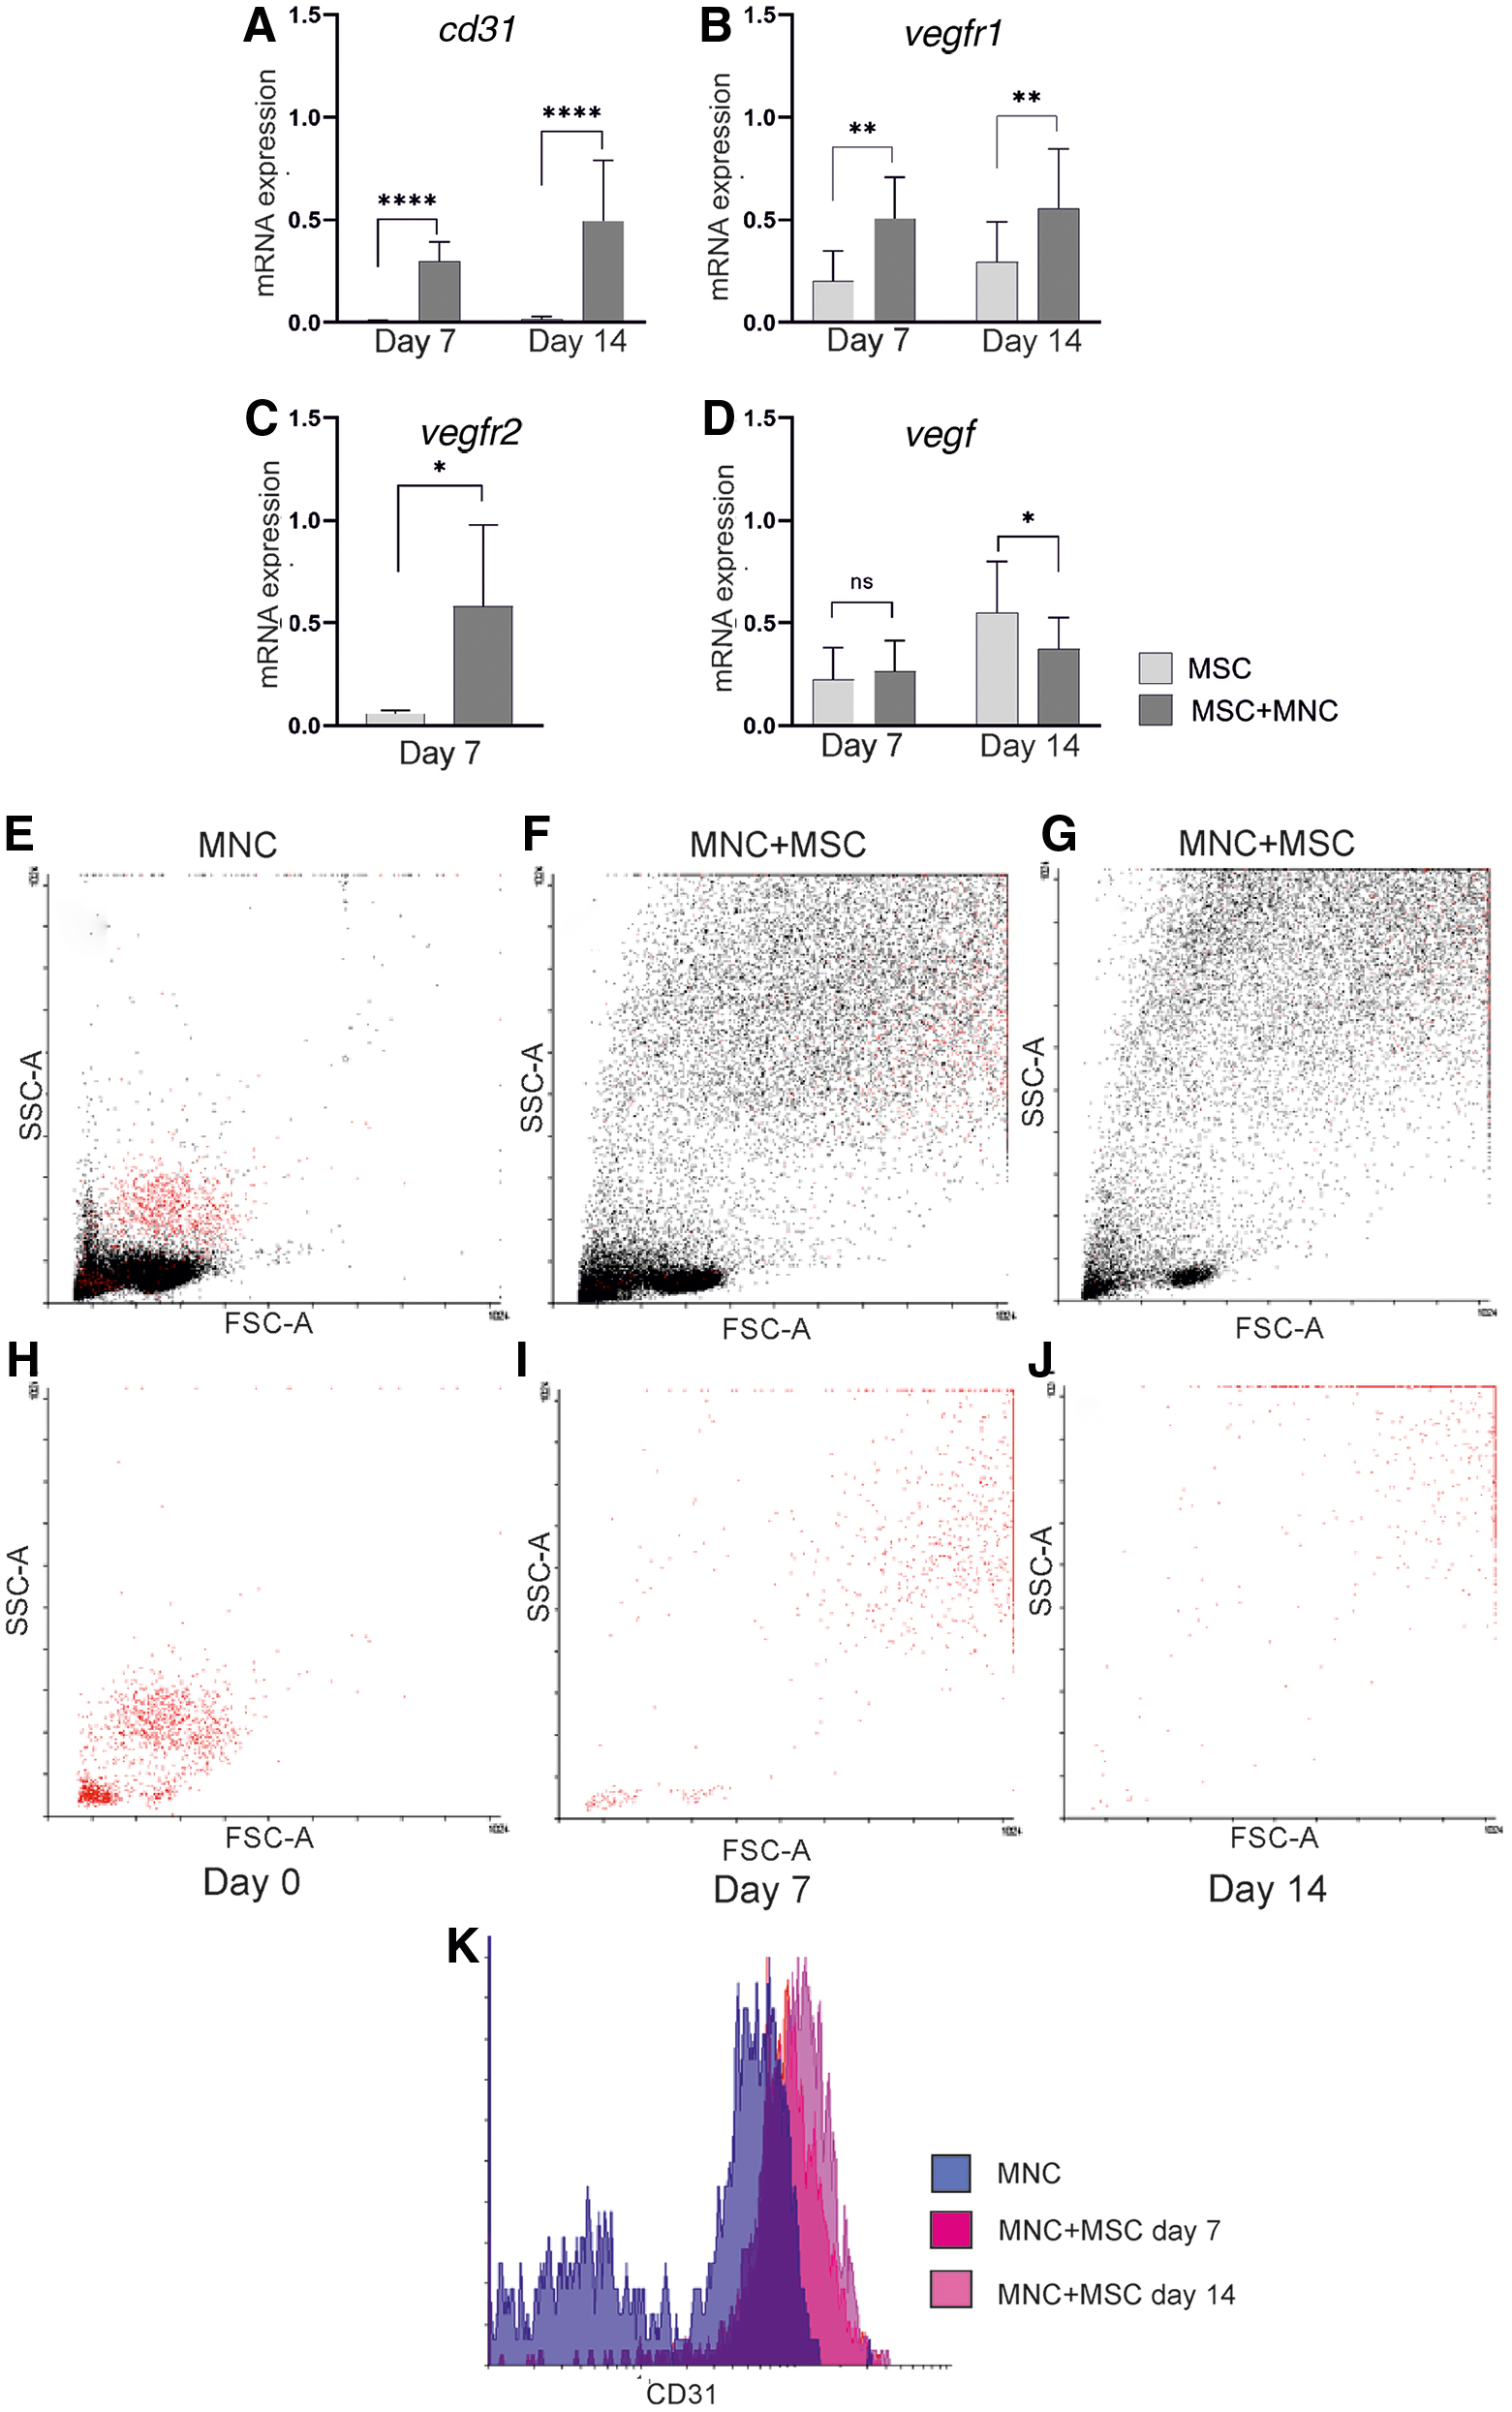
Quantitative PCR and flow cytometry analysis of EC-like, spindle-shaped cells of MNC origin in the co-cultures. The expression of cd31
CD14+ cells have the highest EC-like spindle-shaped cell differentiation potential
The success of cell sorting for CD14 and CD34 markers was confirmed by flow cytometry analysis (Supplementary Fig. S1). For the CD14+ sorted fraction, a 230-fold increase in CD14 MFI was observed (Supplementary Fig. S1A, E). The CD14+ fraction was shown to contain cells with a significant expression of CD34 (Supplementary Fig. S1B), but it was only minimally detected in the CD14− fraction (Supplementary Fig. S1F). For the CD34+ sorted fraction, a seven-fold increase in CD34 MFI was observed (Supplementary Fig. S1C, G). Distinct cell populations with regard to CD14 expression were observed in both CD34+ and CD34− fractions (Supplementary Fig. S1D–H). There were 3% CD34+ cells in the CD14+ sorted fraction and 61% of CD14+ cells in the CD34+ sorted fraction.
Similar to MNCs (Fig. 3A), CD14+ cells sorted with magnetic beads (Fig. 3B) were shown to differentiate into spindle-shaped cells when cultured together with MSCs, whereas CD14− cells did not (Fig. 3C). The number of spindle-shaped cells was higher in the co-culture of MSC-CD14+ compared with MSC-MNC on days 7 and 14 (Fig. 3F), whereas the co-cultures of MSCs with CD14− cells did not induce spindle-shaped cell differentiation (Fig. 3C, F). Co-cultures of either CD34− or CD34+ cells with MSCs induced the formation of spindle-shaped cells (Fig. 3D, E), with the differentiation being more efficient among CD34+ cells (Fig. 3G).
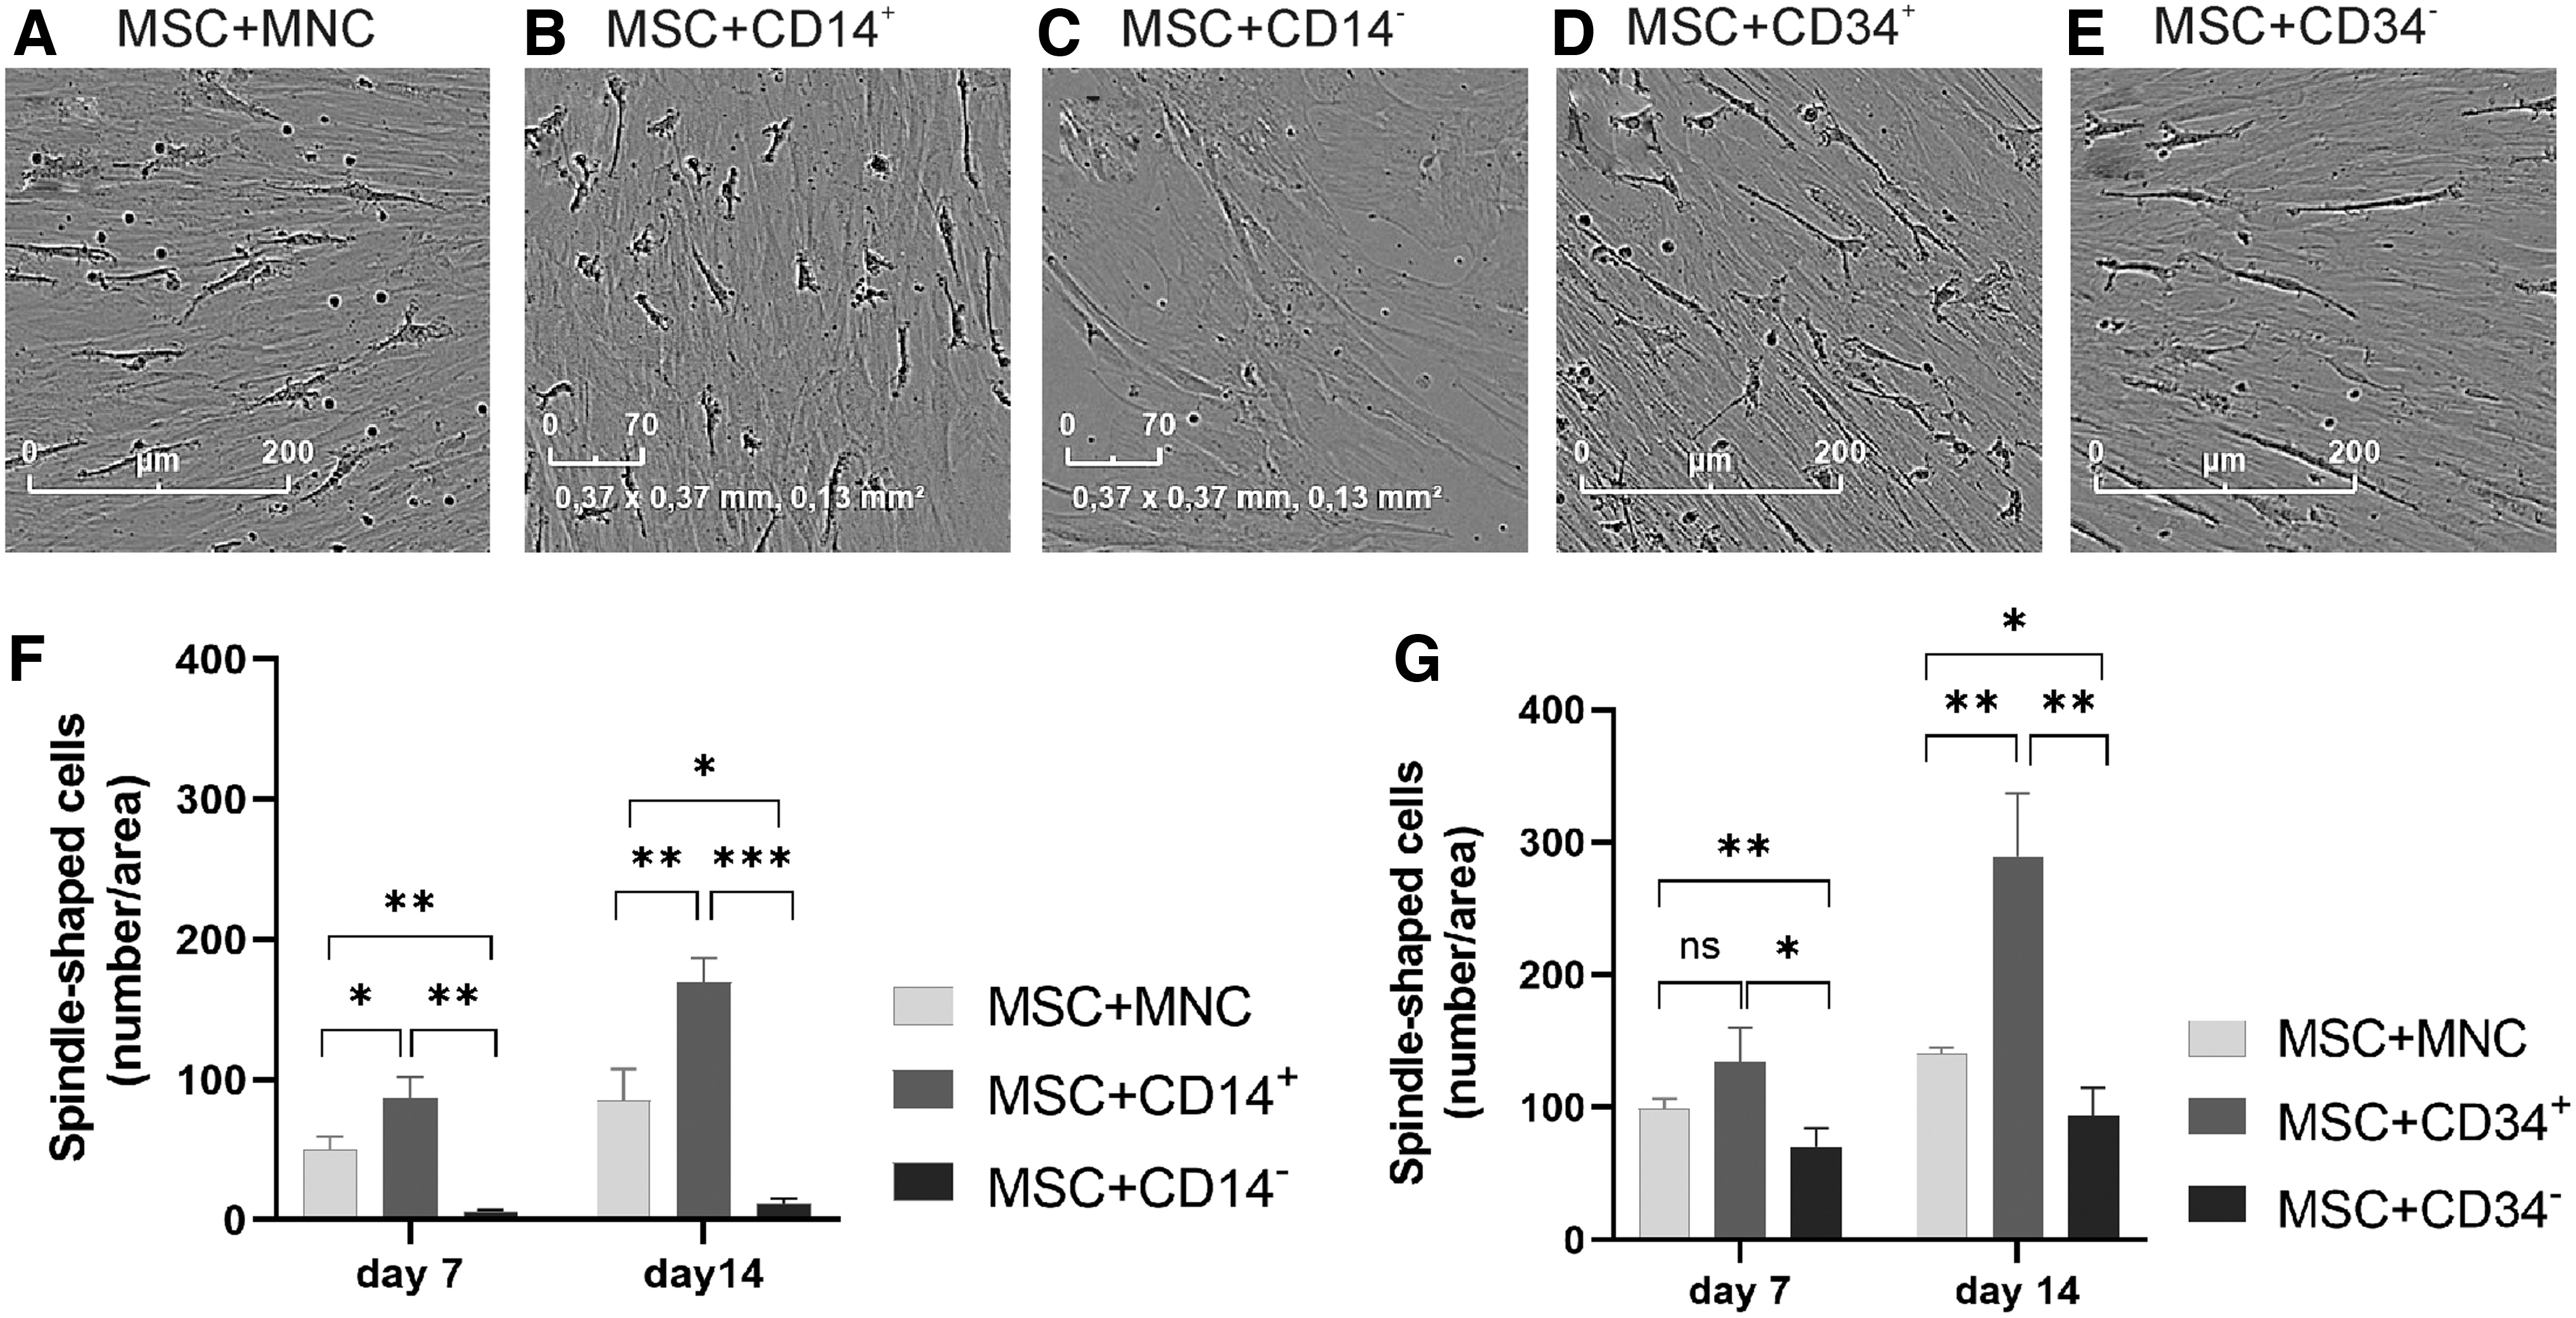
IncuCyte imaging was used to observe the formation of spindle-shaped cells in the different MNC fractions when co-cultured with MSCs on day 14
To further elucidate the phenotype of spindle-shaped cells, immunocytochemistry was performed and the results showed that there were a few CD31-expressing cells within the CD14+ (Fig. 4A), CD34+ (Fig. 4C), and CD34− (Fig. 4D) cells in the co-cultures with MSCs, whereas no staining was demonstrated in CD14− cells (Fig. 4B). Quantitative polymerase chain reaction (PCR) results confirmed that the expression level of cd31 was higher in the co-culture with CD14+ compared with CD14− on days 7 and 14 (Fig. 4K). cd31 was slightly more highly expressed in the co-culture with CD34− cells when compared with MNCs, but there was no significant difference between CD34+ and CD34− cells (Fig. 4M). VEGFR1-expressing cells were observed within all the different fractions (Fig. 4F–I), but the qPCR results showed that the expression was higher in the co-culture with CD14− cells when compared with the whole MNC fraction on day 7; however, no significant differences were observed on day 14 (Fig. 4L). vegfr1 expression was upregulated in the co-culture with both CD34+ and CD34− cells on day 7 and the expression was slightly higher with the CD34+ cell population, even though this difference did not reach statistical significance (Fig. 4N).

Expression of EC markers CD31
EC-like cells in MSC-MNC co-cultures are nonproliferative
The proliferative capacity of MNCs, MSCs, and MNC-MSC co-cultures was tested with an Alamar blue assay. The MNCs alone showed no proliferative capacity, which was indicated by background level of fluorescence counts (data not shown). The MSCs proliferated up to 16 days and the level of proliferation in MSC-MNC co-cultures was similar to MSCs alone (Supplementary Fig. S2), indicating that the EC-like cells in MSC-MNC co-cultures did not possess significant proliferative capacity.
EC-like cells formed in MSC-MNC co-cultures are MACs
As the EC-like cells formed in co-cultures were spindle-shaped, nonproliferative and of CD14+ origin, we further characterized them by isolating CD14+CD31+ double-positive cells from MSC-MNC co-cultures by using magnetic-activated cell sorting. The cells were further characterized by using flow cytometry, and the results showed that CD31 expression was observed on both CD14+CD34− (Fig. 5A) and CD45+CD34− (Fig. 5B) gated cells with similar histograms (Fig. 5C). More than 90% of the isolated cells were CD14+ and CD31+, demonstrating the success of cell sorting (Fig. 5D). Approximately 90% of these CD14 and CD31 double-positive cells were also CD45+ and CD34− (Fig. 5E), thus confirming their MAC-phenotype. The MACs have been reported to be negative for CD146 [7] but in our MSC-MNC co-culture setup, 45% of the cells isolated as CD14+CD31+ were CD146− and 55% of the cells were CD146+ (Fig. 5F), indicating that part of these cells could also represent pericyte-like cells.
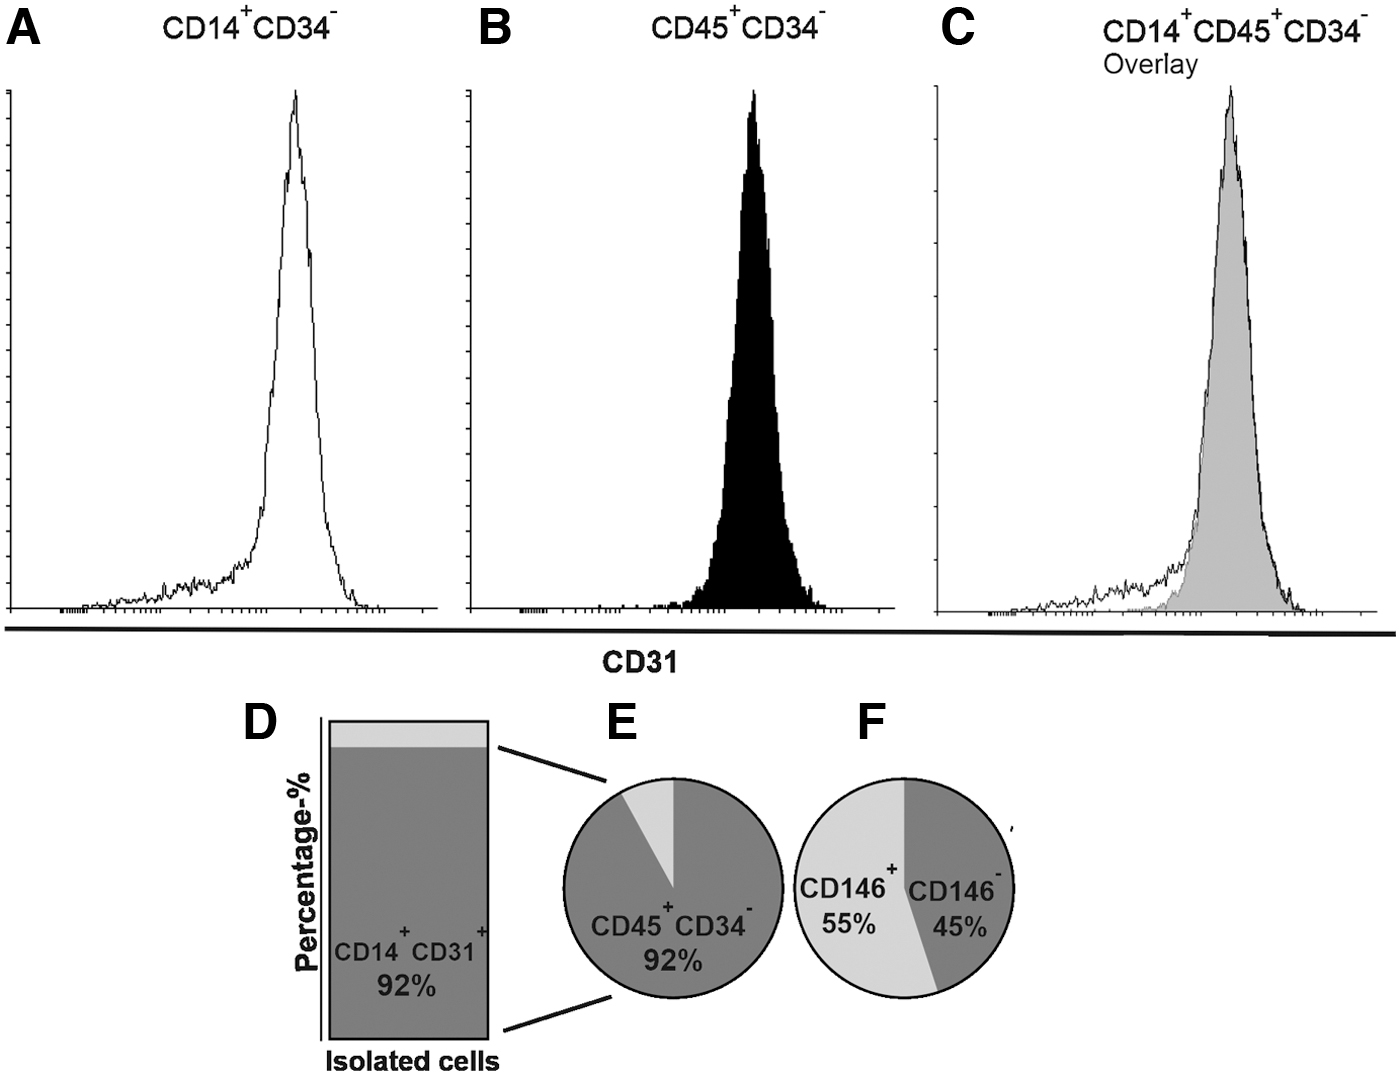
Flow cytometry was used to confirm the success of cell sorting and to characterize the cells isolated from co-cultures cells as MACs. CD31 expression was observed on both CD14+CD34−
MACs formed in MSC-MNC co-cultures support angiogenesis in vitro
To demonstrate the functionality of MACs, 3D tube formation assay and IncuCyte angiogenesis analysis were performed. The HUVECs cultured alone formed tube-like structures (Fig. 6A) in the 3D tube formation assay, but when co-cultured with MACs, more loops and branching points were observed (Fig. 6B). This observation was supported by data from the IncuCyte angiogenesis analysis, where more tube-like structures were observed in co-cultures of HUVECs with MACs (Fig. 6D, F) compared with HUVECs alone (Fig. 6C, E). Quantification confirmed this observation as increased number of branching points (Fig. 6G) and networks (Fig. 6H), as well as longer networks (Fig. 6I) were present in co-cultures compared with plain HUVECs.
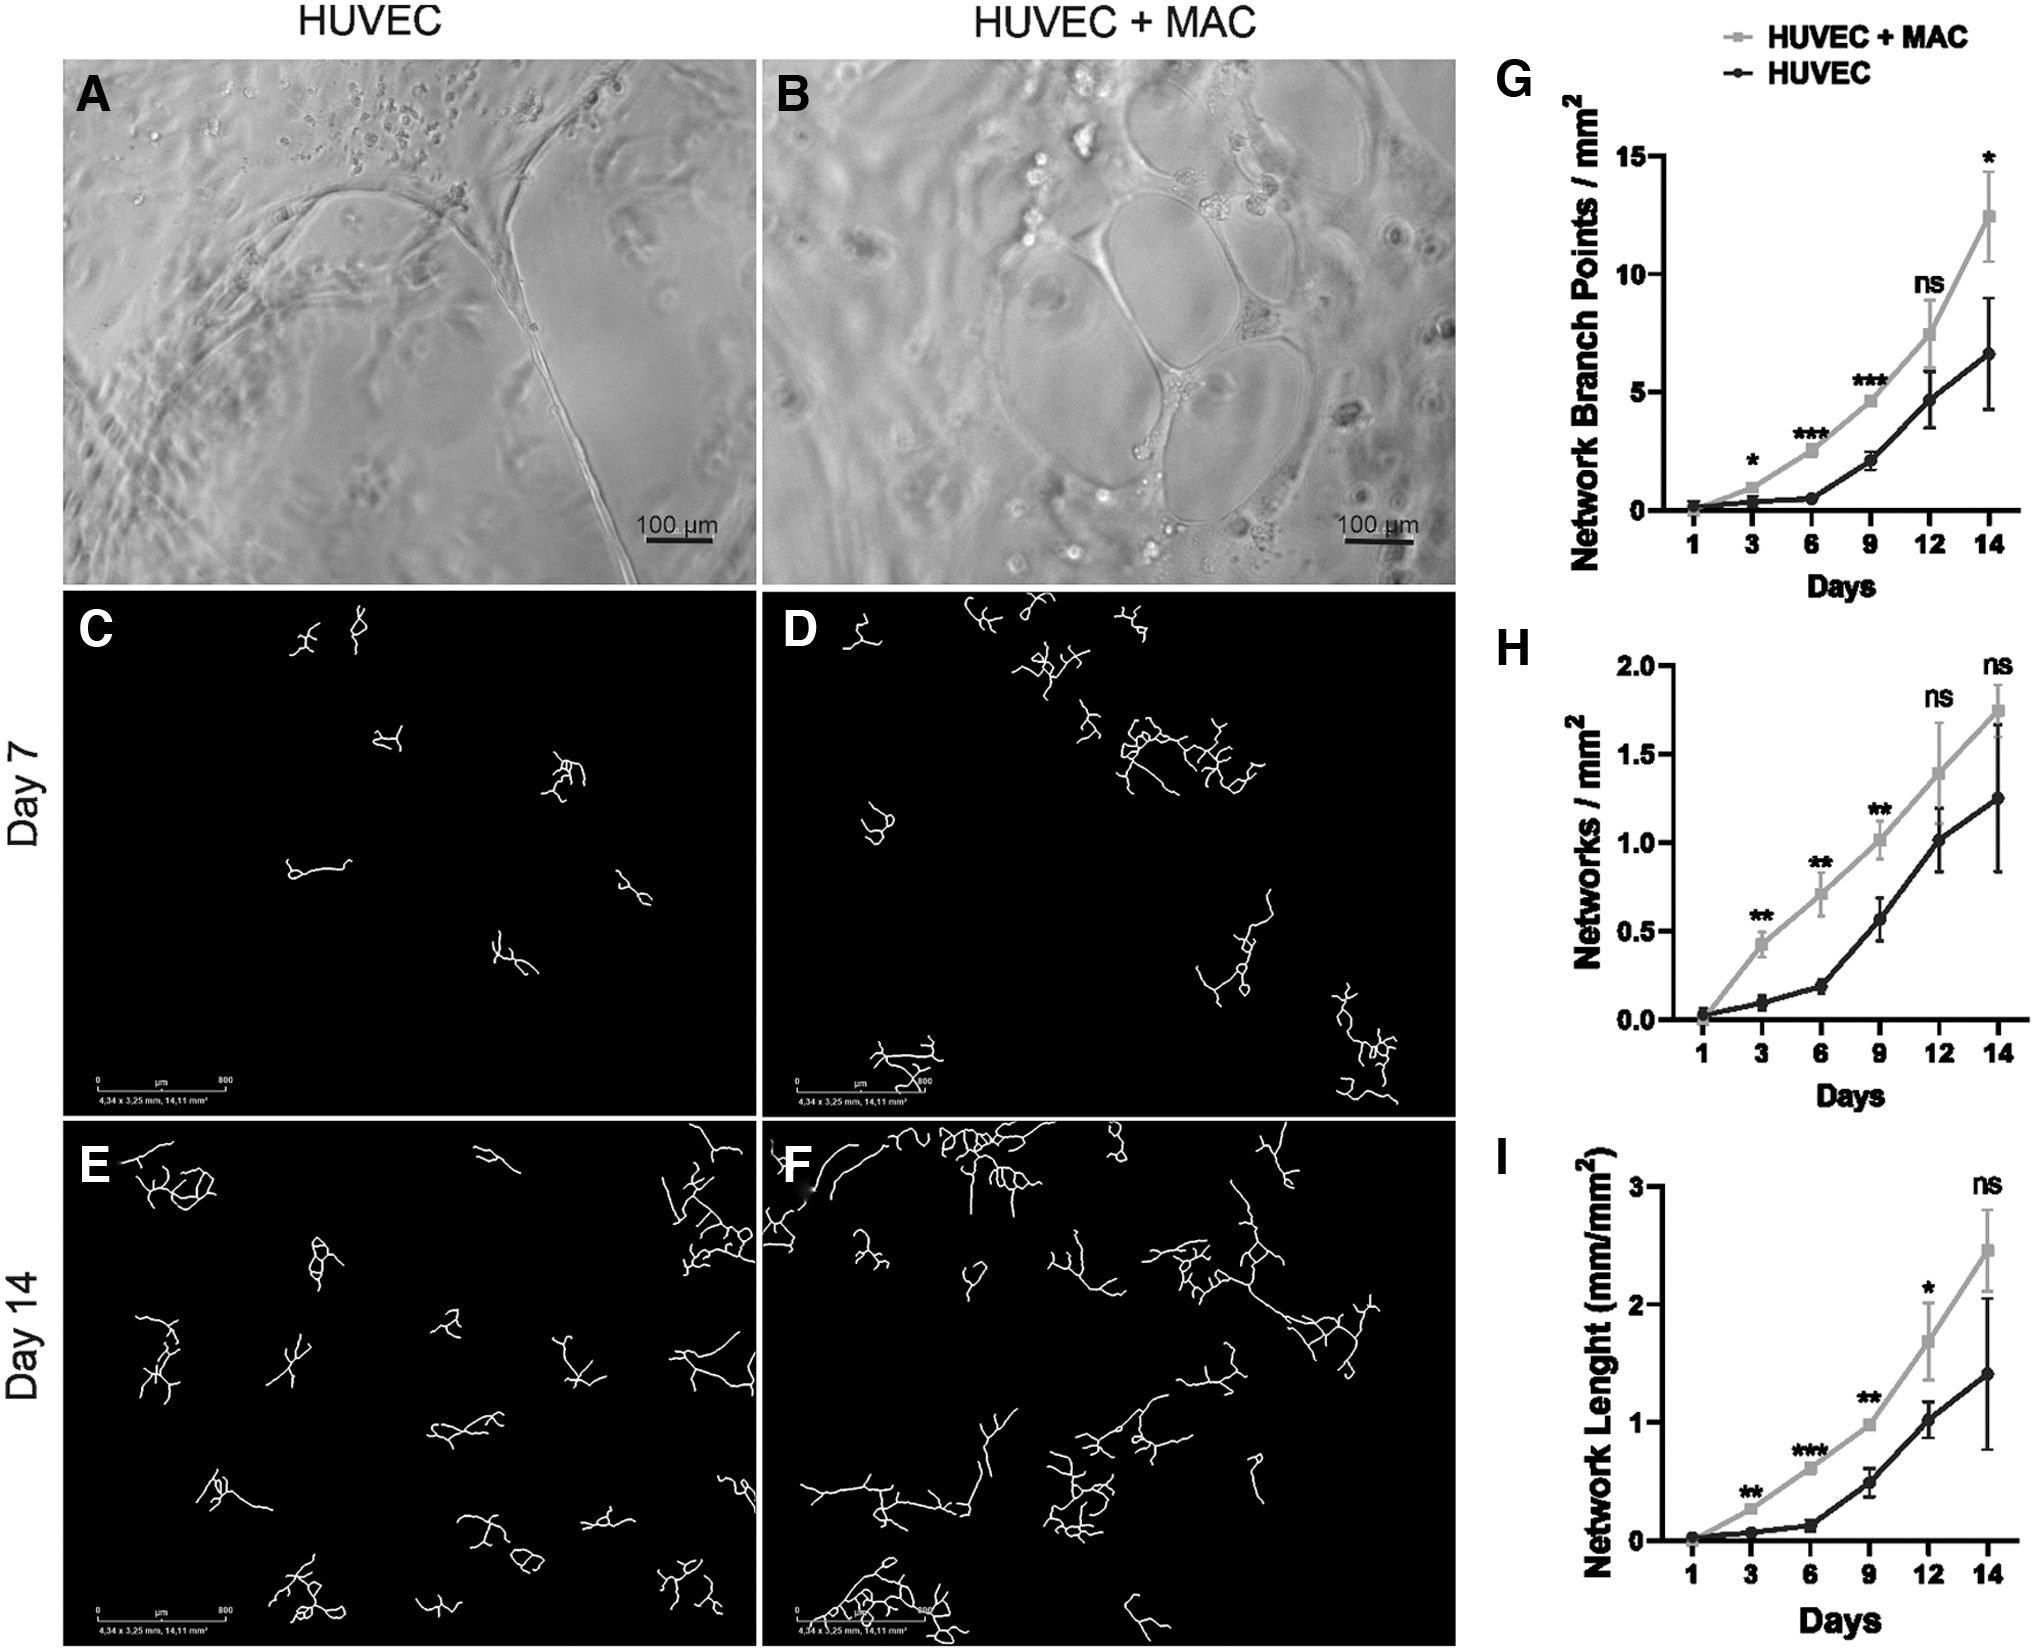
The capacity of MACs to induce angiogenesis was evaluated by three-dimensional tube formation assay and IncuCyte angiogenesis analysis. Representative light microscopic images of tube formation assay on day 4 of culture show tube-like structures in HUVECs cultured alone
VEGF is endogenously secreted by MSCs and its secretion is upregulated in co-cultures
To study the secreted VEGF in cultures, we performed ELISA of the mediums collected from MNCs, MSCs, and their co-cultures, as well as from HUVEC-MAC co-cultures. No VEGF was detected in basal α-MEM or EGM (blank controls), in medium collected from MNCs alone, or in medium collected from HUVEC-MAC co-cultures, as all these samples were below the analytical sensitivity of the assay (<5 pg/mL) (data not shown). However, MSCs produced VEGF with an increasing concentration over time in culture (Fig. 7A). Interestingly, secreted VEGF was also detected in MSC-MNC co-cultures and the concentrations on days 3, 7, and 11 of culture were significantly higher than in cultures with MSCs alone (Fig. 7A). As MNCs alone did not secrete VEGF, this indicates that either MNCs stimulate MSCs to secrete more VEGF or that the MACs differentiated in co-cultures are the other VEGF source. However, when secreted VEGF was normalized to total cell numbers, lower levels of VEGF per cell were observed in MSC-MNC co-cultures compared with MSC monocultures, especially on days 3–11 (Fig. 7B). As total cell number is higher in co-cultures than in monocultures, and as neither MNCs nor MACs secreted VEGF, the results implicate that MSCs are the main VEGF source.
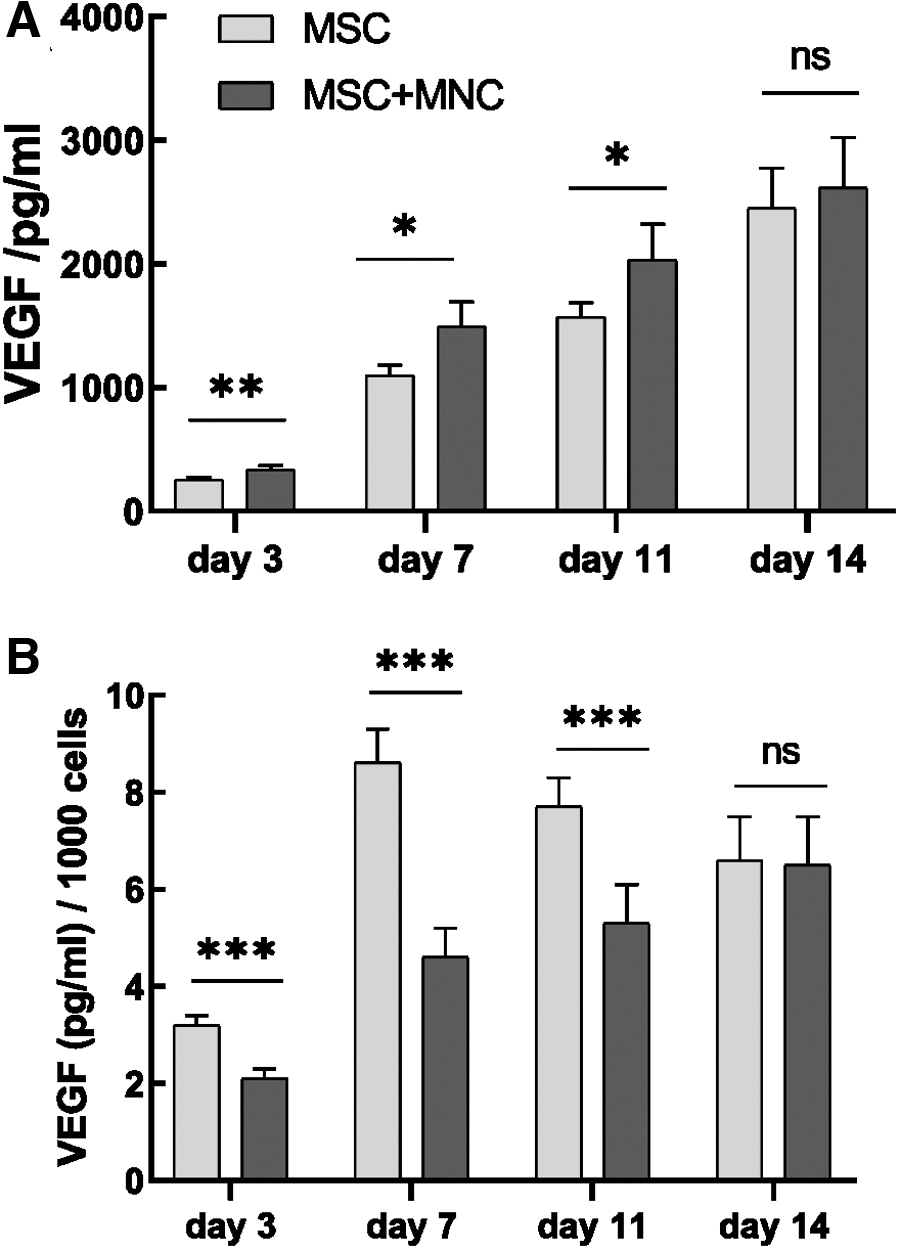
VEGF secretion in medium collected from MSCs and MSC-MNC co-cultures was analyzed on days 3, 7, 11, and 14 and is presented as an absolute VEGF concentration (pg/mL)
Both MSC and MNC populations contain pericyte-like cells with different marker profiles
As we had previously observed α-SMA-expressing cells in our co-cultures [23], here we also studied the pericyte phenotype of co-cultured cells. The expression of α-SMA, PDGFRβ, and NG2 was studied by immunocytochemical staining and qPCR, and the expression of CD146 and NG2 markers was studied by flow cytometry. The presence of α-SMA-expressing cells was observed among MSCs but not MNCs (Fig. 8A–C). The MSCs were shown to express also another pericyte marker, PDGFRβ, both alone (Fig. 8F) and in co-cultures with MNCs (Fig. 8G), whereas staining for PDGFRβ was detected in MNCs only in co-culture (Fig. 8E, G), suggesting that MSCs could direct MNCs into PDGFRβ-expressing cells. Messenger RNA expression levels of α-sma (Fig. 8M) and pdgfrβ (Fig. 8N) were downregulated in the co-culture compared with MSCs alone on day 7, whereas no significant difference was observed on day 14. To our surprise, immunocytochemistry revealed NG2+ cells within both MNCs (Fig. 8I) and MSCs (Fig. 8J) alone as well as in co-culture (Fig. 8K). At mRNA level, ng2 expression was downregulated on day 14 in the co-culture whereas no significant difference was observed on day 7 (Fig. 8O).
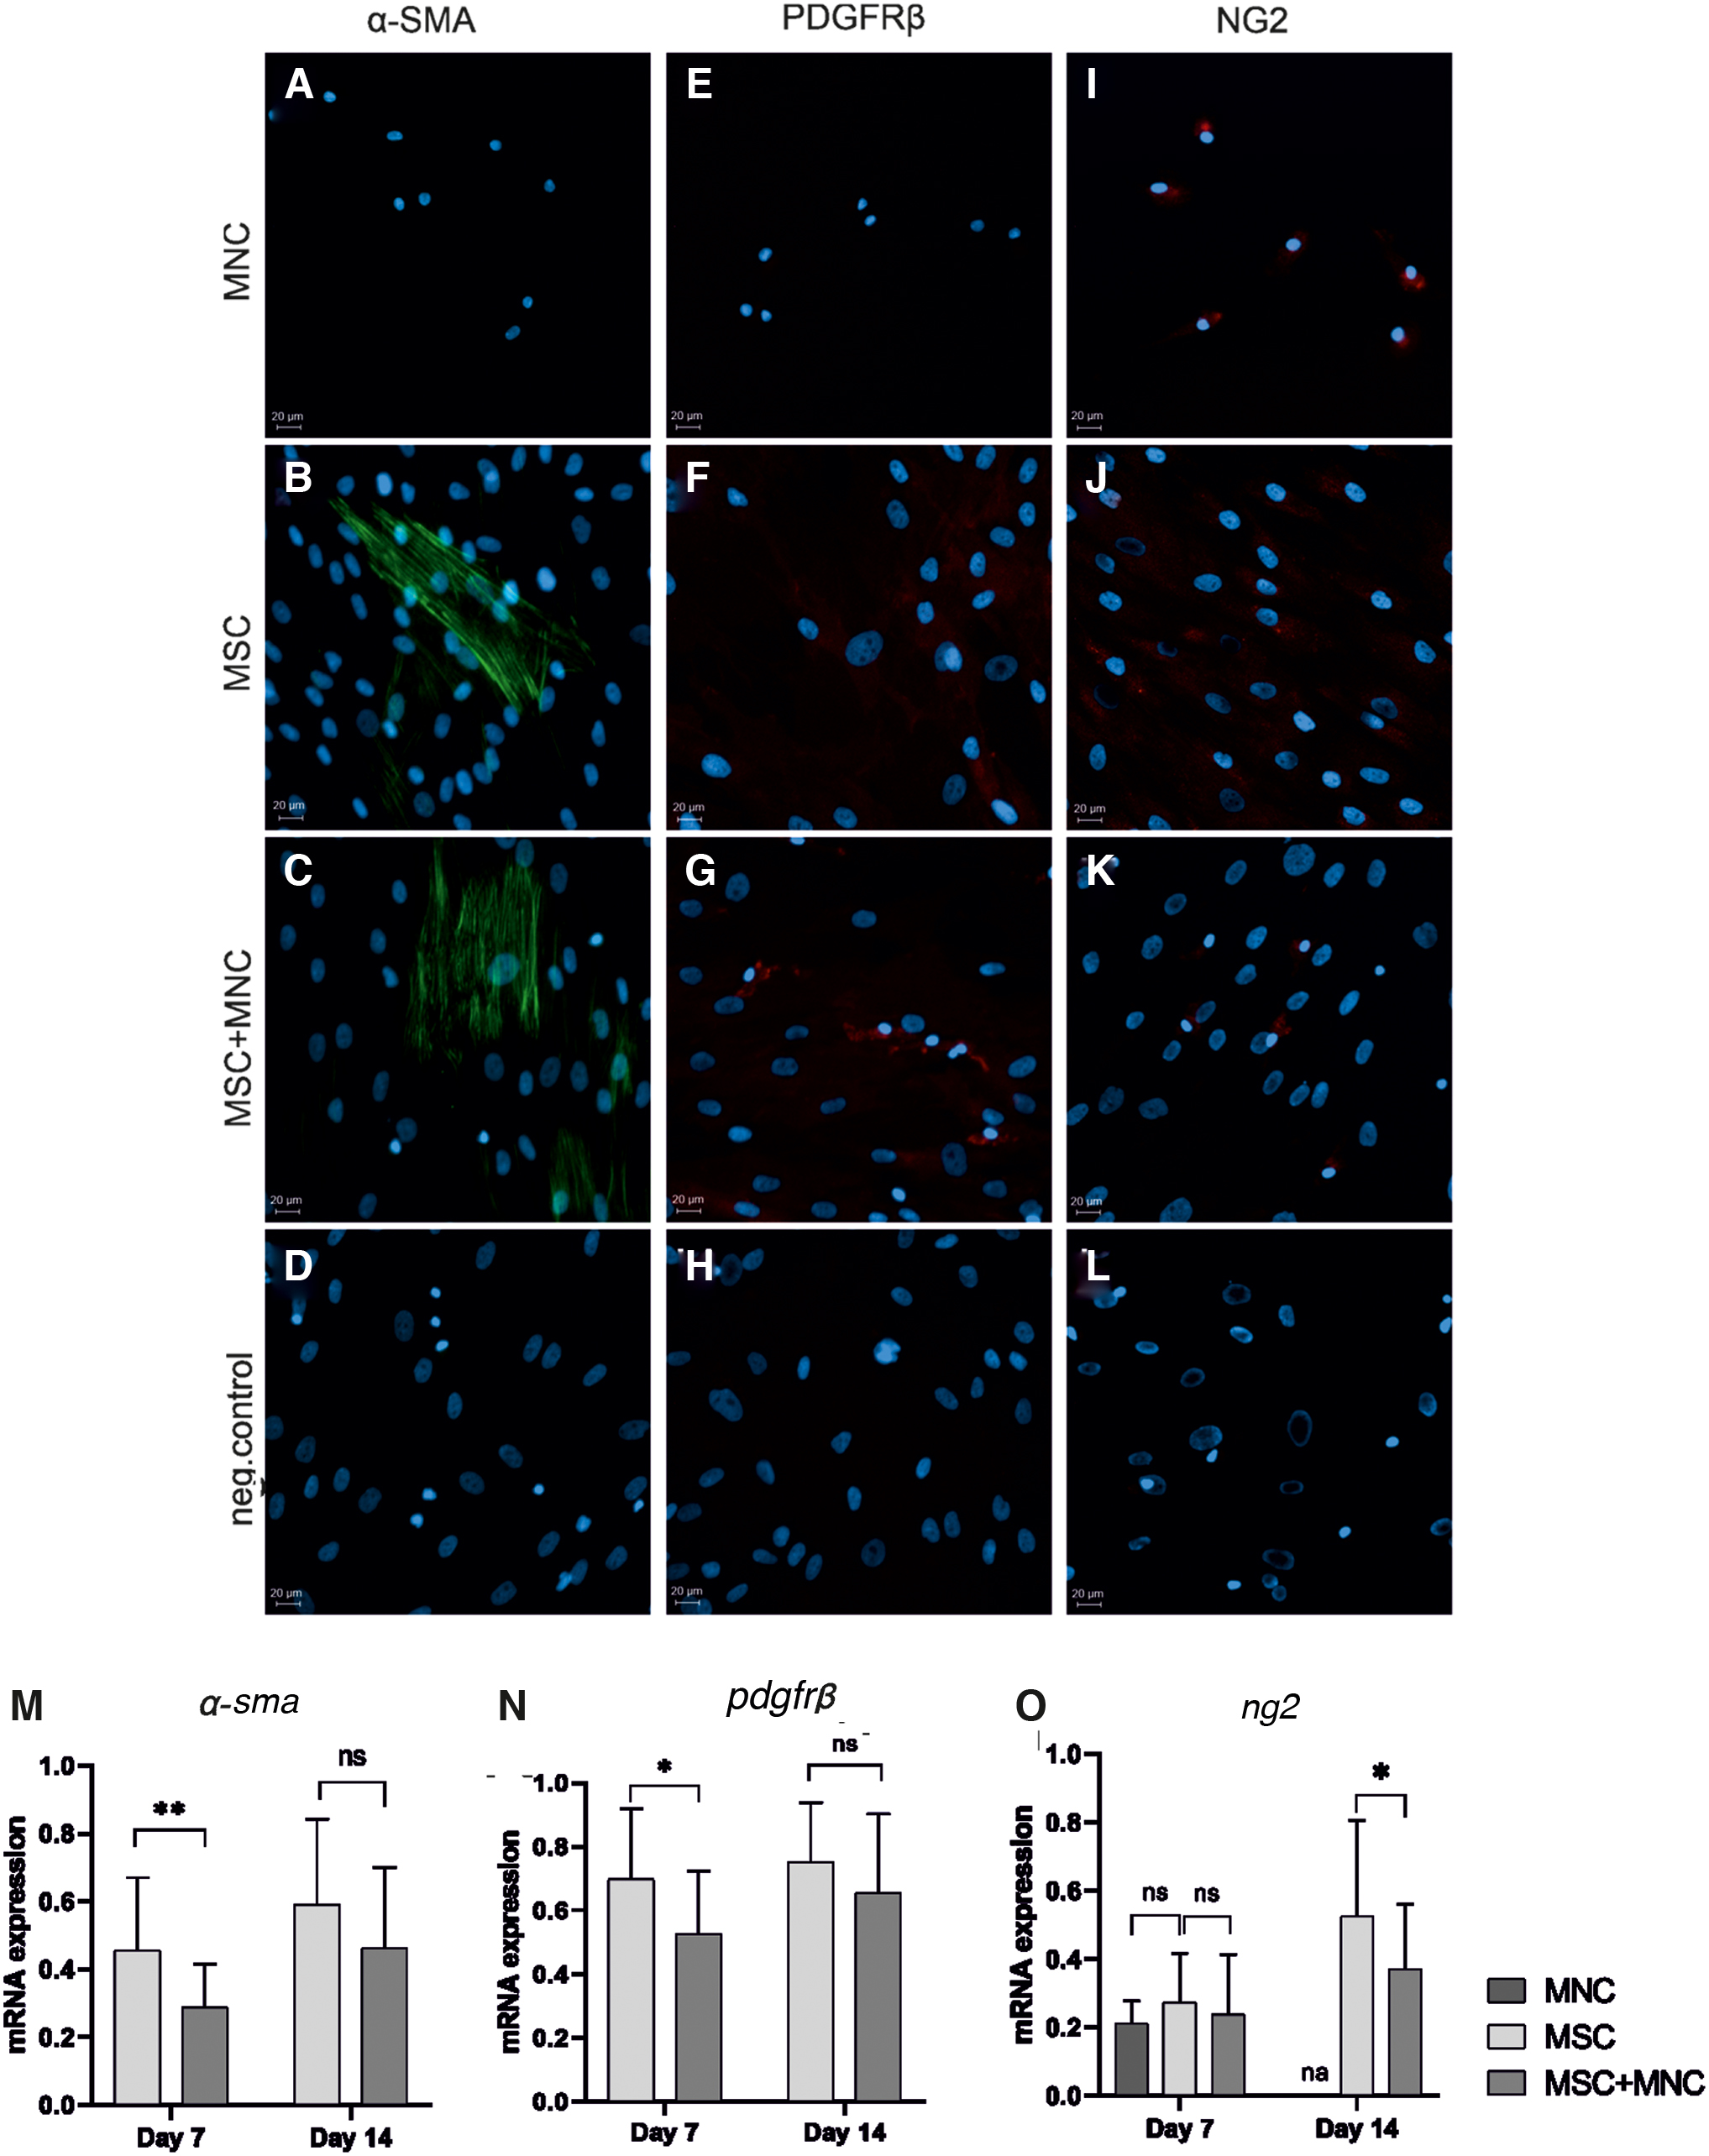
Differentiation of pericyte-like cells was demonstrated by studying the expression of pericyte markers α-SMA
To gain more insight into the quantities and ratios of pericyte-like cells in MNCs and MSCs alone, as well as in co-cultures, flow cytometry was performed on days 0, 7, and 14 of culture and samples were plotted against NG2 and CD146 expression (Fig. 9A). NG2 expression increased over time in MNCs, especially in CD14+CD45+ cells. However, when co-cultured with MSCs, the median surface expression was three-fold higher compared with pure MNC culture (Fig. 9A, blue dots on scatter plot). This indicates that the NG2-expressing cells of MNC origin were of monocyte/macrophage lineage and that MSCs promoted this NG2+ phenotype in MNCs. Interestingly, MNCs also gained CD146 expression over time in co-culture whereas the expression of CD146 and NG2 in MSCs was not affected by the presence of MNCs (Fig. 9A).
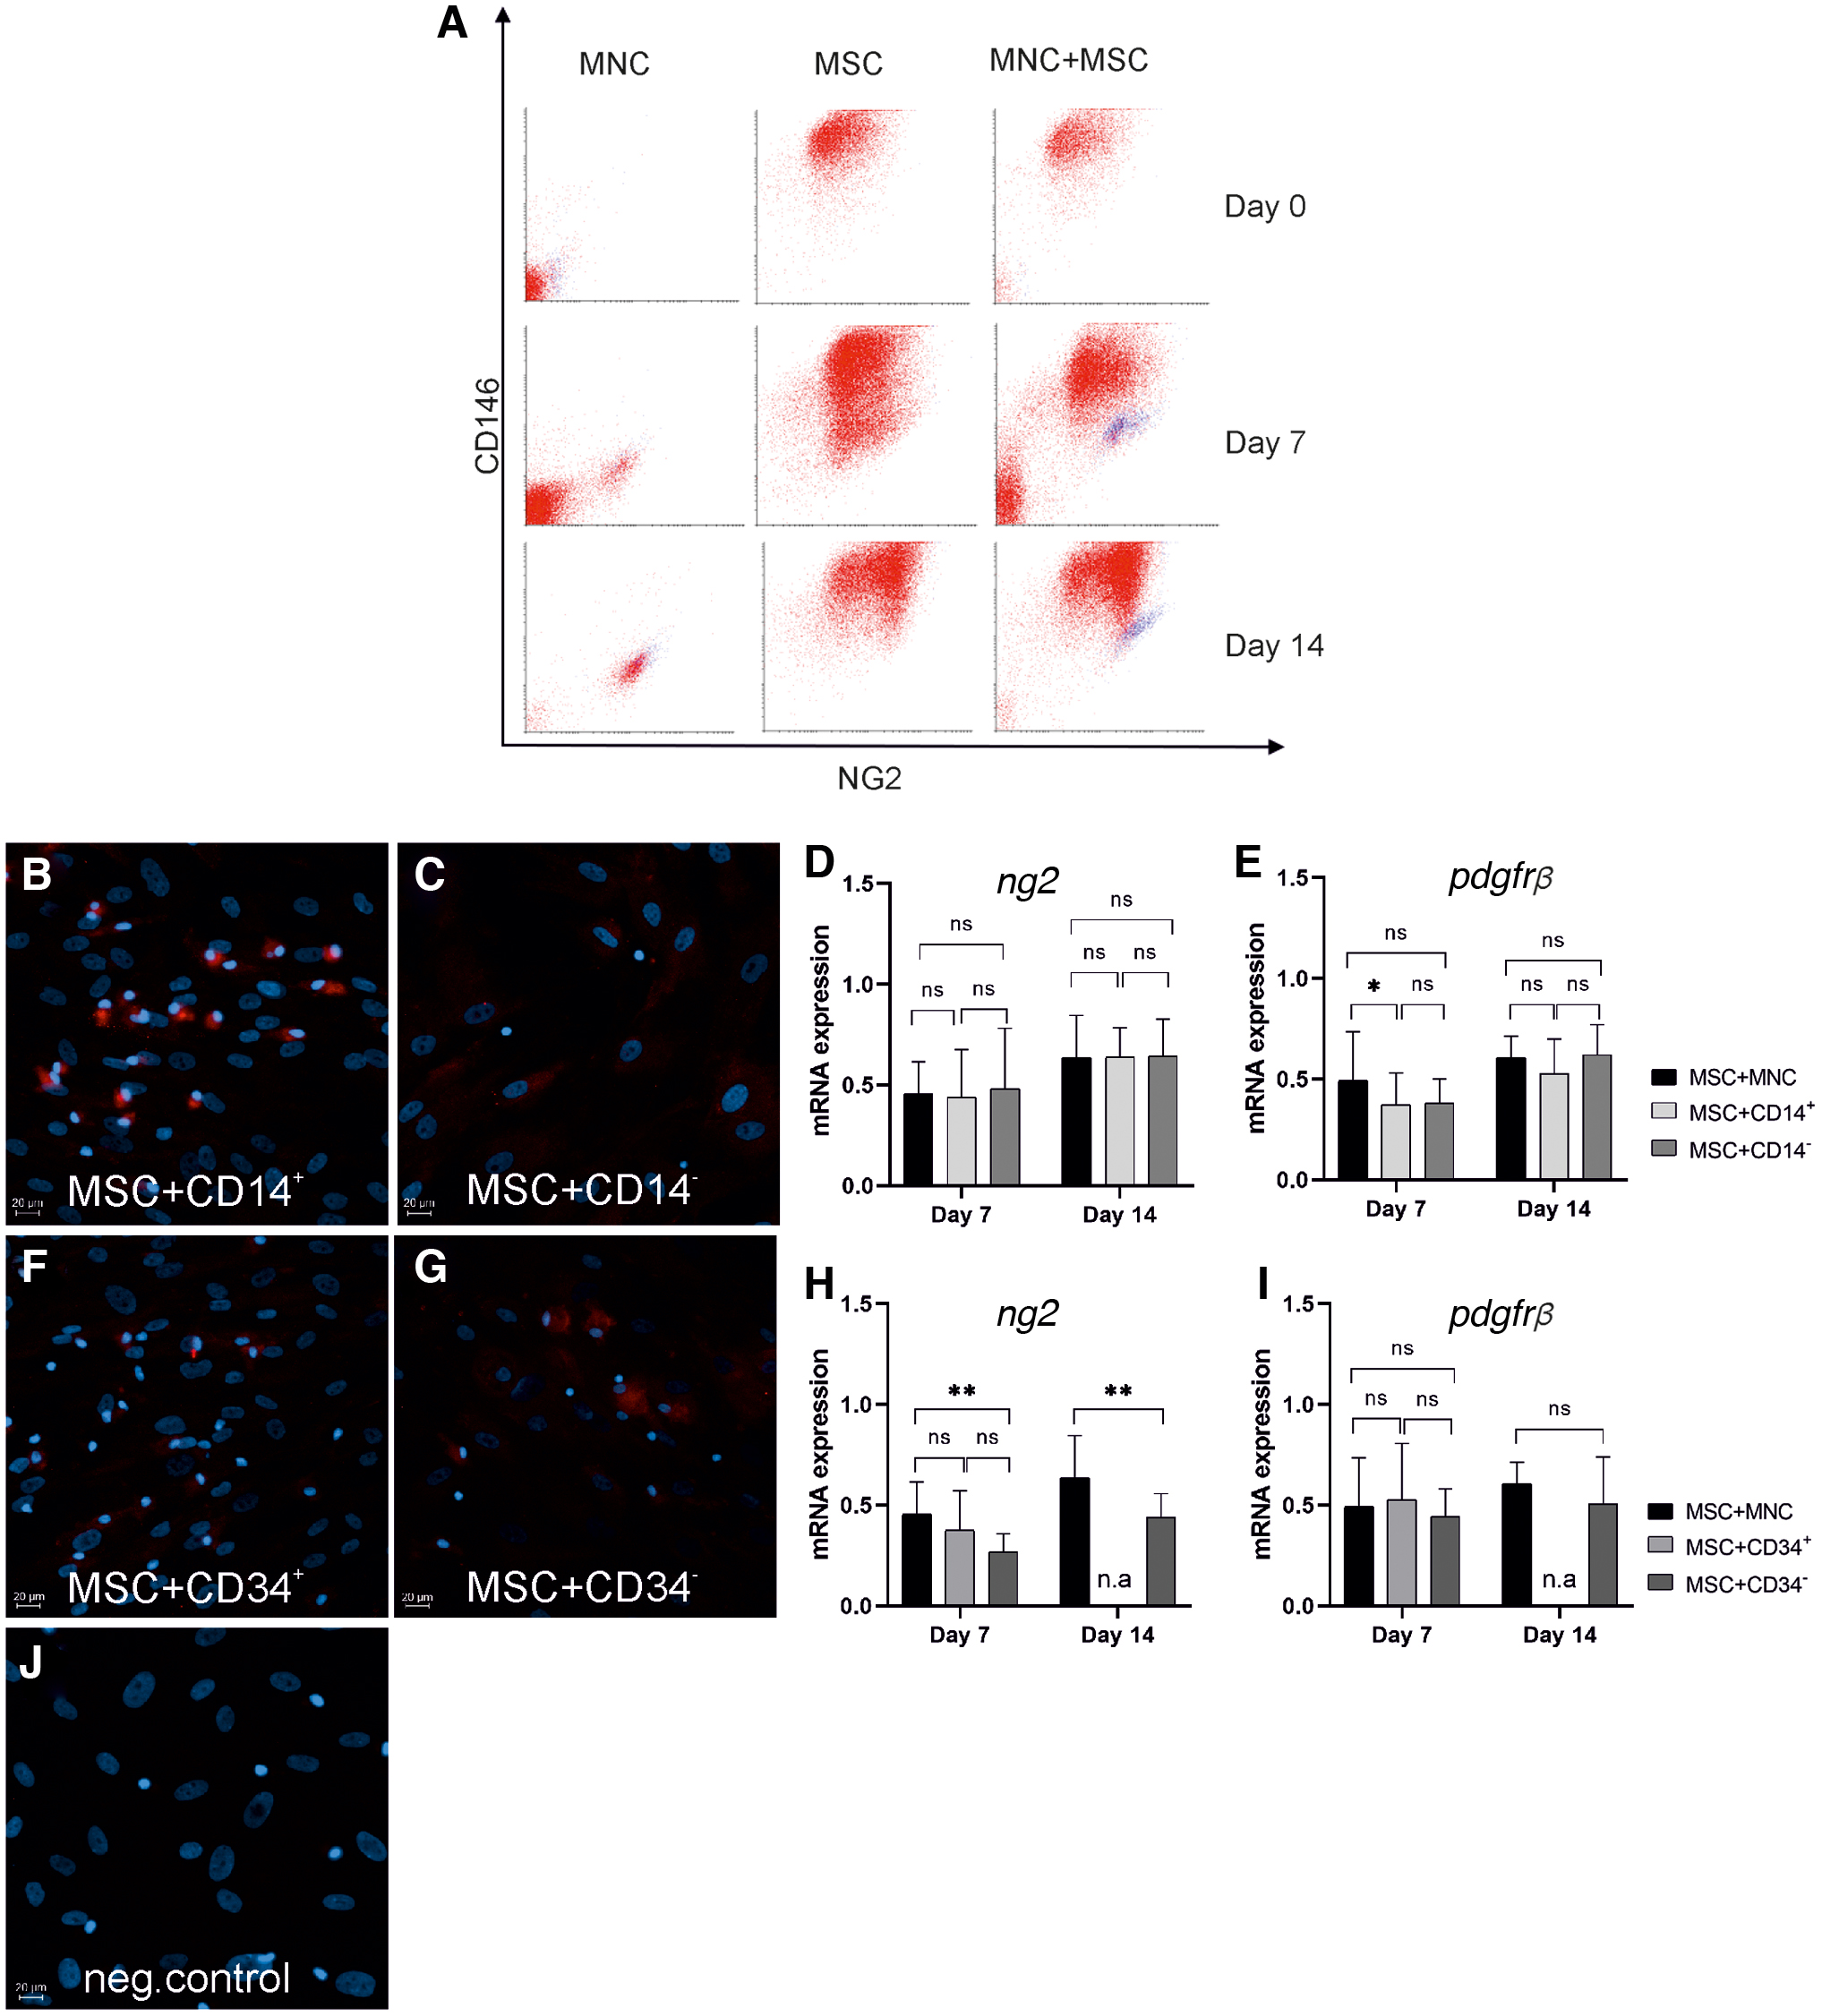
Flow cytometry analysis of CD146 and NG2 expression in MNCs, MSCs, and MNC-MSC co-cultures on days 0, 7, and 14 of culture is presented in bivariate analysis
NG2 was clearly expressed in cells of MNC origin when the co-cultures were performed with CD14+ (Fig. 9B) sorted cells, whereas no NG2+ cells were observed within the CD14− cells (Fig. 9C). NG2+ cells were present but to a smaller extent within the CD34+ (Fig. 9F) and CD34− cells (Fig. 9G). As our flow cytometry analysis showed that cells selected based on CD34 expression also possessed high CD14 expression (Supplementary Fig. S1D, G), it is likely that the NG2+ cells within the CD34 sorted cells are the same cells as those in the CD14 sorted fraction. However, even though immunocytochemistry demonstrated differences between CD14+ and CD14− cells with respect to NG2 expression, no differences were observed in the mRNA expression when CD14+ and CD14− were co-cultured with MSCs (Fig. 9D). Expression of pdgfrβ was slightly downregulated in co-cultures with CD14+ when compared with the whole MNC population on day 7 (Fig. 9E). ng2 expression was downregulated in the co-cultures with CD34− cells compared with a co-culture with MNCs (Fig. 9H). The result showed no significant differences in the expression levels of pdgfrβ between the co-cultures with MNCs, CD34−, or CD34+ cells (Fig. 9I). When analyzing the immunocytochemistry results from co-cultures with double-isolated cell fractions, NG2-expressing cells were observed in co-cultures with both CD34−CD14+ (Supplementary Fig. S3A) and CD34−CD14− cells (Supplementary Fig. S3B) whereas the PDGFRβ-expressing MNC-derived cells were present only in the co-cultures with the CD34−CD14+ cell population (Supplementary Fig. S3D) and not with the CD34−CD14− cells (Supplementary Fig. S3E).
Discussion
Co-cultures of EPCs with various mural cells, including MSCs, have been suggested as a critical tool for developing microvessels both in vitro and in vivo [8]. The co-cultured cells could serve as a source of angiocrine factors that, in addition to stabilizing vessel formation, can initiate and support vasculogenic and angiogenic processes. As MNCs contain cells with EC-like differentiation potential, co-cultures of MSCs and MNCs are of interest in this context. We have previously established such a co-culture system and demonstrated angiogenic potential without any exogenously added growth factors [23]. However, the specific cell phenotypes responsible for the observed angiogenic capacity in co-cultures and the potential role of VEGF in this setting remained unknown.
In the current study, PB-derived MNCs in co-cultures with MSCs were shown to differentiate into spindle-shaped cells and to simultaneously upregulate their cd31, vegfr1 and vegfr2 expression. Detailed immunophenotype analysis showed that these cells were derived from CD14+CD45+ myeloid cells, suggesting that they represent MACs, which have been defined as PB-derived MNCs and being positive for CD45, CD14, and CD31 [7]. In addition, the cells lacked proliferative potential, which is another characteristic of MACs [5]. Additional analysis demonstrated that cells isolated from MSC-MNC co-culture using magnetic activated cell sorting were, indeed, positive for CD14, CD31, and CD45, but negative for CD34, which is a classical marker for true circulating EPCs. Importantly, functional in vitro assays demonstrated that these cells stimulated the formation of tube-like structures and networks when co-cultured with HUVECs, confirming that even though they themselves are not capable of vascular assembly, they can stimulate angiogenesis.
VEGF is one of the most important factors related to angiogenesis. It stimulates EC proliferation [27] and formation of capillary-like structures [28]. The MSCs can secrete VEGF and thereby regulate EC sprouting in a paracrine manner [29]. Also in our cultures, MSCs were shown to secrete VEGF and interestingly its absolute levels were higher in MSC-MNC co-cultures. MNCs alone did not secrete VEGF, indicating that MSCs are the source of VEGF in MSC-MNC co-cultures. When VEGF was normalized to cell numbers, the values were lower in co-cultures compared with MSC monocultures: a result most likely caused by the higher total cell numbers in co-cultures versus monocultures. As no additional increase in VEGF per cell was observed, it can be anticipated that MSCs, which were the only proliferating cells in co-culture, would be the main VEGF source. In qPCR analyses, no differences were observed in vegf expression between MSCs and MSC-MNC co-cultures on day 7. It is possible that the upregulation of vegf at mRNA level occurs within the very first days of co-cultures, as significant differences in the levels of secreted protein were observed already on day 3.
As our results showed that MACs support angiogenesis in co-cultures with HUVECs and as VEGF is the key mediator of angiogenesis, we presumed that MACs would also secrete VEGF to regulate HUVEC tube formation in a paracrine manner. To our surprise, no detectable levels of VEGF were found in these co-cultures, indicating that MACs promote angiogenesis via other mechanisms. The MACs have been shown to secrete proangiogenic factors, such as IL-8, monocyte chemotactic protein 1 (MCP-1), and MMP-9 [30], and in particular MAC-derived IL-8 has been shown to be capable of trans-activating VEGFR2 independently of extracellular VEGF [30]. This suggests that IL-8 could be one of the molecular players also in our experimental setup. Stromal-derived factor-1 (SDF-1) is another important factor in endothelial tube formation [31], which has also been shown to enhance angiogenesis in HUVECs [32]. We have previously demonstrated higher expression of SDF-1 in MSC-MNC co-cultures relative to MSCs alone [23], raising an interesting question: whether MACs differentiating in the co-culture might start to produce SDF-1. However, its role, along with other possible angiogenic factors, such as IL-8, remains to be elucidated.
As pericytes are another cell type contributing to blood vessel structure and stability and our previous data had indicated the differentiation of α-SMA+ cells in MSC-MNC co-cultures [23], here we also studied the presence of pericyte-like cells. Identification of pericytes is challenging, since none of the proposed markers is specific for this contradictory cell type [33]. The situation is even more complex in the context of cultures involving MSCs because of their overlapping phenotypes. Our immunocytochemistry results, indeed, demonstrated the presence of α-SMA, PDGFRβ, and NG2+ cells among the MSCs but not all MSCs expressed these markers, reflecting the well-known heterogeneity of MSCs [34 –36]. Flow cytometry analysis showed that MSCs were expressing CD146, which is a cell adhesion molecule broadly expressed in ECs, pericytes, and vascular smooth muscle cells [37]. Nonpericytic MSCs have been reported to gain the expression of this marker in vitro, even if they had been initially selected by its absence [20] and CD146 expression appears to be associated with the commitment of MSCs to vascular smooth muscle cell phenotype [38]. Interestingly, Blocki et al. showed that CD146+CD34− selected bone marrow MSCs can maintain endothelial tubular networks and improve endothelial sprouting in vitro [20], which is in line with our observations of MSCs promoting EC-like cell differentiation in co-cultures.
By definition, MACs should be CD146− [7] but surprisingly, in our co-cultures CD14+CD45+ MNCs showed increasing CD146 expression over time. Interestingly, when co-cultured with MSCs, MNCs started to express PDGFRβ, which is another pericyte marker. It appears that in our co-cultures, CD14+ cells can obtain a pericyte-like phenotype, as they were mostly negative for CD34 and gained the expression of PDGFRβ and CD146, as well as NG2. In addition, our flow cytometry analysis of CD14+CD31+ MACs isolated from co-cultures showed that 55% of these cells were CD146+. The interesting hypothesis about the existence of specific pericyte subpopulations involved in angiogenesis [39], and a recent report demonstrating the participation of at least two pericyte types in angiogenesis, one of mesenchymal and another of hematopoietic origin [40], is supported by our data. Blocki et al. [40] have described MACs having a pericyte-like phenotype, which are also capable of enhancing endothelial sprouting in vitro [21]. Taken together, there is increasing evidence that pericyte-like cells can be found within the PB-MNC population and that they can have at least a partially shared phenotype with MACs. However, the final proof to confirm that these cells are true pericytes would require further functional assays.
NG2 is a membrane proteoglycan found on the plasma membrane of many different cell types, especially in central nervous system (CNS). It is used as a marker for pericytes but has also been reported to be expressed, for example, by macrophages and to be involved in their pro-tumorigenic capacity, at least in mouse models [41]. As MSCs are known to be capable of alternatively activating and polarizing monocyte-derived cells [42,43], this raises the question: if the NG2+ cells of MNC origin in our co-cultures would be macrophages rather than pericytes. Our flow cytometry data showed that when MNCs were cultured alone, the proportion of NG2-expressing cells increased over time. The expression of NG2 was stable in MSCs, but in co-culture, a three-fold induction of NG2+ cells among the CD14+CD45+ population was observed, suggesting that MSCs stimulate the differentiation of NG2+ cells in the hematopoietic/monocyte population. This is further supported by our data with sorted cells showing that NG2 was highly expressed in cells of MNC origin, when the co-cultures were performed with CD14+ cells. As MACs have previously been suggested to share similarity with alternatively activated M2 macrophages [30], it is possible that in our co-culture system MSCs induce the differentiation and activation of MNCs into NG2+ macrophages. The significance of this observation remains, nevertheless, to be elucidated, as according to current literature, NG2 expression in macrophages is transient and present only in activated macrophages in the context of brain tumors or other pathological conditions affecting CNS [44,45].
Taken together, the present study expands our knowledge about the interactions between bone marrow-derived MSCs and PB-derived MNCs. Despite certain limitations, such as the small number of MNC donors and limited amount of quantitative data on protein expression, we have demonstrated the differentiation of spindle-shaped, nonproliferative MACs in MSC-MNC co-cultures. Our results show that MSCs can support the formation of MACs in MSC-MNC co-cultures, at least partially via MSC-derived VEGF, whereas MACs depend on other paracrine mediators than VEGF in their capacity to stimulate angiogenesis when co-cultured with HUVECs. In conclusion, the potential of PB-derived cells to differentiate into both pericyte-like cells and MACs when co-cultured with MSCs indicates that co-culture models are valuable tools for improving vascularization in future regenerative medicine.
Footnotes
Acknowledgments
Matti Mäkelä is acknowledged for technical help with proliferation assays. Flow cytometry was performed at the Cell Imaging and Cytometry core at Turku Bioscience Centre, which is supported by Biocenter Finland.
Author Disclosure Statement
No competing financial interests exist.
Funding Information
This study was supported by research grants from Orion Research Foundation, Björkqvist Foundation, Turku University Foundation, Institute of Biomedicine (University of Turku), Otto A. Malm Foundation, Finska Läkaresällskapet (Einar och Karin Stroehm's Stiftelse), and Instrumentarium Science Foundation.
Supplementary Material
Supplementary Figure S1
Supplementary Figure S2
Supplementary Figure S3
Supplementary Table S1
References
Supplementary Material
Please find the following supplemental material available below.
For Open Access articles published under a Creative Commons License, all supplemental material carries the same license as the article it is associated with.
For non-Open Access articles published, all supplemental material carries a non-exclusive license, and permission requests for re-use of supplemental material or any part of supplemental material shall be sent directly to the copyright owner as specified in the copyright notice associated with the article.