
Abstract
This study was conducted to compare the in vitro proliferation and osteogenic differentiation potential of mesenchymal stem cells (MSCs) derived from mandibular (M-MSCs) or femur (F-MSCs) tissues of rats. M-MSC and F-MSC cultures were isolated and established from the same rat. Cultures were observed for morphological changes by microscope and growth characteristics by CCK-8 and cloning assays. Cell adhesion ability on a culture plate and titanium sheet was detected by staining with toluidine blue and Hoechst 33258, respectively. The levels of Ca, P, and ALP (serially) during osteogenic differentiation were evaluated. Cultures were analyzed for mineralization potential with alizarin red and ALP staining methods and for differentiation markers with RT-PCR (ALP, Runx2, and OCN). M-MSCs and F-MSCs were successfully isolated from the same rat with uncontaminated culture, which showed significant differences in morphology. The proliferation rate of M-MSCs was higher than F-MSCs in primary culture, but significantly lower after passage. More colonies are formed from F-MSCs than from M-MSCs. M-MSCs showed a significantly higher mineralization and osteogenic differentiation potential, which might be of significance for use in bone/dental tissue engineering. In vitro, cell passage will decrease the proliferation ability of M-MSCs. The higher mineralization and osteogenic differentiation potential of M-MSCs could make them an approachable stem cell source for further application in stem cell-based clinical therapies.
Introduction
Adult mesenchymal stem cells (MSCs) have now been extensively investigated for their characteristics and potentialities. Experiments have been conducted to develop stem cell-based therapies for several diseases and to find new materials in bone tissue engineering [1 –4]. It is well known that MSCs can be isolated from numerous tissues, among which bone marrow mesenchymal stem cells (BMSCs) are the most widely studied. Since the discovery of BMSCs from mice in 1966 [5], the ilium [6], femur [7], and tibia [1] have been successively used as sources of bone marrow-derived MSCs.
The maxillofacial region, comprising bones, teeth, nerves, blood vessels, fat, and muscle tissues, is a huge source of MSCs. Dental stem cells (DSCs) are MSC-like populations with self-renewal capacity and multidifferentiation potential. Currently, there are five main DSCs: dental pulp stem cells, stem cells from exfoliated deciduous teeth, stem cells from apical papilla, periodontal ligament stem cells, and dental follicle precursor cells [8]. The jaw-derived MSCs (j-MSCs) from humans were first described by Matsubara in 2005 [9]. However, osteoblast-like MC3T3-E1 is the most commonly used cell line for the study of osteogenic function of oral implantation-related materials [10] or research on the mechanism of osteogenesis [11,12]. Since recent studies have shown that tissue specificity has an effect on the function of stem cells [13], researchers began using bone marrow stem cells from the jaw to repair craniofacial defects [14], which then inspired us to study it further.
Based on the origin, neural crest cells (NCCs) can be divided into four types: cranial, cardiac, vagal, and trunk [15]. NCCs give rise to peripheral neurons and glia of the peripheral nervous system, bone and cartilage of the head, smooth muscle cells, melanocytes, and endocrine cells [16]. Intramembranous ossification leads to the formation of craniofacial bones, while endochondral ossification stimulates the process of long bone formation, which originates from the mesoderm. The methods of isolation and culture of mandible-derived MSCs (M-MSCs) or j-MSCs mainly include enzyme elimination tissue block and bone marrow adherence methods [9,17,18]. Generally speaking, the former is usually used in small animals, while the latter is often used for larger experimental animals or humans. Long bone marrow MSCs are often isolated by the bone marrow adherence method [2].
As a result, scholars have begun to study the differences of stem cells from two kinds of sources and their different reactions to bone repair and reconstruction [19,20]. However, there are few experiments on the differences of the two stem cells from the same animal or human. Meanwhile, among them, most of the experiments were carried out directly to compare the ability to repair animal bone defects. The precise relationships between the two different stem cell populations still remain unclear and no unified opinion has been reached in the current studies.
Therefore, the aim of this study was to investigate the growth characteristics and osteogenic potential between M-MSCs and F-MSCs. We hope it can provide a reference for the selection of seed cells in tissue engineering and the clinical application of stem cells.
Materials and Methods
Isolation and culture of M-MSCs and F-MSCs
Sprague-Dawley (SD) rats, aged 4–6 weeks, were purchased by the Chinese PLA General Hospital and procedures were conducted strictly following the Chinese PLA General Hospital Review Board approval. The rats were immersed in 75% ethanol for 5 min after sacrifice. The following isolation steps were completed on a superclean platform.
First, an alcohol cotton ball was placed in the mouth for disinfection. Bilateral mandibular bones with muscular tissues were then dissociated with aseptic ophthalmic scissors from the lower jaw joint and sterilized with 75% ethanol for nearly 5 s. All teeth were extracted using tweezers. Muscles and the periosteum were scraped off with an aseptic scalpel. Bones were washed in PBS (KeyGen Biotech, China) twice. A 5-mL syringe with DMEM (Invitrogen, Grand Island, NY) was used to wash the bone marrow cavity repeatedly, and the flushing solution was collected.
F-MSCs derived from femurs of the same rat were isolated simultaneously. Femurs with muscle tissues were obtained and sterilized with 75% ethanol for 5 s before the soft tissues were scraped off. Both ends of the femur were cut to expose the bone marrow, and the bone marrow was then collected by flushing with DMEM.
The two collections are placed in a centrifuge together (1,000 g for 5 min), and then the upper liquid is removed and resuspended with complete culture solution consisting of DMEM supplemented with 20% fetal bovine serum (Invitrogen) without 1% penicillin and streptomycin, respectively. The collections were seeded in culture plates and cultured in an incubator (37°C, 5%CO2). The culture medium was half-changed after 48 h, and media were replaced every 3 days. Cells were detached when cell density reached ∼80% confluence and the third passage cells were used for subsequent analysis. The cell morphology was observed by an inverted phase contrast microscope (Leica, Germany) and cell surface markers were detected by flow cytometry (CD29, CD31, CD34, CD73, CD90, and CD105).
Cell proliferation
M-MSCs and F-MSCs at third passage were seeded on 96-well culture plates at a density of 2 × 10³ cells/well. The proliferation capacity of the two cells was measured by Cell Counting Kit-8 (CCK-8) assay (DojinDo, Japan) at 6, 24, 72, 120, and 168 h (n = 8). The medium was removed and cells were washed with PBS. The 110 μL solution contained DMEM (100 μL) and CCK-8 (10 μL) was added to each well. Culture plates without cells were used as blanks. Absorbance was measured after incubation for 1 h at 37°C (OD = 450 nm) with an enzyme-labeling instrument (Tecan Infinite 200 Pro, Switzerland).
Colony-forming unit assay
Cloning ability in different tissues by CFU-F assay after 10 days was detected. M-MSCs and F-MSCs at third passage were seeded on six-well culture plates at a density of 100 cells per well. Cells were cultured in DMEM with 20% FBS. The medium was completely renewed every 3 days. Samples were washed with PBS three times before being fixed with 4% paraformaldehyde (Solarbio, China) and then stained with toluidine blue (Solarbio).
Adhesion on the culture plate and titanium sheet
M-MSCs and F-MSCs at third passage were seeded on 24-well culture plates at a density of 2 × 10⁴ cells/well. Cells were collected at 6 and 24 h. Samples were washed with PBS three times before being fixed with 4% paraformaldehyde and stained with toluidine blue.
M-MSCs and F-MSCs at third passage were seeded onto the prepared circular titanium sheet (2 × 10⁴ cells/well) in 24-well plates. Cells were collected at 6 and 24 h. Samples were washed with PBS three times before being fixed with 4% paraformaldehyde and then stained with Hoechst 33258 (KeyGen Biotech). Images were captured from four random fields per titanium sheet using a confocal laser scanning microscope (Leica SP8, Germany).
Multiple differentiation potential
M-MSCs and F-MSCs at third passage were cultured on 12-well culture plates (2 × 10⁴ cells/well). The osteogenic induction media (Cyagen) consisted of culture media supplemented with 10 mM β-glycerophosphate, 10−4 mM dexamethasone, and 0.2 mM ascorbic acid and they were renewed twice a week. To identify their adipogenic differentiation ability, cells in each group were treated with adipogenic induction solution (Cyagen) according to the instructions. Finally, alizarin red (KeyGen Biotech) and ALP staining (Leagene, China) were used to identify the osteogenic ability, while oil red O staining was used to detect lipid droplet formation.
Alizarin red staining
Alizarin red staining was used to evaluate calcium accumulation in mineralized cells. After 2 and 3 weeks, the osteogenic induction medium was removed and cultured cells were fixed by adding 4% paraformaldehyde for 30 min at room temperature and then stained with alizarin red solution. ddH2O was used to remove excess dye subsequently. The deposition was extracted by the following solution to quantify the amount of alizarin red: the volume ratio of the 10% glacial acetic acid solution to the absolute ethyl alcohol solution is 8:2 at room temperature for 30 min. The optical density (OD) of the solution was measured at 490 nm.
Ca, P, and ALP assays
During osteogenic induction, continuous collection of supernatants was used to detect the calcium content (Roche, Germany), phosphonium content (Roche), and ALP (Roche) in the medium at 1, 2, and 3 weeks, and they were measured and analyzed on the cobas 8000 (Roche Diagnostics).
Osteogenic gene expression
M-MSCs and F-MSCs were cultured in osteogenic induction medium as described for 7 days, respectively. Total RNA was subsequently extracted using TRIzol (Invitrogen). First-strand complementary DNA (cDNA) was synthesized using a cDNA synthesis kit (Promega, Madison, WI). Osteocalcin (OCN), ALP, and Runx2 were detected. Glyceraldehyde-3-phosphate dehydrogenase (GAPDH) was used as a control and for normalization, as showed in Table 1. Primers used for the real-time PCR are listed.
Primers Used in Real-Time Polymerase Chain Reaction
Statistical analysis
Results were analyzed using SPSS 18.0 and all data are expressed as the mean ± standard deviation. Significant differences among groups were identified using analysis of variance (ANOVA). The significance threshold was set at P < 0.05.
Results
Morphological appearance and characterization of M-MSCs and F-MSCs
M-MSCs and F-MSCs were isolated successfully from the same rat following the method described in Fig. 1A. There is no pollution in the process of cell culture. Significant differences were observed in cell morphology and growth characteristics. The first day after initial plating, single cells could be seen in the cultures by shaking the culture bottle containing bone marrow and blood. By day 2–3 (the first time for change of liquid), colonies of high density were observed in M-MSC cultures, whereas in F-MSC cultures, a small number of colonies could be detected. At passage 0 (P0), the proliferation rate of M-MSCs is faster than F-MSCs. In the early stage of adherence at P0, most M-MSCs were triangular, while F-MSCs showed elongated fibroblast-like morphology. After cell (tightly) fusion, M-MSCs were arranged like paving stones and F-MSCs formed a vortex-like cloning center (Fig. 1B). Flow cytometric analysis showed that both M-MSCs and F-MSCs strongly expressed CD29, CD73, CD90, and CD105, but lacked expression of CD31 and CD34 (Fig. 1E).
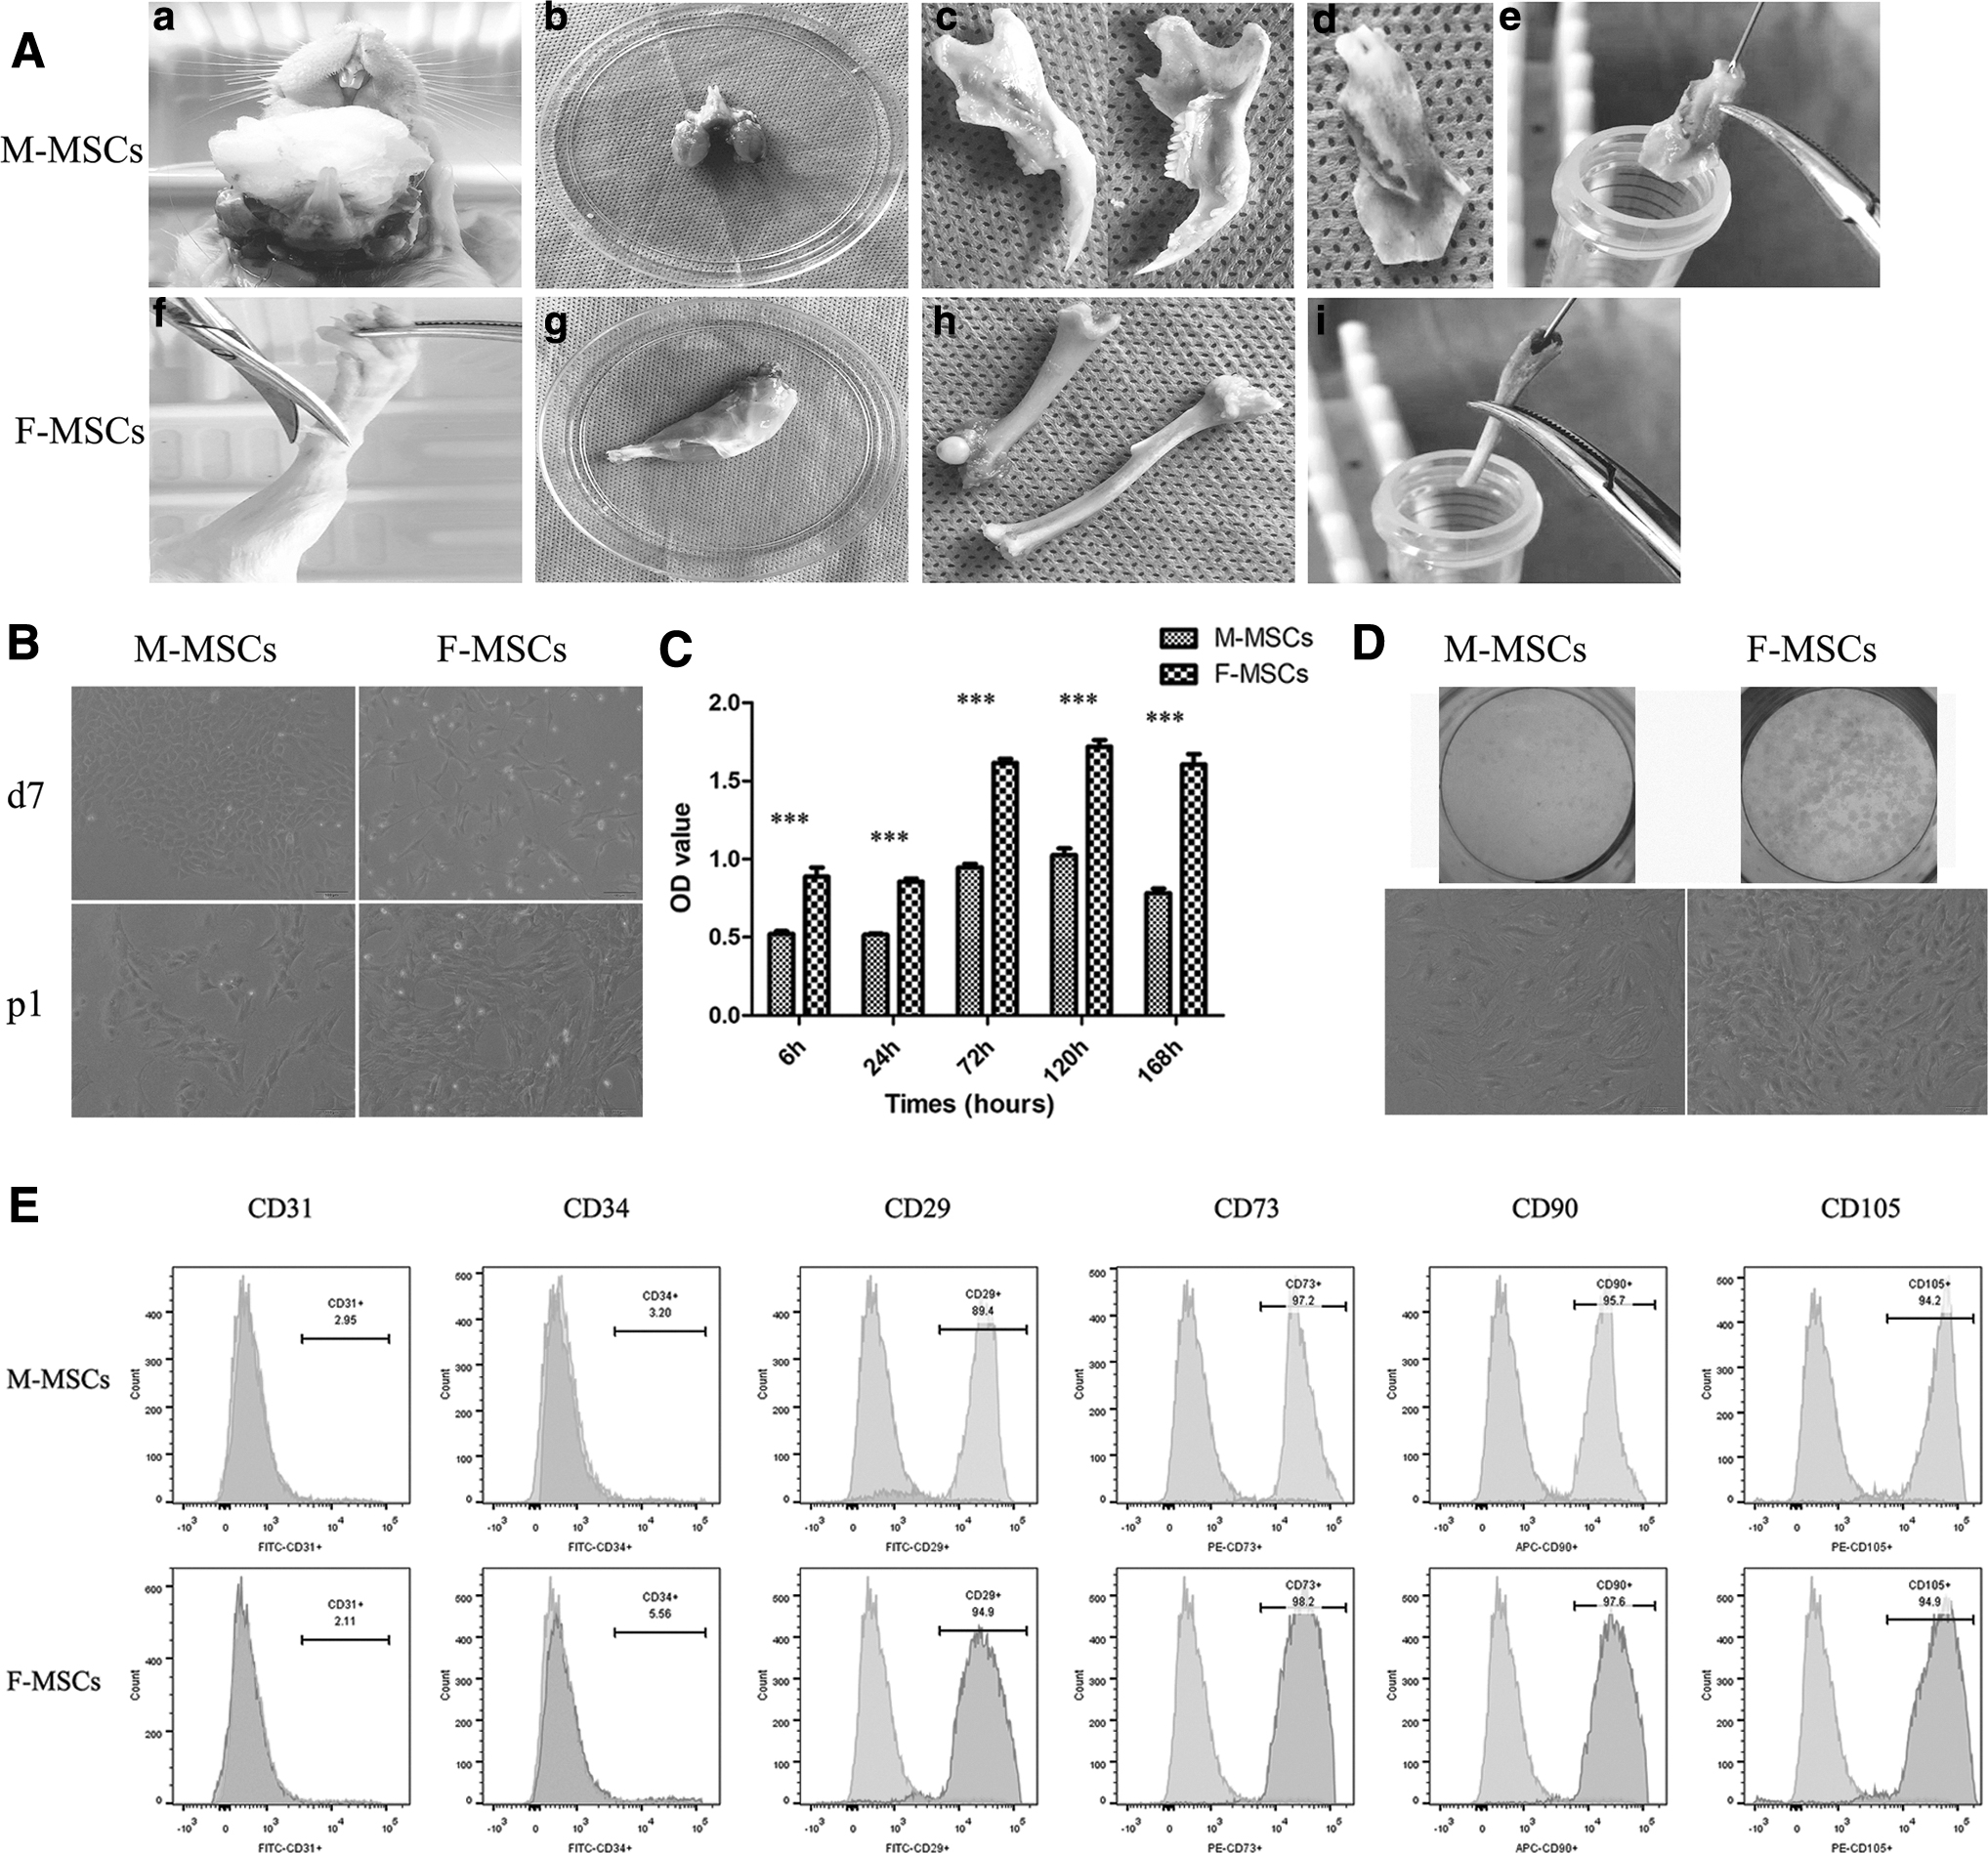
Proliferation potential and cloning ability
CCK-8 assay was used to detect the ability of cell proliferation (Fig. 1C). Cells proliferated rapidly on the third day, reached the peak on the fifth day, and then decreased on the seventh day. From 6 h, the proliferation rate of M-MSCs was always significantly lower than that of F-MSCs. Meanwhile, the cloning ability of F-MSCs is significantly stronger than that of M-MSCs (Fig. 1D).
Adhesion ability
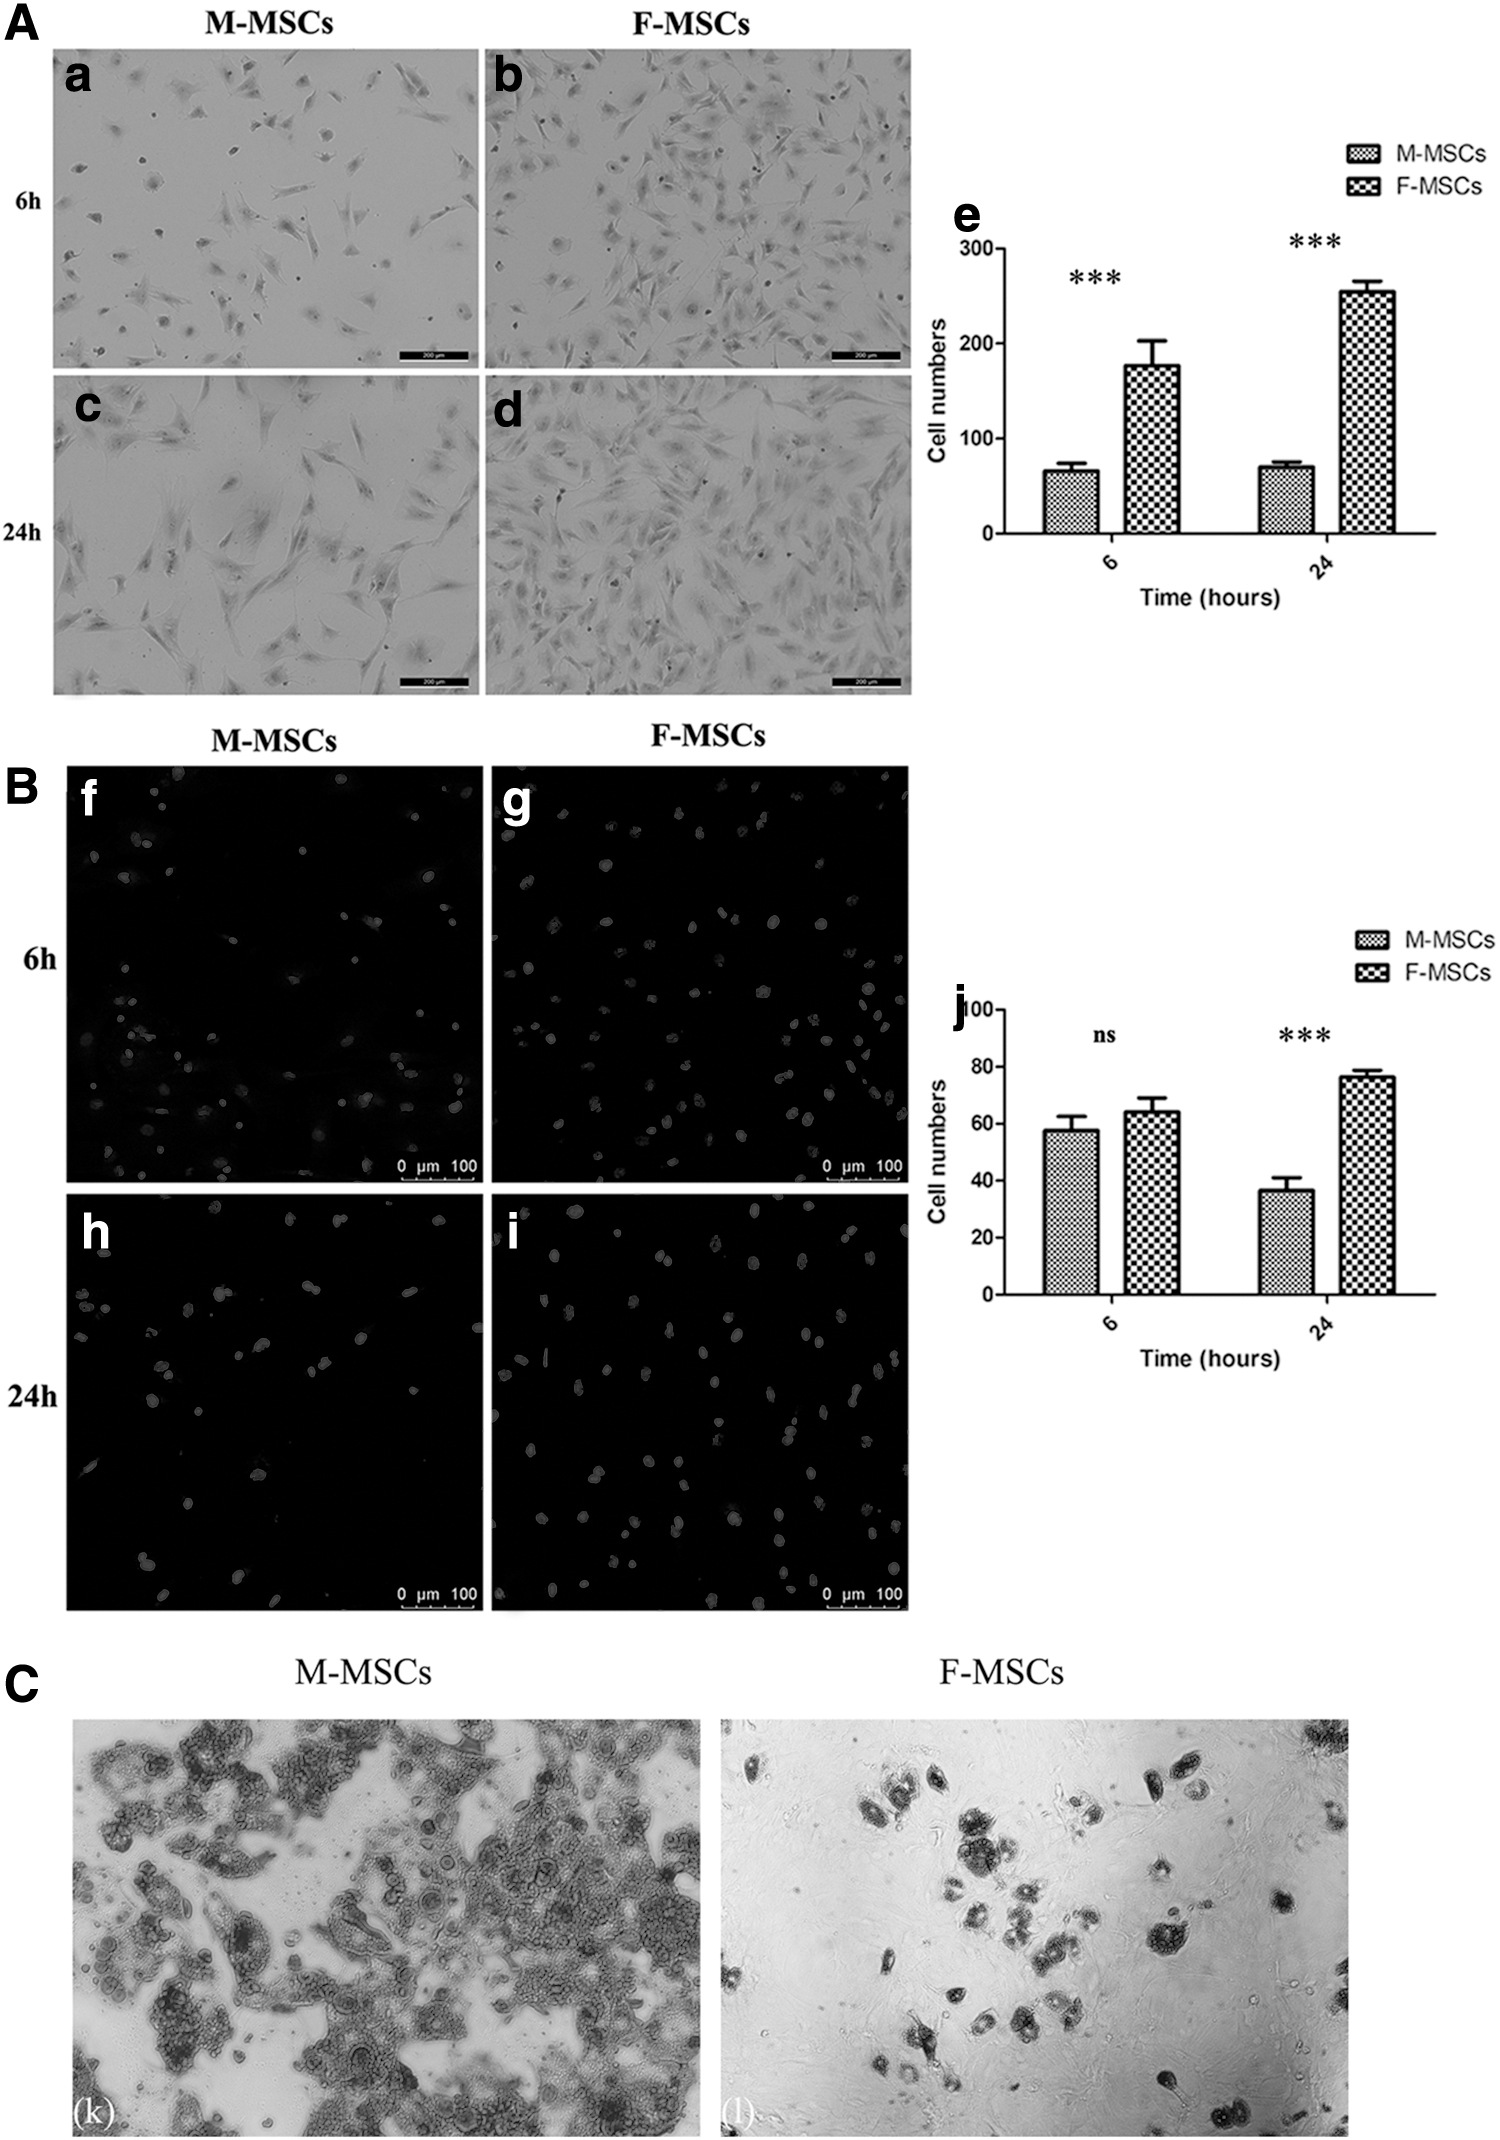
To identify adhesion ability, M-MSCs and F-MSCs were cultured on a culture plate and titanium sheet, respectively. In terms of adhesion to the culture plate (Fig. 2A), at 6 h, the number of F-MSCs was about twice as much as that of M-MSCs, and at 24 h, it was nearly four times (P < 0.001). With regard to adhesion to the titanium sheet (Fig. 2B), we observed that there was no significant difference between the two groups at 6 h (P > 0.05), but at 24 h, the number of M-MSCs was significantly lower than that of F-MSCs (P < 0.001).
Adhesion to the culture plate
Adipogenic differentiation ability
To identify and compare the adipogenic differentiation potential, M-MSCs and F-MSCs were cultured in adipogenic induction medium. After oil red o staining, the formation of lipid droplets was observed under a microscope (Fig. 2C). Obviously, the amount of lipid droplets of M-MSCs was significantly higher than that of F-MSCs.
Alizarin red staining
To compare the osteogenic differentiation potential, M-MSCs and F-MSCs were cultured in osteogenic induction medium (Fig. 3A–C). The mineral nodules of M-MSCs and F-MSCs were visualized by alizarin red staining and then quantified after 2 and 3 weeks. Mineralization started at the center of the cellular aggregates (a and b) and progressively increased during the following week when mature mineralized tissue covered the entire monolayer (c and d). Mineral nodules formed by M-MSCs and F-MSCs were observed (Fig. 3). Notably, M-MSCs (0.32 ± 0.01, 0.65 ± 0.05) displayed stronger alizarin red staining than F-MSCs (0.14 ± 0.00, 0.39 ± 0.03) either at 2 weeks or 3 weeks. With prolongation of osteogenic induction time, the mineralization ability of M-MSCs was continuously higher than that of F-MSCs (P < 0.05). Mineralization was not induced in either M-MSCs or F-MSCs under growth media (data not shown).
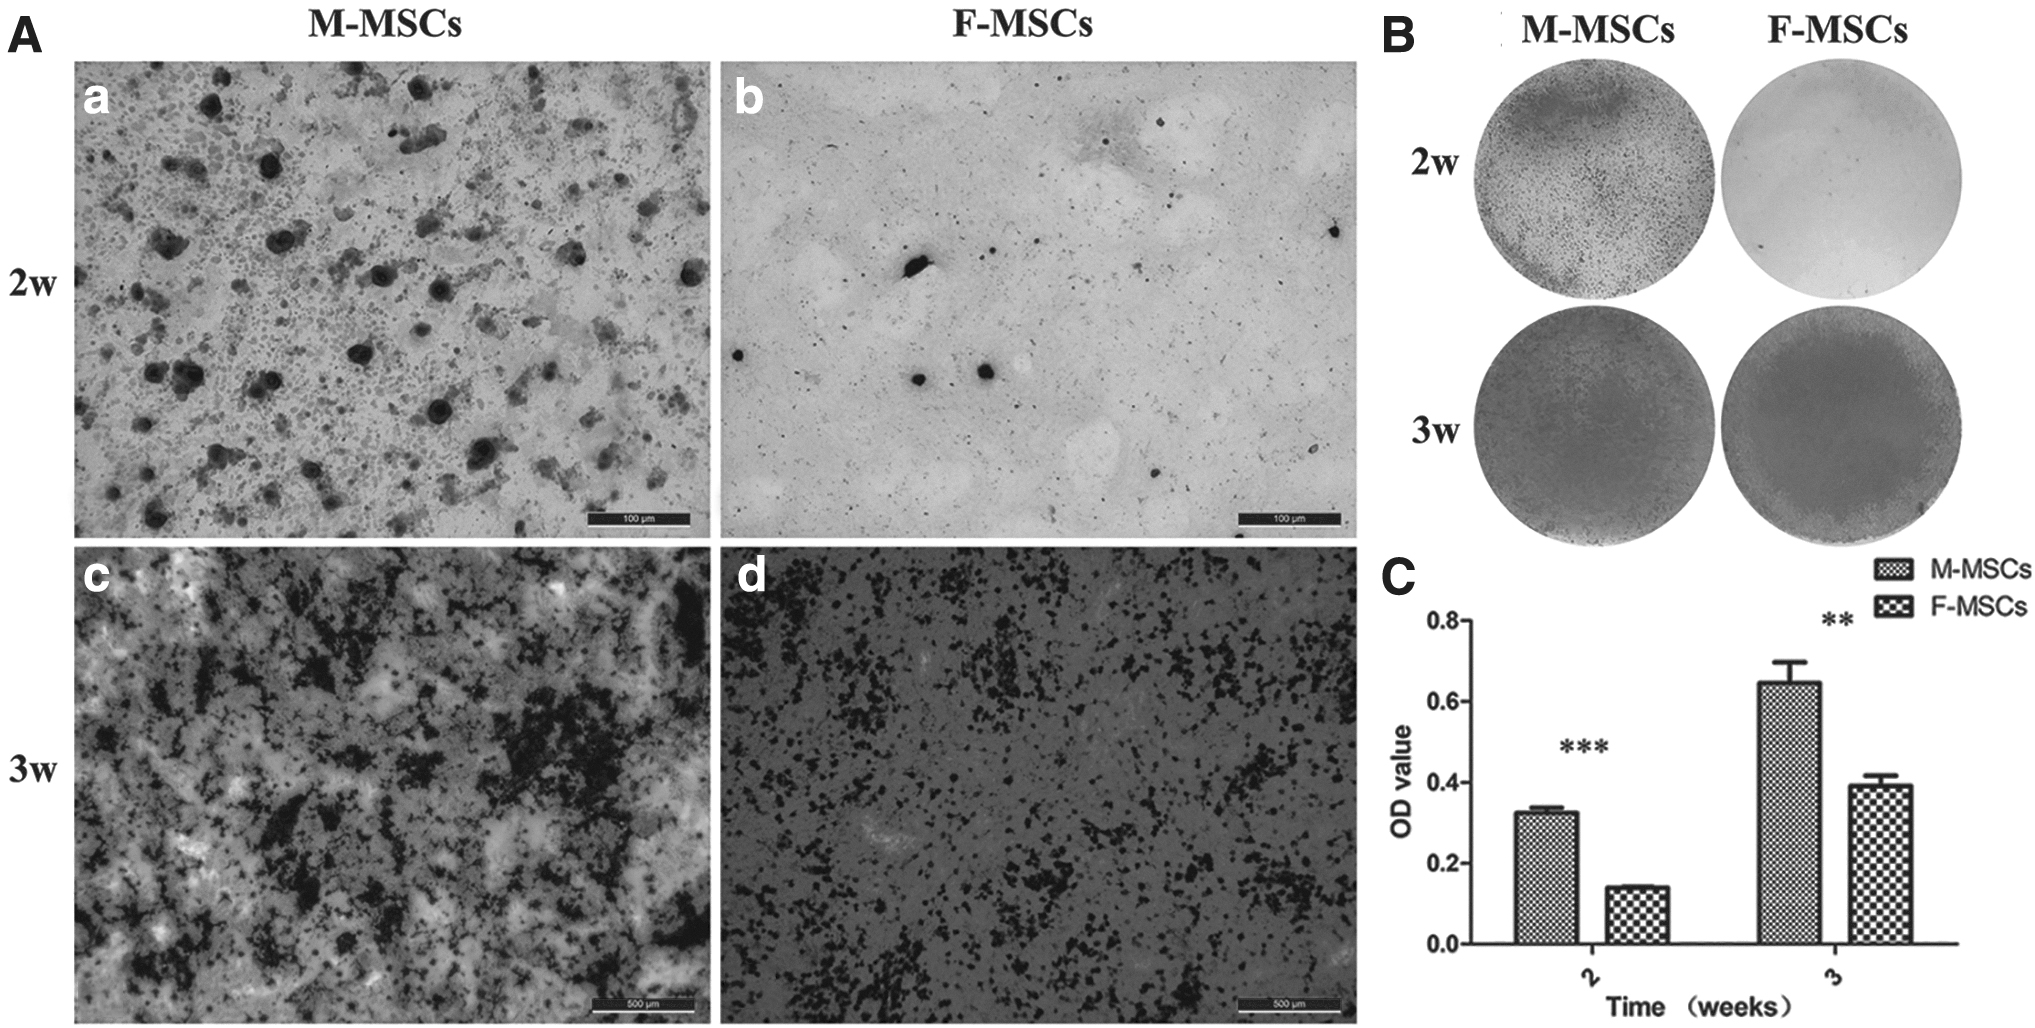
Mineral formation was detected by alizarin red staining under osteogenic induction media. The ability to mineralize at 2
ALP assay
M-MSCs and F-MSCs were stained with ALP after osteogenic induction at day 21. In the microscope images, M-MSCs showed dry staining and loss of cell morphology. However, a large number of stained cells were observed in F-MSCs, which showed obvious cell morphology (Fig. 4A). In the supernatant, the secretion of ALP in M-MSCs was consistently lower than that in F-MSCs (Fig. 4B) (P < 0.001).

On the 21st day of osteogenic induction, cells were stained with alkaline phosphatase, and osteogenic differentiation ability was confirmed both by the naked eye
Ca and P assays
We collected the supernatant on 7, 14, and 21 days during the osteogenic induction for Ca and P assays (Fig. 4C). As a whole, the content of Ca was gradually decreasing, and the amount of F-MSCs is higher than that of M-MSCs. The amount of P in M-MSCs dropped off gradually, while F-MSCs showed the opposite trend.
Osteogenic gene expression
After 4 and 7 days of osteogenic induction, the cells were collected for real-time PCR, and ALP, Runx2, and OCN gene expression was detected (Fig. 4D).
The expression of ALP in M-MSCs was significantly lower than that in F-MSCs at day 4, but presented contrary evidence at day 7. Expression of the Runx2 gene in M-MSCs was significantly higher than that in F-MSCs at these two time points. At day 4, there was no difference in the expression of the OCN gene in the two groups, but at day 7, it was significantly higher in M-MSCs than that in F-MSCs.
Discussion
The site-specific characteristic theory suggests the existence of at least two populations of BMSCs from different embryonic origins that are not interchangeable [13,21]. Recently, studies have compared the osteogenesis, immunity, and drug response of two kinds of bone tissues: mandibular (neural crest origins) and femur (mesoderm origins) [14,17,22] tissues. However, most of them are in vivo experiments, and few direct comparisons at the cell level in vitro were conducted [14,23,24]. In the present study, MSCs derived from mandibles (M-MSCs) and femurs (F-MSCs) of rats were used to compare their proliferation and osteogenic differentiation potential.
To avoid the difference between individual and reagent in culture, M-MSCs and F-MSCs were isolated from the same rat. According to the above-described method, sufficient MSCs can be efficiently extracted without cell pollution. From identification of cell surface markers and the osteogenic and adipocyte differentiation ability, the cells we isolated met the standard of MSCs.
The amount of bone marrow in mandibular tissues of rats is very small, but it was enough to proliferate for experimental use as that from femurs, which indicates that the proliferation ability of M-MSCs is strong. The morphology of the two kinds of cells was different. M-MSCs were lined up like paving stones, while F-MSCs were arranged together in a whirlpool-like manner after fusion. Differently, Lee [25] demonstrated that M-MSCs showed comparable proliferation and mineralization potentials with F-MSCs in vitro. Meanwhile, MSCs from mandibular tissues showed a small amount of M-MSCs, but a relatively fast proliferation rate at passage 0 (P0). However, when subcultured at the same time with F-MSCs, the state of M-MSCs might be different from F-MSCs.
At P0, the proliferation rate of M-MSCs was higher than that of F-MSCs, but after subculture, the trend is obviously opposite. The CCK-8 assay showed that the proliferation ability of F-MSCs was stronger than that of M-MSCs, and the cloning ability of M-MSCs was significantly weaker than F-MSCs. Both experiments were carried out on a plastic culture plate, and we speculated that the ability of adhesion of the two cells to the culture plate was different. At the same time, the adhesion of M-MSCs and F-MSCs to the culture plate and titanium sheet was designed. Interestingly, we found that adhesion cells of M-MSCs to the culture plate and titanium sheet were fewer than F-MSCs. However, it is worth noting that at 6 h, adhesion to the culture plate showed that M-MSCs were significantly weaker than F-MSCs, but their adhesion to titanium tablets was the same. This suggests that M-MSCs have relatively stronger adhesion to titanium sheets compared with F-MSCs, which is quite important for oral implants. However, the adhesion and extension ability of the two stem cells to titanium needs to be further compared.
To observe the osteogenesis ability, M-MSCs and F-MSCs were cultured in osteogenic induction medium. Alizarin red staining showed that the formation of mineralization nodules in M-MSCs was higher than that in F-MSCs. However, in the supernatant, the secretion of ALP in M-MSCs was consistently lower than that in F-MSCs; this reduction contributed to the extensive mineral depositions in M-MSCs, which (to some extent) prevented penetration of the ALP substrate [26,27]. ALP is mainly expressed in differentiated cells producing mineralized matrix and can be considered an early marker of osteogenic differentiation [28]. Bellows [29] pointed out that although organic phosphate and ALP play a crucial role in the initiation of mineralization, their presence is not required for the continuation of bone nodule mineralization.
Calcium concentration in the supernatant of M-MSCs has shown a steady lower trend until 2 weeks with a late increase at 3 weeks, which indicated the much earlier precipitation, but weaker precipitation capacity at the late stage. Most of the phosphorus is deposited in the form of calcium phosphate. Phosphate concentration was higher in M-MSCs at 7 days, also indicating minimal precipitation of calcium phosphate in the early stages of the process.
Osteoblast-specific markers are differentially expressed during various stages of development. Runx2 is responsible for the activation of osteoblast differentiation marker genes [30]. OCN is a marker of the late stages of osteoblast differentiation and its production denotes the onset of matrix deposition [31]. Our study revealed that M-MSCs expressed a higher level of Runx2 and OCN compared with F-MSCs.
The molecular mechanism of bone formation involves three major phases: (1) proliferation, (2) extracellular matrix maturation, and (3) mineralization, which are orchestrated by various key molecules that regulate this phase transfer. During osteogenesis, the proliferation phase is initially downregulated to induce the maturation process with the help of a multitude of gene expression phenomena. Similar processes are involved for maturation and mineralization [30]. In our study, the proliferation of M-MSCs is lower than that of F-MSCs, which might contribute to the earlier mineralization of M-MSCs.
In vivo experiments by other scholars have shown that the osteogenic ability of bone stem cells derived from the jaw is equal to or higher than that of stem cells derived from extremities. Wang [32] pointed that in a large animal model, I-BMSCs and Al-BMSCs (iliac and alveolar origins, respectively) manifested similarly strong osteogenic potential. Kang [14] compared the stability of simultaneously placed dental implants with autologous bone grafts harvested from either the iliac crest or the intraoral jawbone for severely atrophic alveolar ridges. They found that the grafted iliac bone exhibited more prompt vertical loss than the jawbone; in particular, the largest vertical bone reduction was observed within 6 months after the bone graft. Thus, BMSCs derived from the jaw may have more effect on the repair of jaw defects, which is important for dental implant surgery and related to bone increment.
Footnotes
Acknowledgments
The authors are thankful to the staff and faculty of the Institution of Stomatology, Chinese People's Liberation Amy General Hospital.
Author Disclosure Statement
The authors declare that there are no conflicts of interest regarding the publication of this article.
Funding Information
This study was supported by the National Natural Science Foundation of China (81771102, 81271180).