
Abstract
Dental mesenchymal stem cells (MSCs) are recognized as a critical factor in repair of defective craniofacial bone owing to the multiple differentiation potential, the ability to regenerate distinct tissues, and the advantage that they can be easily obtained by relatively noninvasive procedures. Special AT-rich sequence-binding protein 2 (SATB2) is a nuclear matrix protein, involved in chromatin remodeling and transcriptional regulation, and has been reported to be as a positive regulator of osteoblast differentiation, bone formation, and bone regeneration in MSCs. In this study, we systematically investigated the capability of SATB2 to promote the osteogenic differentiation of periodontal ligament stem cells (PDLSCs), dental pulp stem cells (DPSCs), and stem cells from human exfoliated deciduous teeth (SHED). RNA-seq analysis and quantitative real-time PCR (RT-PCR) revealed that genes regulating osteogenic differentiation were differentially expressed among three cell types and SATB2 was found to be expressed at a relatively high level. When the three cell types overexpressed SATB2 with AdSATB2 infection, alkaline phosphatase (ALP) staining, ALP activity, Alizarin Red S staining, and quantification tended to increase with an increasing infection rate. It showed opposite results after infection with AdsiSATB2. RNA-seq analysis indicated that the expression of downstream osteogenic genes was affected by AdSATB2 infection and quantitative RT-PCR confirmed that nine osteogenic genes (Spp1, Sema7a, Atf4, Ibsp, Col1a1, Sp7, Igfbp3, Dlx3, and Alpl) were upregulated, to various extents, following SATB2 overexpression. In addition, quantitative PCR results indicated that SATB2 affected the expression of MSC markers. These results suggested an important role of SATB2 in the osteogenesis of PDLSCs, DPSCs, and SHED. Further research is warranted to investigate SATB2-mediated regulation of osteogenic differentiation and to evaluate the therapeutic use of SATB2 for the regeneration of defective craniofacial bone tissue.
Introduction
Bone defect is usually induced by tumor, trauma, and inflammation [1,2]. Transplantation of autogenic or allogeneic bone is the main approach for the reconstruction of bone destruction that could not heal spontaneously. However, surgery trauma and immunological rejections are major problems that cannot be ignored [3 –6]. In recent years, tissue regenerative engineering, based on mesenchymal stem cells (MSCs) and bioactive factors, has shown tremendous potential for tissue repair.
Dental MSCs have multiple differentiation potentials and are the sticking point of bone tissue repairment in tissue engineering. Dental MSCs can be easily obtained in the noninvasive ways compared with the bone marrow mesenchymal stem cells (BMSCs) [7,8]. It has been confirmed that dental MSCs are important in tooth homeostasis and repair. For example, damaged dentine can be repaired by dental pulp stem cells (DPSCs) and defective periodontal tissue can be regenerated by periodontal ligament stem cells (PDLSCs). Moreover, different types of dental MSCs share some common markers, including CD105 and CD146. A total of five dental MSC types are isolated from immature and mature teeth, which are DPSCs, apical papillary stem cells, stem cells from human exfoliated deciduous teeth (SHED), PDLSCs, and dental follicle stem cells. Nonetheless, stem cells that are obtained from diverse dental tissues have different proliferation, differentiation, and clonogenicity capacities [9]. Therefore, it is necessary to explore the properties of various dental MSC populations.
PDLSCs are isolated from the periodontal membrane and has been reported to be able to form osteoblast-like cells in vitro [10,11]. DPSCs can regenerate the dental pulp tissues, and the CD44+/RUNX2+ DPSCs can differentiate into osteoblast precursors [12]. SHED are undifferentiated MSCs showing mineral formation and upregulate the expression of osteogenic proteins when cultured in osteogenic induction medium for 4 weeks [13]. Although the osteogenic potential of PDLSCs, DPSCs, and SHED has been widely confirmed, some studies in vitro and in vivo have demonstrated that this potential is different in various dental stem cells [8].
Special AT-rich sequence-binding protein 2 (SATB2), which belongs to the special AT-rich binding protein family, has been identified as the protein that binds to the nuclear matrix attachment region, and is involved in chromatin remodeling and transcriptional regulation by binding to matrix attachment regions (MARs) and activating MAR-dependent transcription [14 –16]. SATB2 can bind with metastasis-associated protein 2 and histone deacetylase 1, and these two are parts of the nucleosome remodeling and histone deacetylase complex [17]. In addition, depending on the locus, SATB2 may either activate or inhibit gene transcription. Unlike classical transcription factors that bind to a single target gene, SATB2 has multiple binding sites, and takes part in regulating numerous biological processes. Specifically, it has been suggested that SATB2 is a regulator of osteoblast differentiation in bone formation or mineralization [18]. Moreover, SATB2 is recognized to enhance the activity of runt-related transcription factor 2 (Runx2) and activates transcription factor 4 (Atf4) to regulate osteoblast differentiation and skeletal development [19]. However, the role of SATB2 in the osteogenesis of human dental MSCs has been poorly explored. In this study, we systematically investigated the role of SATB2 in the osteogenesis of PDLSCs, DPSCs, and SHED.
Materials and Methods
Isolation and culture of dental MSCs
The Ethics Committee of the Affiliated Hospital of Stomatology of Chongqing Medical University approved this study, and all subjects enrolled in the study signed informed consent. Human dental pulp and periodontal tissues were obtained from the upper canines of a 15-year-old female, a 15-year-old male, and a 16-year-old female who were clinically healthy subjects requiring orthodontic extraction in the Affiliated Hospital of Stomatology, Chongqing Medical University. SHED were separated from the pulp tissue of an exfoliating deciduous teeth that were collected from the upper primary canines of a 10-year-old girl, an 11-year-old girl, and an 11-year-old boy, all of whom were healthy subjects. Cells from passages 3 to 7 were used in the study.
DMSCs were isolated and cultured according to recognized protocols. Briefly, after removal, the teeth were immersed in sterile phosphate-buffered saline (PBS, pH 7.4; Hyclone, New York, NY), containing 2% Penicillin/Streptomycin Solution (Hyclone). We used a sterile scalpel to remove and collect the periodontal ligaments from the middle one-third of the premolar root [20]. To obtain pulp tissue of permanent and deciduous teeth, the teeth were disinfected again and split open by an osteoclamp at the cement enamel junction [21]. Thereafter, the pulp and periodontal tissue pieces were subject to 30 min of enzymatic digestion using type I collagenase (Sigma, USA), followed by culture within the α-MEM (Hyclone) supplemented with 1% penicillin/streptomycin, as well as 10% fetal bovine serum (FBS; Hyclone). Later, cells were incubated within the incubator under 5% carbon dioxide and 37°C conditions. The culture medium was altered every 3 days until the primary cells migrated out of the tissue and reached confluence.
RNA isolation, complementary DNA library construction, and sequencing
Trizol reagent (Takara, Japan) was used to extract total RNA from SHED, DPSCs, and PDLSCs, respectively, in accordance with the manufacturer's instructions. After RNA quality assessment by NanoDrop2000 (Thermo Fisher Scientific, Wilmington, DE), the NEBNextR UltraTM Directional RNA Library Prep Kit for IlluminaR (NEB, USA) was used to attribute sequences to samples according to protocols and index codes. Briefly, the poly-T oligo-attached magnetic beads were utilized to purify messenger RNA (mRNA) based on the extracted total RNA. Later, NEBNext First Strand Synthesis Reaction Buffer (5 × ) was employed to fragment samples under elevated temperature using divalent cations. In line with the manufacturer's protocols, the clustering of index-coded samples was performed on a cBot Cluster Generation System by TruSeq PE Cluster Kit v4-cBot-HS (Illumia). After the cluster generation, the library preparations were sequenced on an Illumina Hiseq Xten platform and paired-end reads were generated.
Bioinformatics analysis of sequencing results
The in-house perl scripts were used to process the fastq format raw reads through the removal of unreliable reads as well as partial sections with low quality. Subsequently, the clean reads that had one mismatch or a perfect match were mapped to a reference genome sequence by HISAT2 software. Gene annotations were obtained from Nt (NCBI nonredundant nucleotide sequences), NR (NCBI nonredundant protein sequences database), COG (the database of clusters of protein homology), Pfam (the database of homologous protein family), Swiss-Prot (the database of manually annotated nonredundant protein sequence), KEGG (the database of Kyoto encyclopedia of genes and genomes), KOG (the database of clusters of protein homology), and GO (the database of gene ontology). The gene expression levels can be evaluated by the FPKM (fragments per kilobase of transcript per million fragments mapped) [22]. EBSeq package was employed for analyzing differentially expressed genes (DEGs) [23]. Specifically, DEGs are genes conforming to the thresholds of false discovery rate <0.01 and |log2(fold change)|≥1. GO enrichment analysis of DEGs was conducted by the clusterProfiler R package. The statistical enrichment of DEGs in KEGG pathways was assessed by KOBAS software [24]. ClusterProfiler R packages were applied to find notably enriched KEGG pathways compared to the whole genome background.
Generation and amplification of recombinant adenoviruses
The recombinant adenoviruses were generated with the AdEasy technology [25 –27]. Briefly, three small interfering RNA (siRNA) sites targeting human SATB2 sites (NM_001172509.1) were chosen by using Invitrogen's BLOCK-iTRNAi (Thermo Fisher) and/or siDESIGN (Horizon) programs and subcloned into the recently reported adenoviral shuttle vector pAdTrace-OK vector through Gibson Assembly, yielding pAdTrace-siSATB2 [28,29]. The coding region of human SATB2 was PCR amplified and subcloned into adenoviral shuttle vector pAdtrack-TOX, yielding pAdTrack-SATB2 [30]. Both pAdTrace-siSATB2 and pAdTrack-SATB2 were used for homologous recombination with the adenoviral backbone vector in BJ5183 bacterial cells, leading to the production of pAdR-siSATB and pAd-SATB2, respectively, which were used to generate and amplify recombinant adenoviruses in HEK-293 or 293pTP cells, designated as AdR-siSATB2 and Ad-SATB2 [31,32]. An analogous adenovirus that only expresses green fluorescent protein (GFP) (AdGFP) or red fluorescent protein (RFP) (AdRFP) was used as mock control [33 –36]. Moreover, the 5–10 μg/mL polybrene (Solar, China) was utilized for all adenoviral infections to enhance the adenoviral infection efficiency [37].
Immunofluorescence staining
Cells were subjected to 10 min of 4% formaldehyde fixation, followed by 1 h of incubation within the 10% goat serum for permeabilizing cells as well as blocking the nonspecific protein binding. Thereafter, samples were incubated with anti-SATB2 antibody (1:100; Abcam, USA) at 4°C overnight. Alexa Fluor® 594-AffiniPure Goat Anti-Mouse IgG (H+L) was used as the secondary antibody (red). The 1.43 μM 4′,6-diamidino-2-phenylindole (DAPI) (blue) was adopted to stain cell nuclei.
Quantitative real-time PCR
Total RNA was isolated with the Trizol reagent (Takara, Japan) and subjected to reverse transcription with the cDNA Reverse Transcription Kit (Takara, Japan). Quantitative real-time PCR (RT-PCR) analysis was performed by a 40-cycle PCR in the ABI Prism 7500 Real-Time PCR System (Applied Biosystems, Foster City, CA) with the SYBR Green PCR master mix reagent (Takara, Japan). In brief, PCR cycling program were as follows: 30 s at 95°C, 5 s at 95°C, 34 s at 60°C, and 15 s at 95°C. All samples were normalized relative to glyceraldehyde-3-phosphate dehydrogenase (GAPDH) levels. The primer sequences used in this study are shown in Table 1.
Primer Sequence
Western blot
After infection for 48 h, the radioimmunoprecipitation assay buffer (Beyotime, Jiangsu, China) was adopted for sample lysis. Then, the BCA Protein Assay Kit (Beyotime) was used to assess the protein concentration. Subsequently, equal amounts of protein lysates were separated to sodium dodecyl sulfate-polyacrylamide gel electrophoresis (SDS-PAGE), and the isolated proteins were transferred onto the immobilon nitrocellulose membranes (Millipore, Billerica, MA). Then, those membranes were subject to Tris-buffered saline solution blocking, which contained 5% nonfat dry milk and 0.1% Tween-20, followed by overnight incubation using primary antibodies at 4°C. There are two primary antibodies applied, including an anti-SATB2 antibody (1:1,000, ab92446; Abcam) and an anti-GAPDH antibody (1:1,000, ab181602; Abcam). Afterward, the membranes were washed and subject to horseradish peroxidase-conjugated secondary antibody incubation. Finally, chemiluminescence was used to detect the protein bands, and the Quantity One software (Bio-Red, Hercules, CA) was employed for quantification.
Alkaline phosphatase staining and alkaline phosphatase activity assay
The dental MSCs were seeded in triplicate in 24-well plates and then infected with AdSATB2, AdGFP, AdsiSATB2, or AdRFP. On day 3, alkaline phosphatase (ALP) staining was performed by the NBT/BCIP Staining Kit (Beyotime-Bio, China). In addition, according to the Great Escape SEAP Chemiluminescence Assay Kit Instructions (BD Clontech, Mountain View, CA) [25 –27,33,36,38], the ALP activity assay was assessed. ALP activity was standardized by total cellular protein consistency among the samples.
Alizarin Red S staining and quantification
After inducing osteogenic differentiation (mineralization medium with normal culture medium containing 50 mg/mL of ascorbic acid and 10 mM of β-glycerophosphate) for 21 days, cells were washed with PBS and fixed in 2.5% glutaraldehyde for 15 min. Next, cells were washed three times, and then stained with 1% Alizarin Red S (ARS) solution (PH: 4.0–6.0, Solarbio; Sigma) for 5 min at 37°C. The samples were further washed three times and analyzed using microscopy. The red color indicated calcium deposits. ARS quantification methods were slightly modified according to the reports of Li et al. [39] and Elsayed et al. [40]. Briefly, the 10% cetylpyridinium chloride solution (0.5 mL) was used to extract areas stained by ARS at room temperature (22–25°C) for 1 h in the condition of gentle agitation. For each sample, optical density (OD) values at 570 nm were recorded on 200 μL aliquots. Each experiment was carried out in triplicate.
Statistical analysis
All quantitative data were presented as mean ± standard deviation. The statistical significance was determined by one-way analysis of variance and student's t test. All statistical analyses were conducted with the SPSS 17.0 statistical software. The level of statistical significance was P < 0.05.
Results
Differential expression analysis in PDLSCs, DPSCs and SHED
Samples of PDLSCs, DPSCs, and SHED from different subjects were pooled by cell type to ensure the generalizability of the findings. To eliminate the influence of the growth factors present in FBS, conventional medium containing 10% FBS was substituted by serum-free medium 10 h before RNA isolation. After quality control, clean data including 28.9, 29.1, and 24.7 million clean reads were acquired for PDLSC, DPSC, and SHED samples, respectively, with 97% of bases generating Qscores ≥20, and GC contents ranging from 51.74% to 54.06%. The saturation test indicated that effective data were obtained for all sample groups.
First of all, we focused on the correlation between the three cell types. Based on gene expression, r (Person's correlation coefficient) was used as an index of biological repetitive correlation. If r2 is closer to 1, the stronger the correlation between the two samples is. As shown in Fig. 1A, the principal component analysis (PCA) analysis reflected the correlation between every two groups and r 2 was 0.919 between PDLSCs and DPSCs, 0.954 between PDLSCs and SHED, and 0.943 between DPSCs and SHED, which indicated that there were some differences between the three cell types. To evaluate these differences, DEGs were analyzed. We evaluated osteogenesis-related DEGs by pairwise comparisons. The venn diagram of DEGs indicated that DEGs regulating osteogenesis were different between each two cell types (Fig. 1B). SATB2 has previously been reported to be as a positive regulator of osteoblast differentiation, bone formation, and bone regeneration in MSCs. The results of RNA-seq and quantitative RT-PCR indicated that SATB2 was found expressed at a relatively high level compared to other osteogenesis-related genes, including Smad9, Gab2, Id3, Runx2, Alpl, and Smad1, in the three cell types (Fig. 1C, D). These results gave us hints that SATB2 might play a role in regulating osteogenic differentiation of PDLSCs, DPSCs, and SHED.

Correlation and differences between PDLSCs, DPSCs and SHED, based on gene expression. Cells were collected after 48 h of culture and allogeneic cells from three different people were mixed as one sequencing sample.
Endogenous expression of SATB2 and validation of SATB2 overexpression and silencing
Next, we investigated the endogenous expression of SATB2 in the three types of dental MSCs using immunofluorescent staining, quantitative PCR (qPCR), and western blot. Immunofluorescent staining revealed SATB2 expression in the cytoplasm and nucleus of the three cell types (Fig. 2A). The mRNA expression of SATB2 was determined by qPCR in the three dental MSCs. DPSCs exhibited the highest expression, while SATB2 mRNA was more abundant in SHED than PDLSCs (Fig. 2B). western blot analysis suggested that SATB2 protein expression was similar in these three groups, but slightly higher in DPSCs compared to PDLSCs (Fig. 2C).
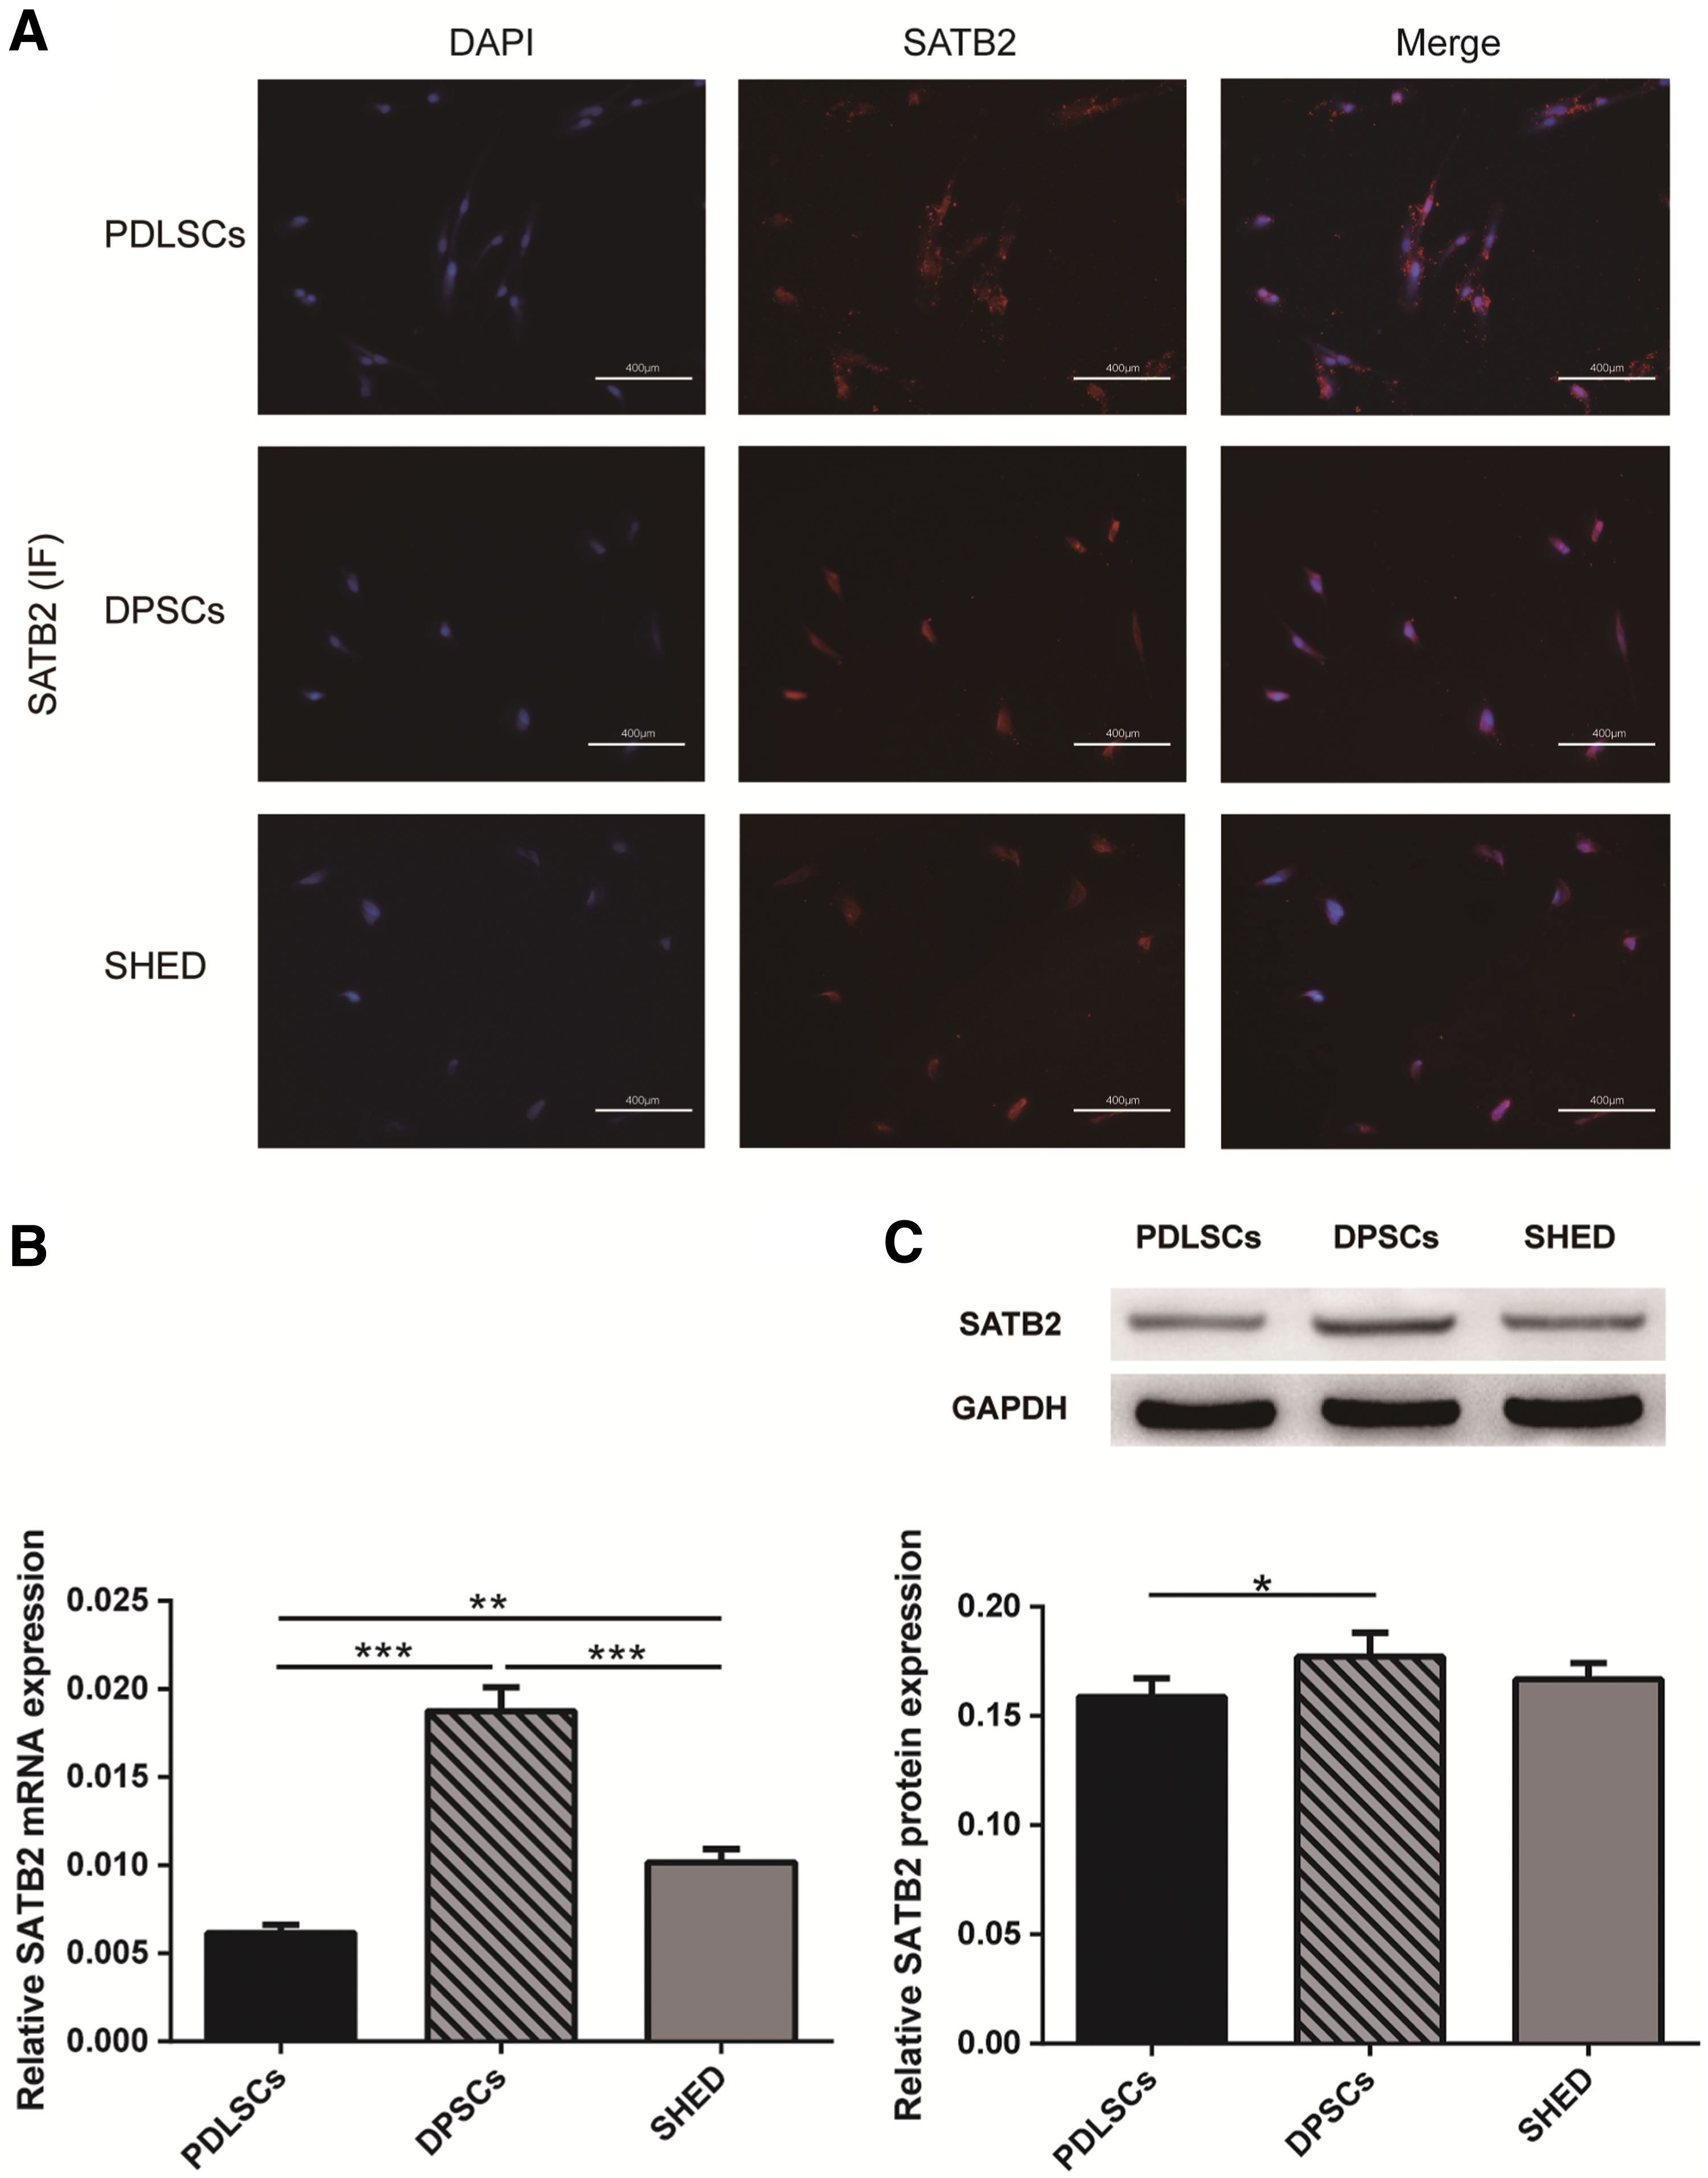
Endogenous expression of SATB2.
Then, recombinant adenoviruses for SATB2 overexpression or silencing were constructed and their efficiency assessed in the three cell types. SATB2 expression was significantly increased in PDLSCs, DPSCs, and SHED infected with AdSATB2, as determined by qPCR and western blot analysis. Moreover, SATB2 was effectively silenced in the three cell types after infection with AdsiSATB2 (Supplementary Fig. S1).
SATB2 regulates osteogenic differentiation of PDLSCs, DPSCs, and SHED
To further characterize the osteogenic potential of PDLSCs, DPSCs, and SHED, in vitro experiments were performed. First of all, ALP staining and ALP activity assay were carried out. We infected PDLSCs, DPSCs, and SHED with AdSATB2. The infection rate was controlled at 10%, 40%, and 80%. Cells infected with adenovirus only expressing GFP were applied as controls. ALP staining and ALP activity assay were performed on day 3. ALP staining levels positively correlated with the rate of SATB2 infection in PDLSCs, DPSCs, and SHED, with PDLSCs exhibiting more intense staining compared to DPSCs and SHED (Fig. 3A). Similar results were obtained with ALP activity assay. Quantitative ALP assays showed that SATB2 induced ALP activity in a dose-dependent manner in all three cell types, while significantly greater ALP activity was confirmed in PDLSCs compared to both types of pulp stem cells (Fig. 3B). ARS staining and quantification carried out 21 days after induction of osteodifferentiation were used to ascertain the presence of calcified nodules. Representative images of ARS staining in SATB2 overexpression cells at various infection rates, as well as in GFP-infected cells, are shown in Fig. 3C. ARS quantification results indicated that SATB2 markedly increased calcium nodule formation in comparison to the GFP-infected cells (Fig. 3D).
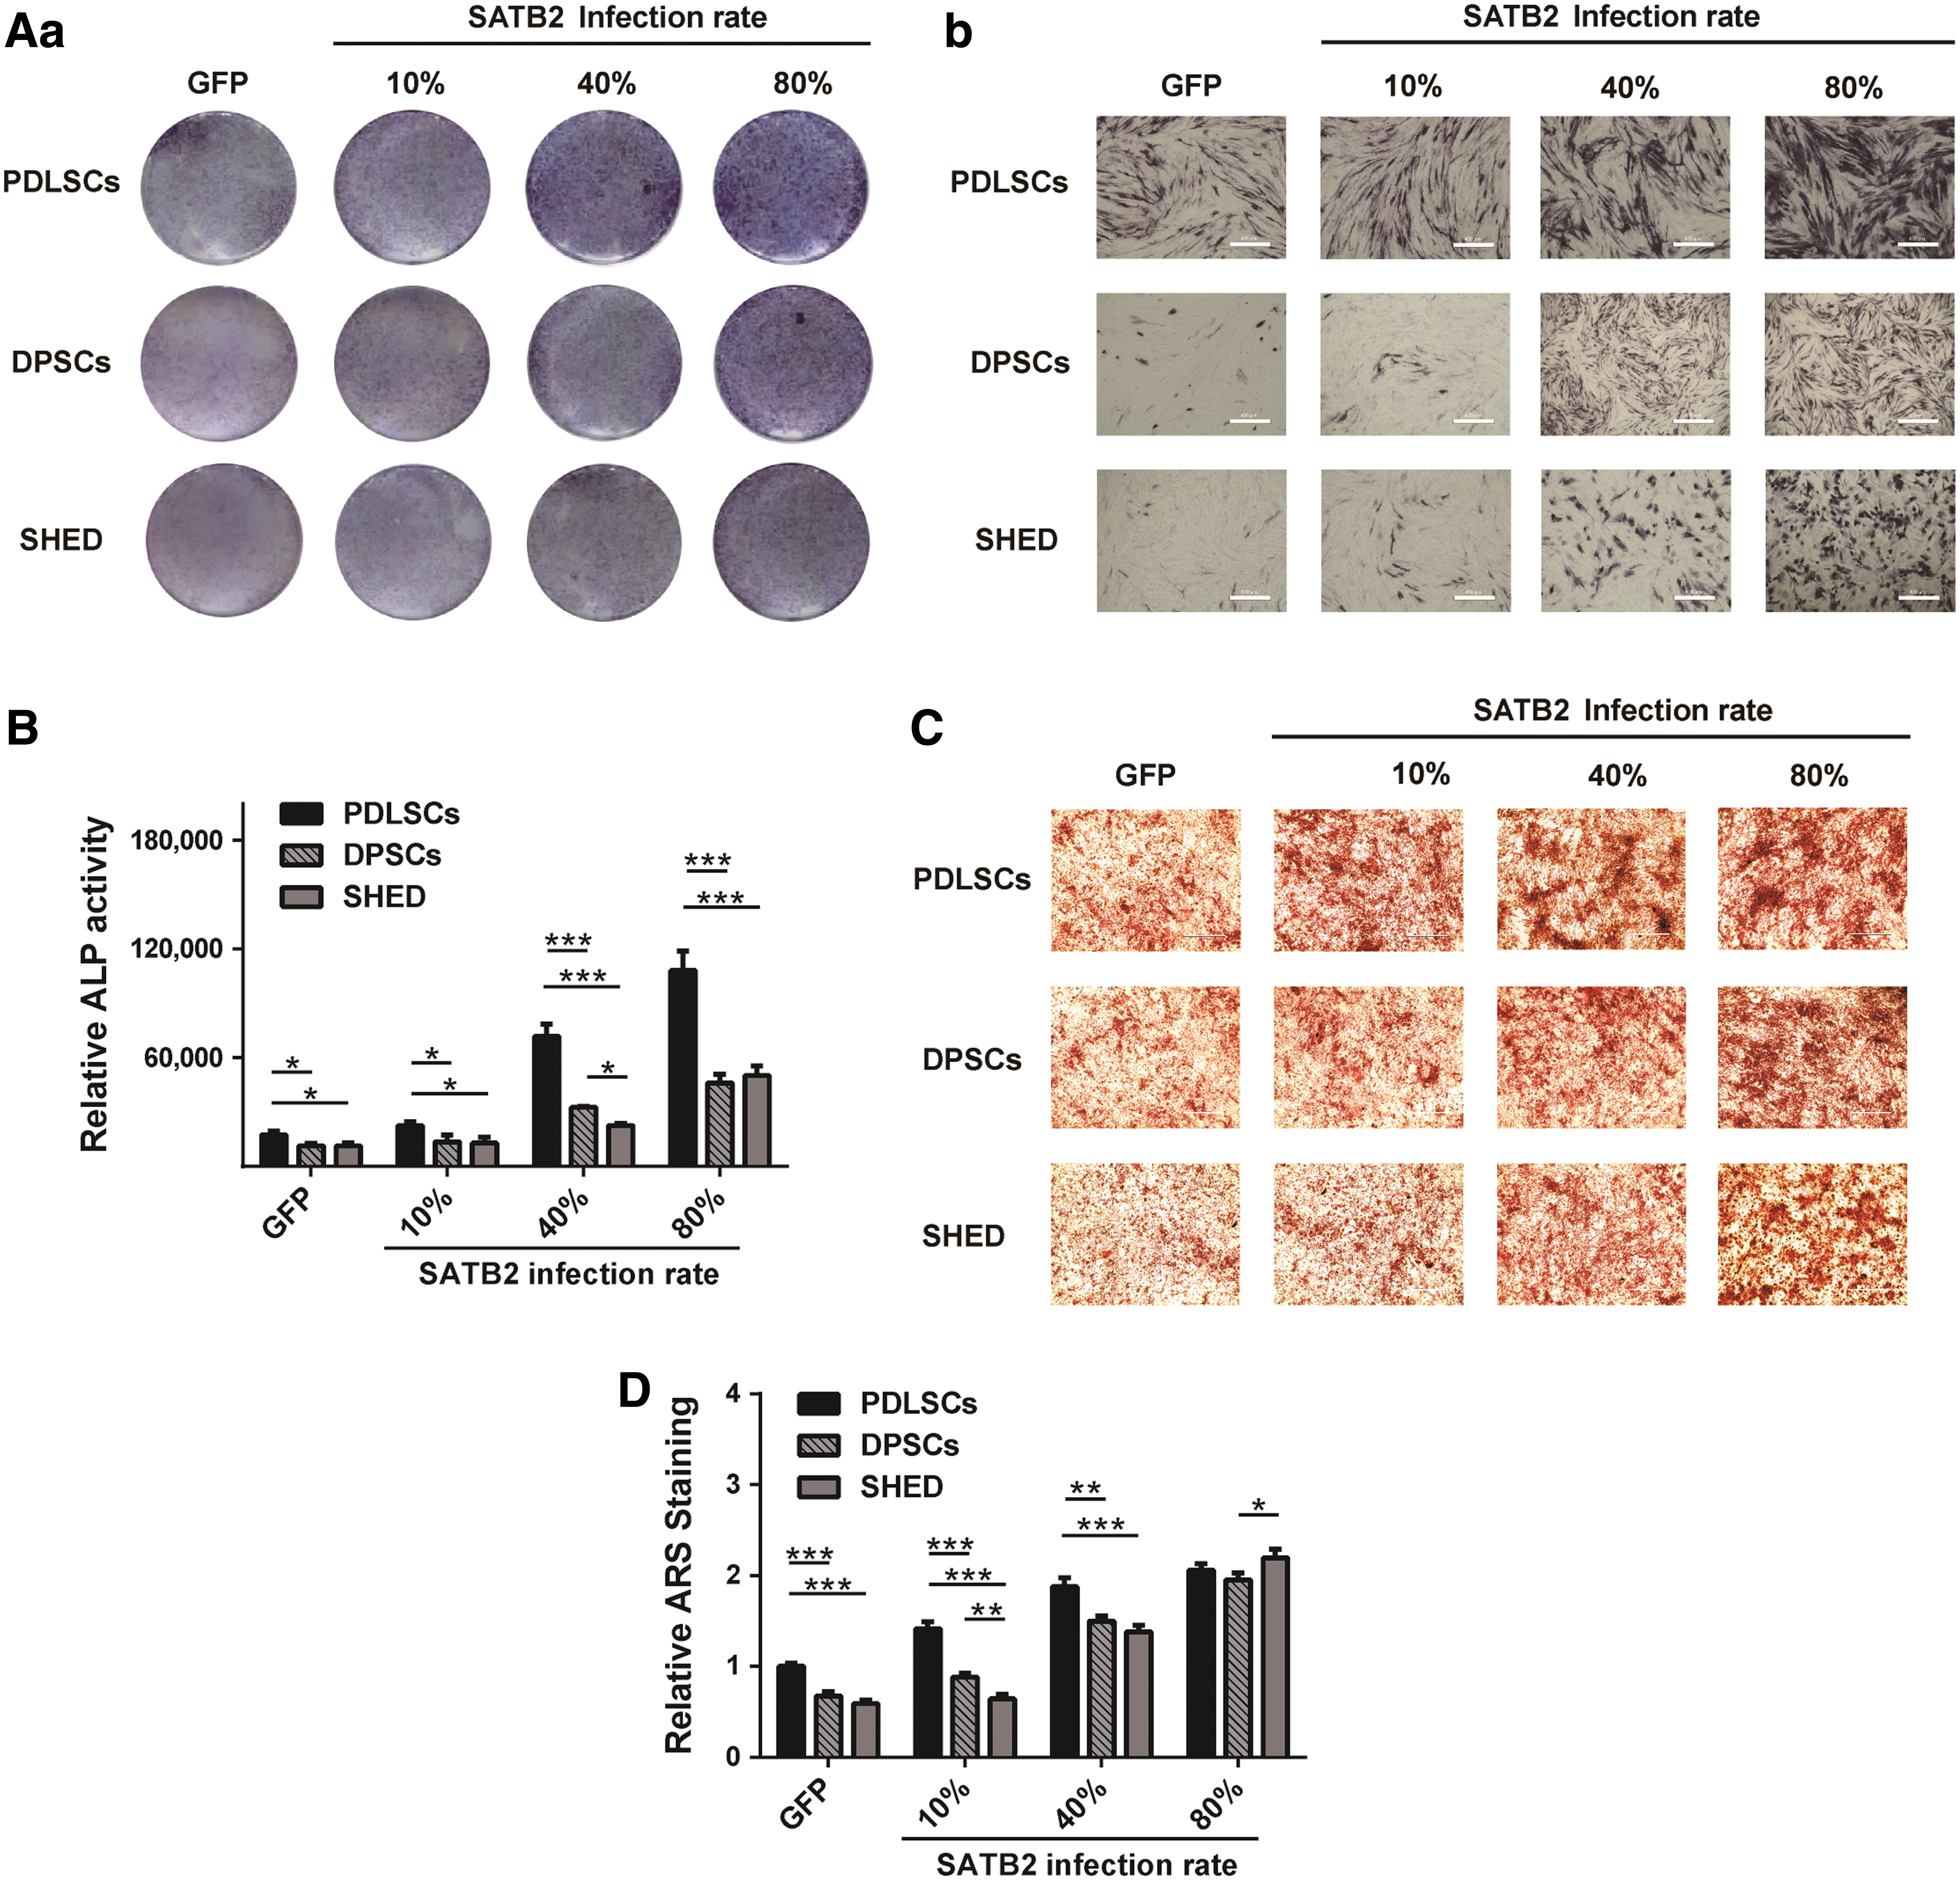
SATB2 contributes to osteogenesis.
We further infected PDLSCs, DPSCs, and SHED with AdsiSATB2 to explore the role of SATB2 in osteogenesis. The cells infected with adenovirus only expressing RFP were used as controls. When the three cell types were infected with AdsiSATB2, ALP staining and ALP activity tended to decrease with an increasing infection rate (Fig. 4A, B). Furthermore, siSATB2 distinctly decreased calcium nodule formation after induction of osteodifferentiation (Fig. 4C, D). Thus, these results suggested that SATB2 plays an important role in regulating the osteogenic differentiation of dental MSCs.

Silencing expression SATB2 decreases osteogenesis of PDLSCs, DPSCs, and SHED.
Mechanism of osteogenic differentiation regulated by SATB2
To explore the expression change of downstream osteogenic genes after overexpression SATB2, RNA-seq was carried out. The infection efficiency was 60% and cells were collected at 48 h after infection. The corresponding AdGFP-infected cells were applied as controls. In addition, serum-free medium was supplied to cultured cells 10 h before collection.
We filtered osteogenesis-related DEGs to further study. The gene expression profile in each osteogenic DEG set was evaluated and subjected to hierarchical cluster analysis. The heat map analysis indicated that SATB2 affected the expression of osteogenesis-related genes and this effect was not consistent in different cell types (Fig. 5A). Then, the upregulated and downregulated genes were counted. As shown in Fig. 5B, among osteogenesis-related genes, the upregulations were more numerous than the downregulations. However, genes upregulated after SATB2 overexpression shown in Fig. 5B included some genes that negatively regulated osteogenic differentiation. Therefore, genes positively regulating osteogenic differentiation were chosen following analysis. After application of the screening standards, 55, 50, and 53 DEGs were obtained from the comparison between SATB2 overexpression and control groups of PDLSCs, DPSCs, and SHED, respectively. Among DEGs, there were 35 upregulated and 20 downregulated genes in PDLSCs, 29 upregulated and 21 downregulated genes in DPSCs, and 29 upregulated and 24 downregulated genes in SHED (Fig. 5C).

The expression of downstream osteogenic genes of PDLSCs, DPSCs, and SHED after infection with AdSATB2. The dental MSCs infected with AdSATB2 were used as experiment group, while AdGFP as controls.
To verify the results of RNA-Seq analysis, nine DEGs were selected to confirm the expression pattern by qPCR. These nine DEGs were positive regulators of osteogenic differentiation and displayed remarkable upregulation in at least one AdSATB2-infected group, when compared to the corresponding AdGFP-infected group. The fold changes of these genes are shown in Fig. 6.
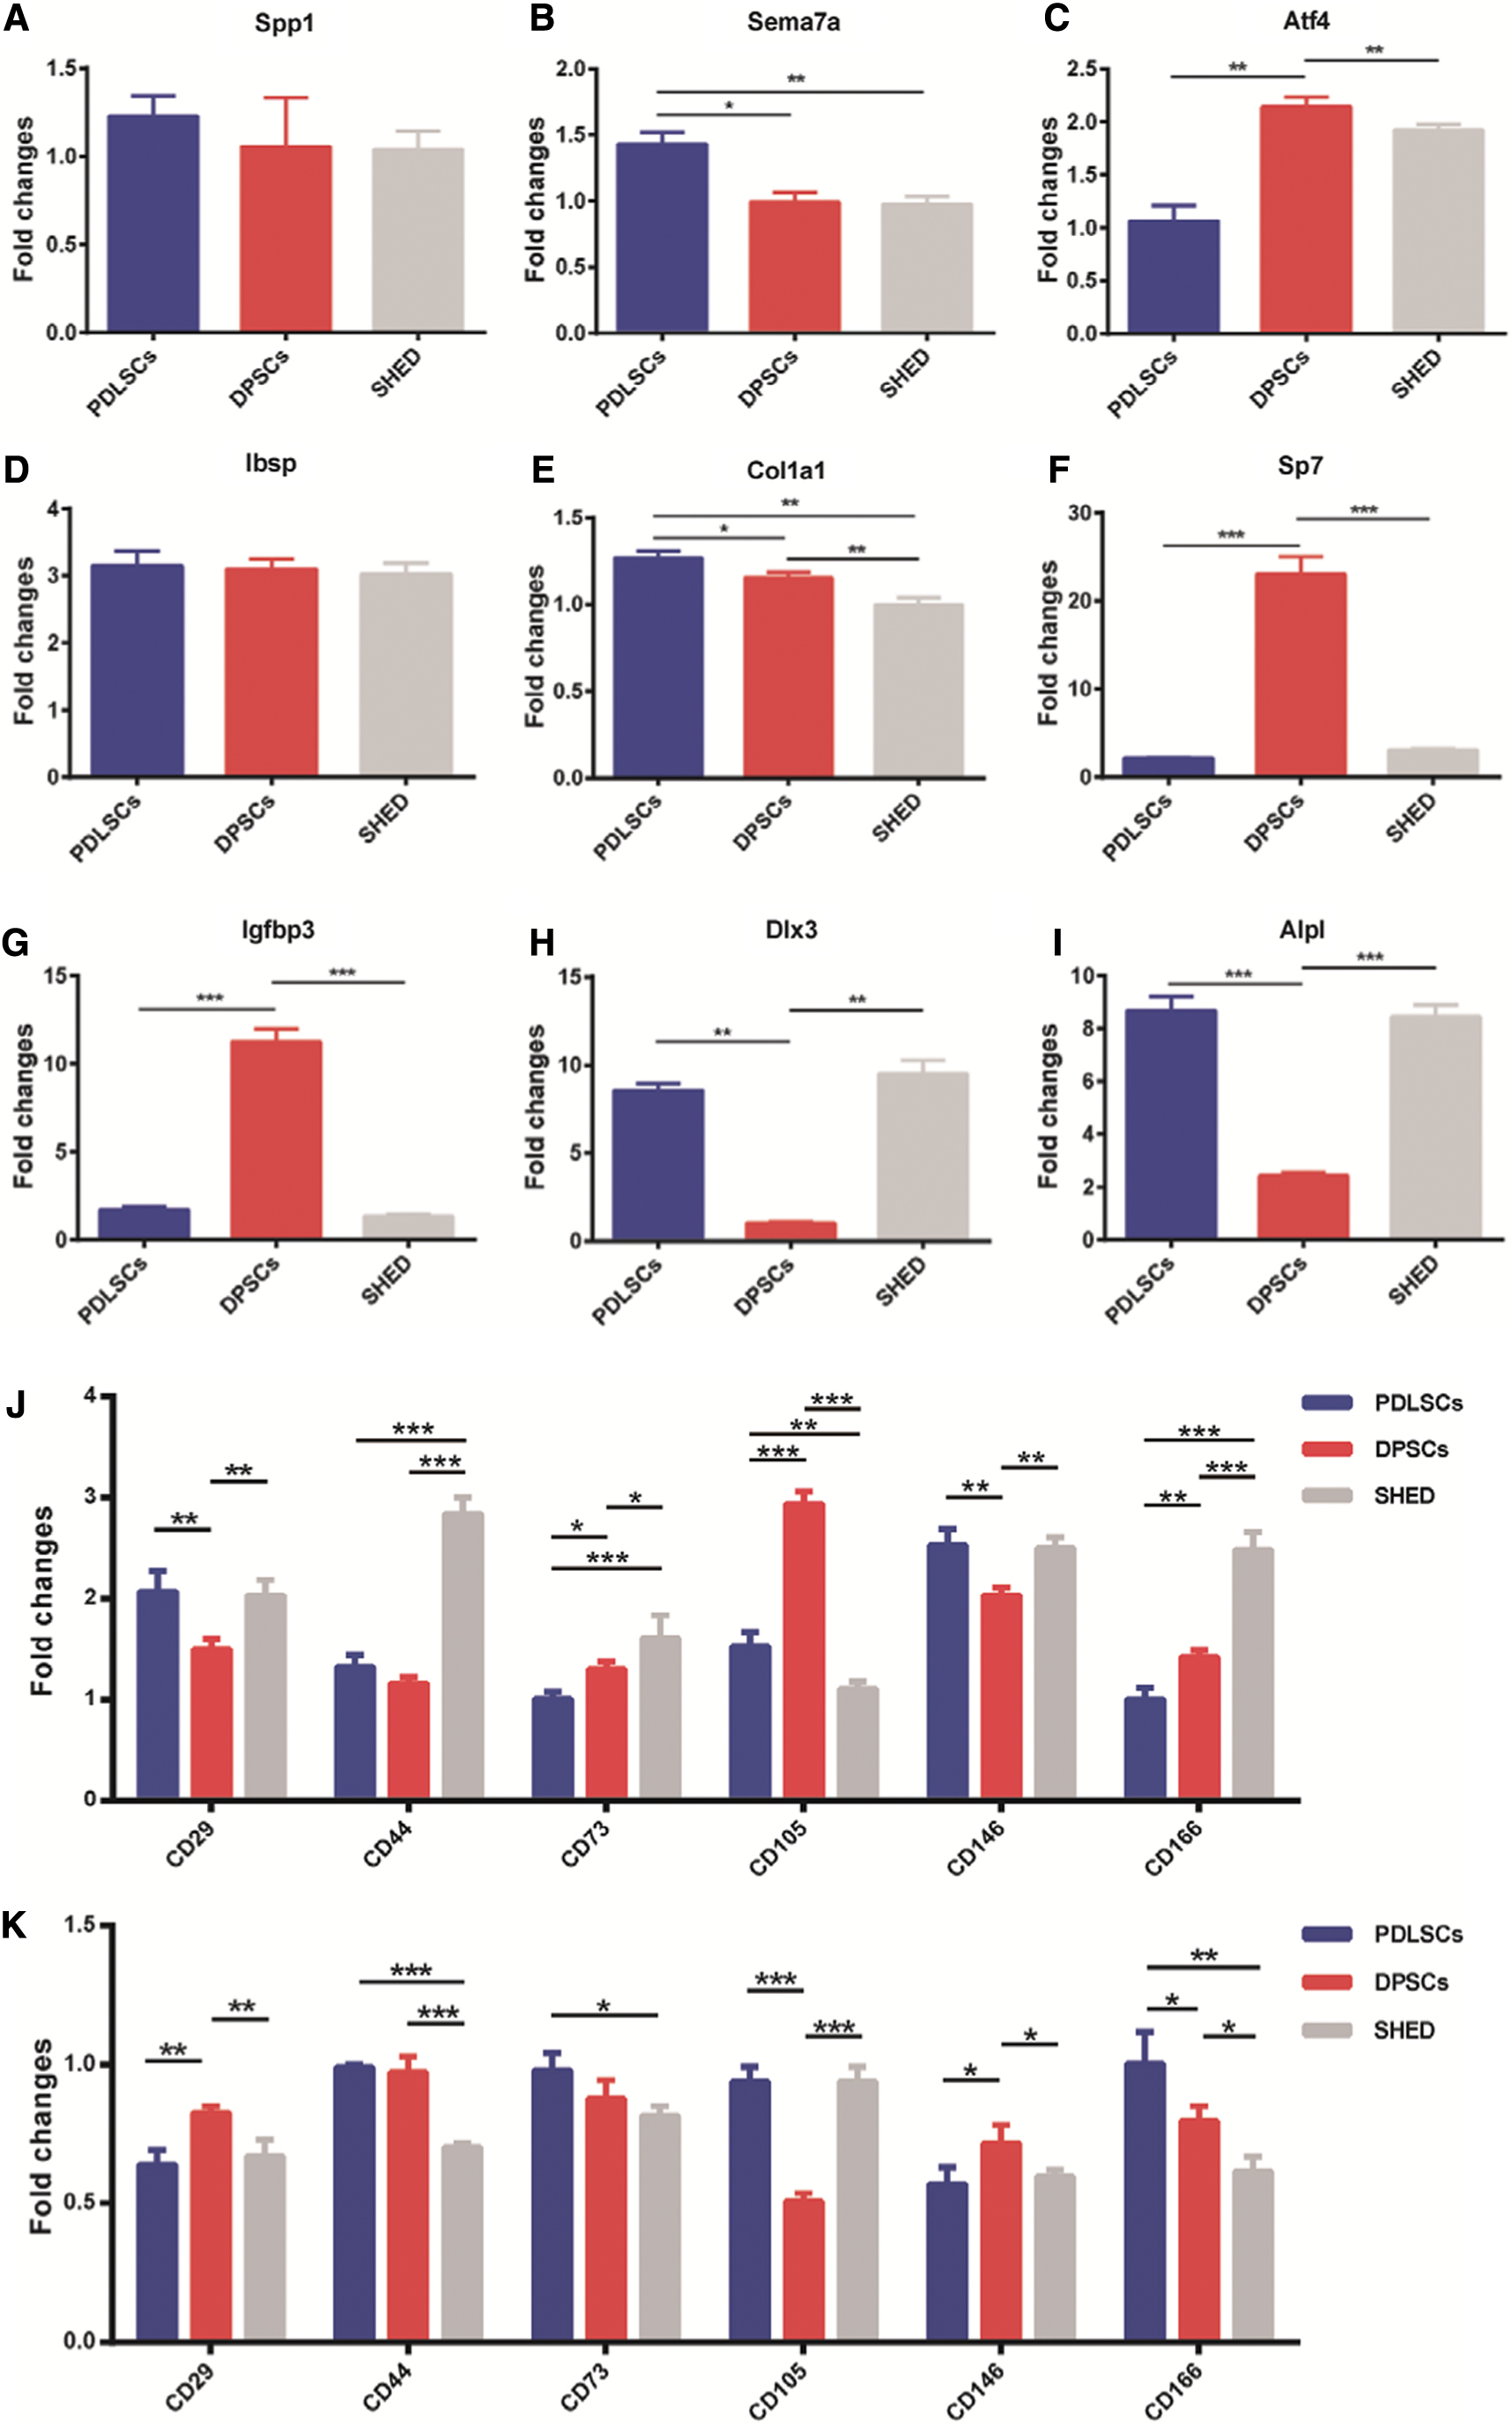
Validation of DEG expression profiles after SATB2 overexpression and the mRNA expression of MSC markers influenced by SATB2.
Based on qPCR, the genes for secreted phosphoprotein 1 (Spp1 and Opn) and semaphorin 7A (Sema7a), in PDLSCs, and for Atf4, in DPSCs and SHED, exhibited only a slight increase (Fig. 6A–C). Integrin-binding sialoprotein (Ibsp) showed a moderate increase, but no sharp differences in Ibsp increase were detected between the three groups (Fig. 6D). In addition, the expression of collagen, type I, alpha 1 (Col1a1) in PDLSCs was found increased (Fig. 6E). Finally, Sp7 transcription factor (Sp7 and Osx) and insulin-like growth factor binding protein 3 (Igfbp3) were significantly upregulated in DPSCs (Fig. 6F, G), while distal-less Homeobox 3 (Dlx3) and alkaline phosphatases (ALPL) showed a notable upregulation in PDLSCs and SHED (Fig. 6H, I).
SATB2 affects the expression of MSC markers
We evaluated the expression of MSC markers, including CD29, CD44, CD73, CD105, CD146, and CD166, to explore the influence of SATB2 on MSC markers. As shown in Fig. 6J and K, qPCR revealed that CD29, CD44, CD105, and CD146 in AdSATB2-infected PDLSCs were upregulated, while CD29 and CD146 in AdsiSATB2-infected PDLSCs were downregulated. CD29, CD73, CD105, CD146, and CD166 in AdSATB2-infected DPSCs were upregulated, while it showed opposite results after infection with AdsiSATB2. CD29, CD44, CD73, CD146, and CD166 in AdSATB2-infected SHED were upregulated, while it also showed opposite results after infection with AdsiSATB2. The result showed that overexpression SATB2 upregulated the expression of MSC markers. It was interesting that CD29 and CD146, which are reported to be osteogenesis related and positively expressed in PDLSCs, DPSCs, and SHED, were significantly affected by SATB2 in three cell types. These results indicated that SATB2 affected the expression of markers expressed by dental MSCs.
Discussion
In this study, RNA-seq analysis revealed that the genes regulating osteogenic differentiation were differentially expressed between PDLSCs, DPSCs, and SHED. In addition, in vitro experiments have confirmed that PDLSCs, DPSCs, and SHED have osteogenic potential, and that SATB2 is a potential positive regulator of osteogenic differentiation in dental MSCs.
The development of mammalian teeth is an intricate process that involves regulated interactions between the mesoderm, derived by the cranial neural crest, and the stomodeal ectoderm [41 –43]. Previous studies have revealed that diverse stem cell populations from teeth maintain a regenerative ability and generic MSC-like properties, to some extent, as they express marker genes and differentiate into mesenchymal cell lineages, such as adipocytes, osteoblasts, and chondrocytes, both in vitro and in vivo [44 –46]. However, there are some differences between the three cell types in terms of developmental process, structure, and function. It has been proved that dental MSCs have a strong, but heterogeneous osteogenic potential [9]. A previous study compared the osteogenic differentiation potential of human DPSCs, SHED, and BMSCs, and showed that SHED exhibited the highest level of basic fibroblast growth factor (βFGF) and bone morphogenetic protein 2 (BMP2) expression [47]. Winning et al. showed that PDLSCs exhibit a significantly higher osteogenic differentiation potential, compared to DPSCs and SHED [48]. Chadipiralla et al. also showed that PDLSCs have a greater osteogenic potential than SHED [49]. Another study using Raman microspectroscopy described mineral formation by dental MSCs, revealing clear differences in this ability in distinct dental MSCs. Major differences were found in both organic and inorganic composition [50]. In this study, we found that the mRNA expression of osteogenesis-related genes was different in PDLSCs, DPSCs, and SHED. In vitro experiments confirmed that PDLSCs exhibited more intense ALP and ARS staining, as well as a greater ALP activity. These findings were consistent with previous results. Owing to the close relationship between the periodontal ligament and the alveolar bone, it was reasonable to expect that PDLSCs had a greater osteogenic potential. Thus, PDLSCs may have a stronger capacity in the repair of damaged bone tissue and the regeneration of alveolar bone, compared to DPSCs and SHED.
SATB2 has previously been indicated as a positive regulator of osteoblast differentiation, bone formation, and bone regeneration [51,52]. A previous study reported that the transplantation of adult stem cells with overexpression SATB2 to the mandibular bone defect accelerated the formation of new bone [18]. Another study confirmed that local delivery of BMSCs with overexpression SATB2 evidently promoted titanium implant osseointegration [53]. Moreover, it has been confirmed that SATB2 siRNA inhibited osteogenic differentiation of PDLSCs in high glucose microenvironment [54]. This study confirmed that PDLSCs, DPSCs, and SHED exhibited stronger osteogenic differentiation when infected with AdSATB2, while infection with AdsiSATB2 yielded opposite results. In brief, SATB2 affected osteogenic differentiation of various dental MSCs. Therefore, tissue regenerative engineering, based on SATB2 and dental MSCs, would show tremendous potential for tissue repair.
It was reported that SATB2 interacts with Atf4 and Runx2, and improves the ability of these proteins to enhance the expression of osteocalcin (Ocn) and bone sialoprotein (Bsp and Ibsp), which are critical components in osteoblast formation [55 –58]. In addition, a study has indicated that SATB2 is a downstream target gene of osterix (Osx and Sp7) [59]. Zhao et al. indicated that SATB2 upregulates Osx expression by a Runx2-independent mechanism and synergistically enhances the effect of Runx2 on the Osx promoter [51]. In addition, SATB2 can also repress Hox genes, such as homeobox a2 (Hoxa2), which is the bone formation inhibitor and branchial arch patterning regulator [55]. In this study, RNA-seq analysis showed that many genes positively regulating osteoblast differentiation were upregulated after SATB2 overexpression. The results of qPCR confirmed that nine genes (Spp1, Sema7a, Atf4, Ibsp, Col1a1, Sp7, Igfbp3, Dlx3, and Alpl) were upregulated, to various extents, following SATB2 overexpression. Thus, SATB2 was an osteogenic differentiation and bone reconstruction regulator through affecting multiple osteogenic transcriptional factors. A study has reported that SATB2 expression was suppressed by tumor necrosis factor-α (TNF-α) through inhibiting the smad1/5/8 signaling pathway and activating MAPK-ERK signaling pathway and nuclear factor κB (NF-κB) signaling pathway, thus inhibiting osteoblast differentiation [60]. The detailed mechanism of the regulation of osteogenic differentiation by SATB2 needs to be further explored in the future.
Unfortunately, we conducted stem cell implantation-mediated ectopic bone formation to explore osteogenesis in vivo. Three groups of cells, infected with AdSATB2 or AdGFP, were transplanted subcutaneously into the flanks of athymic nude (nu/nu) mice. However, 4 weeks postimplantation, no obvious mass was found. To explore osteogenesis in vivo, subcutaneous transplantations of the cell mixture with hydroxyapatite or other biomaterials should be performed in further study.
Conclusions
The results indicated that SATB2 was expressed at a relatively high level in PDLSCs, DPSCs, and SHED. It also suggested that SATB2 regulated the osteogenic differentiation of PDLSCs, DPSCs, and SHED. The results may have implications for bone tissue engineering applications based on dental MSCs. Future studies should focus on SATB2-mediated regulation of osteoblast differentiation and the possible therapeutic value in the regeneration of defective craniofacial bone tissue.
Footnotes
Author Disclosure Statement
The authors declare no competing financial interests.
Funding Information
The reported work was supported, in part, by research grants from the National Natural Science Fundation of China (no. 81870758 to H.Z.), Chongqing Research Program of Basic Research and Frontier Technology (no. cstc2017jcyjAX0020 to H.Z.), Chongqing Municipal Commission on Science and Technology (no. cstc2017jcyjAX0434 to W.L.), and Chongqing YuzhongDistrict Commission on Science and Technology (no. 20160118 to W.L.). Funding sources were not involved in the study design; in the collection, analysis and interpretation of data; in the writing of the report; and in the decision to submit the article for publication.
Supplementary Material
Supplementary Figure S1
References
Supplementary Material
Please find the following supplemental material available below.
For Open Access articles published under a Creative Commons License, all supplemental material carries the same license as the article it is associated with.
For non-Open Access articles published, all supplemental material carries a non-exclusive license, and permission requests for re-use of supplemental material or any part of supplemental material shall be sent directly to the copyright owner as specified in the copyright notice associated with the article.