
Abstract
Human induced pluripotent stem cells (iPSCs) can be differentiated along various neuronal lineages to generate two-dimensional neuronal cultures as well as three-dimensional brain organoids. Such iPSC-derived cellular models are being utilized to study the basic biology of human neuronal function and to interrogate the molecular underpinnings of disease biology. The different cellular models generated from iPSCs have varying properties in terms of the diversity and organization of the cells as well as the cellular functions that are present. To understand transcriptomic differences in iPSC-derived monolayer neuronal cultures and three-dimensional brain organoids, we differentiated eight human iPSC lines from healthy control subjects to generate cerebral organoids and cortical neuron monolayer cultures from the same set of iPSC lines. We undertook RNA-seq experiments in these model systems and analyzed the gene expression data to identify genes that are differentially expressed in cerebral organoids and two-dimensional cortical neuron cultures. In cerebral organoids, gene ontology analysis showed enrichment of genes involved in tissue development, response to stimuli, and the interferon-γ pathway, while two-dimensional cortical neuron cultures showed enrichment of genes involved in nervous system development and neurogenesis. We also undertook comparative analysis of these gene expression profiles with transcriptomic data from the human fetal prefrontal cortex (PFC). This analysis showed greater overlap of the fetal PFC transcriptome with cerebral organoid gene expression profiles compared to monolayer cortical neuron culture profiles. Our studies delineate the transcriptomic differences between cortical neuron monolayer cultures and three-dimensional cerebral organoids and can help inform the appropriate use of these model systems to address specific scientific questions.
Introduction
Investigation of human neurobiology has historically had significant challenges due to the inability to study live human neuronal tissue. Studies of human brain development have primarily relied on postmortem brain tissue, brain neuroimaging, and extrapolation from animal studies. The ability to reprogram somatic cells to induced pluripotent stem cells (iPSCs) has opened new avenues to culture and grow human neuronal cells ex vivo to study human brain development [1]. Human iPSCs can be differentiated to generate a wide range of neuronal and glial cells, including many cell types relevant to disease biology [2 –6]. These techniques utilizing iPSC-derived neuronal cultures are being used widely both to study the neurobiology of brain development as well as to study the cellular processes relevant to the disease biology of neuropsychiatric disorders [7 –12]. Recent advances in tissue engineering have also resulted in methods to generate three-dimensional cerebral organoids from human iPSCs [13,14]. Cerebral organoids rely on self-organizing abilities of iPSC-derived progenitor cells to recapitulate human cortical development and give rise to many cell types and interconnections found in the human brain [15 –18]. These cerebral organoids include mature cortical neuron subtypes and synapses and exhibit functional properties in terms of neuronal firing [19].
We undertook RNA-seq experiments to compare gene expression profiles in cerebral organoids and neuronal cultures generated from the same eight human iPSC lines. We analyzed differentially expressed genes (DEGs) in 6-month-old cerebral organoids and 3-month-old two-dimensional cortical neuron cultures. These time points are often used for the study of human pluripotent stem cell-derived models since a diverse array of mature neuronal cells are present at those time points [20,21]. Analyses of the transcriptomic data from cerebral organoids and cortical neuron cultures showed relative enrichment of genes involved in tissue development, cellular response, and adhesion in the cerebral organoids, while showing relative enrichment in genes involved in neurogenesis in the monolayer neuron cultures. Gene Set Enrichment Analysis (GSEA) showed that the transcriptome profiles of cerebral organoids had positive correlation to inflammatory signaling, chemical stimulus, and collagen formation, consistent with the gene ontology (GO) analysis. We also compared these transcriptomic profiles with gene expression data in human fetal prefrontal cortex (PFC) at different stages of development and found a greater overlap of the PFC gene expression profiles with the transcriptomic profile from cerebral organoids.
Methods
Differentiation of iPSCs to two-dimensional cortical neuron cultures
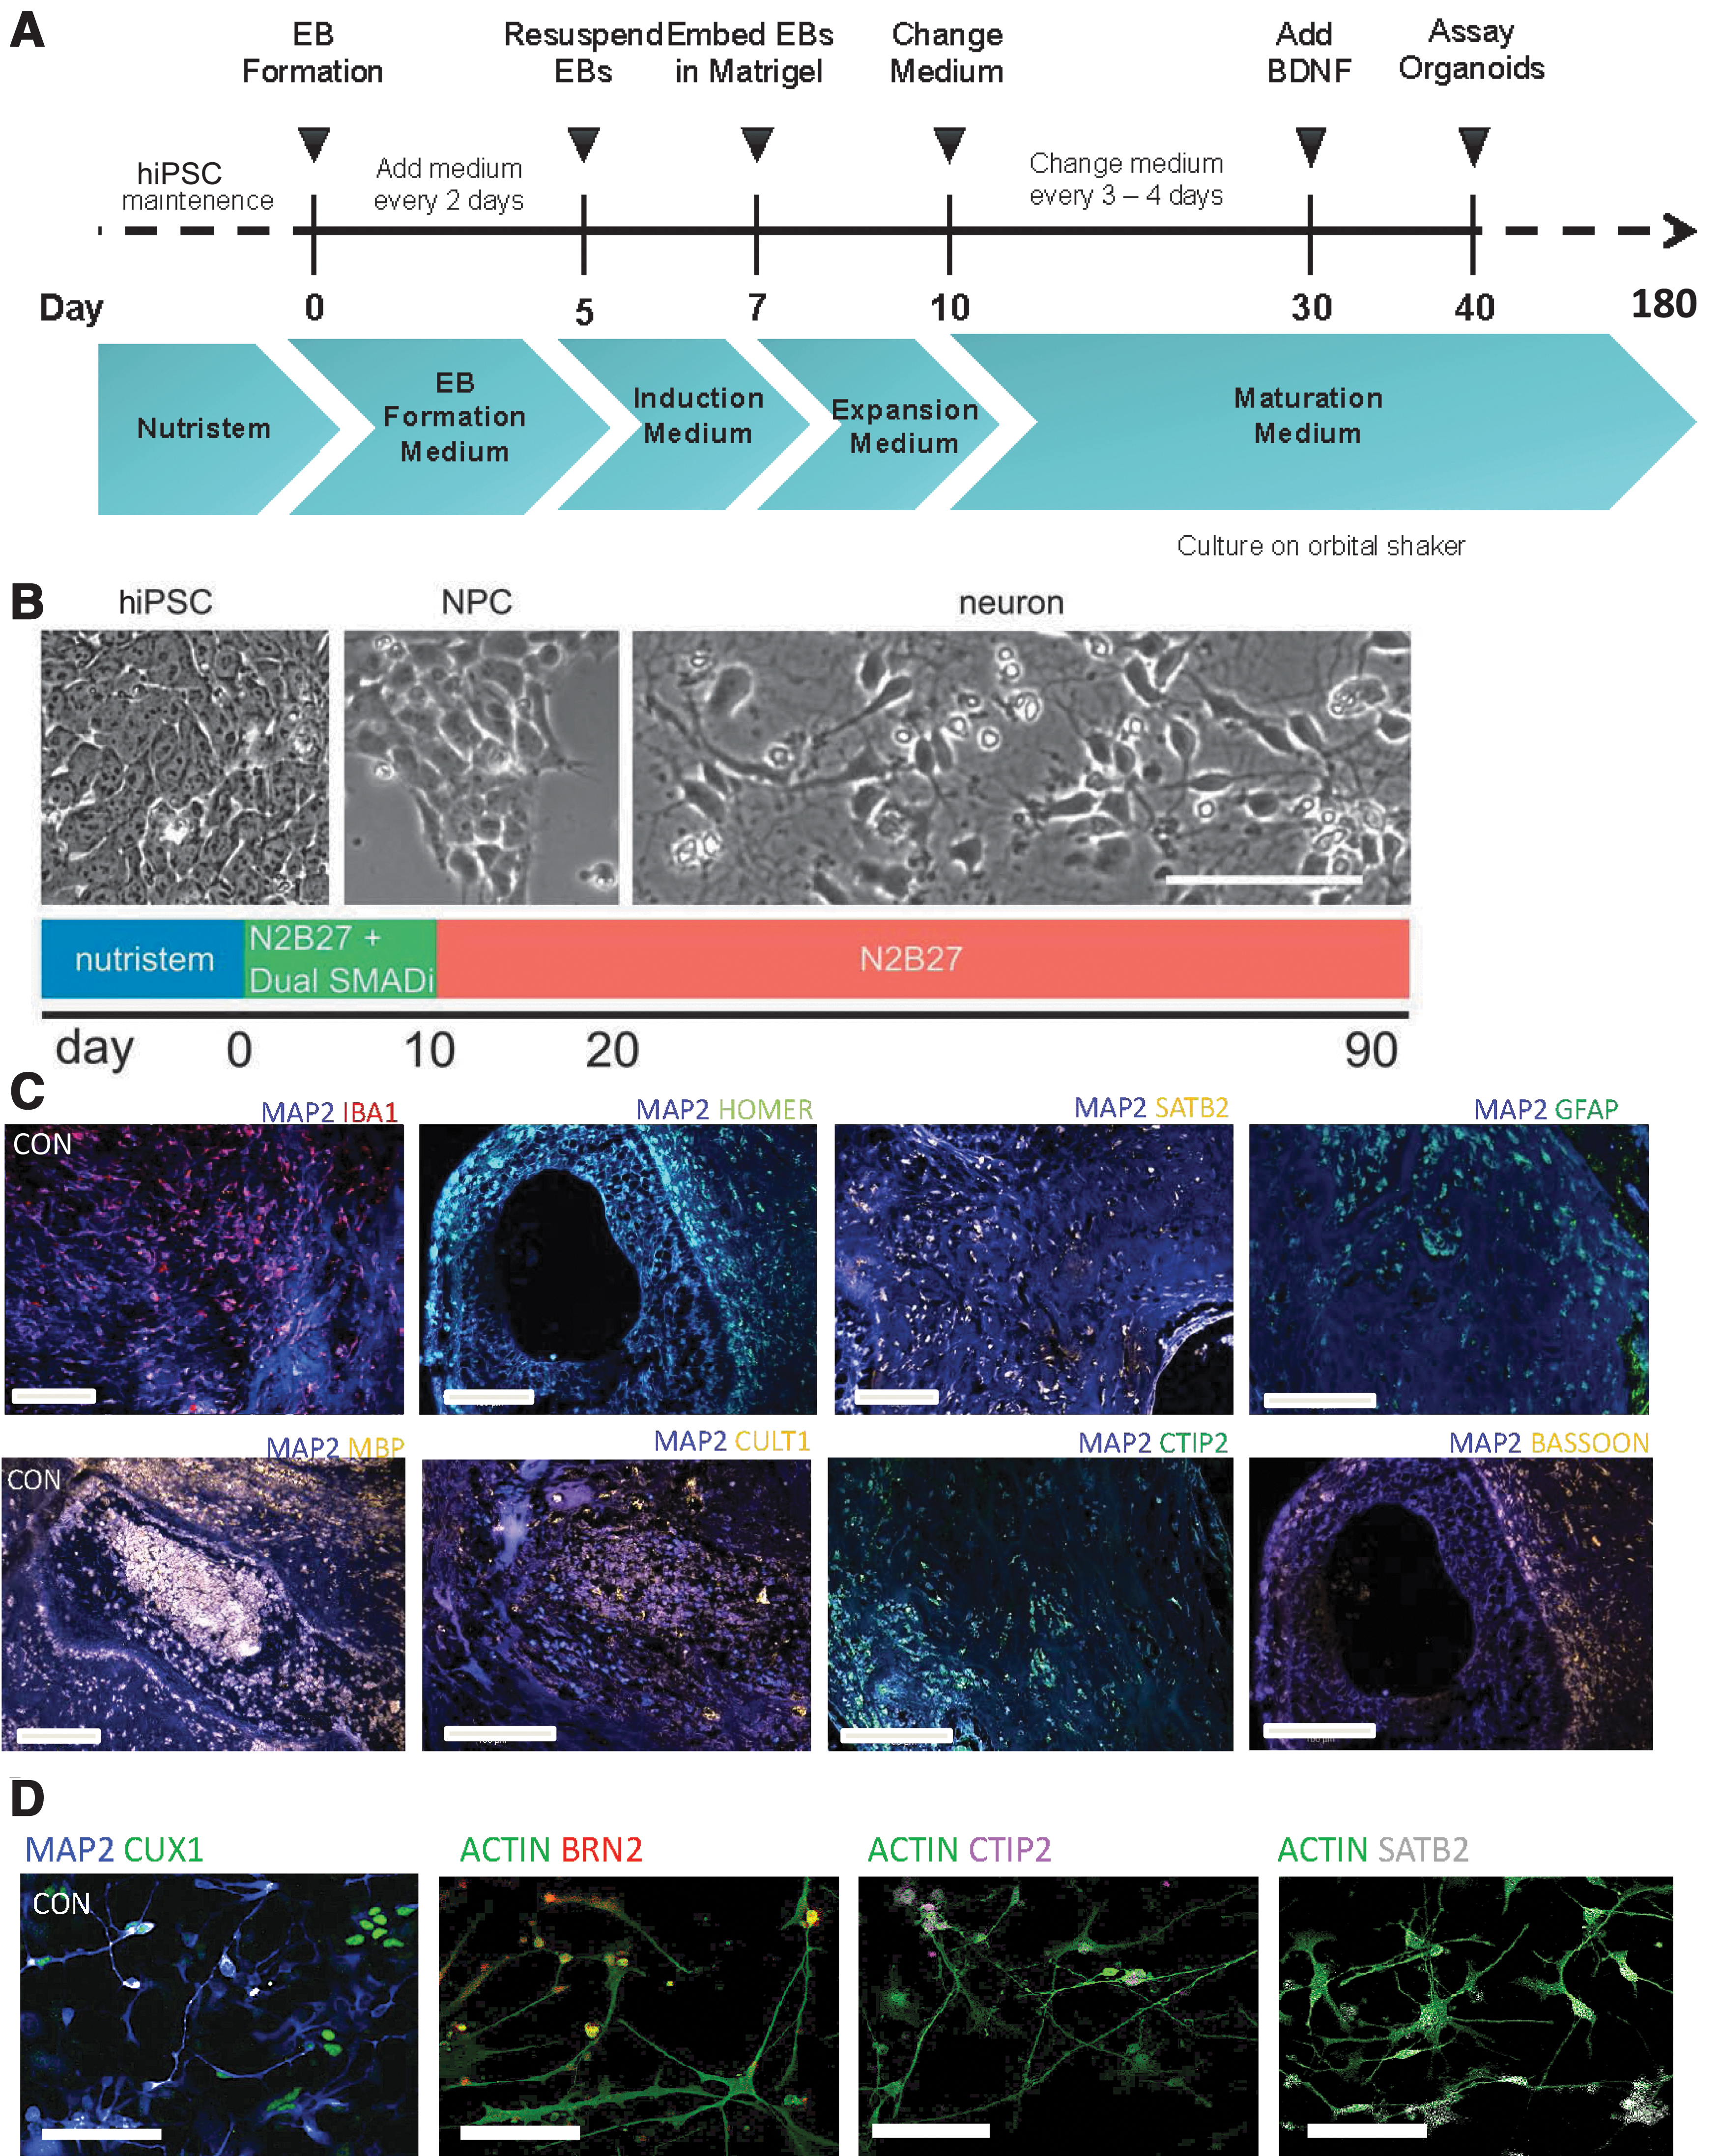
We used eight human iPSC lines reprogrammed from fibroblasts of healthy control subjects and characterized using standard protocols, with approval from the Massachusetts General Hospital and the McLean Hospital Institutional Review Boards (IRBs), as described previously [22 –24]. Cortical neurons were differentiated from human iPSCs that had been cultured and maintained in NutriStem media (Stemgent; 01-0005) using established published protocols [21]. Confluent iPSCs were maintained in N2/B27 medium, comprised half N2 medium, 485 mL Neurobasal medium (Life Technologies; 21103049), 5 mL N-2 supplement (Gibco; 17502001), 5 mL GlutaMAX (ThermoFisher Scientific; 35050061), 5 mL penicillin-streptomycin (Gibco; 15140122) and half B-27 medium 10 mL B-27 supplement (Gibco; 17504044), 480 mL Dulbecco's modified Eagle's medium (DMEM) (Sigma-Aldrich; D6421), 5 mL GlutaMAX (ThermoFisher Scientific; 35050061), 5 mL penicillin-streptomycin (Gibco; 15140122). On days 1–7, the medium was supplemented with 10 μM SB431542 (Sigma-Aldrich; S4317), 1 μM dorsomorphin (Sigma-Aldrich; P5499), and 100 nM LDN193189 (Sigma-Aldrich; SML0599), with medium replaced daily. On days 8–29, the culture was fed daily with the N2/B27 medium. On days 30–90, cells were maintained on BrainPhys neuronal media (StemCell Technologies; 05790) with B-27 supplement, and the medium was changed twice a week.
Generation of three-dimensional cerebral organoids from human iPSCs
Cerebral organoids were generated with standard published protocols [25] and utilizing STEMdiff™ Cerebral Organoid Kit (StemCell Technologies; 08570). Human iPSCs were cultured and maintained in NutriStem medium and plated at high density on U-bottom plates to form embryoid bodies (EBs), which were then maintained in EB formation medium for days 1–5, with medium changed every other day. The EBs were resuspended in induction media on day 5. On Day 7, EBs were embedded in Matrigel and maintained in expansion medium. On day 10, they were switched to low attachment plates and maintained in expansion medium, with medium changed twice weekly. On day 30, the medium was supplemented with brain-derived neurotrophic factor with continued medium changes twice weekly as the organoids matured.
RNA extraction
To obtain RNA, cerebral organoids were added to sterile Eppendorf tubes with 500 μL TRIzol (ThermoFisher) and 5 mm stainless steel beads (Qiagen), which were shaken for 10 min with TissueLyser II (Qiagen). The resulting liquid was transferred to a new Eppendorf tube and 200 μL chloroform added. The tube was inverted three times and spun for 20 min at 14,000 g at 4°C. A clear liquid was obtained, which was used in conjunction with the Qiagen RNeasy RNA Mini Kit to obtain RNA samples. RNA extraction from the monolayer cortical neuron cultures was undertaken using standard protocols with the Qiagen RNeasy RNA Mini Kit. List of primers Supplementary Table S5.
Transcriptome analysis
The Illumina Ribo-Zero TruSeq Stranded Total RNA Library Prep Kit (Illumina) was used to construct the RNA-seq library and the Illumina NovaSeq6000 platform was used for sequencing in the 100 nt, paired-end configuration. An average of 60 million reads was obtained for each sample. Trimmed reads with Cutadapt were aligned to the reference genome (hg38 UCSC assembly) for gene expression analyses, using TopHat v2.0.14 and Bowtie v2.10 with default parameters and RefSeq annotation (genome-build GRCh38.p9) [26]. Cufflinks v2.2.1 was used to analyze the distribution of alignments and FPKM (fragments per kilobase of exon model per million reads mapped) values were quantile normalized. Cuffdiff v2.2.1 was used to perform differential expression testing (Supplementary File S1) [27,28]. The false discovery rate (FDR) was 0.05, and sex differences were not considered.
GO & GSEAs
GO and KEGG analysis were used on all differentially regulated genes with the Functional Enrichment Analysis unit of HOMER v.3 for process, localization, and molecular function (31). MetaCore+MetaDrug™ version 19.1 build 69600 was used to analyze metabolic processes. The genes depicted in the figures are the ones that reached significance (P < 0.05).
Paraffin embedding
Cerebral organoids were fixed in 4% PFA for 30 min, rinsed 3 × in PBS, and dehydrated in a series of ethanol and xylene washes (75% ethanol: 40 min, 80% ethanol: 40 min, 95% ethanol: 1:20 min, 100% ethanol: 25 min, 100% ethanol: 25 min, 100% ethanol: 30 min, xylene: 30 min, xylene: 30 min, xylene: 1 h, paraffin: 1 h, and paraffin: 1 h). The organoids were then embedded in a paraffin block and sectioned on a microtome at 10 μm thickness. Sections were placed on a 24 well glass-bottom imaging plate (Greiner Bio-One) and the plate was heated to 60°C to adhere the paraffin to the plate.
Immunohistochemistry
Sections were rinsed with PBs and PBST (PBS +0.1% Triton X) for 10 min and were subsequently blocked in PBS +2.5% goat serum and 2.5% donkey serum for 1 h. The sections were then stained in primary antibodies diluted in PBS +1% goat serum and 1% donkey serum overnight at 4°C. The sections were rinsed 3 × in PBS and were then incubated in secondary antibodies diluted in PBS +1% goat serum and 1% donkey serum for 1 h at room temperature. Slides were rinsed 3 × and Prolong Gold antifade was added. The primary and secondary antibodies used are listed in Supplementary Tables S1 and S2.
Immunocytochemistry
Cells were fixed for 30 min with 4% PFA, washed 3 × with PBS, and permeabilized in PBST. The cells were then blocked for 1 h in PBS +2.5% goat serum and 2.5% donkey serum. The cells were incubated in primary antibodies diluted in PBS +1% goat serum and 1% donkey serum overnight at 4°C. Following PBS washes, secondary antibodies diluted in PBS +1% goat serum and 1% donkey serum were applied for 1 h at room temperature. The cells were then rinsed 3 × with PBS and Prolong Gold antifade was added. The primary and secondary antibodies used are listed in Supplementary Tables S1 and S2.
Results
Generation and characterization of cerebral organoids and cortical neurons
Eight human iPSC lines reprogrammed from fibroblasts of healthy control subjects, and characterized using standard protocols (Supplementary File S2, S3, S4) as described previously [22 –24], were differentiated to generate cerebral organoids and monolayer cortical neuron cultures [21,25]. We characterized the cerebral organoids and cortical neuron cultures with marker analysis, as described previously [22,23]. Both the cerebral organoid tissues and monolayer cortical neuron cultures were positive for a range of neuronal and glial cells, including cortical neurons expressing layer-specific markers such as CUX1, SATB2, and CTIP2 (Fig. 1C, D). All the cerebral organoids showed expression of a range of neuronal and glial cell markers, as we had described previously: MAP2, Ctip2, Satb2, Pax6, TBR2, Cux1, LHX6, glutamine synthetase (GS), GFAP, oligodendrocytes-specific protein/claudin11 (OSP), myelin basic protein (MBP), and IBA1 (Fig. 1C) [24]. Moreover, when the different cell types were quantified in organoids generated from the different iPSC lines, they showed a consistency in the proportion of cell types in the different organoids (Supplementary Fig. S1) [24]. We undertook total RNA-seq using RNA isolated from the cerebral organoids and the cortical neuron cultures. We generated a heatmap and a volcano plot depicting DEGs, which show distinct differences in gene expression patterns in cerebral organoids generated from the eight iPSC lines when compared to cortical neuron monolayer cultures differentiated from the same iPSC lines (Fig. 2A, B).
Three-dimensional cerebral organoids and cortical neurons in monolayer differentiated from human iPSCs.
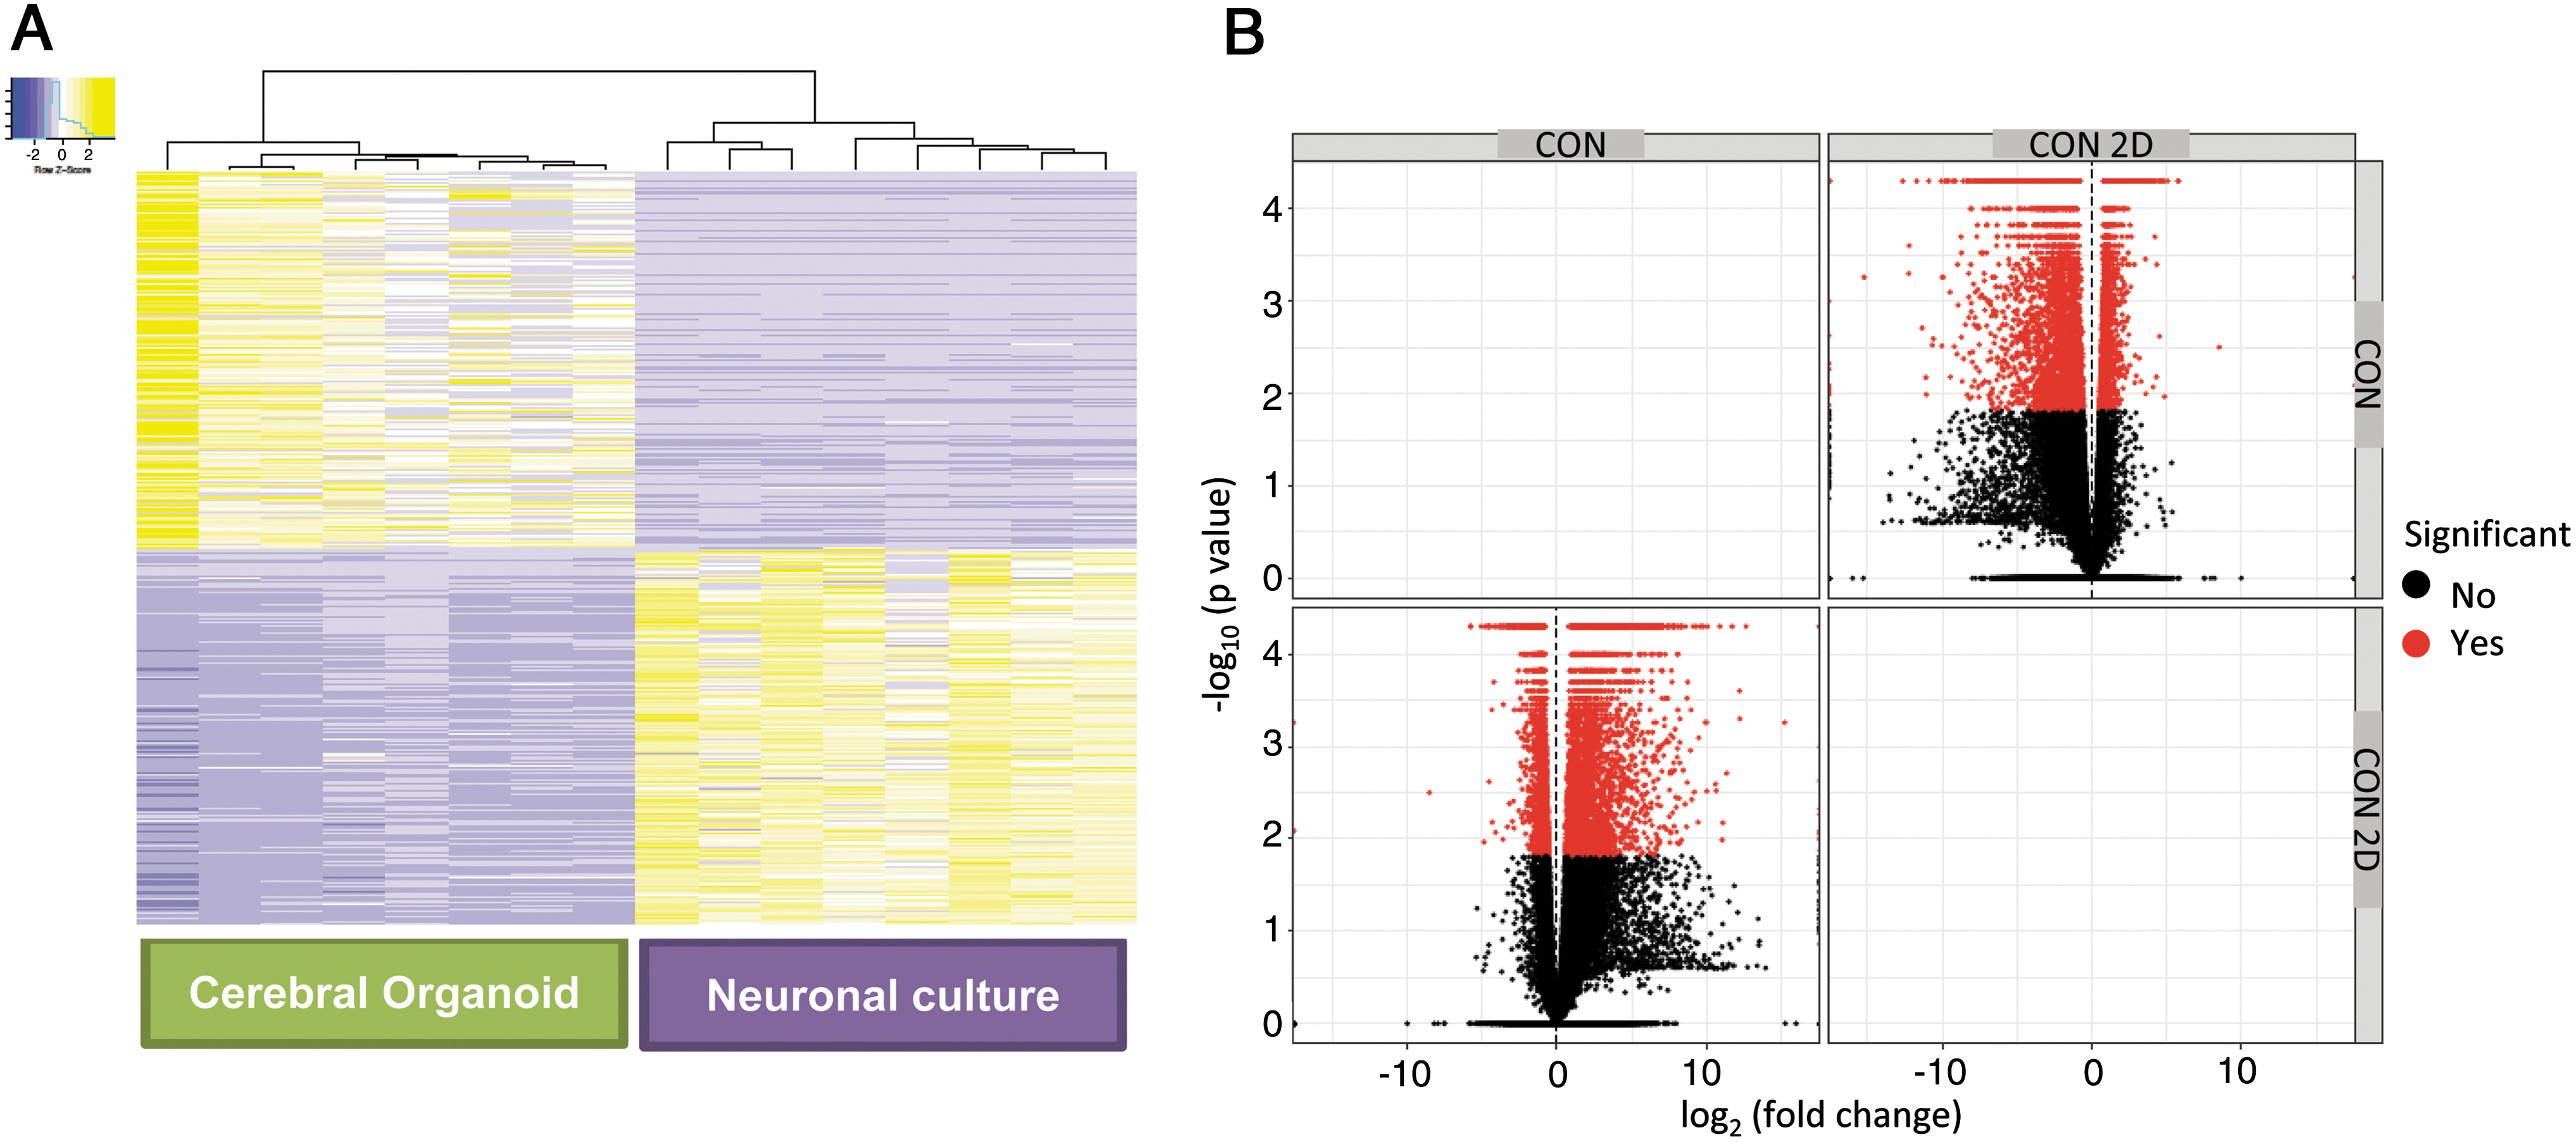
Gene expression profiles of cerebral organoids and cortical neuron cultures in monolayer differentiated from human iPSCs.
GO and GSEA
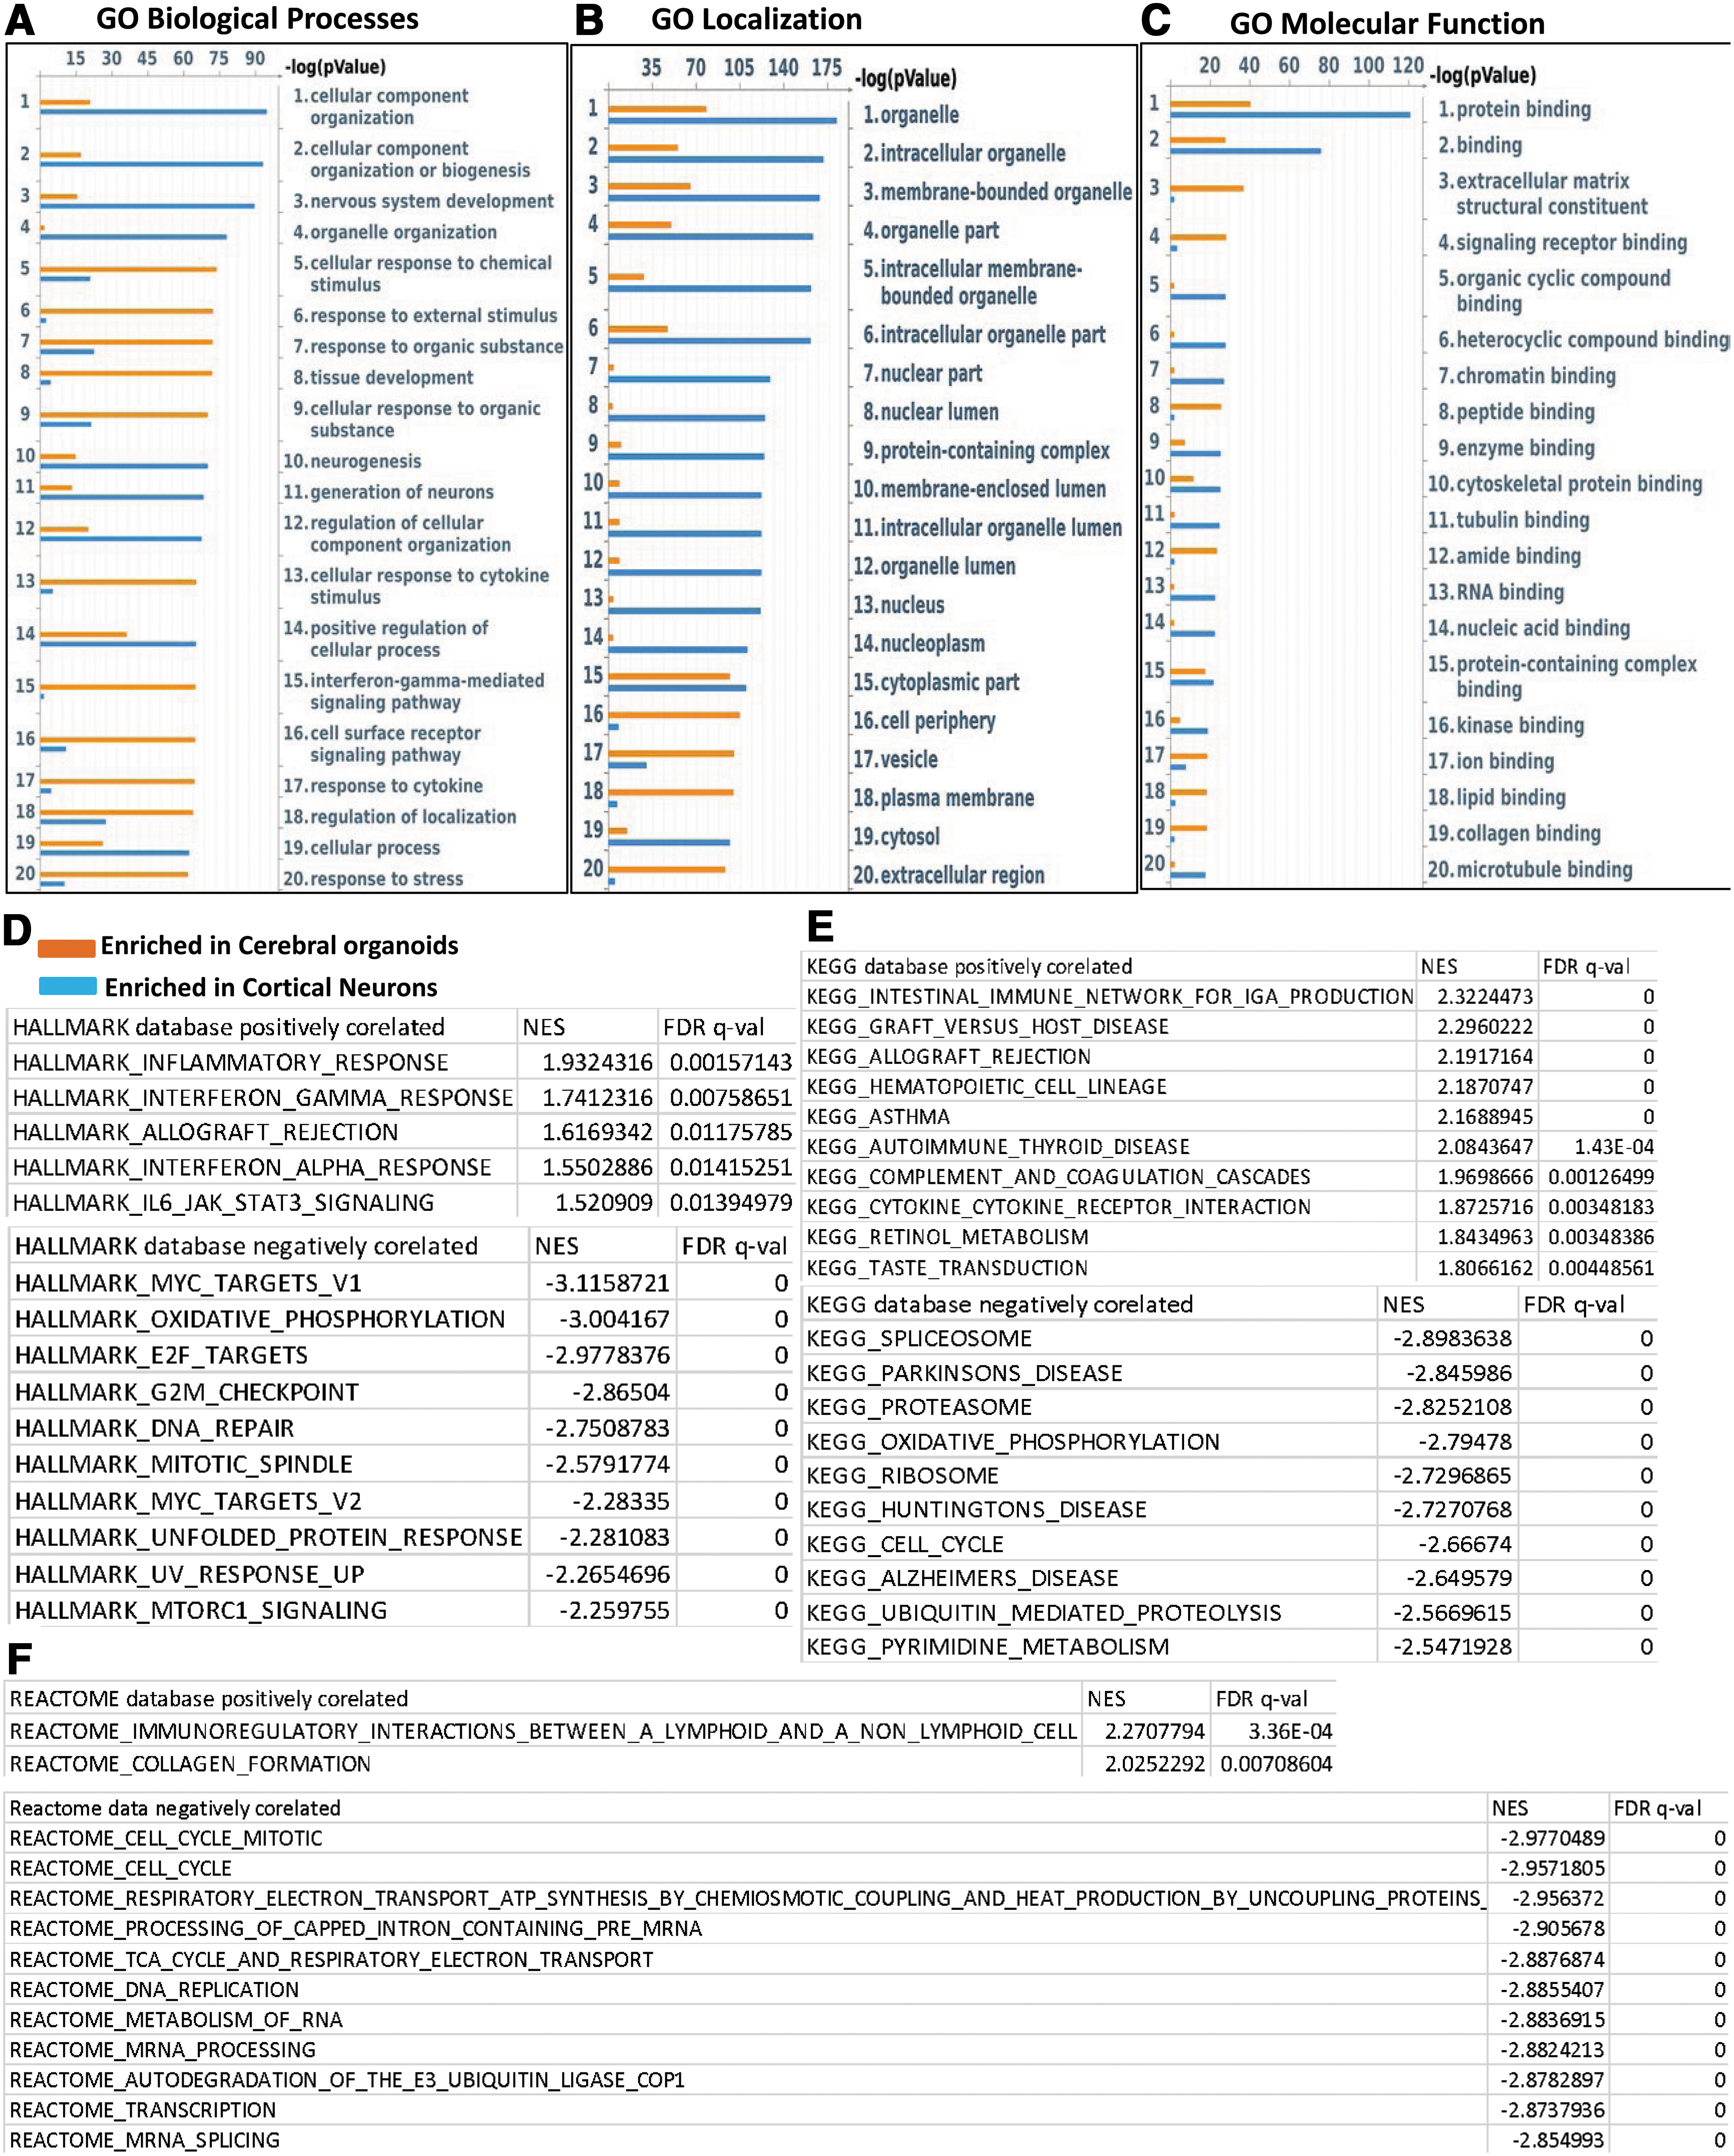
We categorized DEGs as enriched in cerebral organoids or enriched in cortical neuron monolayer cultures and rank-ordered the top 25 hits according to significance (P value) (Fig. 3A–C). Among the top genes enriched in the cerebral organoids included the cell adhesion protein ameloblastin that is involved in calcium binding [29], the intracellular protein calbindin-2 (calretinin), which is expressed in interneurons and described before in cerebral organoids [30], the calcium sensor copine-6 that modulates structural plasticity of dendritic spines [31], and the V-set and transmembrane domain containing 2A protein that has been found to be expressed neurons and in the cortex
GO and gene set enrichment analysis of DEGs.
Top Ten Differentially Expressed Genes Enriched in Cerebral Organoids and Cortical Neuron Cultures, Listed According to Log-Fold Change
We further carried out GSEA, a computational method that determines whether a set of genes is able to separate two biological categories in a statistically significant manner [38]. We performed GSEA with default parameters in the GSEA software for all expressed genes with FPKM values calculated by Cufflinks against following data sets v6.2: Hallmark, REACTOME, and KEGG. We tabulated positive and negative correlation according to normalized enrichment scores, with positive correlation indicating higher expression in the cerebral organoids and a negative correlation indicating higher expression in the monolayer cortical neuron culture (Fig. 3D–F). Positive correlation was observed with inflammatory response and interferon-γ signaling in all three databases (Fig. 3D–F), consistent with pathways that were significant in GO biological processes and localization.
Table 2 lists DEGs enriched in cerebral organoids that are part of the interferon-γ signaling pathway, and the expression levels of a number of the key genes were validated by qPCR (Supplementary Fig. S2). Negative correlation indicating higher expression in the monolayer cortical neuron cultures centered on oxidative phosphorylation and cell cycle pathways. Taken together, these results suggest that cerebral organoids have a relatively more robust immune signaling pathways and better response to stimuli.
Differentially Expressed Genes Involved in the Interferon-γ Signaling Pathway Enriched in the Cerebral Organoids (Top 50 Genes According to Log-Fold Change)
Comparison of transcriptomic profiles with gene expression in fetal PFC
The BrainSpan Atlas of the Developing Human Brain contains RNA sequencing data and exon microarray profiles from 16 different brain regions from various stages of human brain development (
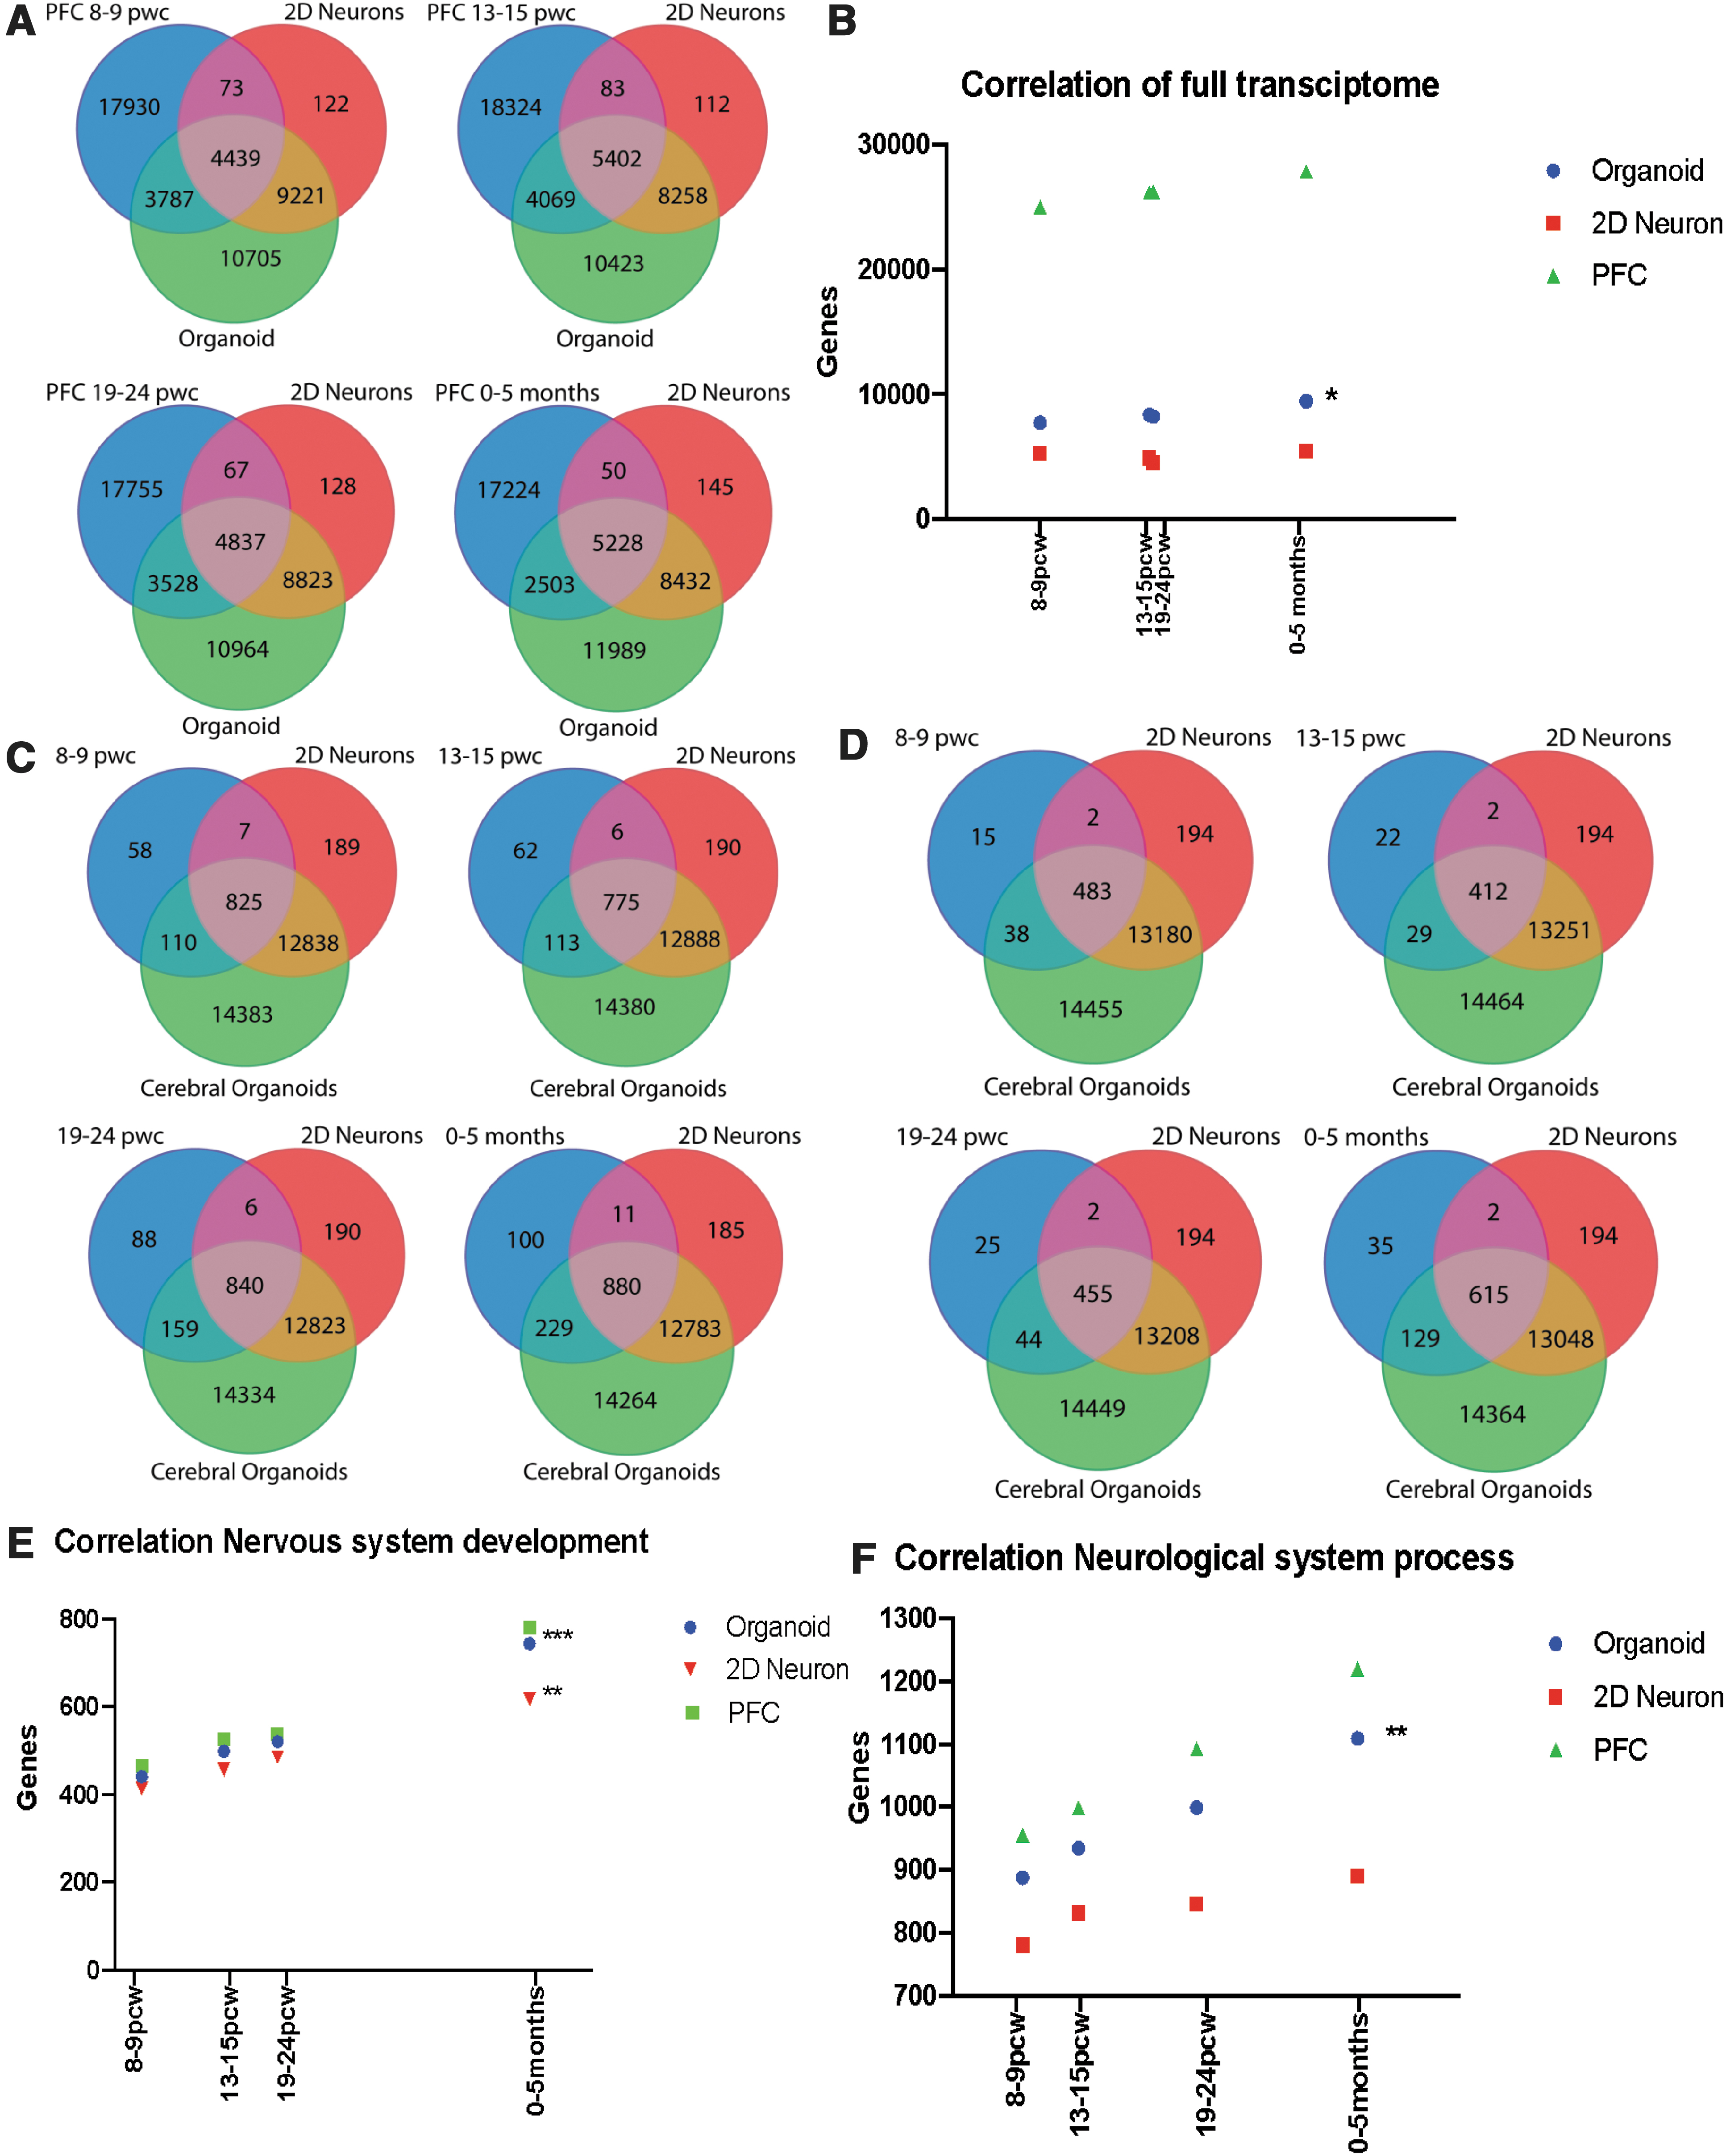
Comparison of human iPSC-derived cerebral organoid and neuronal culture transcriptome with the transcriptome of the fetal PFC tissue at different stages of development.
Significant correlation was observed between the cerebral organoid and PFC transcriptomic profiles (Fig. 4B). The highest correlation between the gene expression profiles was observed between the transcriptomic profile of PFC at 13–15 pcw and the gene expression profile of the cerebral organoids, where 33.9% of the genes are shared between the two profiles. Given the prominence of the interferon-γ pathway in the cerebral organoids in the GO and GSEA analyses, we also examined the expression of these interferon-γ-related DEGs in the fetal PFC transcriptomes from the different timepoints, which showed overlap of a large subset of the interferon-γ-related DEGs in the fetal PFC transcriptomes (Supplementary Fig. S3 and Supplementary Table S3).
We examined specific relevant biological pathways by comparing gene expression patterns in the fetal PFC in relationship to gene expression patterns in cerebral organoids and cortical monolayer cultures by utilizing “nervous system development” and “neurological system process” categories. In the “nervous system development” category, gene expression profiles from the cerebral organoids had higher overall correlation with the transcriptomic profiles in fetal PFC, when compared to gene expression profiles of cortical neuron monolayer cultures (Fig. 4C). At 8–9 pcw, there were 537 nervous system development genes expressed in fetal PFC, out of which 521 were expressed in cerebral organoids while 485 were present in the cortical neuron cultures. At 13–15 pcw, there were 465 nervous system development genes expressed in fetal PFC, out of which 441 were expressed in the cerebral organoids while 414 were present in the cortical neuron cultures. At 19—24 pcw, there were 526 nervous system development genes expressed in fetal PFC, out of which 499 were expressed in cerebral organoids and while 457 were present in the cortical neuron cultures. At 0–5 months, there were 781 nervous system development genes expressed in fetal PFC, out of which 744 were expressed in the cerebral organoids while 617 were present in the cortical neuron cultures (Fig. 4C).
The “neurological system process” module represents overall development of the nervous system, including formation of synaptic transmission and detection of stimulus. There was a higher correlation between fetal PFC gene expression profiles in this module with cerebral organoid transcriptome profiles, when compared to the cortical neuron cultures (Fig. 4D). Of 999 neurological system process genes expressed in fetal PFC at 8–9 pcw, 935 were expressed in the cerebral organoids while 832 were expressed in the cortical neuron cultures. At 13–15 pcw, there were 955 neurological system process genes expressed in fetal PFC, of which 888 were expressed in the cerebral organoids while 781 were expressed in the cortical neuron cultures. Similar results were seen at other fetal PFC development timepoints, including at 19–24 pcw and at 0–5 months, with a higher correlation between the PFC gene expression profiles with gene expression profile of cerebral organoids compared to that of cortical neuron monolayer cultures (Fig. 4E, F). These results show that the cerebral organoid gene expression profile, compared to the cortical neuron culture profile, tracks more closely with PFC gene expression profiles from the prenatal stage and the early postnatal period, while less overlap in gene expression occurs in the cortical neuron cultures. Moreover, the correlation of gene expression patterns in the cerebral organoids with the PFC transcriptome increased with the age of fetal PFC samples (Fig. 4A–F).
Discussion
The suitability of specific iPSC-derived ex vivo models need to be guided by the nature of the scientific questions being asked [39]. Many stem cell-based studies have used iPSC-derived neural progenitor cells or differentiated neurons in monolayer cultures to study various aspects of disease biology as well as to study different signaling pathways relevant to disease biology [40 –43]. Cerebral organoids present the opportunity to study of live complex neuronal tissue with specific genetic backgrounds [44,45]. Monolayer cultures have the predominance of a few cell types and are less heterogeneous while cerebral organoids consist of a higher diversity of neuronal and glial cell types [46,47]. A previous study comparing the efficiency of monolayer cultures and three-dimensional methods to generate neurons and astrocytes found that both methods resulted in the generation of similar neural rosettes and gave rise to neurons with similar electrophysiological properties [48]. The three-dimensional methods resulted in higher yield of neural progenitor cells that were positive for PAX6 and NESTIN and resulted in neurons with longer neurites, while the monolayer cultures gave rise to more cells positive for SOX1 [48]. In our earlier studies, we had found that neurons generated from both methods showed spontaneous neuronal firing properties as well as robust responses to chemical and electrical stimuli [22 –24].
Cerebral organoids have a larger array of cell types that develop in a three-dimensional structure while two-dimensional neuronal cultures have a smaller set of largely neuronal cells that grow within the constraints of a monolayer format [49]. Both of these ex vivo models are being utilized to study fundamental biology as well as disease-related cellular processes [50]. However, there has not been a clear understanding of the similarities and differences in the cellular processes and signaling pathways that are active in these model systems. By comparing transcriptomes of the cortical neuron cultures and cerebral organoids generated from the same iPSCs, we highlight the biological processes and pathways operating in the two model systems. The genes that were most significantly enriched in the cerebral organoids include cell adhesion molecules found in more complex tissues, genes expressed in interneurons as well as those involved in plasticity of dendritic spines. These findings are consistent with the greater complexity and cell types that are present in the cerebral organoids [51]. The genes that were most significantly enriched in the monolayer cortical neuron cultures include a calcium-binding protein involved in neuron projection development and cellular stress, a glycoprotein with roles in calcium-dependent protein binding, and signaling pattern recognition receptor activity, as described above.
In analyzing the GO analyses of the DEGs, we found that there was an enrichment of genes involved in tissue development in the cerebral organoids, which is consistent with the more complex structures consisting of multiple cell types that are generated in the development of the cerebral organoids [52]. In the monolayer cortical neuron cultures, we found a relative enrichment of genes in pathways involved in neurogenesis and neuronal differentiation. The monolayer cortical neurons at 3 months consist primarily of excitatory cortical neurons generated from neural progenitor cells [21], which is the likely reason for this relative enrichment in the monolayer cultures vis-à-vis the cerebral organoids. In the GSEA analyses, we were especially intrigued to discover the high correlation with inflammatory response and interferon-γ signaling in the cerebral organoids (Fig. 3D–F).
These findings highlight the different biological processes that are robustly represented in these systems, which can serve as a guide in choosing the right model system to study the physiology of human neurobiology as well as to test hypotheses about specific cellular systems that are aberrant in different neuropsychiatric disorders. Our transcriptomic data show that gene expression patterns for nervous system genes in fetal PFC track more closely with iPSC-derived cerebral organoids compared to monolayer cortical neuron cultures. Previous transcriptomic and proteomic experiments with organoids and comparison with fetal brain gene expression profiles had shown that the organoids recapitulate many aspects of cortical development and show enrichment in a number of pathways related to cell-cell adhesion, cytoskeletal organization, and cerebral cortex development [53,54]. Cerebral organoids may especially be suitable for the study of neuroinflammation since microglia develop innately in organoids (Fig. 1C) [55]. We identified microglia in the cerebral organoids by marker analysis and also found enriched expression of microglia-related genes in the cerebral organoids (Fig. 1C and Supplementary Table S4).
Our findings of enriched expression of genes in the interferon-γ pathway and immune-related signaling in cerebral organoids, along with the overlap between the enriched interferon-γ-related genes with gene expression profiles in the fetal PFC transcriptomes, makes them an attractive model to interrogate the biology neuroimmune interactions in health and in disease contexts [56 –59]. Two-dimensional neuronal cultures, on the contrary, have robust features related to neurogenesis and neuronal differentiation, and the GO and GSEA analyses indicate enrichment for genes involved in oxidative phosphorylation and cell cycle pathways. Neurons have high energy demands and primarily use glucose through aerobic glycolysis and oxidative phosphorylation for their energy needs, although they will utilize other sources in the setting of nutrient deprivation [60]. There is increased mitochondrial biogenesis and glucose metabolism during neuronal differentiation in two-dimensional human cortical neuron cultures [60]. Cerebral organoids are densely packed, and the core region does not have easy access to nutrients due to the lack of vasculature [61]. This may explain findings of gene expression patterns showing relative enrichment of genes involved in oxidative phosphorylation in the monolayer cortical neuron cultures vis-à-vis the cerebral organoids. Taken together, examination of the transcriptomic profiles presented here adds to our understanding of the relative differences in three-dimensional and two-dimensional cellular model systems that can inform the choice of appropriate model systems to address specific research questions.
Footnotes
Acknowledgment
We thank Dr. Bruce M. Cohen and Dr. Donna McPhie from Harvard Medical School and McLean Hospital for providing us with the fibroblasts used in the study.
Data Availability Statement
Author Disclosure Statement
No competing financial interests exist.
Funding Information
This work was supported by a National Institute of Mental Health Biobehavioral Research Awards for Innovative New Scientists (BRAINS) Award R01MH113858 (to R.K.), National Institute of Mental Health Clinical Scientist Development Award K08MH086846 (to R.K.), the Doris Duke Charitable Foundation Clinical Scientist Development Award (to R.K.), the Ryan Licht Sang Bipolar Foundation (to R.K.), the Jeanne Marie Lee-Osterhaus Family Foundation NARSAD Young Investigator Award from the Brain & Behavior Research Foundation (to A.K.), the Phyllis & Jerome Lyle Rappaport Foundation (to R.K.), the Harvard Stem Cell Institute (to R.K.), and by Steve Willis and Elissa Freud (to R.K.).
Supplementary Material
Supplementary Figure S1
Supplementary Figure S2
Supplementary Figure S3
Supplementary Table S1
Supplementary Table S2
Supplementary Table S3
Supplementary Table S4
Supplementary Table S5
Supplementary File S1
Supplementary File S2
Supplementary File S3
Supplementary File S4
References
Supplementary Material
Please find the following supplemental material available below.
For Open Access articles published under a Creative Commons License, all supplemental material carries the same license as the article it is associated with.
For non-Open Access articles published, all supplemental material carries a non-exclusive license, and permission requests for re-use of supplemental material or any part of supplemental material shall be sent directly to the copyright owner as specified in the copyright notice associated with the article.