




Abstract
Progressive vision loss, caused by retinal degenerative (RD) diseases such as age-related macular degeneration, retinitis pigmentosa, and Leber congenital amaurosis, severely impacts quality of life and affects millions of people. Finding efficient treatment for blinding diseases is among the greatest unmet clinical needs. The evagination of optic vesicles from developing pluripotent stem cell-derived neuroepithelium and self-organization, lamination, and differentiation of retinal tissue in a dish generated considerable optimism for developing innovative approaches for treating RD diseases, which previously were not feasible. Retinal organoids may be a limitless source of multipotential retinal progenitors, photoreceptors (PRs), and the whole retinal tissue, which are productive approaches for developing RD disease therapies. In this study we compared the distribution and expression level of molecular markers (genetic and epigenetic) in human fetal retina (age 8–16 weeks) and human embryonic stem cell (hESC)-derived retinal tissue (organoids) by immunohistochemistry, RNA-seq, flow cytometry, and mass-spectrometry (to measure methylated and hydroxymethylated cytosine level), with a focus on PRs to evaluate the clinical application of hESC-retinal tissue for vision restoration. Our results revealed high correlation in gene expression profiles and histological profiles between human fetal retina (age 8–13 weeks) and hESC-derived retinal tissue (10–12 weeks). The transcriptome signature of hESC-derived retinal tissue from retinal organoids maintained for 24 weeks in culture resembled the transcriptome of human fetal retina of more advanced developmental stages. The histological profiles of 24 week-old hESC-derived retinal tissue displayed mature PR immunophenotypes and presence of developing inner and outer segments. Collectively, our work highlights the similarity of hESC-derived retinal tissue at early stages of development (10 weeks), and human fetal retina (age 8–13 weeks) and it supports the development of regenerative medicine therapies aimed at using tissue from hESC-derived retinal organoids (hESC-retinal implants) for mitigating vision loss.
Introduction
A large number of blinding retinal degenerative (RD) diseases such as retinitis pigmentosa (RP), age-related macular degeneration (AMD), and Leber congenital amaurosis (LCA) result in loss of light-sensitive cells (photoreceptors, PRs), which, to this day, is irreversible. These diseases are among the leading causes of blindness in the developed world and are very costly and devastating to patients [1 –4].
AMD accounts for about 50% of all vision loss in the United States and Canada, with 15 million AMD patients in the United States [2,5 –7]. RP is the most frequent cause of inherited visual impairment, with a prevalence of 1:4,000, and is estimated to affect 100,000 people in the United States and ∼1.5 million people worldwide [8,9]. Current treatment modalities are very limited and do not enable restoration of vision (with the exception of anti-Vascular Endothelial Growth Factor antibody injection for wet AMD). Collectively, the impact of these diseases emphasizes that restoration of the degenerated retina is a very urgent and unmet clinical need.
Cell replacement therapy is a rapidly evolving approach, which promises to bring new PRs and even retinal tissue into the subretinal space to replace the cells lost to degeneration in the patient's retina devoid of PRs [10 –13]. The clinical trials with human fetal retina demonstrated the safety and efficacy of this approach for treating RP and AMD [14 –16]; however, the limited supply and ethical considerations represent barriers to the routine clinical use of fetal tissue for vision restoration.
We and others developed an alternative tissue source for this therapy from human pluripotent stem cells (hPSCs) [10,17 –24]. hPSC-derived retinal organoids have emerged as a powerful tool to recapitulate human development and disease [25,26], with reports going back to 2003 [27]. Organoids derived from hPSCs have the potential to provide an unlimited source of cells for replacement therapies and in the case of the retina (where the structure of the tissue is critical for function)—an unlimited source for derivation of the retinal tissue itself.
Reducing the costs is critical for commercialization of biomanufacturing biological products such as hPSC-retinal tissue [28,29]. Because of the high cost associated with derivation and validation of each human induced pluripotent stem cell (hiPSC) line and risks associated with using the iPSCs from the individual patients [30], the initial idea of using patient-specific iPSCs received considerable scrutiny and revision [31]. By now, the idea of using current good manufacturing practice-grade banked low passage human embryonic stem cell (hESC) lines for this approach seems widely accepted [32].
Here, we compared human fetal retinal tissue (age 8, 10, 11, 13, and 16 weeks, timepoints, available in the United States due to ethical and regulatory restrictions) and hESC-derived retinal tissue using several techniques, including confocal immunohistochemistry (IHC), flow cytometry, RNA-Seq and mass-spectrometry [to compare 5-methylcytosine (5mC) and 5-hydroxymethylated cytosine (5hmC) levels] [33,34]. The hESC-derived retinal tissue at early stages of development (10–12 weeks) is comparable to human fetal retina (stage 8–13 weeks) within, of course, the expected limitations of in vitro derivation and culturing technologies.
Materials and Methods
Maintenance of hESCs
The hESC line H1 [35] was obtained from WiCell whereas ESI053, ESI017, and ESI049 were obtained from Lineage Cell Therapeutics, Inc. All hESCs lines were differentiated to retinal organoids in feeder-free conditions by using mTeSR1 protocol and basic fibroblast growth factor (bFGF; Sigma-Aldrich) with the addition of heparin (10 ng/mL) and amphotericin-B/gentamicin (Life Technologies) on 1 × ES-qualified, growth factor-reduced (GFR) Matrigel-coated (Fisher Scientific) plates [17,35].
All hESC lines were karyotyped (Cell Line Genetics, Inc.), tested for pluripotency marker expression by immunocytochemistry [36] and fingerprinted (Cell Line Genetics, Inc.) to confirm the identity before initiation of experiments (Supplementary Fig. S1). In addition, we karyotyped and fingerprinted passage 2–3 cells from retinal organoids after the completion of organoid derivation. All the cells were passaged every 6–7 days according to the manufacturer's protocol (mTeSR1 hESC passaging; Stem Cell Technologies, Inc.) reaching ∼80% confluency by day 7 on GFR Matrigel-coated 35 or 60 mm plates using the enzymatic protocol with Versene/EDTA (Lonza Group, Ltd.) at a ratio 1:10 [35]. Rho-associated protein kinase (ROCK)-inhibitor [37] Y-27632 (Cat. No. 72302) was used at 10 mM concentration for initial plating of hESCs from cryostorage, and it was then removed from culture media after 2–3 days. Colonies containing clearly visible differentiated cells were marked and mechanically removed before passaging with Versene, as recommended by mTeSR1 protocol [35].
Derivation of retinal organoids
We used our earlier published protocols for derivation of retinal organoids [10,17], with some modifications outlined next. We started neural induction of hESCs colonies (75%–80% density) with noggin [8,38 –41]. On day 0, we replaced hESC culturing medium with mTESR1 and neurobasal complete (NB) medium (1:1 ratio) with no bFGF and 100 ng/mL human noggin morphogen (Peprotech, Rocky Hill, NJ). On day 3, we replaced the medium with 100% NB with 1 × N2, 1 × B27, and 100 ng/mL noggin, and we cultured for another 3 days [38]. We continued replacing 1/2 of the conditioned medium every third day with fresh NB/N2/B27/100 ng/mL noggin.
At +2 weeks after initiating the protocol, we applied human bFGF (20 ng/mL; Peprotech). At +4 weeks, when neural rosettes were abundant in differentiating two-dimensional adherent monolayers, we applied human Dickkopf protein DKK-1 and human insulin growth factor-1 (IGF-1), 20 ng/mL each, both from Peprotech [8,38,40] for 1 week. The plates were then cultured for 3–4 weeks in NB medium with human bFGF, and human FGF9 (both at 20 ng/mL) to promote neural retinal differentiation [11,42,43].
During the fourth to fifth weeks of differentiation, neuroretinal structures started appearing in the plates and were surrounded by brown retinal pigment epithelium (RPE) cells. Emerging neuroretinal structures were dissected out and lifted along with the RPE cells and grown in a suspension culture in the ultra-low attachment dishes. The clusters were grown for several weeks (till week 10) in nonadherent conditions in six well dishes (on an orbital shaker, 40–50 rpm in low-attachment six-well plates) at 37°C/5% CO2 in normoxic conditions (21% oxygen), with the addition of 20 ng/mL human brain-derived neurotrophic factor (BDNF; R&D Systems) and 20 ng/mL human bFGF.
Approximately half of the media was changed two to three times/week. At weeks 5–10, organoids initially looked translucent, with a clear rim and minor difference in shape and sizes under the bright field microscope. As they grew in the suspension culture they acquired a dark color, as noted in other reports [18,21]. After week 10, organoids were grown individually in the 96-well ultra-low U-shaped dishes. Long-term maturation of retinal organoids (until weeks 24–27) was supported by 10% Fetal Bovine Serum [20] and enhanced by using BrainPhys Medium [37] (instead of a usual Neurobasal medium that we used for organoid derivation [17]), also 0.5 μM all-trans retinoic acid and 100 μM taurine. As the organoids (H1, ESI053, ESI049, and ESI017) matured (week 21 onward), outer segment (OS)-like structures with radial architecture were observed to be protruding from the surface of retinal organoids.
Immunohistochemistry
hESC-derived retinal organoids were fixed in fresh ice-cold paraformaldehyde (4% PFA; Sigma-Aldrich) for 15 min, rinsed with 1 × phosphate-buffered saline (PBS), and washed three times in ice-cold PBS (5 min each). The organoids were cryoprotected in 20% sucrose (prepared in PBS, pH 7.8), and then 30% sucrose (until tissue sank), and they were snap-frozen (dry ice/ethanol bath) in optimum cutting temperature embedding material (Tissue-Tek).
The hESC-derived retinal organoids were serially sectioned at 12 μm by using Microm™ HM550 (Thermo Scientific) cryostat. The sections were first permeabilized with 0.1% Triton X-100/PBS (PBS-T) at room temperature for 30 min, followed by 1 h of incubation in blocking solution [5% preimmune normal goat serum (Jackson ImmunoResearch) and 0.1% PBS-T] at room temperature; then, they were incubated with primary antibodies (Supplementary Table S1) diluted in blocking solution at 4°C overnight. The next day, sections were washed three times (10–15 min each time) with PBS-T, and then incubated with the corresponding secondary antibodies (Alexa Fluor 568 goat anti-mouse, Alexa Fluor 488 goat anti-rabbit, 1:1,000, or vice versa) at room temperature for 45 min. The slides were washed three times with 0.1% PBS-T solution, incubated with 4′,6-diamidino-2-phenylindole (DAPI) solution (1 mg/mL) for 10 min, and washed again with 0.1% PBS-T solution. As a negative control for primary antibody-specific binding, we stained tissue sections with secondary antibodies only.
The sections were mounted with ProLong Gold Antifade medium (Life Technologies) and examined by using a Nikon Eclipse Ni epifluorescent microscope with ZYLA 5.5 sCMOS (ANDOR Technologies) black and white charge-coupled device high-speed camera or Olympus FluoView FV1000 confocal microscope (Olympus). For staining sections with antibodies to 5mC and 5hmC we followed our published protocols [33,34]. All antibodies are listed in Supplementary Table S1.
Manual counting of retinal progenitor cells and early PR markers was performed on six random images from three different organoids from H1 line and was done by using IMAGE J software (National Institutes of Health, Bethesda, MD) [44]. Immunopositive cells had to meet the criteria of distinct nuclear or cytoplasmic labelling above background level irrespective of the labeling intensity (weak or strong labeling). The rod cone ratio was calculated based on the rod (NRL, NR2E3) and cone (S-opsin) staining from different sections of three H1-derived retinal organoids.
Global DNA methylation (5mC) and hydroxymethylation (5hmC) analysis by mass spectrometry
Between 10 and 15 μg of total genomic DNA (extracted with phenol-chloroform method, and RNase treatment) from hESC-retinal tissue (organoids, age 10 weeks, pooled sample from 10 retinal organoids) and human fetal retina (age 10 weeks, 2 neural retinas) were evaluated by Zymo Research Epigenetic Services with quantitative mass spectrometry analysis for total 5mC and 5hmC. The samples were first evaluated for DNA integrity (quality control, Q/C) and, after passing the Q/C were analyzed by selected reaction monitoring-based mass spectrometry assay to quantify total 5-hydroxymethylated cytosine (5hmC) and 5-methylcytosine (5mC).
The assay was designed to measure 5hmC and 5mC concentrations as a percentage of 2′-deoxyguanosine (dG) [eg, (5hmC)/(dG) and (5mC)/(dG)]. The calibrated ranges for the analytes were 0%–2.5% for 5hmC and 0%–25% for 5mC by using a fixed 40 pmol amount of dG as an internal standard. First, the calibration curves were built for each 5mC and 5hmC. The calibration points were run as single replicates due to previously demonstrated high reproducibility of the assay. Replicates for the samples were run in triplicate. The calculated Amount (%) of either 5mC or 5hmC was calculated by using the area ratio and standard curves in the range of 0%–2.5% 5hmC/dG or 0%–25% 5mC/dG.
Transmission electron microscopy
Organoids were fixed in 2.5% glutaraldehyde and 2% PFA in 0.1 M sodium cacodylate buffer for 30 min at room temperature and then another 30–90 min at 4°C. Organoids were then washed in 0.1 M sodium cacodylate buffer before embedding in 2% agarose in 0.1 M sodium cacodylate buffer. Embedded organoids were stored in 0.1 M cacodylate buffer at 4°C until further processing. Samples were post-fixed with 2% osmium tetroxide for 15 min before dehydration in acetone and infusion with Spurr resin [45]. Polymerized organoids were sectioned by using a diamond knife on an ultramicrotome (RMC MTX; Boeckeler Instruments, Tucson, AZ).
Five-hundred-nanometers sections were stained with epoxy tissue stain (Electron Microscopy Sciences, Hatfield, PA) and imaged with a light microscope (Nikon Eclipse 80i; Nikon Instruments, Inc., Melville, NY). Seventy to one hundred nanometer sections were collected on copper grids, stained with 4% uranyl acetate for 20 min and then Reynolds lead citrate for 15 min before being imaged on a JEM-1400 Flash transmission electron microscope by using a bottom-mounted Matataki Flash sCMOS camera.
Total RNA preparation
For transcriptomics analysis, human eyes from fetal age 8 (n = 2), 10 (n = 2), 13 (n = 2), and 16 (n = 2; 2 retinas pooled for each developmental timepoint) were procured from the Advanced Bioscience Resources (ABR, Alameda, CA). Human fetal retina was procured from Advanced Bioscience Resources, Alameda, California, as aborted material and solely for in vitro biomedical research, based on prior negotiated agreement between BioTime (LCTX) and ABR (in vitro research only). Fresh tissue was collected in Hibernate E medium, and the retina was dissected of all extraocular tissue and RPE in cold HBSS. Retina was lysed in tissue lysis buffer (Qiagen). Similarly, hESC-derived retinal tissue from 10 (n = 35, pooled sample) and 24 weeks old (n = 30, pooled sample) were lysed in tissue lysis buffer (Qiagen). Total RNA was extracted from fetal retinal tissue and hESC-derived retinal organoid by using RNAeasy kit instruction (Qiagen). RNA integrity (RIN) was checked with an Agilent 2100 Bioanalyzer (Agilent Technologies) according to the manufacturer's instruction. RNA samples with RIN value 8 or above were sent to BGI (Cambridge, MA) for RNA-seq analysis.
Complementary DNA library preparation and RNA sequencing
High-quality RNA samples (10 μg each, RIN ≥8) were shipped on dry ice to the BGI in Philadelphia, PA for complementary DNA (cDNA) library preparation and sequencing. Each pooled sample representing hESC-derived retinal tissue (organoids) had 30–35 randomly selected organoids. Human fetal retina samples were represented by two pooled neural retinas/sample. cDNA library construction and paired-end sequencing were performed by using an Illumina HiSeq™ 2500/4000 platform (Illumina, San Diego, CA) according to the manufacturer's instructions. Paired-end reads, 100 bp in length to the level of minimum of 45 million reads per sample were obtained with Phred Q20 (%) value of minimum of 98.54.
Differential gene expression and clustering analysis
Bioinformatics and statistical evaluation of data was done by Beijing Genomics Institute (BGI, Shenzhen, China) with additional statistical/bioinformatics assistance by the Gladstone Bioinformatics Core. In brief, the input sequences were provided in FASTQ format. Trimming of known adapters and low-quality regions of reads was performed by using Fastq-mcf [46]. Sequence Q/C was assessed by using the program FASTQC [47,48], also see
We first filtered out genes where there were not at least two samples with at least 5 (raw) reads. This was our minimum threshold for expression detectability. Once these genes were removed, we recalculated the counts per million (CPM) for each gene and filtered out any genes with a CPM above 20,000. After excluding these genes, we re-normalized the remaining ones using calcNormFactors (TMM; “weighted trimmed mean of M-values”) in edgeR [52]. We used the built-in R function
Flow cytometry (FLOW) analysis
Human fetal retina (13 weeks old, 2 pooled neural retinas) and hESC-retinal tissue (30 randomly selected retinal organoids, H1 line, pooled sample, 12 weeks old) were first dispersed (in 2 separate tubes, “organoids” and “fetal retina”) into a uniform single cell suspension by using a papain digestion protocol, as previously described [56]. The resulting mixture of cells was immunolabeled with the following cocktail of lineage-selective surface markers: rabbit IgG anti-CD133, mouse IgM anti-CD15 (Santa Cruz Biotechnology, Santa Cruz, CA), Hamster IgG anti-CD29 (BD Biosciences, San Jose, CA), and a mixture of tetanus toxin fragment C (TnTx)-anti-TnTx mouse IgG2b, which was prepared in-house as previously described [56].
Primary immunoreactions were visualized by using the following fluorophore-conjugated goat secondary antibodies: anti-rabbit IgG-FITC, anti-mouse IgM-PE (Jackson ImmunoResearch Laboratories, Inc., West Grove, PA), anti-mouse IgG1-PE/Texas Red (PE/TR), and anti-mouse IgG2b-PE/Cy5 (Invitrogen, Carlsbad, CA). After surface labeling, cells were stained with 1 mg/mL DAPI to discriminate between live (DAPI-negative) and dead (DAPI-positive) cells. Quantitative immunophenotyping of cell populations was carried out by using the FACSVantage SE flow cytometer (BD Biosciences), as previously described [56]. Briefly, the fluorescence signals emitted by FITC, PE, PE/TR, and PE/Cy5 on individual cells were excited by using an argon-ion laser tuned to 488 nm and the resulting fluorescence emissions were collected by using bandpass filters set at 530 ± 30, 575 ± 25, 613 ± 20, and 675 ± 20 nm, respectively. The DAPI-labeled cells were excited by using a broad ultraviolet (351–364 nm) laser light, and the resulting emission signals were captured with a bandpass filter set at 440 ± 20 nm. Cell Quest Acquisition and Analysis software (BD Biosciences) was used to acquire and quantify the fluorescence signal distributions and intensities from individual cells, to electronically compensate spectral overlap of individual fluorophores and to set compound logical electronic gates used for cell analysis.
Results
Differentiation of hESCs to retinal organoids
To demonstrate the reproducibility of retinal organoid formation using our simplified noggin-based protocol, we differentiated hESC line H1, ESI053, ESI017, and ESI049 to retinal organoids [17,57]. Retinal organoids were successfully derived from all hESC lines and were monitored for at least 24–27 weeks. During the fourth week of differentiation, neuroretinal structures started appearing in the plates and were surrounded by RPE cells [10]. Emerging neuroretinal structures were dissected out and lifted along with the RPE cells and grown in a suspension culture in the ultra-low attachment dishes (first as groups, in 6-well dishes, and then in the individual 96-well dishes).
At weeks 5–10, organoids initially look translucent, with a clear rim and minor difference in shape and sizes under the bright field microscope. As they grew in the suspension culture they acquired a dark color, as noted in other reports [18,21]. From week 21 onward, OS-like structures with radial architecture were observed as protruding from the surface of retinal organoids (Supplementary Fig. S2). Protruding segments grew and were preserved better in stationary cultures. In shaking cultures, the OS formation was observed but the OSs were rapidly sheared due to back-and-forth movements of organoids through the media.
Characterization of retinal organoids at early stage of differentiation demonstrates recapitulation of fetal retinal development
To determine the dynamic and similarity in the retinal cell type distribution pattern between hESC-derived retinal tissue (organoids) and human fetal retina, we did immunohistochemistry on early stage retinal organoids at week 10 and fetal retina at early stages of development during 8, 10, 11, 13, and 16 weeks. The retinal organoids formed laminated structures similar to the developing mammalian retina in vivo and displayed initiation of formation of inner and outer neuroblast layers (ONBL; typically observed in human fetal retina at the stage approximately 13–16 weeks [58,59]).
At week 10, we consistently observed cell proliferation marker Ki67 concentrated along the apical side of organoid rim, retinal progenitor/eye field marker PAX6 (75% ± 4% of total DAPI-stained cells), RAX (90% ± 5% of total DAPI-stained cells), pan-neural retina progenitor marker CHX10 (VSX2; 40% ± 5% of total DAPI-stained cells), PR progenitor marker CRX (35% ± 4% of total DAPI-stained cells), retinal ganglion cell marker BRN3A (40% ± 6% of total DAPI-stained cells), PRs, and amacrine progenitor marker NEUROD1 (56% ± 4% of total DAPI-stained cells) (Fig. 1).
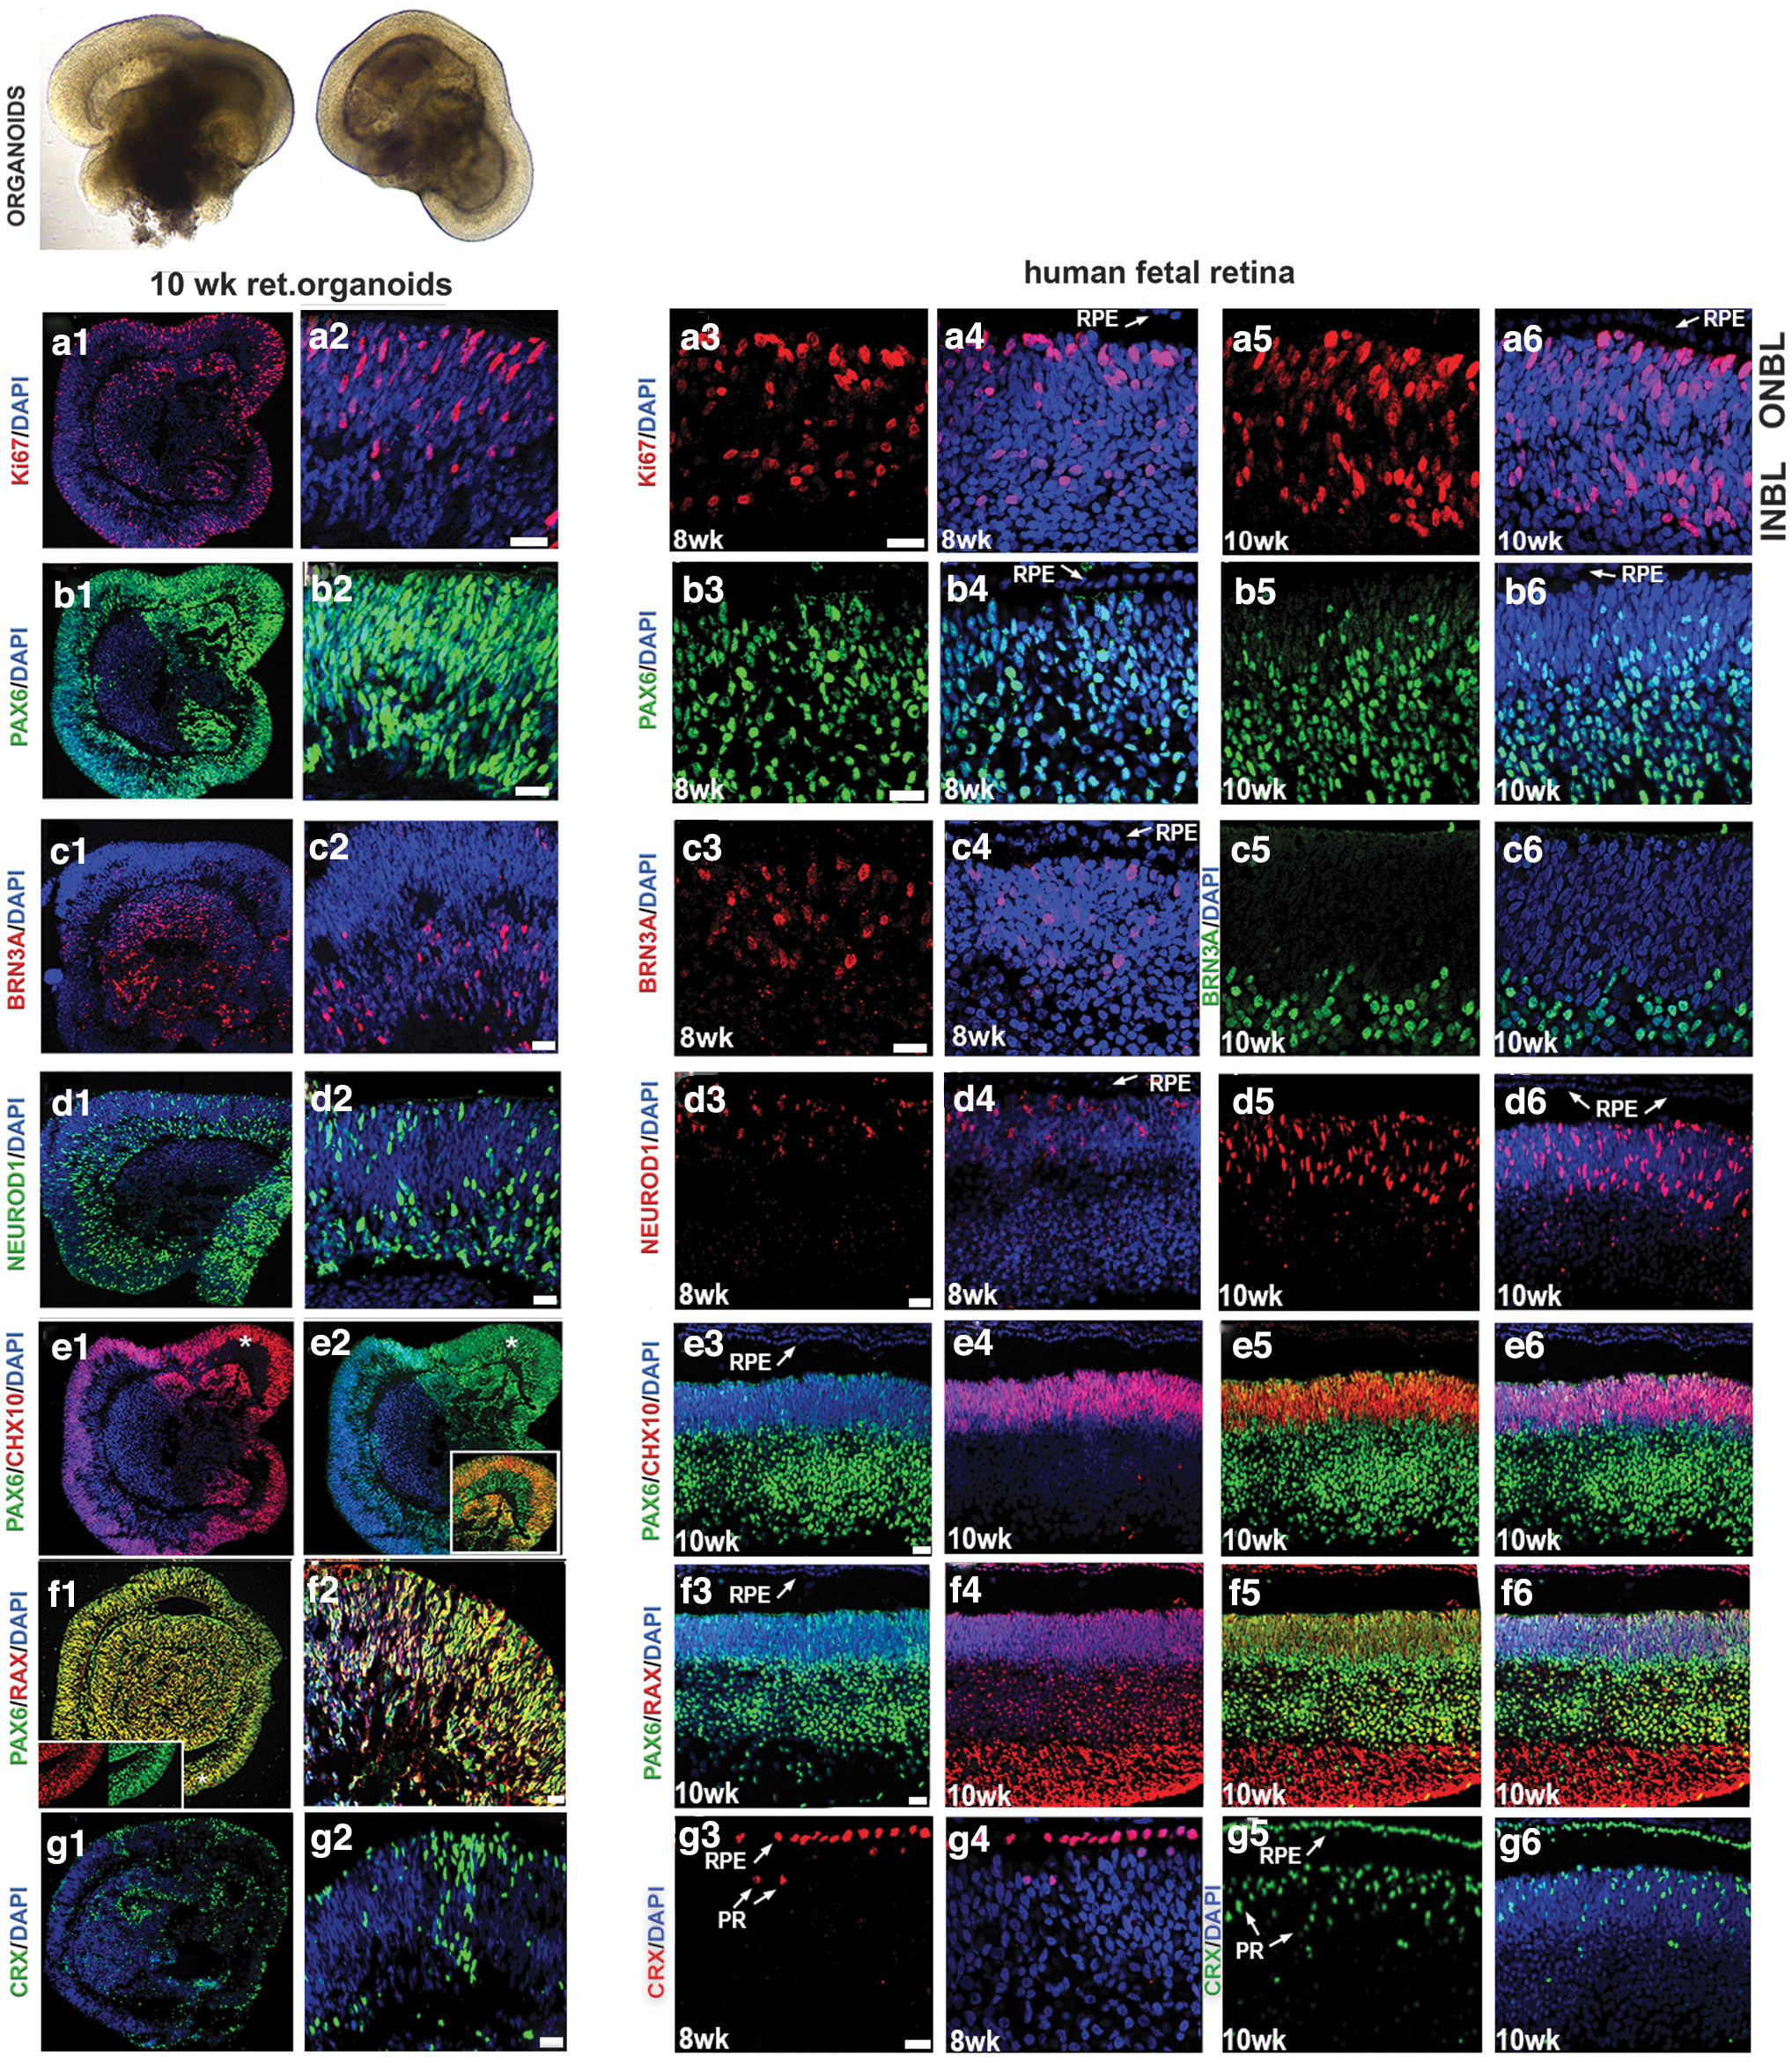
Comparing immunolocalization of multipotential retinal progenitor markers in the early human retinal organoids and human fetal retina. Immunohistochemical staining of hESC-derived retinal tissue (10 weeks) from hESC line H1 and human fetal retinal tissue (8 and 10 weeks) sections with antibodies specific to Ki67
Similar observations were noted in the human fetal retina (8–10 weeks) and in general matched the dynamics of developing mammalian retina (Fig. 1). We also observed another retinal progenitor marker OTX2 (45% ± 6% of total DAPI stained cells), the PR progenitor marker BLIMP1 (20% ± 4% of total DAPI stained cells), early stage PR precursor markers TRB2 (25% ± 6% of total DAPI-stained cells) and RXRG (35% ± 6% of total DAPI-stained cells), recoverin (RCVRN; 10% ± 5% of total DAPI-stained cells), SOX2 (86% ± 4% of total DAPI-stained cells), amacrine marker CALB2 (Calretinin; 35% ± 4% of total DAPI-stained cells), and ONECUT2 and retinal ganglion cell marker SNCG (35% ± 6% of total DAPI-stained cells) in retinal organoids. Similar observations were noted in the human fetal retina (Fig. 2 and Supplementary Figs. S3 and S4).
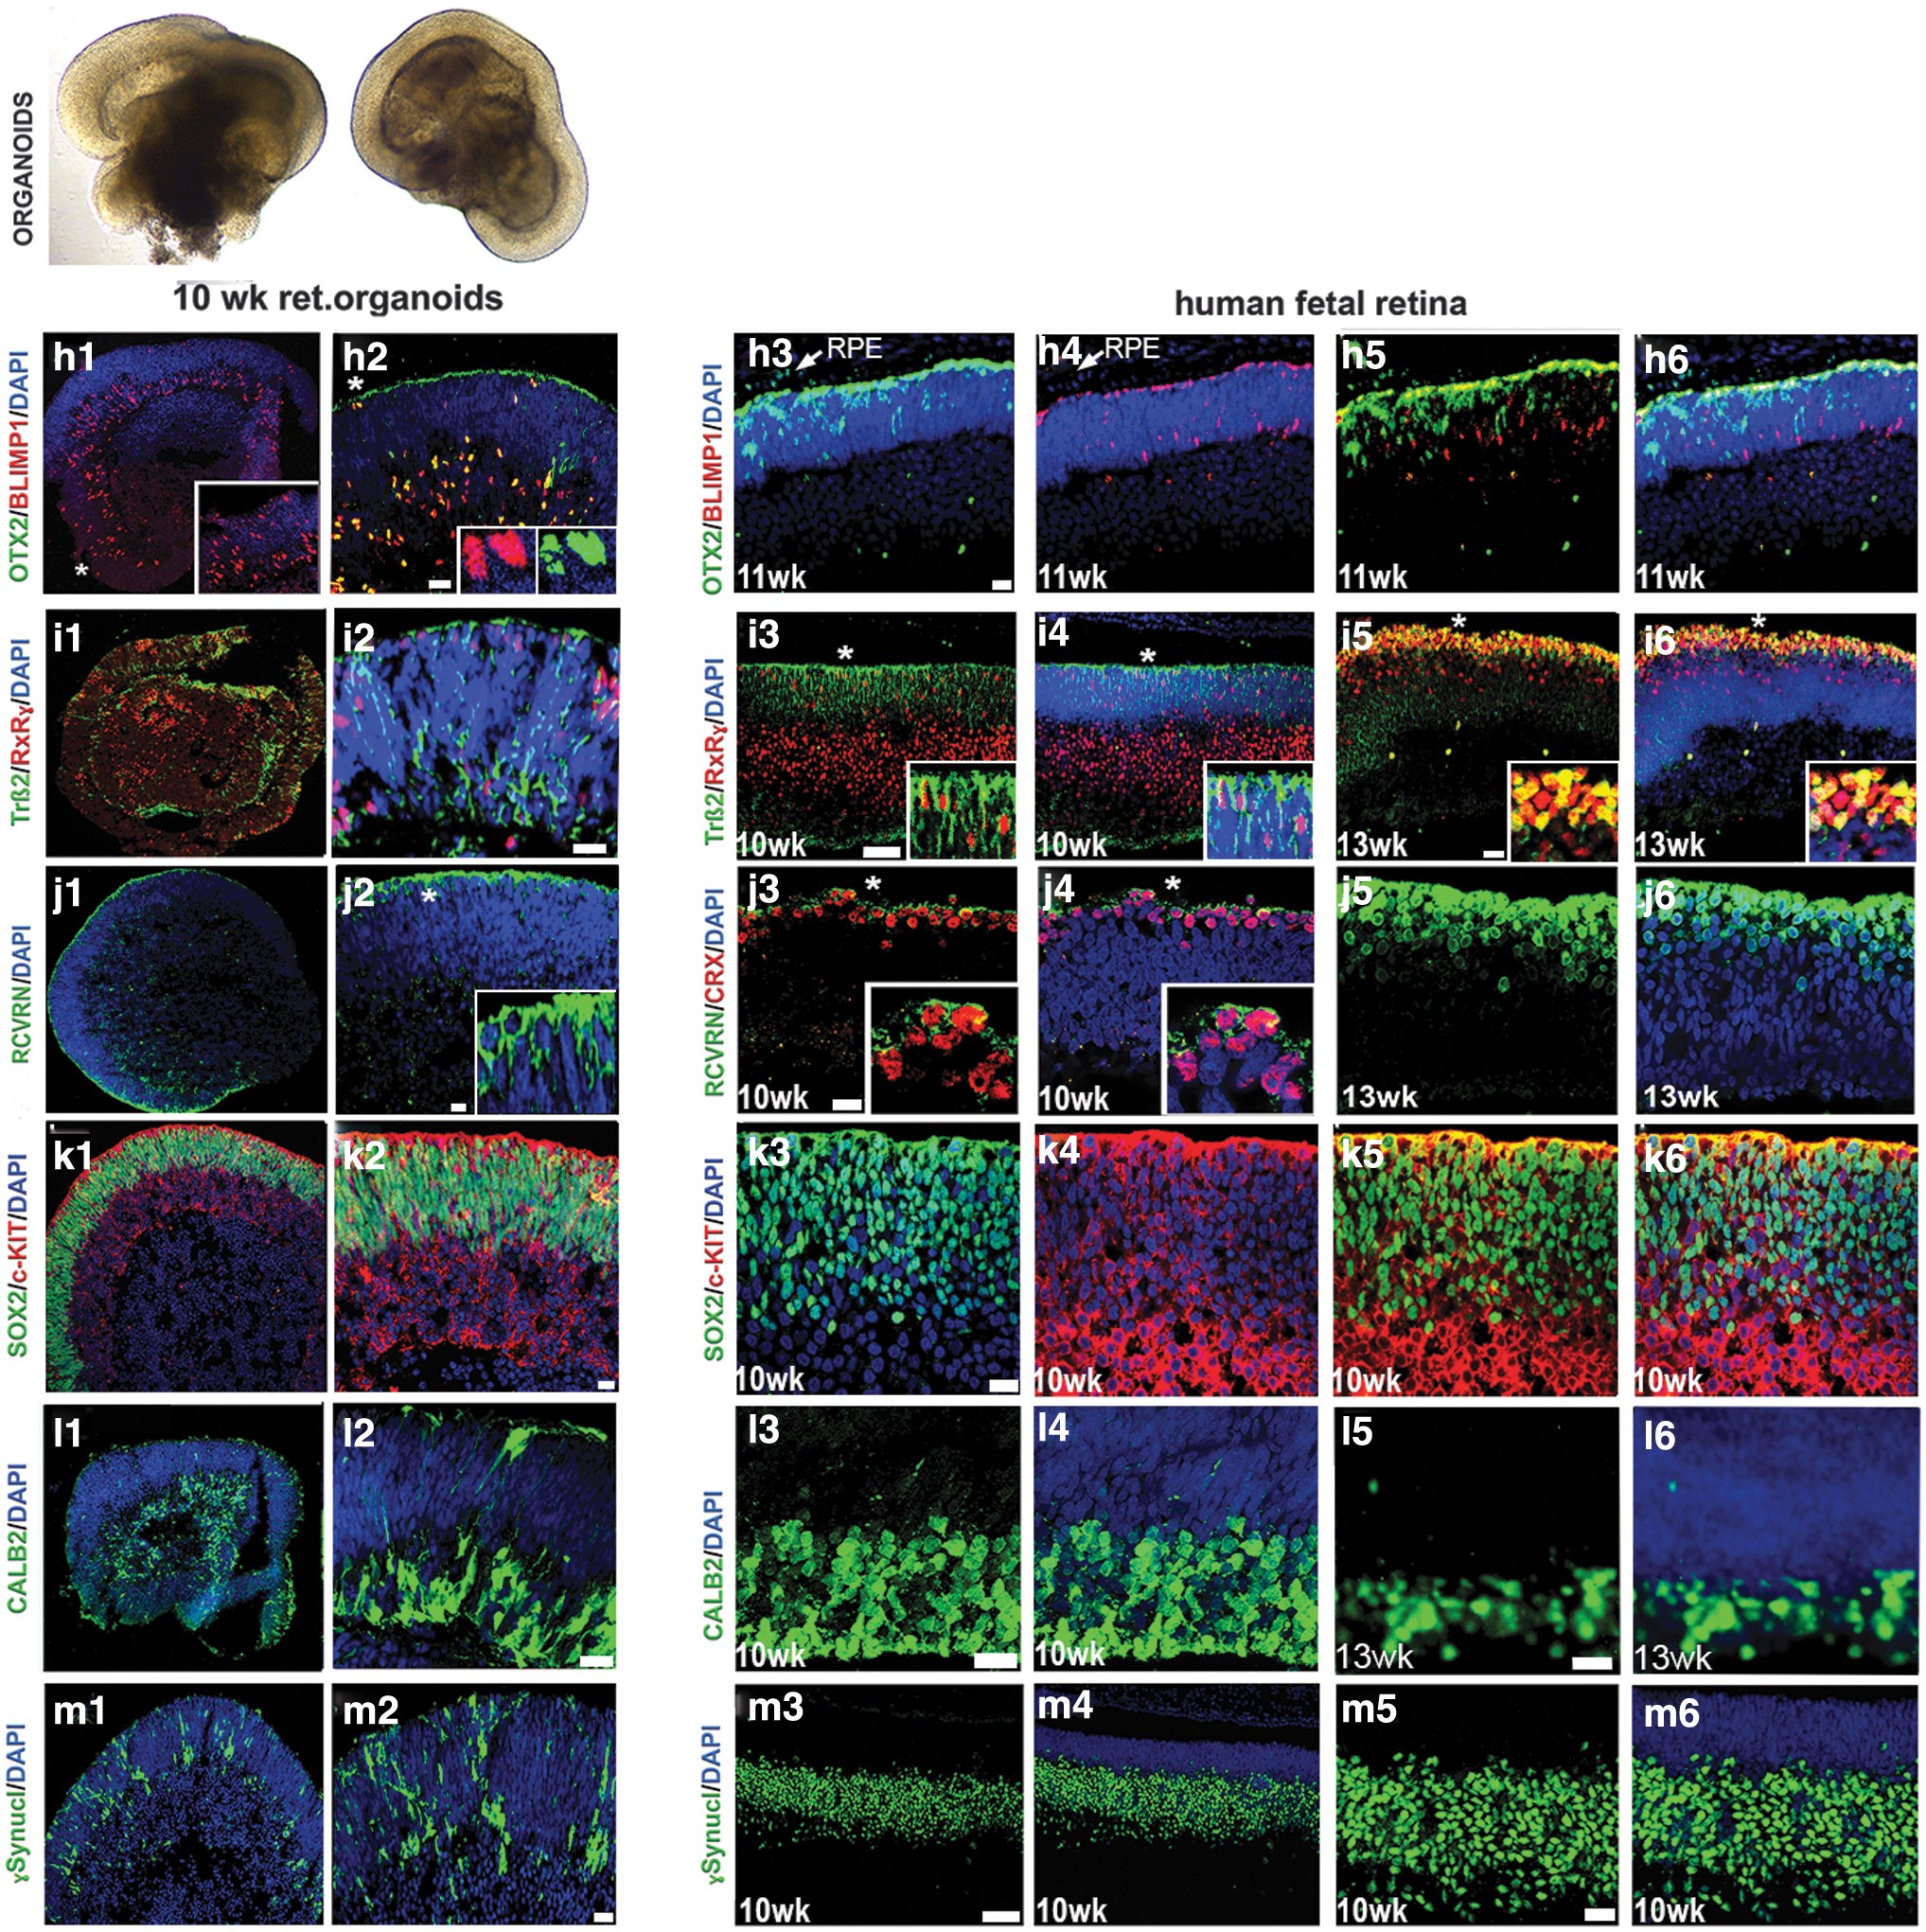
Comparing immunolocalization of multipotential retinal progenitor markers and retinal cell fate markers in early human retinal organoids and human fetal retina. Immunohistochemical staining of hESC-derived retinal tissue (10 weeks) from hESC line H1 and human fetal retinal tissue (10, 11, and 13 weeks) sections with antibodies specific to OTX2/BLIMP1
The retinal pigment epithelial layer was detected by immunolabeling with the antibody to pigmented RPE marker PMEL17 and the antibody to human nuclei (HNu) in retinal organoids and in 16 week-old human fetal retina (Supplementary Fig. S5). We observed a similar distribution of retinal progenitor markers in 10 weeks retinal organoids derived from ESI lines (ESI049, ESI017, and ESI053) (Supplementary Fig. S6).
Characterization of retinal organoids at late stage of differentiation reveals presence of rod and cone PRs
We were not able to compare the dynamics of older retinal organoids (24 weeks) and late-stage fetal retina (week 24 or later) due to unavailability of human fetal retinal samples of that age. Immunohistochemical analysis of older retinal organoids with antibodies to rod PR-specific (NRL, NR2E3) and rod-cone PR specific (CRX) transcription factors revealed the abundant presence of PRs in the outer nuclear layer of retinal organoids, where we observed several layers of NRL[+], NR2E3[+] nuclei (Fig. 3a1–a6, b1–b6).
The PR layer was the predominant remaining retinal layer in late-stage retinal organoids and retained structural preservation. NRL and NR2E3 staining was specific to rod nuclei, whereas CRX staining was specific to rod and cone nuclei. PR-specific markers rhodopsin (RHO), peripherin (PRPH2), RCVRN, aryl hydrocarbon receptor-interacting protein like 1 (AIPL1), and phosphodiesterase 6 alpha (PDE6A) were localized to the apical side of the retinal organoids in the OSs, and partially in the cell bodies (Fig. 3c1–c9, d1–d6, f1–f6).
Interestingly, RHO staining was nonuniform across the surface of the retinal organoids. On the contrary, RCVRN, AIPL1, and PRPH2 staining was uniformly distributed across the retinal organoids. More cells with PR-specific markers (typical for OSs) distributed in cell bodies were present in those PRs, which did not reach the apical zone (the rim) of the organoids. Double labeling of retinal organoids with RHO and PDE6A or RHO and AIPL1 demonstrated their presence in the OSs (Fig. 3d1–d6, f1–f6). The cone PR markers (OPN1SW and GNAT2) were uniformly distributed across the apical surface of the retinal organoids (Fig. 3e1–e6, h1–h6). The ratio of rod to cones in retinal organoids derived from hESC line H1 was 4:1, which matched the data reported earlier [18]. Immunostaining retinal organoids with antibodies to acetylated alpha-tubulin (AcTUBA1A) and ciliary rootletin (CROCC) showed their presence in the connecting cilium. We confirmed this by co-labeling with AcTUB1A and CROCC or OPN1SW with CROCC (Fig. 3e1–e6, h1–h6). We also observed the presence of GNAT1 (rod PRs), CALB1 (horizontal cells), CALB2 (amacrine cells), and GABA (major inhibitory neurotransmitter) markers in retinal organoids (Fig. 3 and Supplementary Fig. S7).
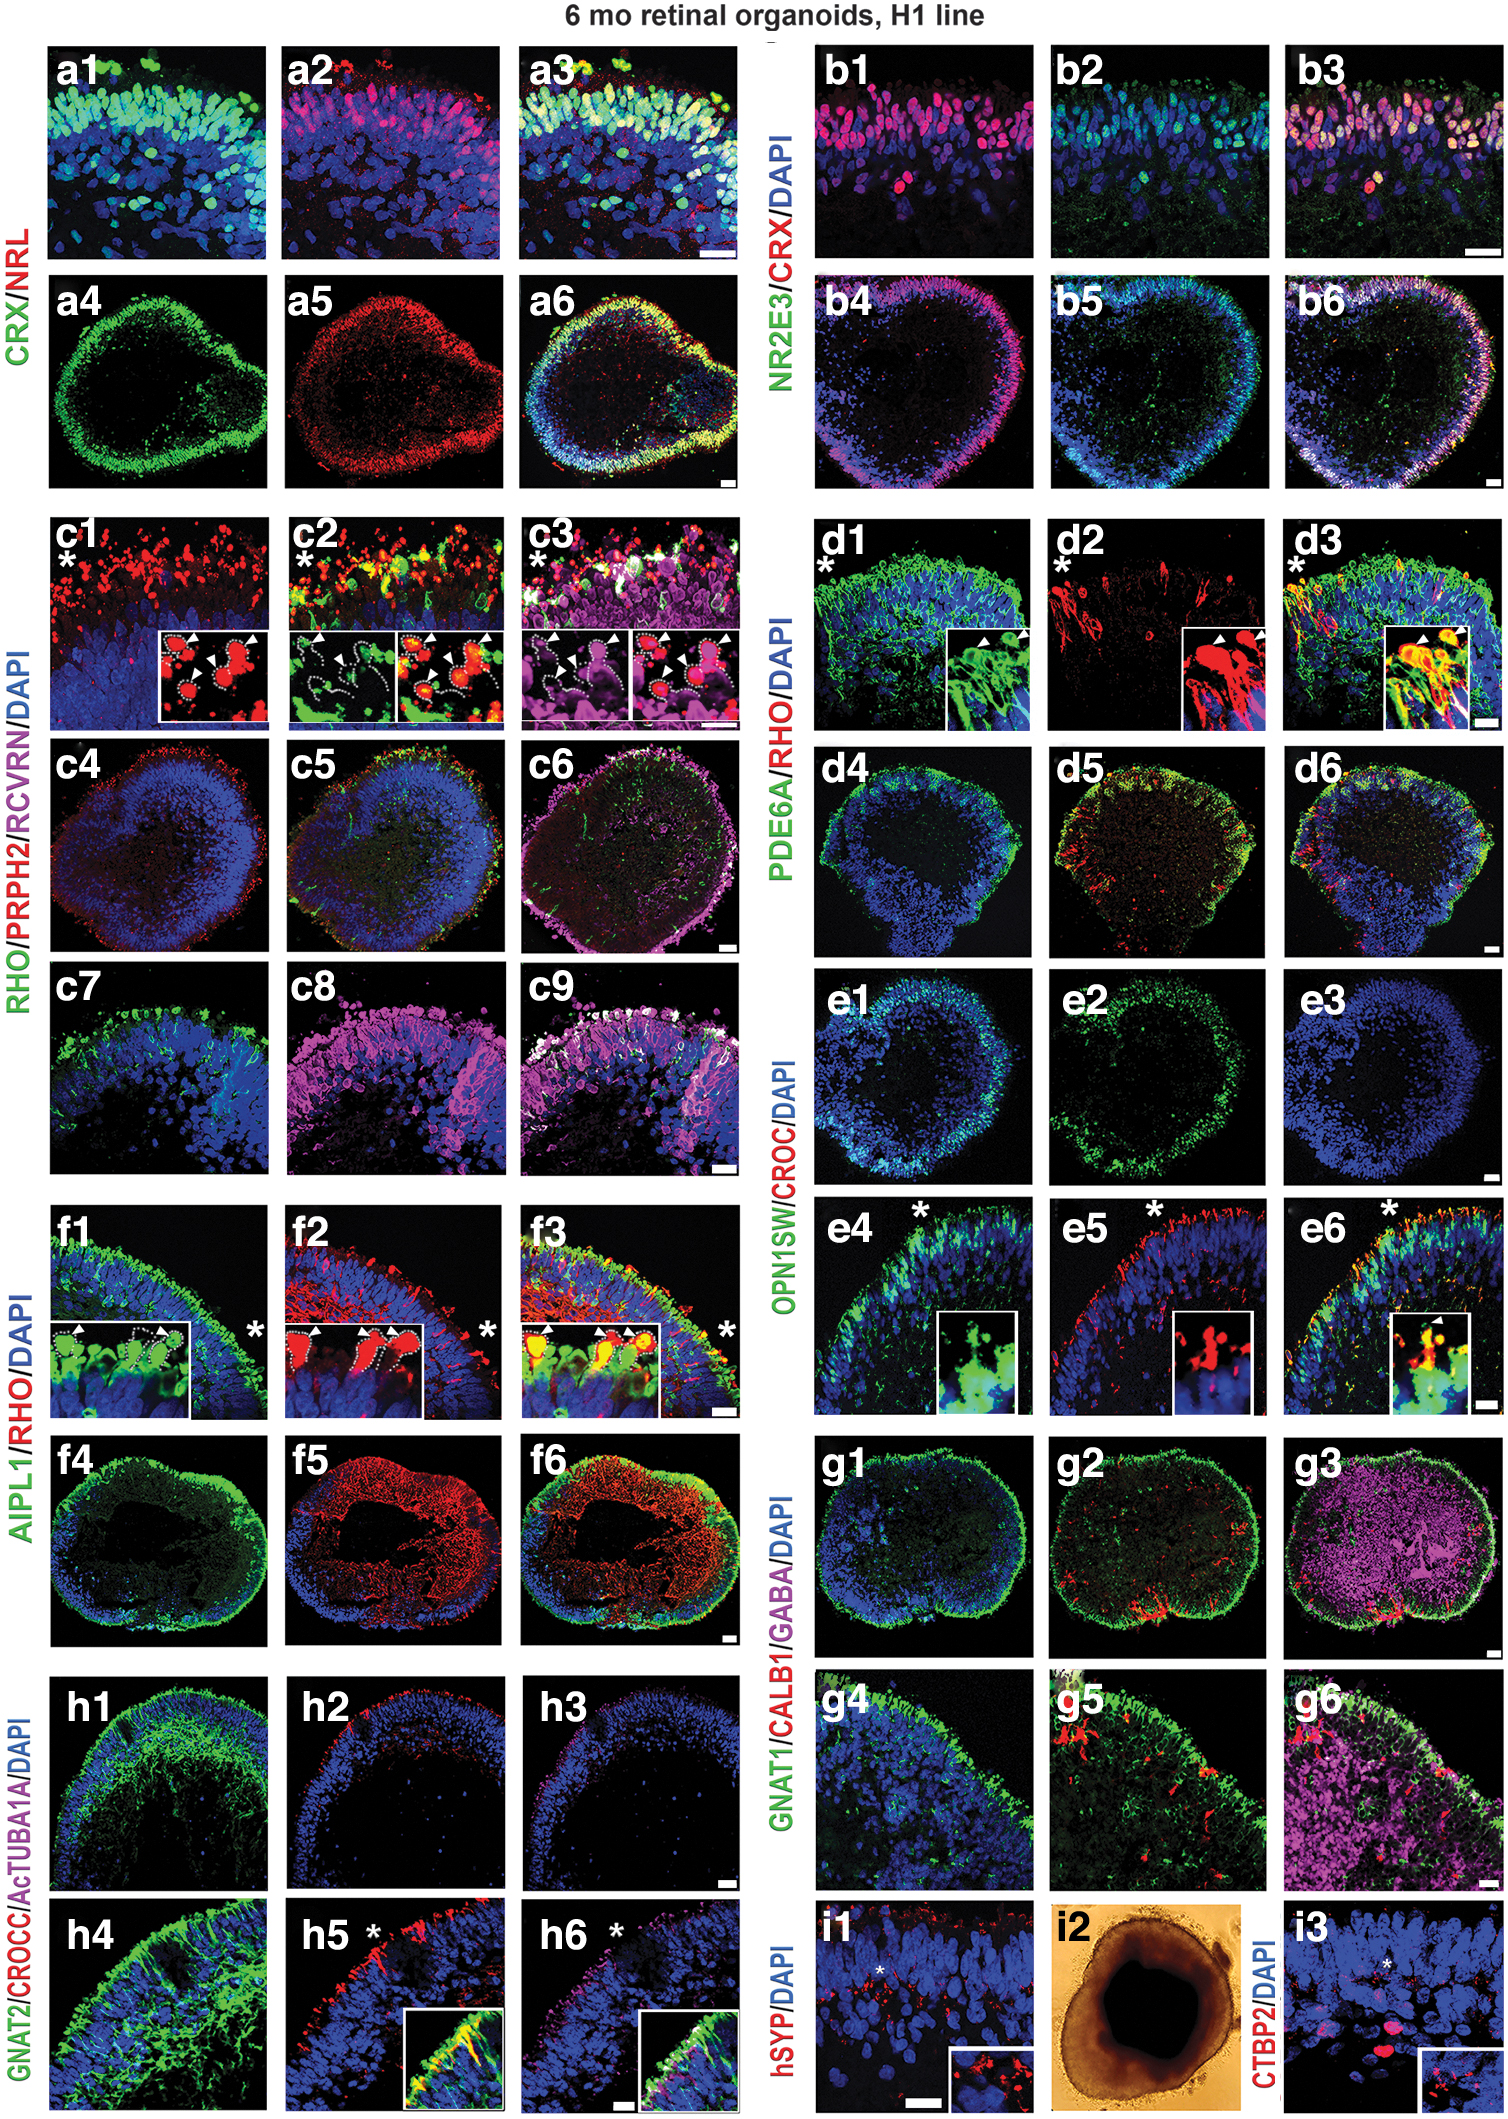
Presence of mature rod and cone PR markers, ciliary markers, and synaptic markers in the late human retinal organoids. Immunostaining hESC-derived retinal tissue (24 weeks) sections from hESC line H1 for NRL
Further, we found the evidence of synaptogenesis in the developing outer plexiform layer (OPL), as indicated by synaptophysin and CTBP2 immunoreactivity (Fig. 3i1, i3). We examined the presence of Muller glia (MG) in retinal organoids by immunostaining retinal organoids with CRALBP1 antibody. Immunostaining highlighted the presence of CRALBP1 in the MG cell bodies and MG processes through OPL and ONL terminating at the junction between the PR inner segment (IS) and OS. At the IS/OS junction, the MG end feet formed a thin, continuous structure (Supplementary Fig. S8). CRALBP[+] MG cells traversed the hESC-derived retina similar to that observed in mouse retina [38,44]. We did not observe the presence of rod or cone bipolar markers (PKCA, SCGN) in 24 week-old and older retinal organoids.
We found a similar distribution of PR markers in 24 week-old retinal organoids derived from ESI lines (ESI049, ESI017, and ESI053) (Supplementary Fig. S9).
Transmission electron microscopy
Ultrastructural analysis of retinal organoids (24 weeks) derived from hESC line H1 using transmission electron microscopy (TEM) uncovered the presence of PR OSs with formed/forming rudimentary OS disks, ISs, connecting cilia, and basal bodies (Fig. 4a–l). OSs and ISs were connected by connecting cilium with microtubule tracks (Fig. 4e). The ISs were rich with mitochondria that were involved in energy metabolism in PRs and served as a robust landmark for distinguishing the ISs in hESC-retina on TEM images (Fig. 4e). Below the ISs we observed the electron-dense structures corresponding to the outer limiting membrane (OLM) formed by Müller glia protrusions (Fig. 4e–g).
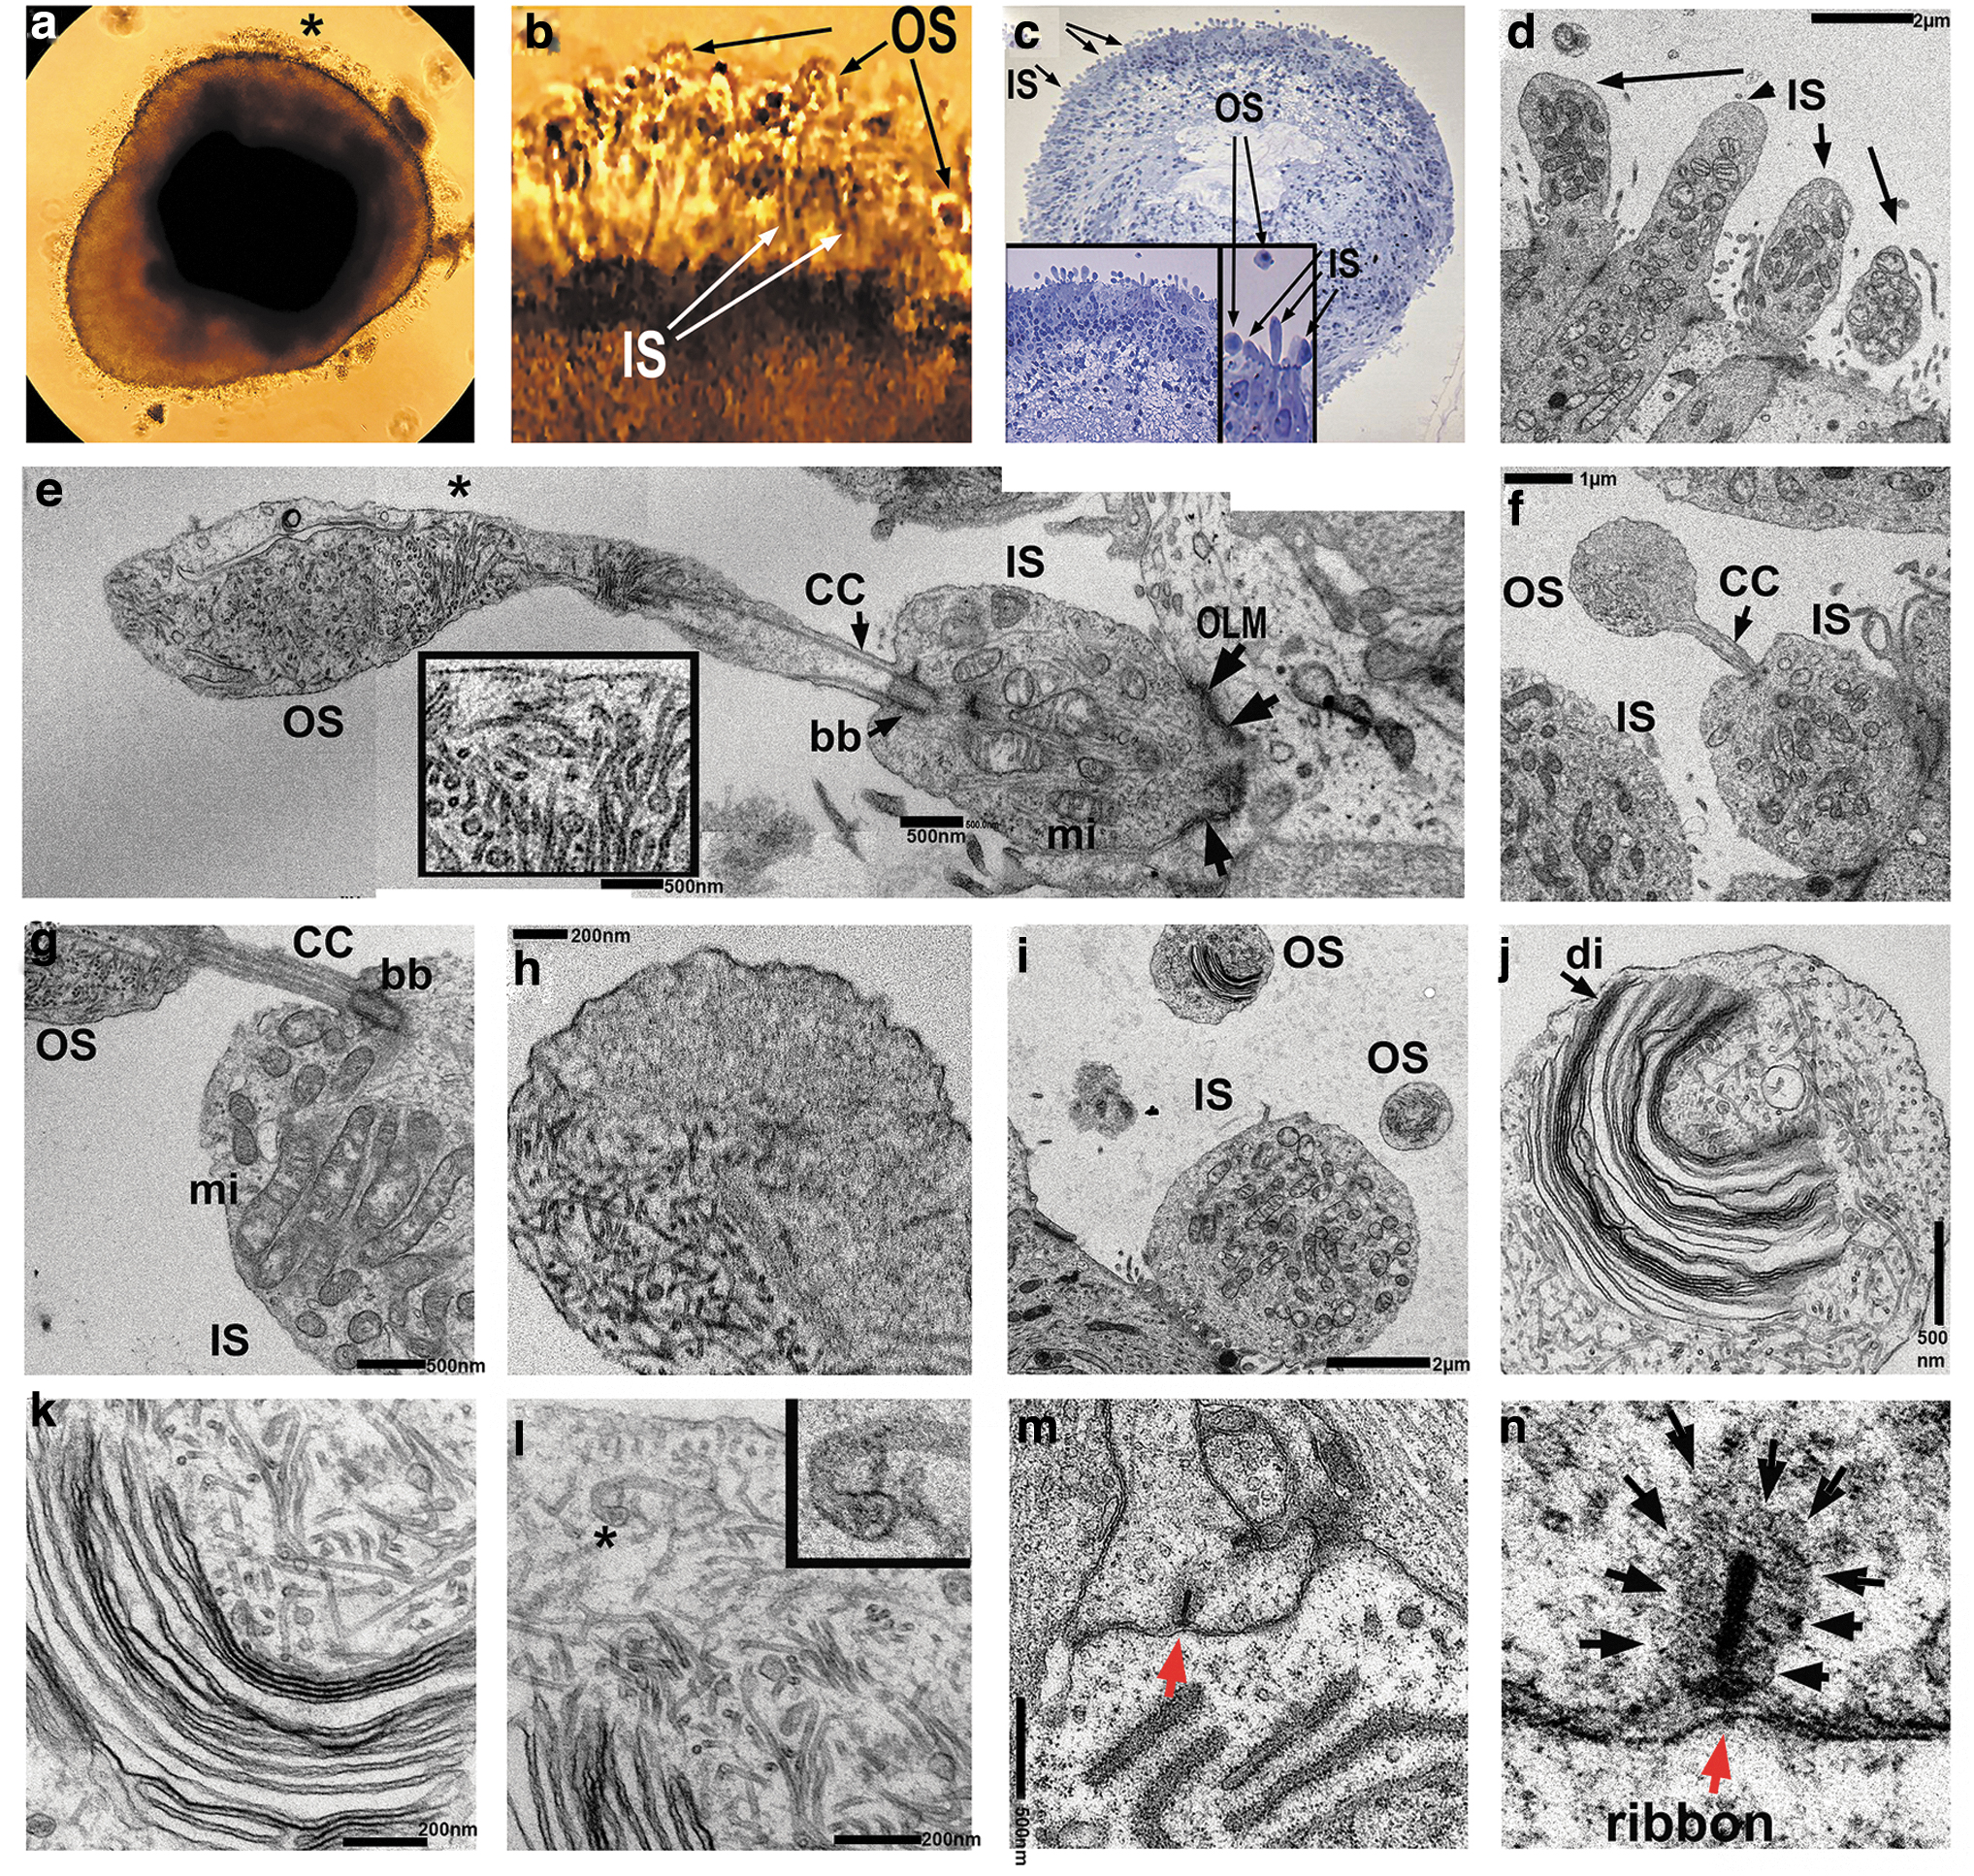
TEM analysis of late human retinal organoids.
The PR OSs revealed by TEM contained stacks of disks surrounded by the disk membranes (Fig. 4j), which were clearly immature, not closely spaced, not parallel to each other, and highly resembling those reported in the in vitro differentiating chick PRs (Supplementary Fig. S10a, b). The PR OSs are modified primary cilia consisting of aligned stacks of membranous disks enclosed by the plasma membrane [60,61]. Each disk has two parts, the hairpin-like rim region that comprises the edge of the disk and maintains the flattened morphology, and the lamellae of the disk that contains the machinery required to initiate phototransduction. We observed these structures by TEM (Fig. 4j–l). Electron-dense horseshoe-shaped structures (synaptic ribbons) [62] were also present in the OPL corresponding to synaptic terminals enriched in synaptic vesicles (Fig. 4m, n).
Dynamics of 5mC and 5-hmC in retinal organoids and human fetal retina
Immunohistochemical detection of 5mC and 5-hmC
Epigenetic marker (5mC and 5hmC) distribution is dynamic and changes at different stages of embryonic and fetal development in mammalian retina [33,34,63]. Therefore, 5mC and 5hmC distribution may be used as an additional method to compare the developmental stage of hESC-derived retinal tissue and human fetal retinal tissue.
To delineate 5mC and 5hmC signal in retinal organoids and human fetal retina, we used our previously reported immunohistochemical technique [33,34]. We compared the distribution of 5mC and 5-hmC in two sets of tissues: (1) early stage retinal organoids (10 weeks) versus human fetal retina (10 weeks), and (2) late stage retinal organoids (24 weeks) versus 16-week-old human fetal retina (Fig. 5). In early stage retinal organoids and 10 week-old human fetal retina, we found similarity in the distribution of 5hmC. The 5hmC signal in 10 week-old human fetal retina was predominant in the inner neuroblast layer (INBL) (double asterisk, Fig. 5.1.b1, b3, and inset in 1.b3), in line with earlier reports [33,34]. In retinal organoids, we also observed the 5hmC signal predominantly in the developing INBL; most cells in the INBL (double asterisk) and some cells in the ONBL (white asterisk) had 5hmC localized in the periphery of cell nuclei (Fig. 5.1.a1–a3, the inset in a1 is magnification of the area in INBL). This 5hmC staining pattern matched with our previously reported pattern of 5hmC distribution in developing mammalian retinal tissue [33]. In contrast, the 5mC (red) signal was mostly restricted to the chromocenters of the cell nuclei in both retinal organoids and human fetal retina (Fig. 5.1.a4–a6, 1.b4–b6).
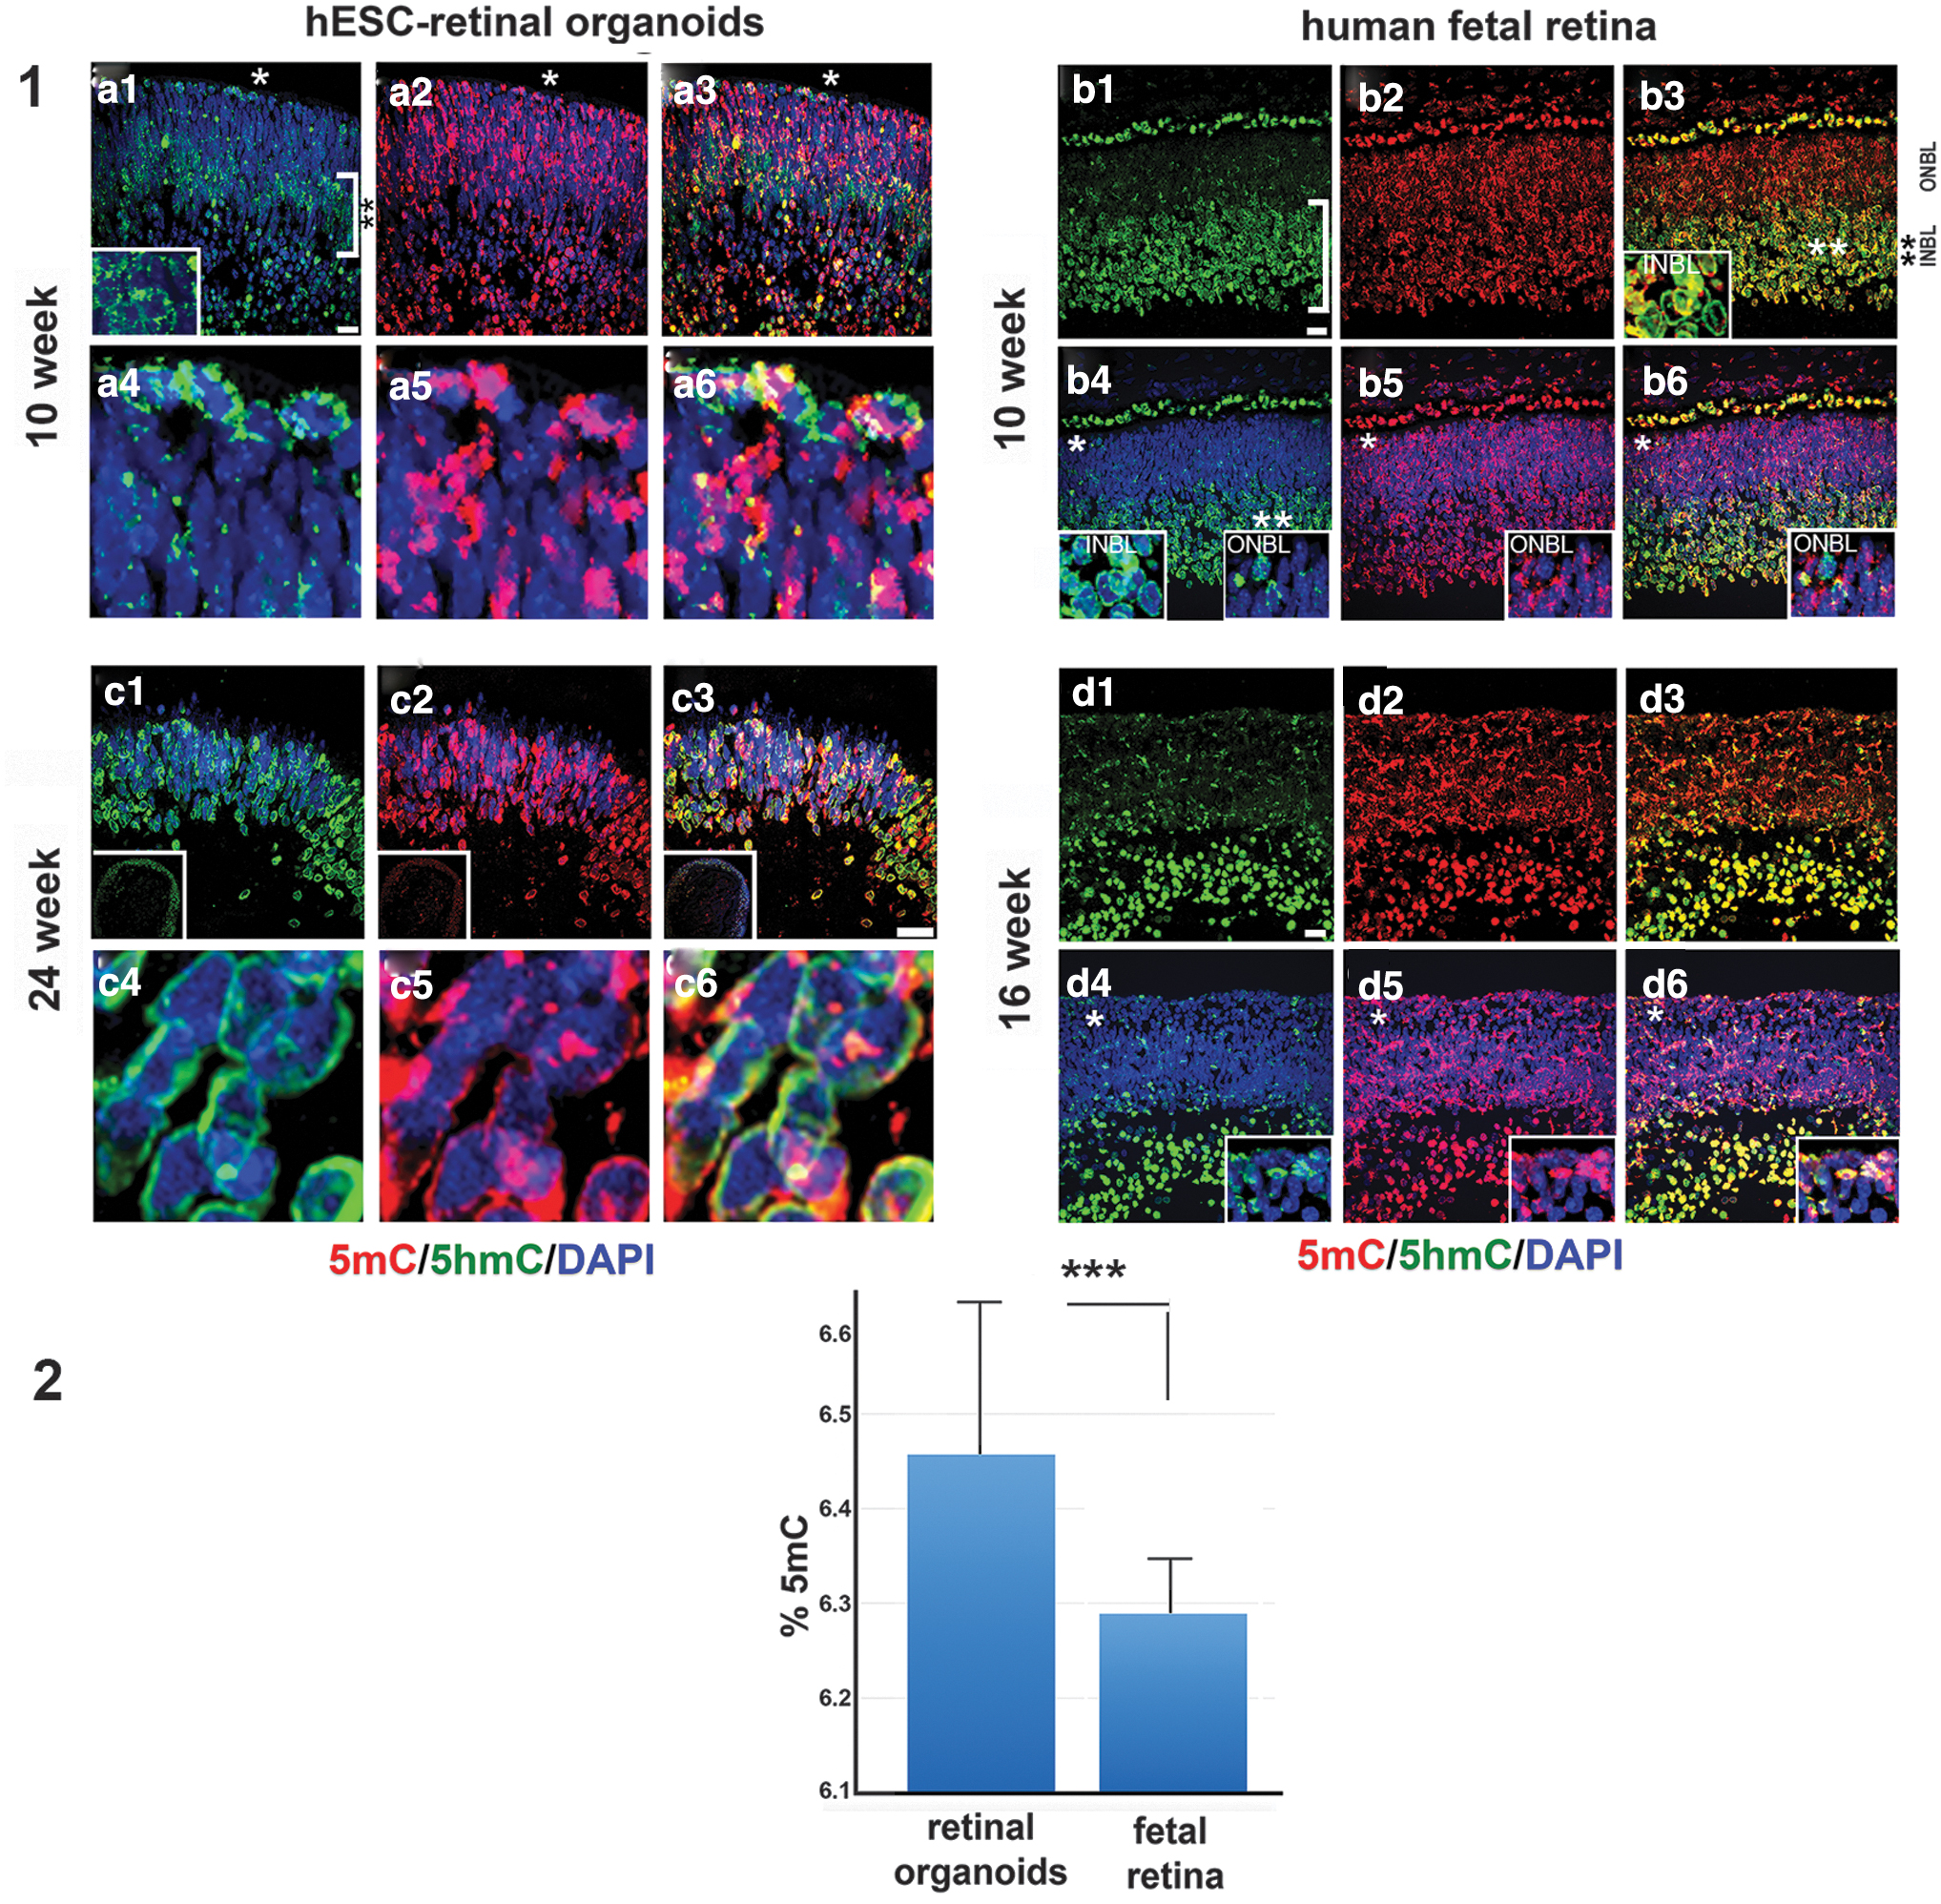
Immunolocalization of 5mC and 5-hmC in early and late human retinal organoids and developing human fetal retina.
In late stage retinal organoids (24 weeks) and human fetal retina (16 weeks), the 5hmC and 5mC distribution could not be compared directly because (1) most of the RGC cells were absent (degenerated) in organoids by 24 weeks, in agreement with earlier reported data [18], and (2) we did not have access to 24 week-old human fetal retinal tissue. However, we found that in late stage retinal organoids of the H1 line (where the rim almost exclusively comprise PRs) 5mC and 5hmC staining was confined to the nuclear periphery, in agreement with our earlier reported data in postmitotic mammalian PRs [33,34] (Fig. 5.1.c1, c4, d1, d4). The 5mC signal was additionally localized in the chromocenters (Fig. 5.1.c1–c6, d1–d6).
In 16 week-old human fetal retina, we saw further segregation of 5hmC in INBL, compared with that observed in 10 week-old human fetal retina (in line with what was reported in developing mammalian retina [33,63]). The 5mC/5hmC distribution within the nuclei in ONBL in 16-week-old fetal retina still lacked a pattern typical for mature PRs. Only some nuclei displayed aggregation of 5mC in the center of a nucleus (central heterochromatin), as reported in mature rod PRs in mammalian retina [33,34,64].
Quantification of global DNA methylation (5mC) and hydroxymethylation (5hmC)
To detect the level of 5mC and 5hmC in retinal organoids and human fetal retina we did mass-spectrometry on 10 week-old retinal organoids (10 organoids, pooled sample) and human fetal retina (2 pooled retinas). The total amount (%) of both 5mC and 5hmC was calculated by using the area ratio and standard curves in the range of 0%–2.5% 5hmC/dG or 0%–25% 5mC/dG by using Zymo Research protocol. Both samples had quantifiable amounts of 5mC, between 6.2% and 6.6% and low levels of 5hmC, at around the lower limit of quantitation (based on Zymo Research standards).
Statistical evaluation of results was done with GraphPad Prism software (GraphPad Software, Inc., San Diego, CA). The calculated range of 5mC (percentage, triplicate run) in hESC-derived retinal tissue was 6.188%, 6.646% and 6.537% [mean: 6.457, standard deviation (SD) ±0.195] versus 6.263%, 6.365%, and 6.240% (mean: 6.289, SD ±0.054) in human fetal retina. The difference in the two means was statistically significant (P < 0.0001, unpaired t-test). The calculated range of 5hmC (percentage, triplicate run) in hESC-derived retinal tissue (percentage, triplicate run) was 0.007%, 0.008%, and 0.007% (mean: 0.007, SD ±0.0005) versus 0.054%, 0.055%, and 0.063% (mean: 0.057, SD ±0.0040) in human fetal retina. The two means differed significantly (P < 0.0001).
Immunophenotyping of hESCs-derived retinal tissue and human fetal retina
PRs are the most critical cell type for developing cell replacement strategies for RDs such as RP, AMD, and LCA. To quantify and compare the percentage of progenitors and early PRs present in the hESC-derived retinal tissue and in human fetal retina, we performed flow cytometry analysis of cells isolated from hESC-derived retinal tissue (12 weeks) and human fetal retina (13 weeks), using neural progenitor and PR cell surface markers used by others to characterize PR precursors in mammalian retina and retinal organoids [65 –67]. We used CD15 (stage-specific embryonic antigen 1), CD29 (integrin beta 1, ITGB1), CD133 (prominin-1, marker of symmetric division and present in young PRs in developing retina) [65], and PR precursor cell surface marker (CD73) [68] (Fig. 6). In earlier reports by Lakowski et al., CD133, together with CD73 or/and CD24, were used as biomarkers for positive PR selection from young postnatal mouse retina [69] and mouse ES cell-derived retinal organoids [65].
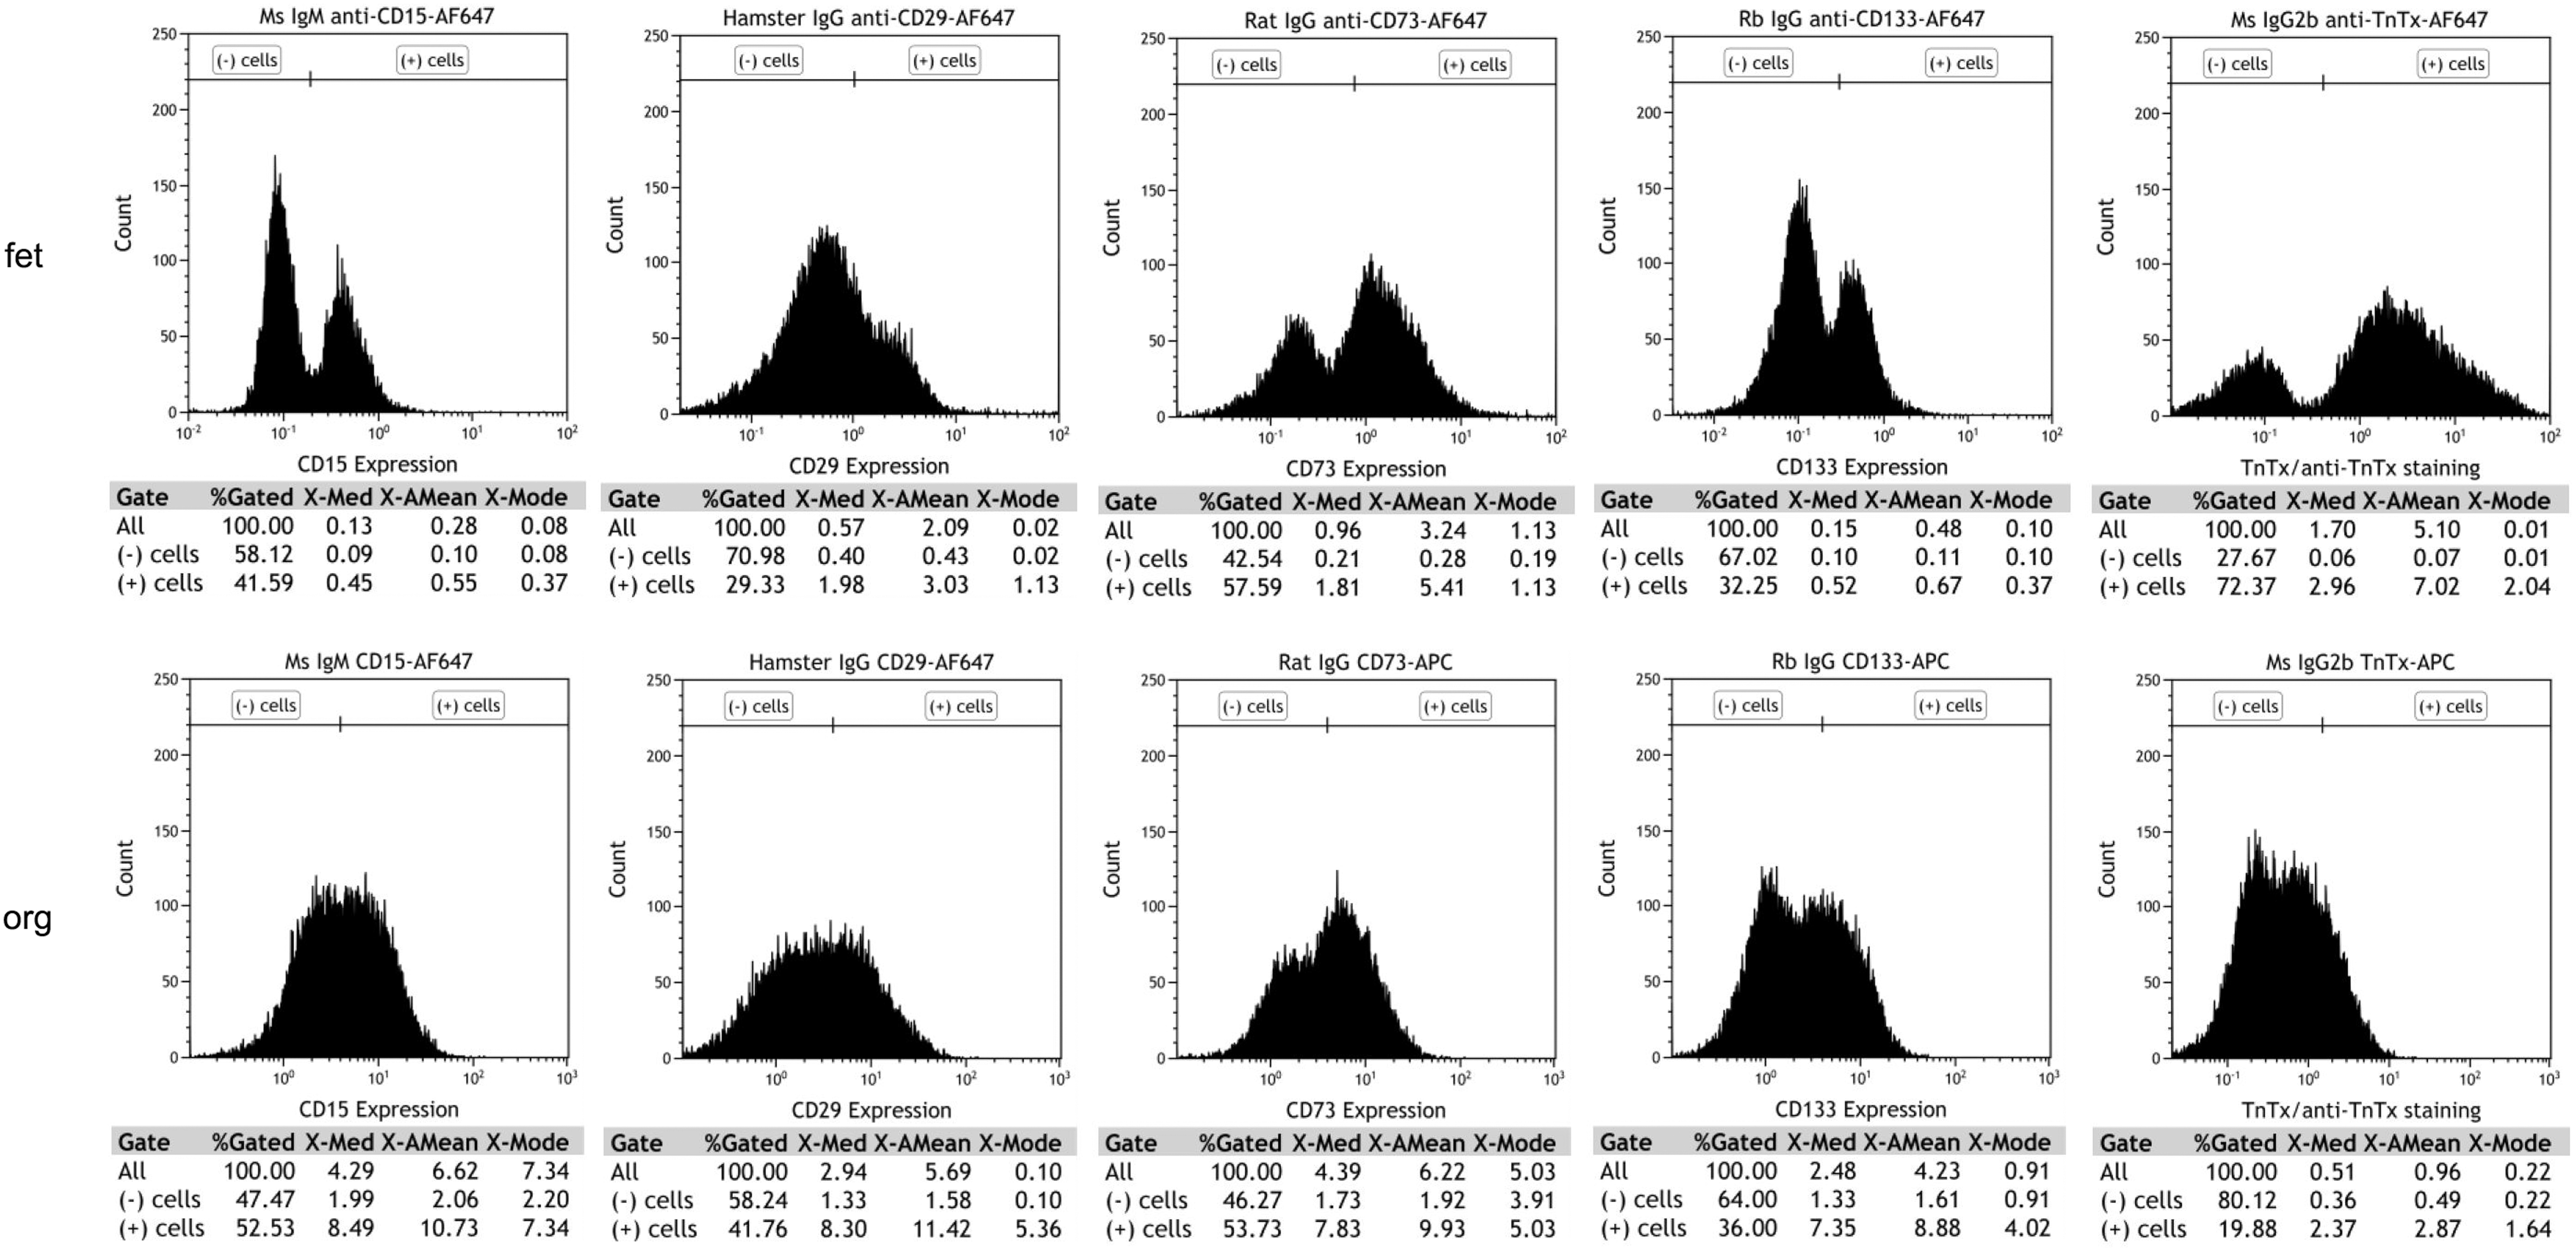
Flow cytometry analysis of cell surface markers expression in the human retinal organoids (week 12) from hESCs line H1 and human fetal retina (week 13). Flow cytometry analysis shows similarity in the percentage of cells positive for CD15, CD29, CD73, and CD133 in human retinal organoids and human fetal retina.
In hESC-derived retinal tissue, CD15+ cells and CD29+ cells represented 52.53% and 41.76% of the total population of sorted cells whereas in fetal retina they represented 41.59% and 29.33%, respectively. The PR-specific cell surface marker CD73+ and CD133+ cells in hESC-derived retinal tissue represented 36% of the total population of live cells sorted, respectively. However, in fetal retina, CD73+ and CD133+ cells represented 57.59% and 32.25%, respectively (Fig. 6). Data represented here are from a single set of experiments. Due to the limitation of procuring human fetal retinal tissue, we were not able to replicate the results in three independent experiments. In sum, our data show strong similarity in cell surface antigens between 12-week-old hESC-derived retinal tissue and developing human fetal retina.
Transcriptomic profile of hESC-derived retinal tissue and human fetal retina
To understand the similarities in global gene expression patterns of retinal organoids and fetal retinal tissue, we conducted RNA-seq analysis on early stage retinal organoids (10 weeks, derived from hESC line H1, n = 35) and fetal retinal tissue at 8 (n = 2), 10 (n = 2), 11 (n = 2), 13 (n = 2), and 16 (n = 2) weeks. We also analyzed the transcriptome of late stage retinal organoids (24 weeks, derived from hESC line H1, n = 30) and compared them with the transcriptome of previously reported human fetal retina at weeks 18, 19, and 23 [70,71]. RNA seq data represented here were generated from a single set of experiments (pooled samples). Due to the limitation of procuring a sufficient number of human fetal retinal tissue samples, we were not able to run three independent experiments.
The RNA-seq datasets generated had high-quality metrics, including sequencing quality, alignment quality, and number of unique mapped reads (Supplementary Tables S2–S4).
Box plots were generated to evaluate the dynamic range of the fragments per kilobase of exon per million fragments mapped (FPKM) values, representing the relative gene expression in early stage retinal organoids and human fetal retina. Overall, FPKM expression values were similar in early stage retinal organoids and human fetal retinal tissue at 8, 10, 11, 13, and 16 weeks (Supplementary Fig. S11A, B). The correlation coefficient analysis, hierarchical clustering, and PCA (principal component analyses) plot were done to find similarities between early stage retinal organoids (10 weeks) with human fetal retina at 8, 10, 11, 13, and 16 weeks. In all the analyses, we found that early stage retinal organoids (10 weeks) were clustered closely with the human fetal retina at 8–10 weeks (Fig. 7a and Supplementary Fig. S11C, D). Similar analyses done on late stage retinal organoids and fetal retina (18, 19, and 23 weeks) and these found close clustering of 24 weeks' retinal organoids with 18 and 19 weeks' fetal retina (Supplementary Fig. S12A–D).
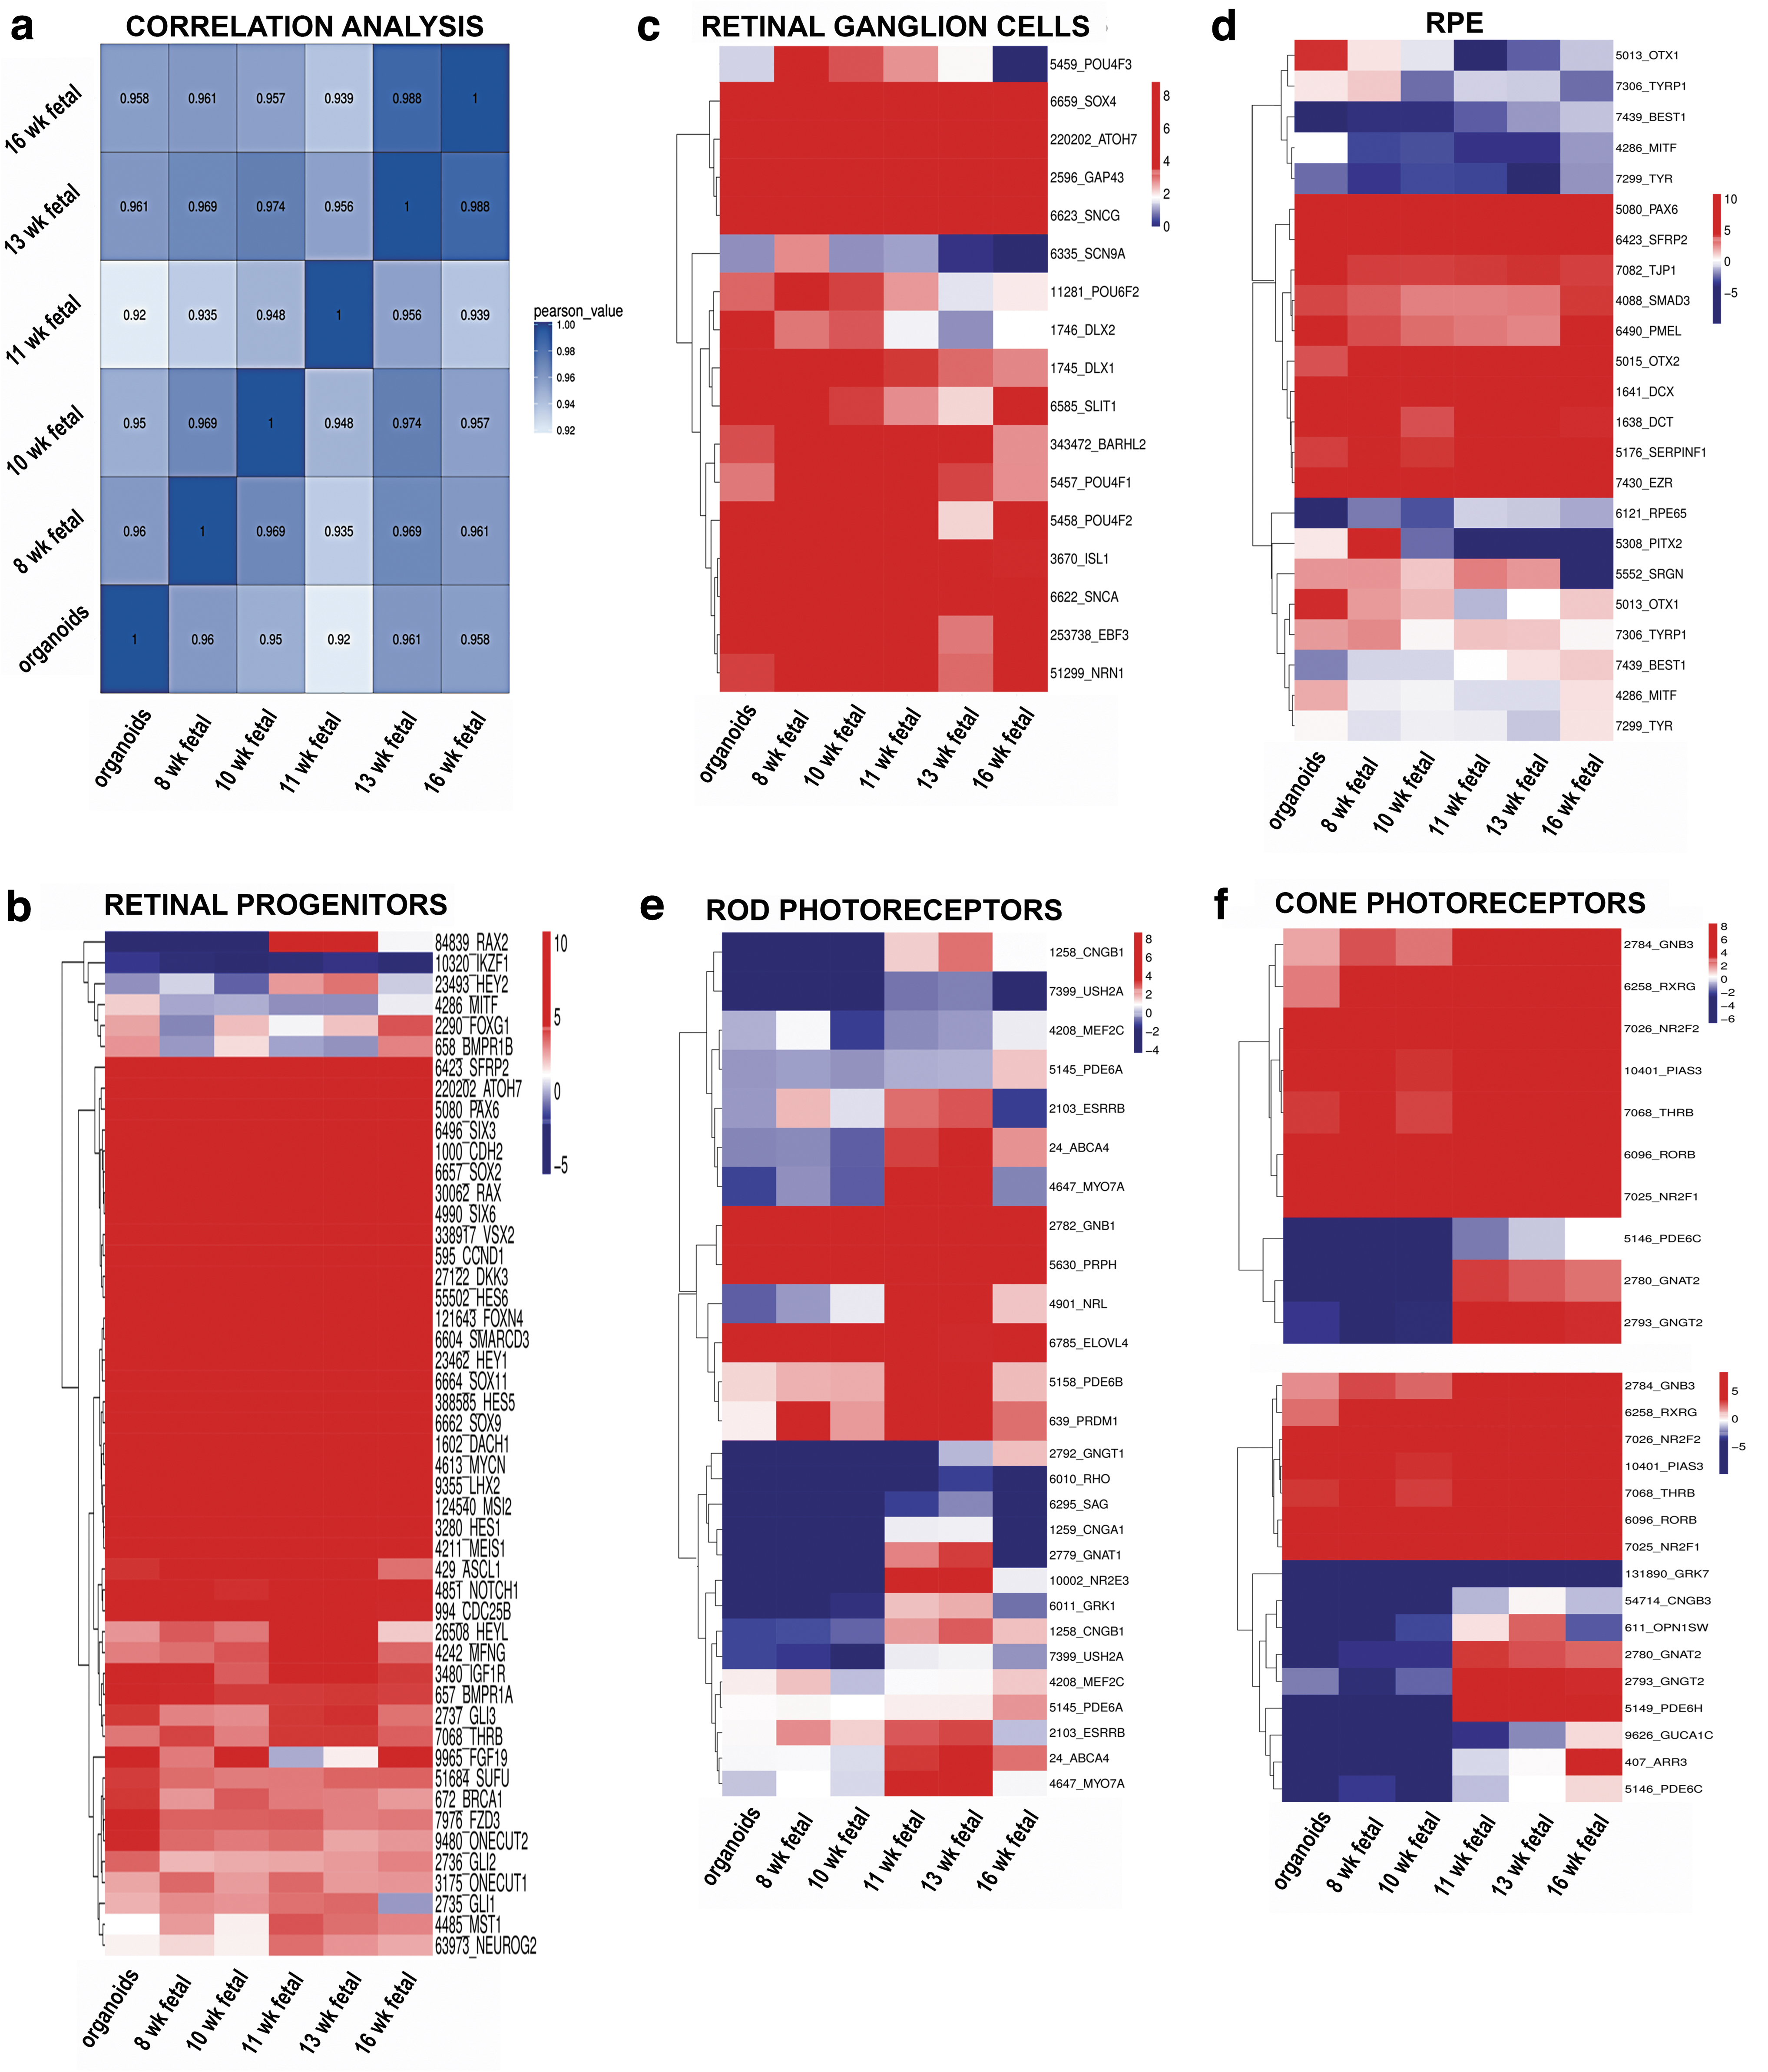
Gene expression cluster analysis of early human retinal organoids (week 10) from hESCs line H1 and human fetal retina at weeks 8, 10, 11, 13, and 16.
To analyze the differentiation of each retinal cell type, we clustered the expression of cell lineage specific markers in the dataset of bulk RNA-seq results. Consistent with our immunostaining results, we found high gene expression levels of retinal progenitor markers RAX, VSX2, PAX6, LHX2, SIX3, CCND1, SOX2, SCFR (c-KIT), SFRP1, and CHX10 in retinal organoids (10), (24 weeks) and human fetal retina at 8, 10, 11, 13, 16, 18, 19, and 23 weeks (Fig. 7b).
Multipotential retinal progenitors contributing to PR cell fate acquisition (identified with antibodies to OTX2, NEUROD1, and BLIMP1) were highly upregulated in 10 weeks' retinal organoids and downregulated in 24 weeks' retinal organoids (Fig. 8b). During retinal development, RGCs are the first cell type to develop. The RGC markers ISL1, POU4F1, POU4F2, DLX1, SNCG, EBF3, and SLIT1 were upregulated in early stage retinal organoids (week 10) and human fetal retina (Fig. 7c). Interestingly, in late stage retinal organoids, we observed downregulation in gene expression of RGC markers compared with human fetal retina (Fig. 8c).
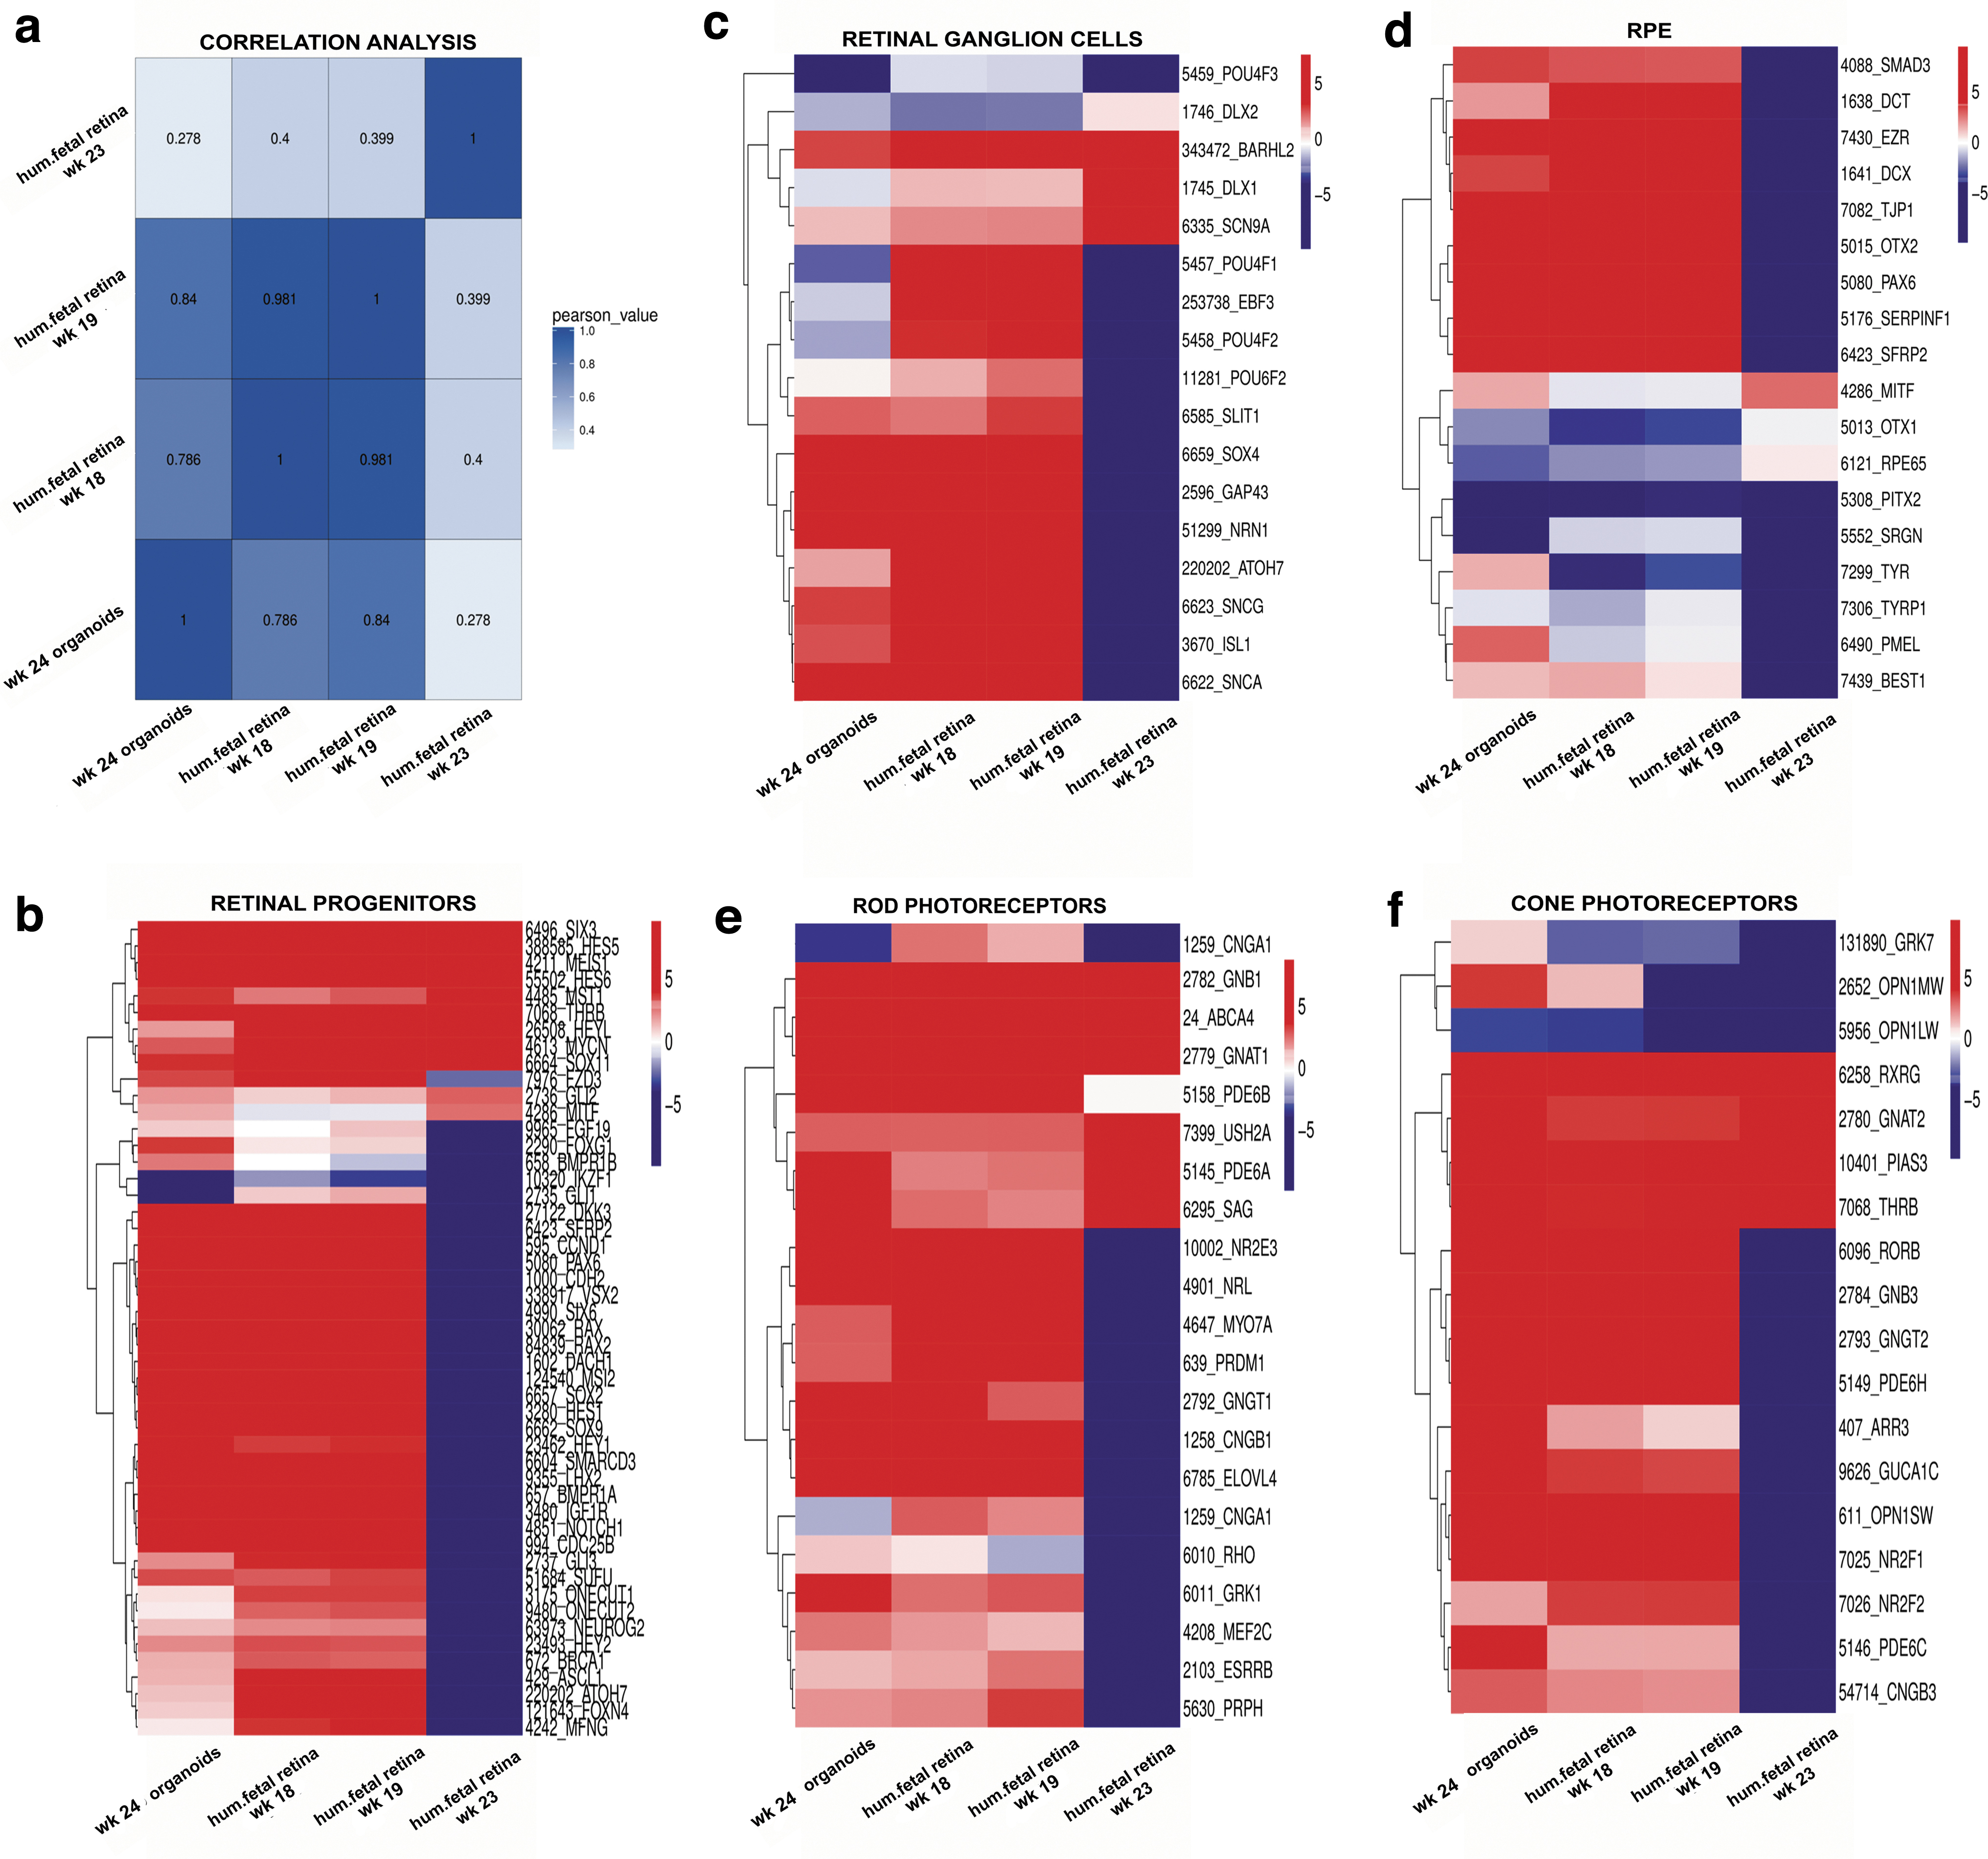
Gene expression cluster analysis of late human retinal organoids from hESC line H1 and human fetal retina at weeks 18, 19, and 23.
The RPE cells are known to differentiate relatively early in development during optic cup formation [72]. We found that some RPE markers EZR, SERPINF1, DCT, and PMEL were upregulated in the retinal organoids (weeks 10 and 24) and human fetal retina, whereas other RPE cell markers TYR, MITF1, and BEST1 were downregulated in both retinal organoids and human fetal retina (Figs. 7d and 8d).
Rod PR-specific transcription factors NRL, NR2E3 and rod-specific genes coding for structural rod PR proteins (RHO, GNAT1, GRK1, CNGA1, AIPL1, ROM1, ABCA4, PRPH) were expressed at a low level in the early stage retinal organoids and human fetal retina; however, these genes were sharply upregulated in late stage retinal organoids (24 weeks) (Figs. 7e and 8e). Early cone PR markers (RXRG, THRB, RORB, RORA, GNGT2, GNB3, SALL3, and ONECUT1,) were upregulated in week 10 retinal organoids; however, the genes coding for proteins important for structure/function in mature cone PRs OPN1SW, OPN1MW, ARR3, PDE6H, PDE6C, GRK7, and AIPL1 were not upregulated (Fig. 7f and Supplementary Fig. S13).
In late stage retinal organoids (week 24), we observed sharp upregulation of OPN1SW, OPN1MW, ARR3, PDE6H, PDE6C, PDE6H, GRK7, AIPL1 and other genes typical for mature cones (Fig. 8f and Supplementary Fig. S14). Amacrine cell markers CALB1, MEIS2, SLC1A3, and NEUROD4 were upregulated in both early and late stage retinal organoids and a similar gene expression pattern was observed in the human fetal retina (Supplementary Figs. S13 and S14). We found that horizontal cell markers CALB2, ONECUT1, and STX4 were upregulated in the early stage retinal organoids but these markers were downregulated in the late stage retinal organoids (week 24). In contrast, these markers were upregulated in human fetal retina (Supplementary Figs. S13 and S14).
In addition, we examined the expression level of known retinal cell surface markers as well as genes reported to code for neuroprotective proteins in human retinal organoids and human fetal retinal tissue. We found upregulation of cell surface markers CD24, CD29 (ITGB1), CD325 (CDH2), CD36 (SCARB2), CD292 (BMPR1A), CD119 (IFNGR1), CD221 (IGF1R), CD231 (TSPAN7), CD107 (LAMP1), and CD171 (L1CAM) and downregulation of cell surface markers CD26 (DPP4), CD142, and CD207 in early and late stage retinal organoids and human fetal retinas (Supplementary Figs. S13 and S14).
Neuroprotective genes involved in preventing retinal cell death and allowing functional recovery after injury such as SPP1, CLU, BSG, CRABP1, SERPINF1, CXCR4, and SOD1 were upregulated in both early and late stage retina organoids and fetal retina (Supplementary Figs. S13 and S14).
Taken together, RNA-seq data reveal strong similarities in gene expression profiles between retinal organoids and human fetal retina during retinal development in a dish and in vivo.
Discussion
The research in the past 15–20 years indicates that a piece of degenerating mammalian retina can be replaced with healthy fetal retinal tissue, which can improve vision in animals as well as in human patients with RP and AMD (clinical trial Nos. NCT00345917 and NCT00345917 [14 –16]). Grafted fetal retina completes differentiation, synapses on to the recipient retinal ganglion cell neurons, and re-establishes connectivity with the visual cortex [73 –77]. Retinal tissue replacement appears to be a method of choice in cases of advanced RD, where newly grafted PRs may not be able to find a suitable niche in the recipient retina (the outer nuclear layer) to integrate.
Compared with the transplantation of retinal progenitor suspension [11,78], transplanting developing retinal tissue may be more productive in general as retinal function strongly depends on preservation of retinal structure (present in hESC-retina as well as human fetal retina). However, human fetal-derived retinal tissue source is very limited, and its clinical use for this promising therapy is ethically not acceptable.
Substantial progress in derivation of retinal progenitors and RPE from hESCs has been achieved [11,78 –80]. Research in the past 10 years demonstrated hESC differentiation into laminated optic vesicle- and optic cup-like (three-dimensional retina-like) structures, which develop PRs, second-order neurons, and RGCs [17,19,20,22 –24,39]. The overarching goal of this work was to compare hESC-derived retinal tissue derived with our simplified noggin-based protocol and human fetal retina weeks 8–16 (previously used in two clinical trials [14 –16]) to evaluate the use of hESC-derived retina as a potential replacement for human fetal retina for treating the profound-to-complete blindness. We projected that better alignment of the dynamics in these tissues will improve translational work focused on generating a biological product from hESCs, capable of serving as a fetal tissue replacement for vision restoration therapies.
Here, we used our modified differentiation protocol for efficient production of retinal organoids from different hESCs lines. In this protocol, organoids were grown in the adherent condition until weeks 4–5 and then lifted from the plates and grown in the suspension. Our method is different from approaches used by other teams and is easily scalable for biomanufacturing, which is critical for transitioning this work to clinical applications. Other teams reported the formation of retinal organoids from the floating embryoid bodies after hESC aggregation and the addition of fetal calf serum, Knockout Serum Replacement (KSR), and/or inhibitors and agonists, such as IWR-1, CHIR99021, SAG etc 22–24].
We found high similarity of 10 week-old hESC-retinal tissue (organoids) and 8–13 week-old human retina based on the distribution of many markers of retinal lineages by IHC, comparable expression of retinal genes by transcriptome analysis (10 week-old hESC-retinal tissue vs. 10 week-old human fetal retina) (Supplementary Table S5), percentage of PR markers (12 week-old hESC-retinal tissue vs. 13-week-old human fetal retina), and even total methylation level (5mC, by mass spectrometry) and distribution of 5hmC marker (predominantly in the basal layer, where RGC and INL neurons are found in retinal organoids by this stage).
In addition, we show that ESI017, ESI049, and ESI053 lines [57] can also be used for retinal tissue derivation in a dish using the same noggin-based protocol and on maturation, can also develop mature rods and cones in a dish. This further validates our protocol for late preclinical [40] and then clinical work.
With regards to flow cytometry, the percentage of CD73[+] cells in young retinal organoids and human fetal retina is very similar (Fig. 6) (53.73% in retinal organoids, 12 weeks-old vs. 57.59% in human fetal retina, 13 weeks-old). The PRs are the most critical cell type for developing cell replacement strategies for RDs such as RP, AMD, and LCA. To quantify and compare percentage of progenitors and early PRs present in the hESC-derived retinal tissue and in human fetal retina, we used neural progenitor and PR cell surface markers used by others to characterize PR precursors in mammalian retina and retinal organoids [65 –67].
As retinal organoids matured to 24 weeks, they lost RGCs (as noted in other studies) [18,21]. By 24 weeks, the only well-preserved retinal layer in hESC-derived retinal tissue was the PR layer. Comparing 24 weeks retinal organoids with 20+ weeks human fetal retina was not possible because fetal retina of such an advanced stage cannot be obtained for analysis. Culturing retinal organoids to 24 weeks served a good proof of concept, that layers of mature PRs can form in maturing retinal organoids, and these PRs are capable of forming IS and OS and cilia as well as synapses. We demonstrate that retinal organoids from both H1-line and ESI lines develop mature PRs in long-term cultures.
Although we found growth of RPE and neural retina together in some but not all young (10 weeks) retinal organoids, we did not find RPE and neural retina growing together in mature organoids. This is contrary to what happens in the developing mammalian retina. The RPE gradually condenses on one side of retinal organoids [18,41] and eventually falls off with feeding of cultures week after week. The RPE may survive at the very distant side of retinal organoid, in the area of the ciliary margin [41]. Some RPE cells survive in the core of retinal organoids and are the likely source of TYR and other RPE-specific messages in RNA-seq results. The invagination of the optic cup brings RPE and NR together, and they are held together by weak interactions (OSs/apical RPE microvilli) and strong ocular pressure. Low intraocular pressure is associated with retinal detachment [81]. There are other important factors, including adhesion molecules, which enable neural retina/RPE adhesion, and microvilli/OS interactions [38] but the ocular pressure contributes a lot to holding the two layers together. Ocular pressure is not present in the in vitro culture systems.
For therapeutic applications, using younger retinal organoids (∼10 weeks old) may be more advantageous, specifically for enabling young semi-differentiated hESC-derived retinal tissue to better survive after grafting in the subretinal space and functionally integrate into the neural circuitry of the recipient retina [10,13]. Moreover, although co-culturing retinal organoids and RPE in a dish is productive for PR maturation, our organoids are transplanted into the subretinal space early in development (average age: 10 weeks), before the IS and OS start to form. The subretinal space of the recipient's eye (where the hESC-retinal tissue is transplanted) is expected to induce further differentiation of PR progenitors to mature PRs in such grafts because of the proximity of the host RPE [11].
With the help of biomaterials, this technology may progress to routine replacement of larger sections of degenerated retina with hESC-derived healthy and functional retinal tissue, thus increasing the angle of visual function and providing better quality of vision. Because of the high density and small size of PRs (which could be compared with pixels on neuroprosthetic chips [82,83]), hESC-derived retinal tissue (biological implant) may eventually be able to provide higher visual acuity, although this concept remains to be demonstrated in animal experiments.
Detailed comparison of hESC-derived retinal tissue with mammalian retina will help to refine the derivation methods and improve culturing conditions for designing the optimal hESC-retinal tissue implants as well as for designing retinal tissue in a dish for modeling retinal diseases. Collectively, this is a good start for developing retinal replacement strategies aimed at repairing complete vision loss in patients with PR degeneration.
Footnotes
Acknowledgments
The authors thank Dr. Robert Molday (Department of Ophthalmology, UBC, Vancouver, Canada) for critically reviewing data on hESC-derived PRs, especially TEM images, and providing helpful suggestions. They also thank Dr. Randolph Glickman (Department of Ophthalmology, University of Texas Health Sciences Center, San Antonio, TX) for critically reading and revising the article.
Author Disclosure Statement
No competing financial interest exists.
Funding Information
This work was supported by NIH grants 5R44EY027654-01, 5R44EY027654-02, and 3R44EY027654-02 S1 (I.O.N.).
Supplementary Material
Supplementary Figure S1
Supplementary Figure S2
Supplementary Figure S3
Supplementary Figure S4
Supplementary Figure S5
Supplementary Figure S6
Supplementary Figure S7
Supplementary Figure S8
Supplementary Figure S9
Supplementary Figure S10
Supplementary Figure S11
Supplementary Figure S12
Supplementary Figure S13
Supplementary Figure S14
Supplementary Table S1
Supplementary Table S2
Supplementary Table S3
Supplementary Table S4
Supplementary Table S5
References
Supplementary Material
Please find the following supplemental material available below.
For Open Access articles published under a Creative Commons License, all supplemental material carries the same license as the article it is associated with.
For non-Open Access articles published, all supplemental material carries a non-exclusive license, and permission requests for re-use of supplemental material or any part of supplemental material shall be sent directly to the copyright owner as specified in the copyright notice associated with the article.
