
Abstract
Human neural stem cells (hNSCs) have long been used as an in vitro model to study neurogenesis and as candidates for nervous system therapy. Many parameters have been considered when evaluating the success of transplantation, but sex of donor and recipients is often not discussed. We investigated two commercial NSC lines, the female hNSC-H9 and male hNSC-H14, and we observed faster growth rates in the male cells. At 4 days of differentiation, male cells presented a significant increase in expression of DCX, an immature neuronal marker, while female cells showed a significant increase in RMST, a long noncoding RNA, which is indispensable during neurogenesis. In addition, expression of neural markers MAP2, PSD95, SYP, DCX, and TUJ1 at day 14 of differentiation suggested a similar differentiation potential in both lines. The most significant differences at day 14 of differentiation were the expression levels of RELN, with almost 100-fold difference between the sexes, and MASH1, with more than 1,000-fold increase in male cells. To evaluate whether some of the observed differences may be sex related, we measured the expression of gametologous genes located on the X- and Y-chromosome. Most noticeable was the increase of Y-encoded demethylases KDM6C (UTY) and KDM5D during differentiation of male cells. Our results indicate that attention should be paid to sex when planning neurogenesis and transplantation experiments.
Introduction
It has been about 20 years since it was proposed that human neural stem cells (hNSCs) can be used for transplantation with the goal to repair the nervous system [1]. Human NSCs are self-renewing multipotent cells with the potential to generate the basic cells of the nervous system. Multiple neural cell transplantations have been attempted during the years with variable success rates indicating that many factors may affect the outcome of the procedures. Current clinical trials of cell therapies often fail in the long run. For example, cells do not integrate correctly and die, or do not grow or differentiate properly. There are many hypotheses to explain this, but the exact reasons are still unknown [2]. Many parameters have been considered, including the origin of the cells, their proliferation and differentiation capacity, the route of administration, the intended location, in vitro culture, and other manipulation steps, as well as the long-term survival of engrafted cells. However, one factor that is usually not mentioned is the sex of the donors and recipients, and whether or not donors and recipients have been matched in terms of sex. This is true even though the genes expressed on the sex chromosomes can have a marked impact on the biology of diverse tissues and cells, including neurons, and reporting the sex of the cells is recommended for publication [3].
It has been demonstrated that the sex of NSCs is a defining factor of the transplantation outcome in the striatum of rats [4]. Other types of stem cells have also been shown to have sexual dimorphisms. For example, mesenchymal stem cells from female Rhesus monkeys showed a greater neurogenic capacity than equivalent cells from male monkeys [5]. A retrospective study looking at more than 50,000 human patients who had received allogenic hematopoietic stem cell transplants showed that male patients that received transplants from donors of the opposite sex had a worse outcome [6]. It is therefore possible that the sex of the donor and recipient may be an important factor for the optimization of the grafting process and improvement of the clinical prognosis of NSC transplantation in humans.
We have previously shown that genes encoded on the X- and Y-chromosome are expressed in the human central nervous system (CNS) before birth [7] even before the production of sex hormones [8]. We also found that the X- and Y-encoded genes are expressed in specific and heterogeneous cellular subpopulations of both glial and neuronal origin [9]. We therefore speculated that sexually dimorphic expression may also occur in NSCs with possible influence in functionality. We decided to investigate possible sexual dimorphisms in growth, differentiation, and expression of genes encoded on the sex chromosomes of NSCs, using two commercially available lines, hNSC-H9 and hNSC-H14. The H9 cells are derived from female stem cells and, therefore, possess two X-chromosomes, while the H14 cells are derived from male stem cells and carry one X- and one Y-chromosome. The hNSCs were derived from human embryonal stem cells (hESCs) grown in chemically defined culture systems [10]. These hESCs were first obtained by Thomson and colleagues, who produced five lines, which were originally named WA01, WA07, WA09, WA13, and WA14 [11]. WA09 is the origin for hNSC-H9, while hNSC-14 was obtained from WA14.
We here show that hNSC-H9 and hNSC-H14 differ in growth rate and expression of neuronal markers during differentiation in the same conditions. We also show that they present sexual dimorphisms in the expression of X- and Y-encoded gametologous genes.
Methods
Cell culture and morphology
Female human neural stem cells hNSC-H9, derived from the NIH-approved hESC-H9 (WA09), were obtained from Gibco (N7800100). Male human neural stem cells hNSC-H14, derived from the NIH-approved hESC-H14 (WA14), were obtained from WiCell (NSC-H14 WB0195). Provider for both cell lines is Xianim Zeng, Buck Institute (Novato CA). As part of the cell transfer process, a Memorandum of Understanding regarding the use of the material was signed by the provider's and the researcher's institution.
For proliferation, both cell types were cultured in a monolayer on Geltrex (A1413202) in T-75 flasks (Sarstedt 831813500) under normoxic conditions at 37°C and 5% CO2. The cells were supplied with Neurobasal Complete medium: Neurobasal (Gibco 21103049) supplemented with 10 ng/mL FGF-2 (Stemgent 03-0002), 1X B27 supplement (Gibco 17504044), 2 mM MEM NEAA (Gibco 11140035), and 2 mM GlutaMAX (Gibco 35050061).
During the course of the experiments, hNSC-H9 were cultured to a passage of 18 (from P6), while hNSC-H14 were cultured to a passage of 31 (from P21). To detect karyotypic abnormalities commonly appearing in human stem cells, we have used the qPCR based hPSC Genetic Analysis Kit developed by STEMCELL (#07550). The kit was used on DNA from the hNSC-H9 and hNSC-H14 cell lines according to the manufacturer's instructions. Evaluation of the results was performed in the online analysis tool (
Growth curves
Cells were cultivated on Geltrex in six-well tissue culture plates (Sarstedt 833920) at different seeding densities (5,000, 7,000, 10,000, 15,000, 20,000, 30,000, and 40,000 cells/cm2) in four replicates. A first picture (D0) was taken 2 h after seeding. After this, pictures were taken every 24 h until the plate reached 100% confluency (Supplementary Fig. S3). Before each picture was taken, half of the old culture medium was replenished by fresh medium. Pictures were taken at 10 × magnification with a Leica DM IL with a ProgRes SpeedXT core 3 camera. The microscope pictures were analyzed using the open-source biological image analysis software Fiji-ImageJ [12,13] using thresholds and particle selection. The number of cells calculated at each time point was used to produce growth curves.
Cell differentiation
Neural differentiation of the NSCs was initiated by restriction of FGF-2 in the cell medium and change of culture matrix to Poly-L-Ornithine and Laminin. Six-well tissue culture plates were precoated with 20 μg/mL Poly-L-Ornithine (Sigma-Aldrich P3655) in cell culture grade H2O and incubated overnight at 8°C, followed by an incubation of 1 h at room temperature. The coating solution was discarded, and the wells were rinsed twice with 1 mL PBS. Then, mouse Laminin (Thermo Scientific 23017015) at a concentration of 10 μg/mL in PBS was added to the wells and incubated as stated before. Before culturing, the Laminin solution was discarded, and cells were seeded at 40,000 cells/cm2 in a total volume of 2 mL Neurobasal Complete medium. After 2 days, the medium was changed to differentiation medium composed of Neurobasal, including 1 × B27 supplement, 2 mM MEM NEAA, and 2 mM GlutaMAX. Spent medium was exchanged every 3 days. The neural differentiation was continued for a total of 14 days. The differentiation experiment was performed thrice generating three individual biological replicates.
Immunocytochemistry and cell imaging
For immunocytochemistry (ICC) the cells were cultured as described above but on four-well Millicell EZ glass slides (Millipore PEZGS0416). After the desired differentiation period, the cells were rinsed with Dulbecco's phosphate buffered saline (DPBS), including Ca2+ and Mg2+, and fixed with fresh, ice-cold 4% paraformaldehyde (PFA) in DPBS for 10 min at room temperature. The fixed cells were rinsed thrice with RNase/DNase Free H2O and stored in the same medium at 8°C until staining. The cells were permeabilized with DPBS solution, including 0.1% Triton X-100 (T9284 Sigma Aldrich), 4% normal donkey serum (Millipore S30), and 0.2 M glycine (50046 Sigma Aldrich) for a total of 15 min. They were then incubated with primary antibodies overnight at room temperature in DPBS with 4% donkey serum, followed by rinsing thrice with DPBS. The secondary antibody was added in a DPBS solution with 4% donkey serum, and cells were incubated for 90 min protected from light. The secondary antibody solution was removed, and cells were stained with DAPI (D9564 Sigma Aldrich) diluted 1:1500 for 10 min, followed by three rinses with DPBS. The stained cells were then sealed with a Mowiol based mounting medium and a coverslip.
Imaging was performed with a Leica TCS SP5 II confocal microscopy system. The following primary antibodies were used: Doublecortin (Invitrogen 48-1200) at 1.6 μg/mL, TuJ1 (from Neuromics MO15013) at 0.5 μg/mL, and NeuN (ABCAM AB104224) at 1 μg/mL, secondary antibodies: Donkey anti-Rabbit Alexa 647 (ABCAM ab150075) and Donkey anti-Mouse Cy3 (Jackson ImmunoResearch 715-165-150) at dilutions of 1:800.
For the immunohistological quantification of NeuN positive cells, each NSC line was differentiated for 14 days on a cell culture glass slide with four wells. A picture at 40 × magnification was taken at a random location in each well. All cells in a picture were counted and inspected regarding NeuN expression using ImageJ. The number of cells from each picture was summed up for each cell line and served as an indication for NeuN positive cells. The nuclear antigen NeuN was detected using Cy3 fluorophore emission. When a cell showed overlapping nuclear emission of DAPI and Cy3 signal, the cell was considered as NeuN positive.
RNA extraction, DNase treatment, cDNA synthesis, and RT-qPCR
Before RNA extraction, cells were rinsed with DPBS. RNA was extracted using the PureLink RNA Mini Kit (Invitrogen 12183018A) according to manufacturer's instructions. A DNase treatment was performed using DNA-free DNA Removal Kit (Invitrogen AM1906). The RNA amount and quality were measured using a NanoDrop spectrophotometer, while RNA integrity was determined using gel electrophoresis and 28S/18S ribosomal RNA ratios.
The cDNA was synthesized using Maxima H Minus Reverse Transcriptase (Thermo Scientific EP0752) together with Anchored Oligo(dT)20 Primers (Invitrogen 12577011). For the quantification of Y-lncs random hexamer primers (Thermo Scientific SO142) were used during the reverse transcription.
The qPCR analysis was performed on an Applied Biosystems 7500 Real-Time PCR System using PowerUp SYBR Master Mix (Applied Biosystem A25742). For every qPCR 1 ng of cDNA was used with 7.5 μL of SYBR master mix and 1 μL of 10 mM forward and reverse primers. Molecular grade H2O was added to form a total volume of 15 μL. Measurements of the three biological replicates were taken in triplicates. The thermal cycling profile was selected according to master mix recommendations, and all qPCR runs were performed at an annealing temperature of 62°C (Supplementary Table S1). Amplification cycles were repeated 40 times followed by a melting stage, which served as a diagnostic tool to assess amplicon length. To evaluate the performance of the qPCR assay and primers, the primer efficiency, slope, and R 2 were calculated based on calibration curves from control cDNA in a series of 10-fold dilutions (Supplementary Table S1). The primers used for the gene expression analysis of different markers are shown in Supplementary Table S2, and the primers used for the gametologous gene analysis are shown in Supplementary Table S3.
Housekeeping gene analysis and optimal number of reference genes
For a precise gene expression analysis using quantitative real-time PCR, the use of adequate housekeeping genes (HKGs) is essential to correct for differences among samples [14,15]. We performed an HKG analysis on the hNSC-H9 and hNSC-H14 cells with the goal to find HKGs that are stably expressed in both of the two cell lines, independent of their growth and differentiation stage. The analysis was performed on three biological replicates per cell line and three technical replicates. The qPCR assay and the primer efficiency (E) were validated through calibration curves using 10-fold serial dilutions of standard samples. Linear regression for the 10-fold dilution series showed that the squared correlation coefficients (R 2) of all tested primers were greater than 99% (Supplementary Table S1).
In total, we evaluated the expression of 14 candidate reference genes (ACTB, B2M, CAPN10, CYC1, GAPDH, HPRT1, MYC, PPIA, RPL13, RPLP0, TBP, TUBB3, UBC, YWHAZ) across three time points (NSC stage, 4 days of differentiation, and 14 days of differentiation). Supplementary Figure S4 displays the raw quantification cycle (Cq) values for each gene within each stage of differentiation. We have used the tool RefFinder [16] to analyze the qPCR results regarding gene expression stability. The software utilizes the four major computational tools for HKG analysis: geNorm [17], NormFinder [18], BestKeeper [14], and the comparative delta-CT-method [15], and combines their results in a comprehensive gene stability index. The HKG ranks produced by the different analysis tools are summarized in Supplementary Table S4.
The optimal number of reference genes required for an effective normalization was calculated by geNorm. geNorm uses the pairwise variation (Vn/Vn+1) between normalization factors NFn and NFn+1 to determine the optimal number of genes. Vandesompele et al. [17] suggest that a pairwise variation bigger than 0.15 recommends the inclusion of an additional HKG. The pairwise variation was calculated for each time point and the average of all time points (Supplementary Fig. S6).
Results
Growth curves reveal faster growth for hNSC-14
While culturing the two hNSC lines under identical conditions, we noticed a prominent difference in growth rate. To quantify this difference, we determined the growth rate for different seeding densities (between 5,000 and 30,000 cells/cm2) until 100% confluency was reached in a six-well culture dish (Fig. 1A, B). Taking the growth rate of all seeding densities together, the female H9 cells require an average of 8.7 days to reach full confluency, while male H14 cells require an average of 5.3 days. At the highest seeding density of about 30,000 cells/cm2, hNSC-H9 cells required 5 days to reach confluency, while the hNSC-H14 cells reached confluency at day 3. The differences in growth rate become more prominent when the seeding density is reduced. At lowest seeding density of about 5,000 cells/cm2 the hNSC-H9 require 12 days to reach confluency, while the H14-NSCs require only 7 days.
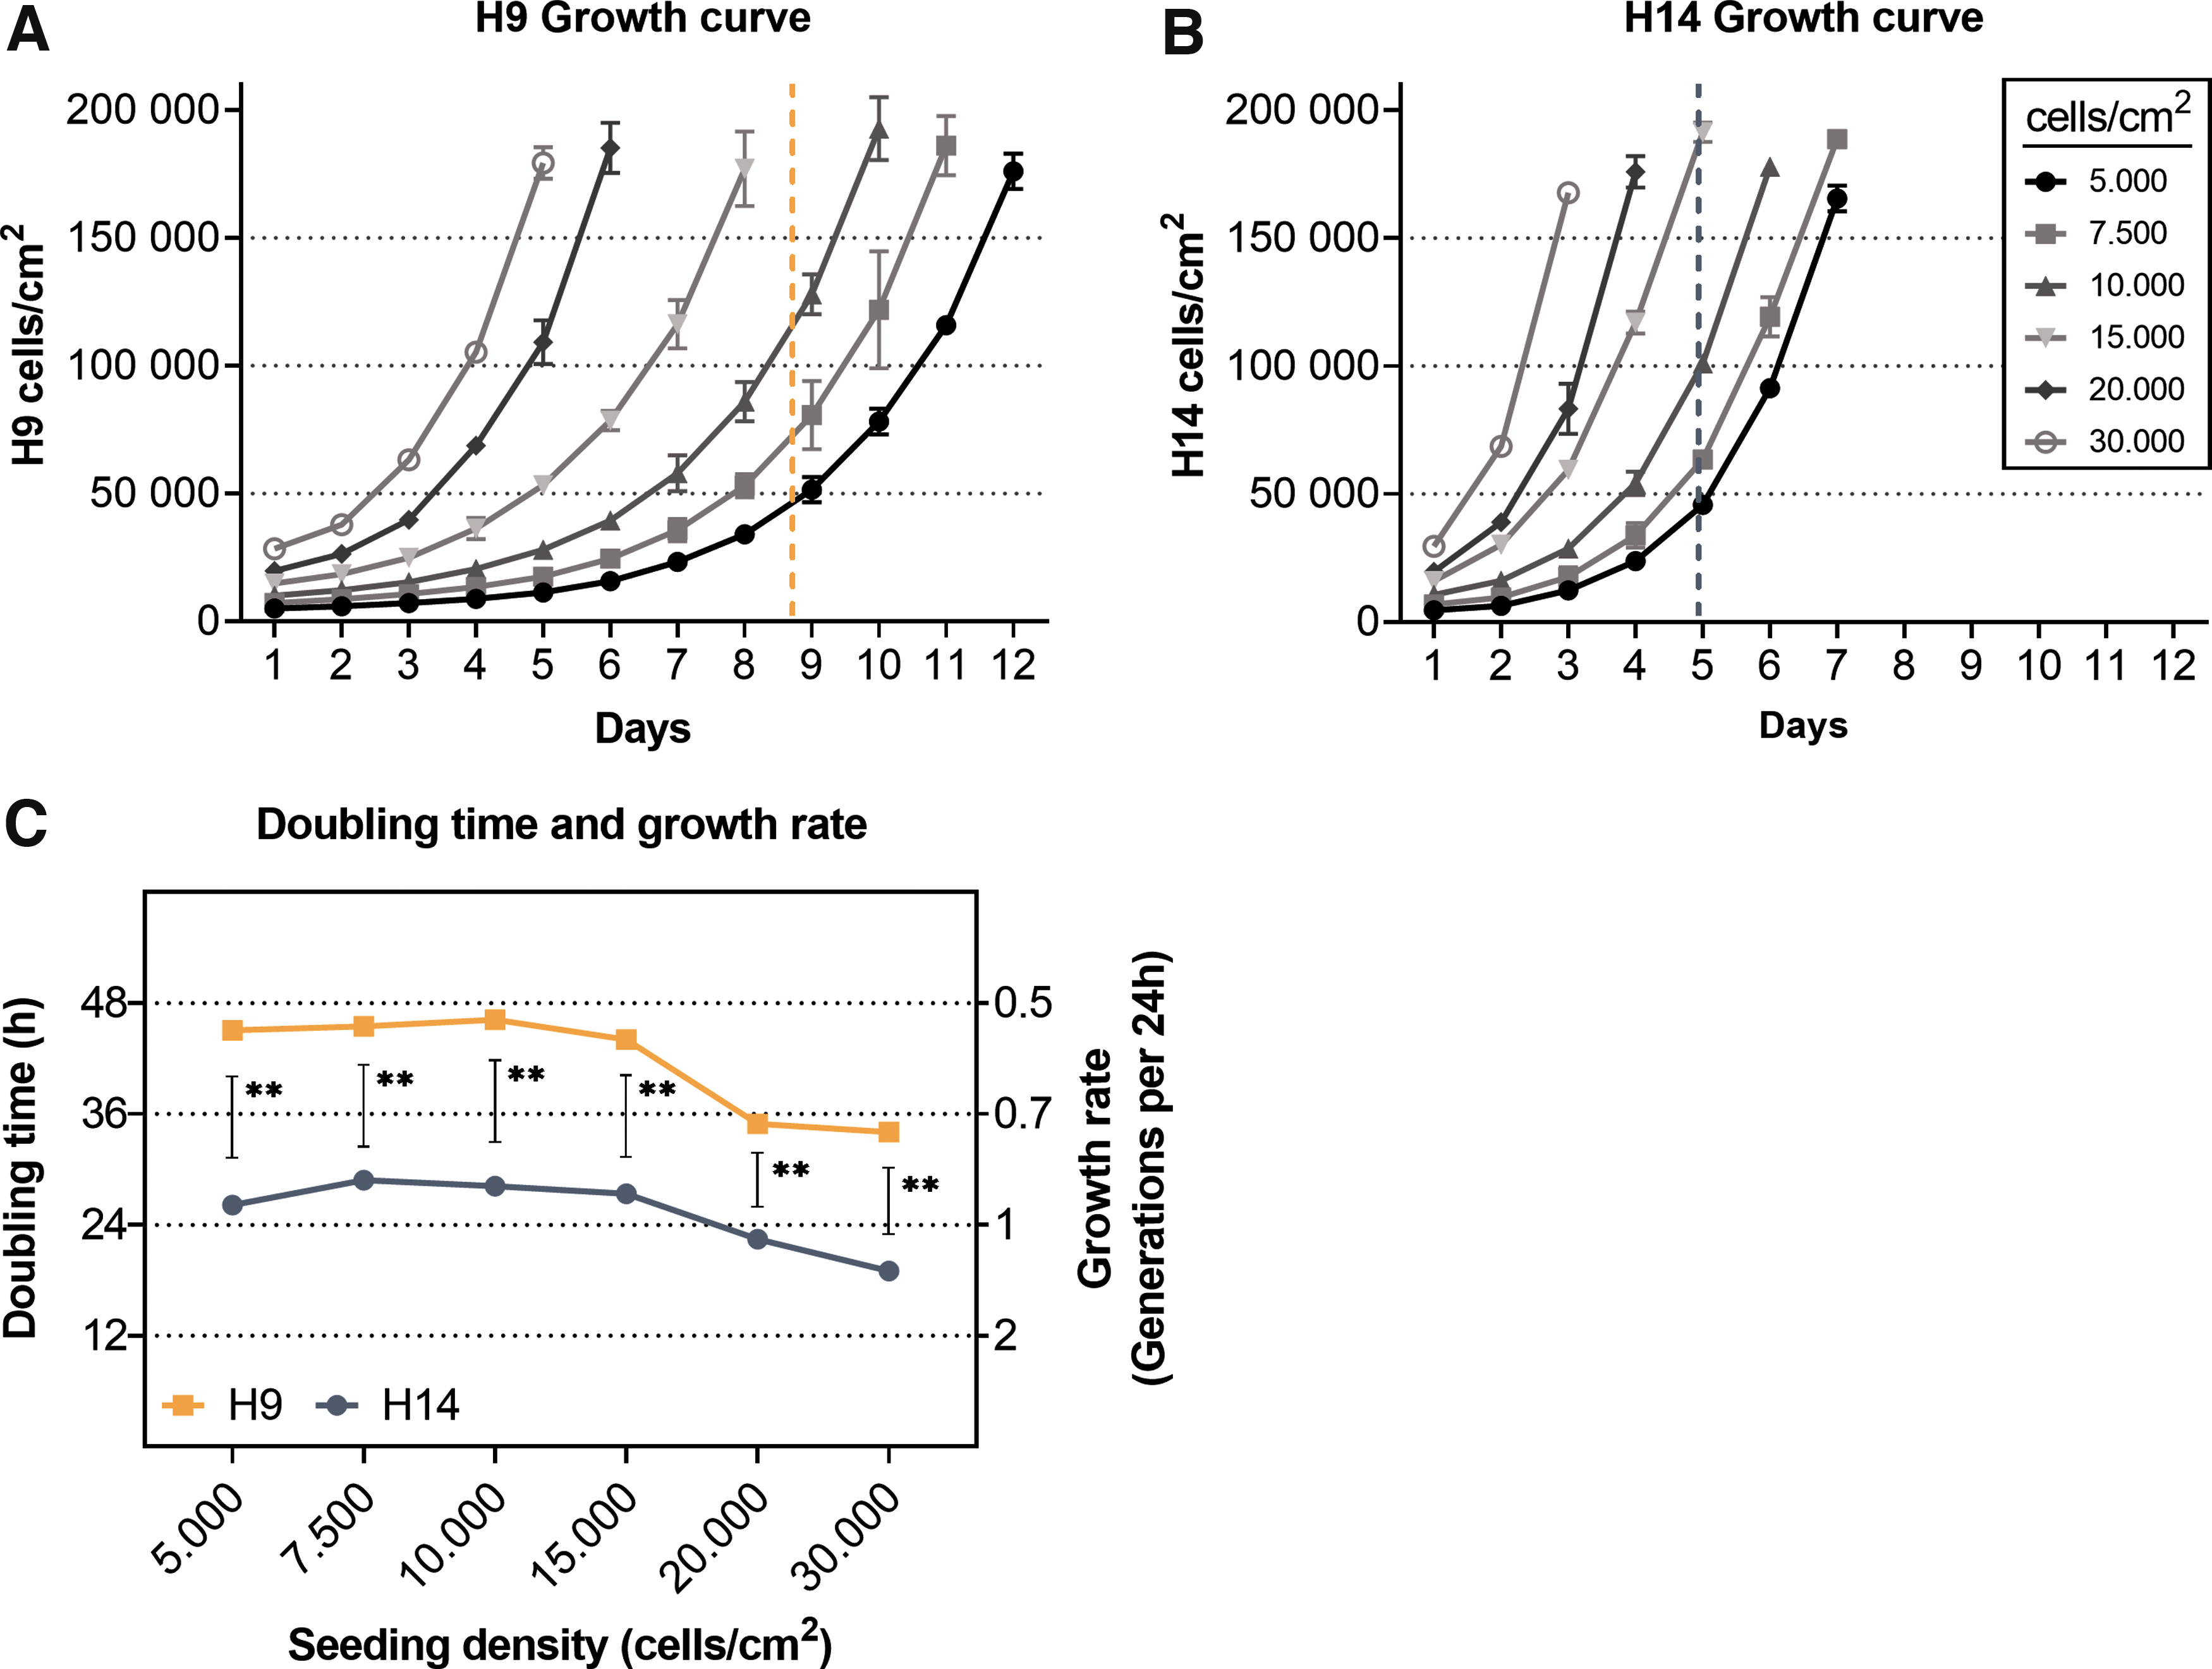
Growth curves for hNSC lines H9
A noticeable increase in growth rate was observed in both cell lines at seeding densities larger than 15,000 cells/cm2. The growth rate of hNSC-H9 cells rose by 26% from 0.34 to 0.44 generations/24 h, and the rate of H14 cells rose comparably by 22% from 1.07 to 1.26 generations/24 h (Fig. 1C). The differences in growth rates between the cell lines were significant for all seeding densities (P < 0.01, Fig. 1C) and persisted for different passage states (not shown). Other investigators have also shown that NSCs appear to retain their self-renewal and neuronal differentiative potential during long-term expansion [19].
While all these results combined clearly identify density as a strong factor contributing to cell growth, differences in growth rate between the female and male cell lines remain constant, even at the highest seeding densities.
Morphology suggests similar neural differentiation trajectories for hNSC-H9 and H14
In culture, the two NSC lines appear similar in morphology. The cells grow epithelial like, have a polygonal shape, a speckled nucleus, and stretch out at low density to form adhesions with other cells. At low density the cells of both lines were indistinguishable. However, when reaching confluency, hNSC-H14 cells spread evenly across the surface of the culture dish, while the hNSC-H9 cells never fully covered the entire surface, leaving parts of the culture dish cell free, even when they were overgrown (Supplementary Fig. S3). When we differentiated hNSC-H9 and hNSC-H14 cells under identical conditions, we observed that both NSC lines developed similarly. Bipolar, pyramidal-shaped, and multipolar cells with relatively long and branched neurites have developed by day 7 in both cell lines. An increase in neurite formation, branching, and fasciculation together with ongoing cell migration and clustering was observed until day 14 of differentiation (Fig. 2). Although the general differentiation was very similar in both cell lines, we recognized a difference in the time course. Already at day 4 we noticed in both cell lines the appearance of bipolar and pyramidal-like shaped cells together with many cells, which appeared to be multipolar or in transition (Fig. 2). Compared to H14 with only few neuron-like cells, a vast majority of cells had changed morphology to a neuron-like shape in the H9 culture. Those cells developed a network of long branched neurites, while the H14 cells did not form processes—with the exception of a few neuron-like cells, suggesting that the differentiation might be more advanced at day 4 in H9 cells. However, the qPCR analysis of neuronal markers did not corroborate this hypothesis (see section Gene expression analysis of marker genes).

Brightfield microscopy pictures of hNSC-H9 and H14 during the course of differentiation. Green squares mark the section of the figure that is amplified below. Sky blue arrows point to bipolar cells, magenta arrows point to pyramidal-shaped cells, and yellow arrows point to multipolar cells.
Selection of optimal reference genes for qPCR expression analysis
The expression of 14 HKGs (ACTB, B2M, CAPN10, CYC1, GAPDH, HPRT1, MYC, PPIA, RPL13, RPLP0, TBP, TUBB3, UBC, YWHAZ) was evaluated in hNSC-H9 and hNSC-H14 for three time points (NSC stage, 4 days of differentiation, and 14 days of differentiation), as described in the methods. The raw quantification cycle (Cq) values, displayed in Supplementary Fig. S4, indicated a noticeable decrease in gene expression stability during differentiation, especially in the NSC-H9 cells. We used the tool RefFinder to calculate the comprehensive gene expression stability values, which are a combination of all four stability algorithms used by the software, for each cell line and stacked them in Supplementary Fig. S5. An equal gene expression stability between the cell lines should ideally be represented by an equal contribution of the samples to the total. However, we noticed that during neuronal differentiation, genes like B2M, GAPDH, and CYC1 at 4 days of differentiation (Supplementary Fig. S5B) and ACTB, GAPDH, and RPLP0 at 14 days of differentiation (Supplementary Fig. S5C) showed differences in gene expression stability between the tested cell lines, indicating that they are less suitable as HKGs in our case.
To find adequate HKGs that could be used to normalize both NSC lines simultaneously, we first estimated the number of reference genes needed for an optimal normalization. This estimation was done with the help of the pairwise variation value “V” calculated by GeNorm. In all cases the pairwise variation was below 0.15 (Supplementary Fig. S6), a cutoff proposed by Vandesompele et al. [17]. Thus, the optimal number of reference genes required for normalization was two. Then, we used the mean gene expression values for both lines at each differentiation stage and analyzed them using the different methods included in the RefFinder [18] tool (Fig. 3). On the basis of the comprehensive gene expression stability, labeled as “Comprehensive Rank” in Fig. 3, we selected HPRT1 and PPIA from the 14 candidate HKGs. The two selected genes ranked among the top five most stable HKGs in each time point (Fig. 3A–C) and were the two most stable genes when all time points were combined (Fig. 3D). In addition, HPRT1 and PPIA showed an equal expression stability between both cell lines (Supplementary Fig. S5).
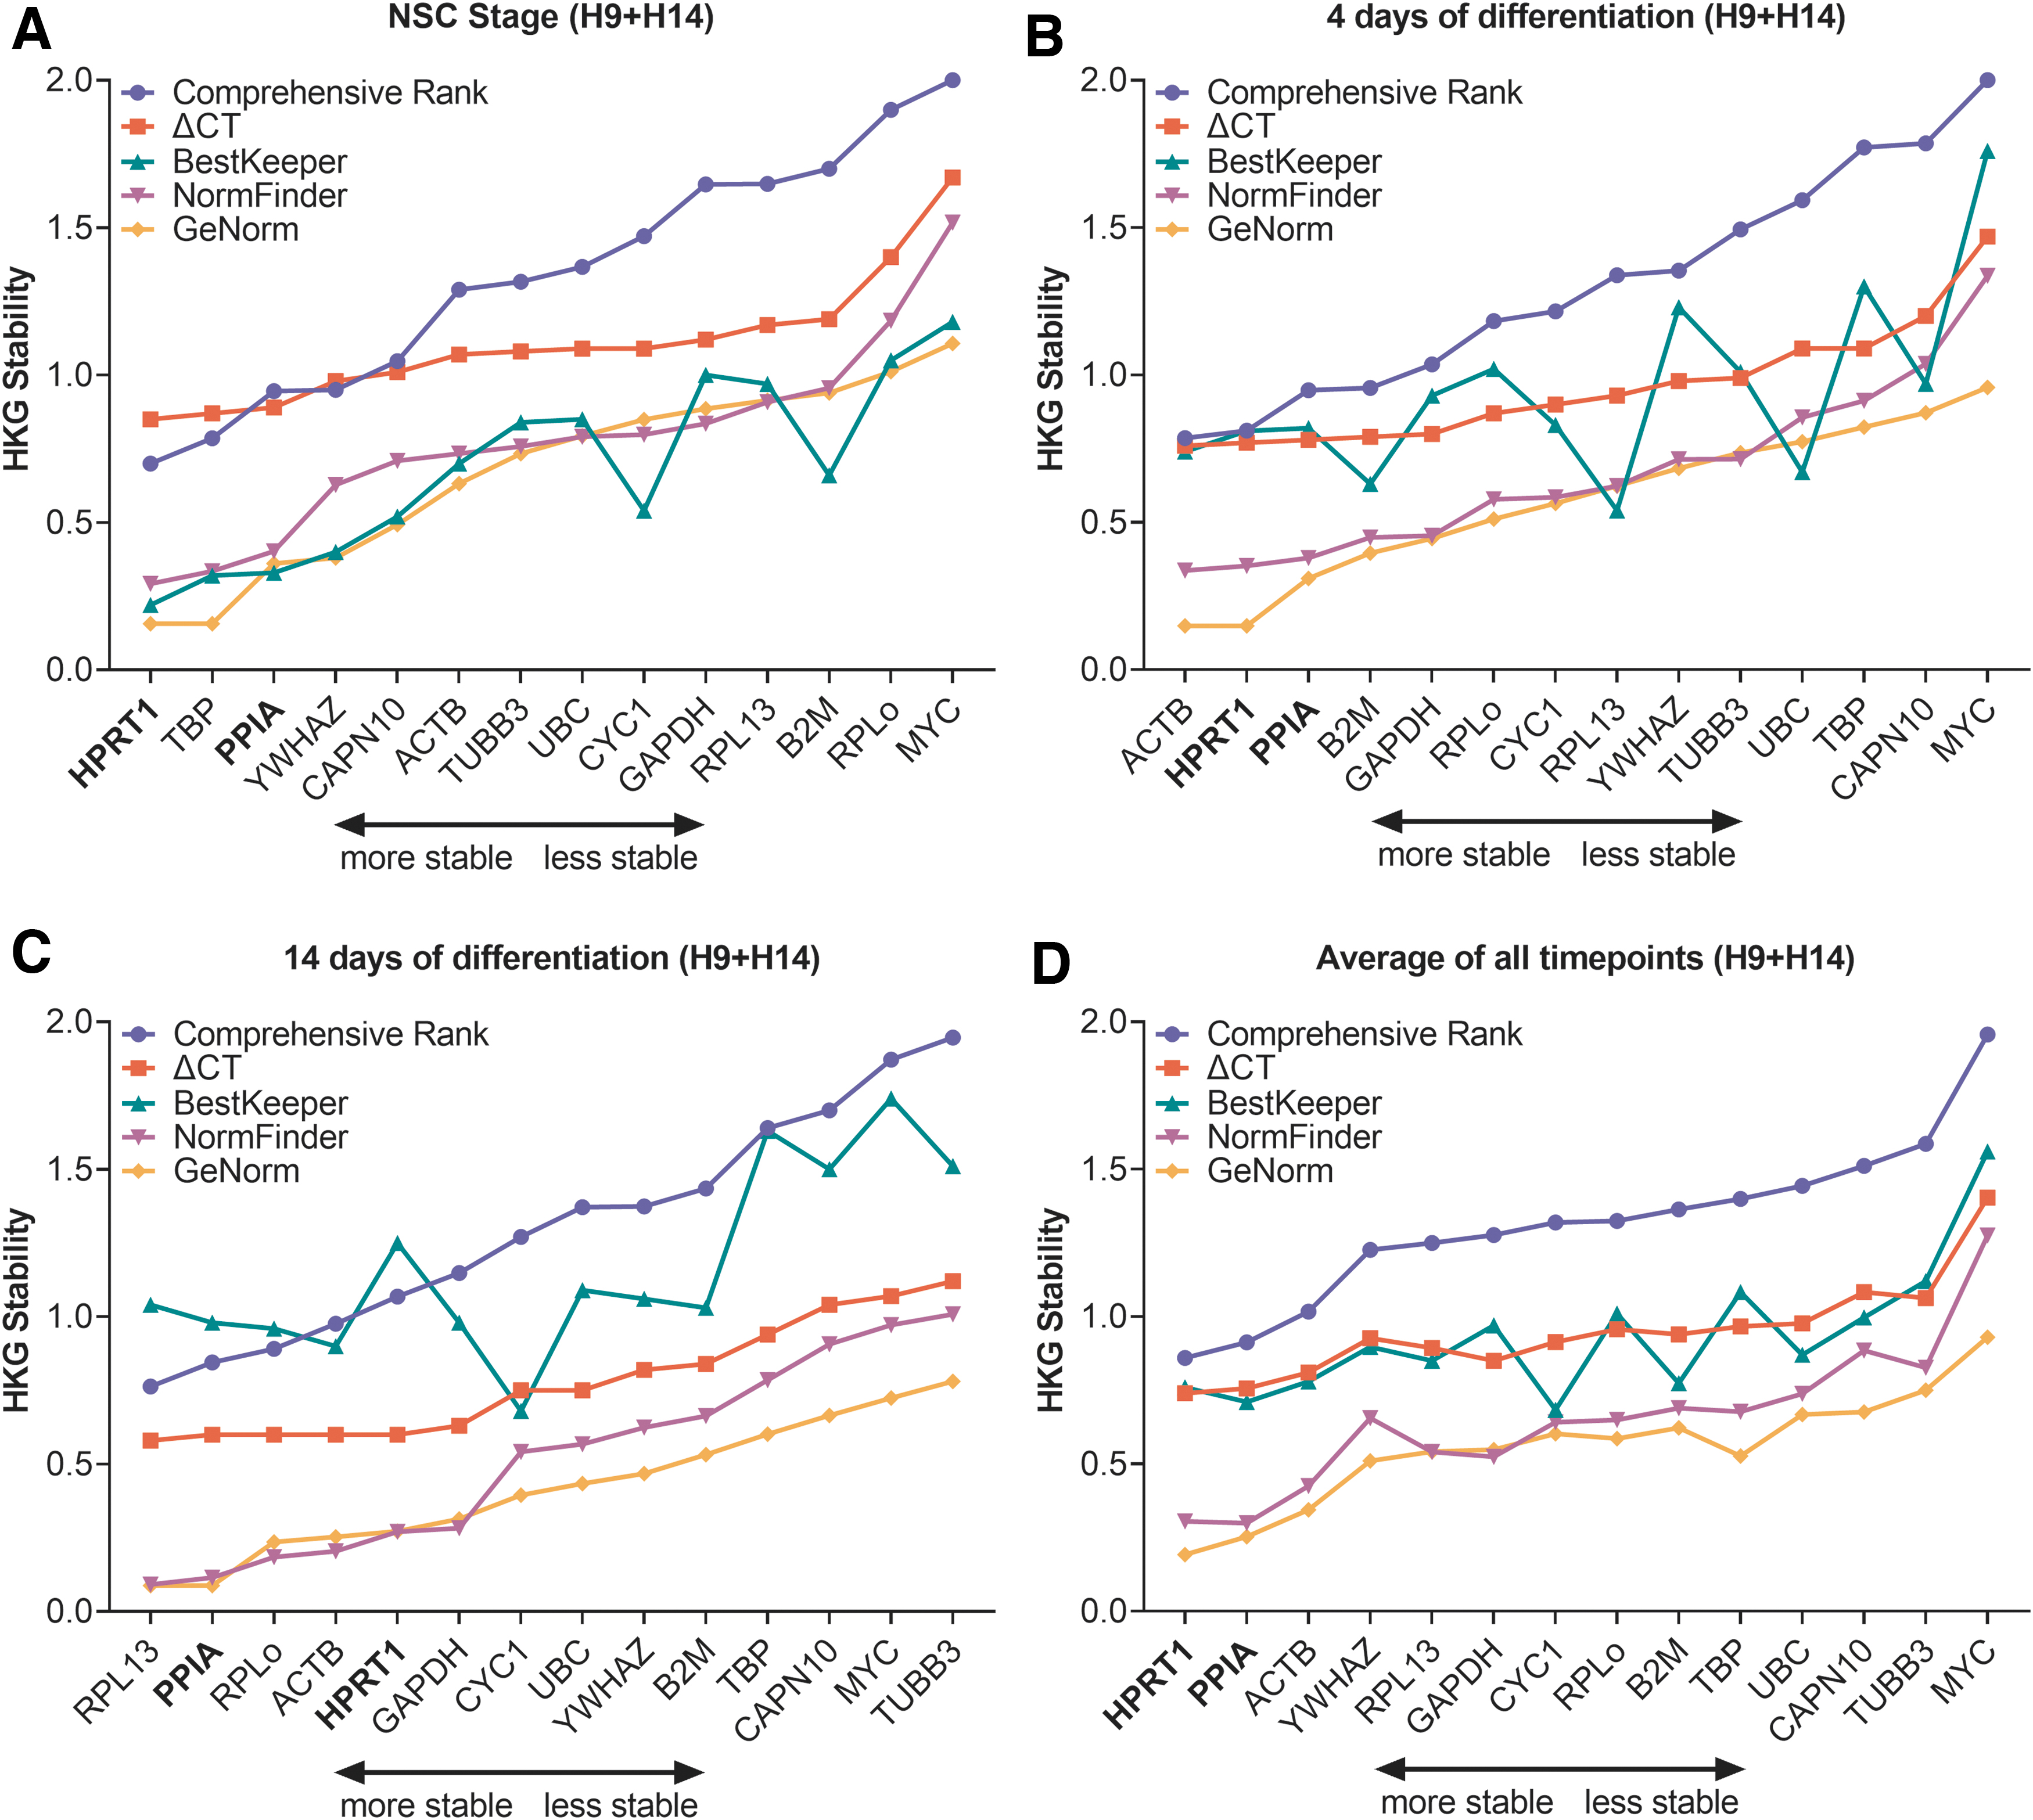
Complete housekeeping analysis plots displaying the average gene expression stability of hNSC-H9 and hNSC-H14 for each differentiation stage
Gene expression analysis of marker genes
To evaluate whether hNSC-H9 and hNSC-H14 cells follow similar trajectories during differentiation, we measured the expression of several marker genes by qPCR and used HPRT1 and PPIA as HKGs for normalization. Figure 4 shows that both types of cells were able to similarly differentiate into neurons, as indicated by increases in the expression of neuronal markers such as microtubule-associated protein 2 (MAP2), postsynaptic density protein 95 (DLG4 or PSD95), synaptophysin (SYP), doublecortin (DCX), and neuron-specific class III β-tubulin (TUJ1). Immunofluorescence confirmed the results of TUJ1 and DCX. After 14 days of differentiation, both hNSC-H9 and hNSC-H14 presented typical fibrillary staining surrounding most of the nuclei, characteristic for the enrichment of newly formed neurons (Fig. 5). Furthermore, the absence of NeuN at NSC stage and the presence of staining at day 14 of neural differentiation demonstrated that about 96% of female cells (2,182 of 2,276) and 97% of male cells (2,541 of 2,627) were able to differentiate into neurons (Fig. 5B).
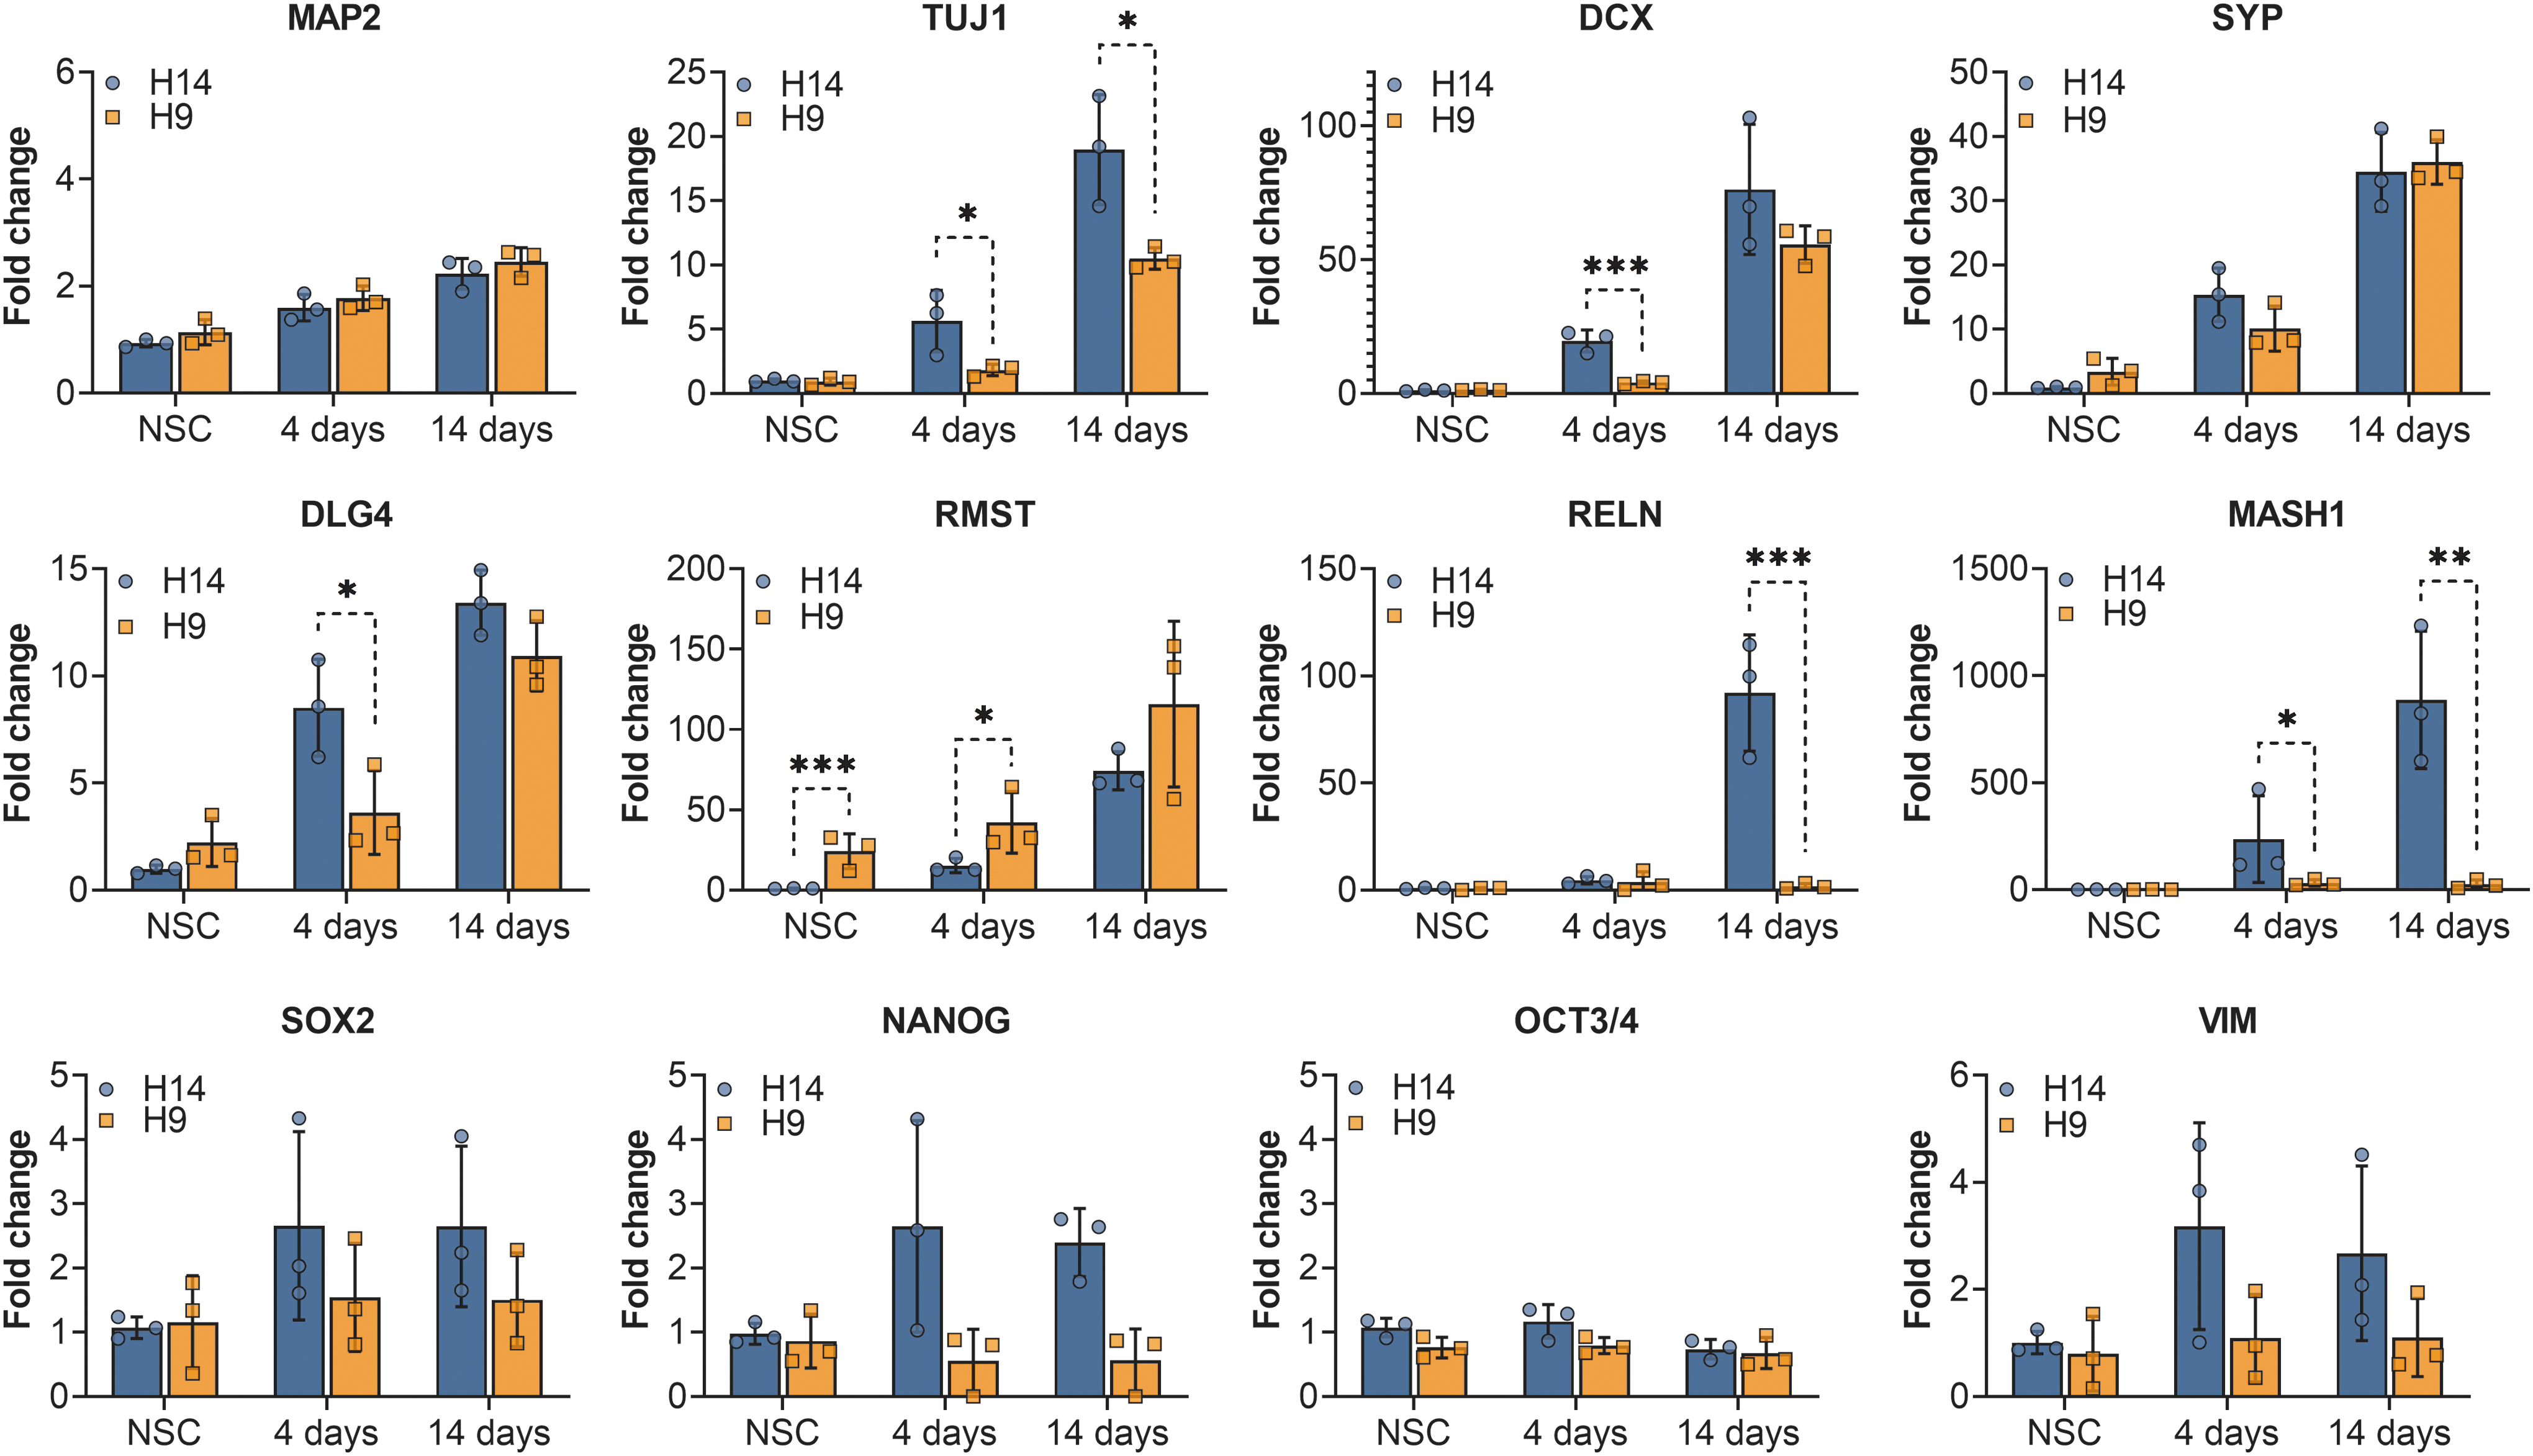
Gene expression analysis of marker genes. Bars represent the average fold change in expression levels for three biological replicates; error bars depict the standard deviations. The dots on each bar represent the average of three technical replicates for each biological replicate. The relative expression for each gene is based on the expression of hNSC-H14 at NSC stage. Significance is calculated using Student's t-test on ddCT values of biological replicates * ≤ 0.05, ** ≤0.01, *** ≤0.001.
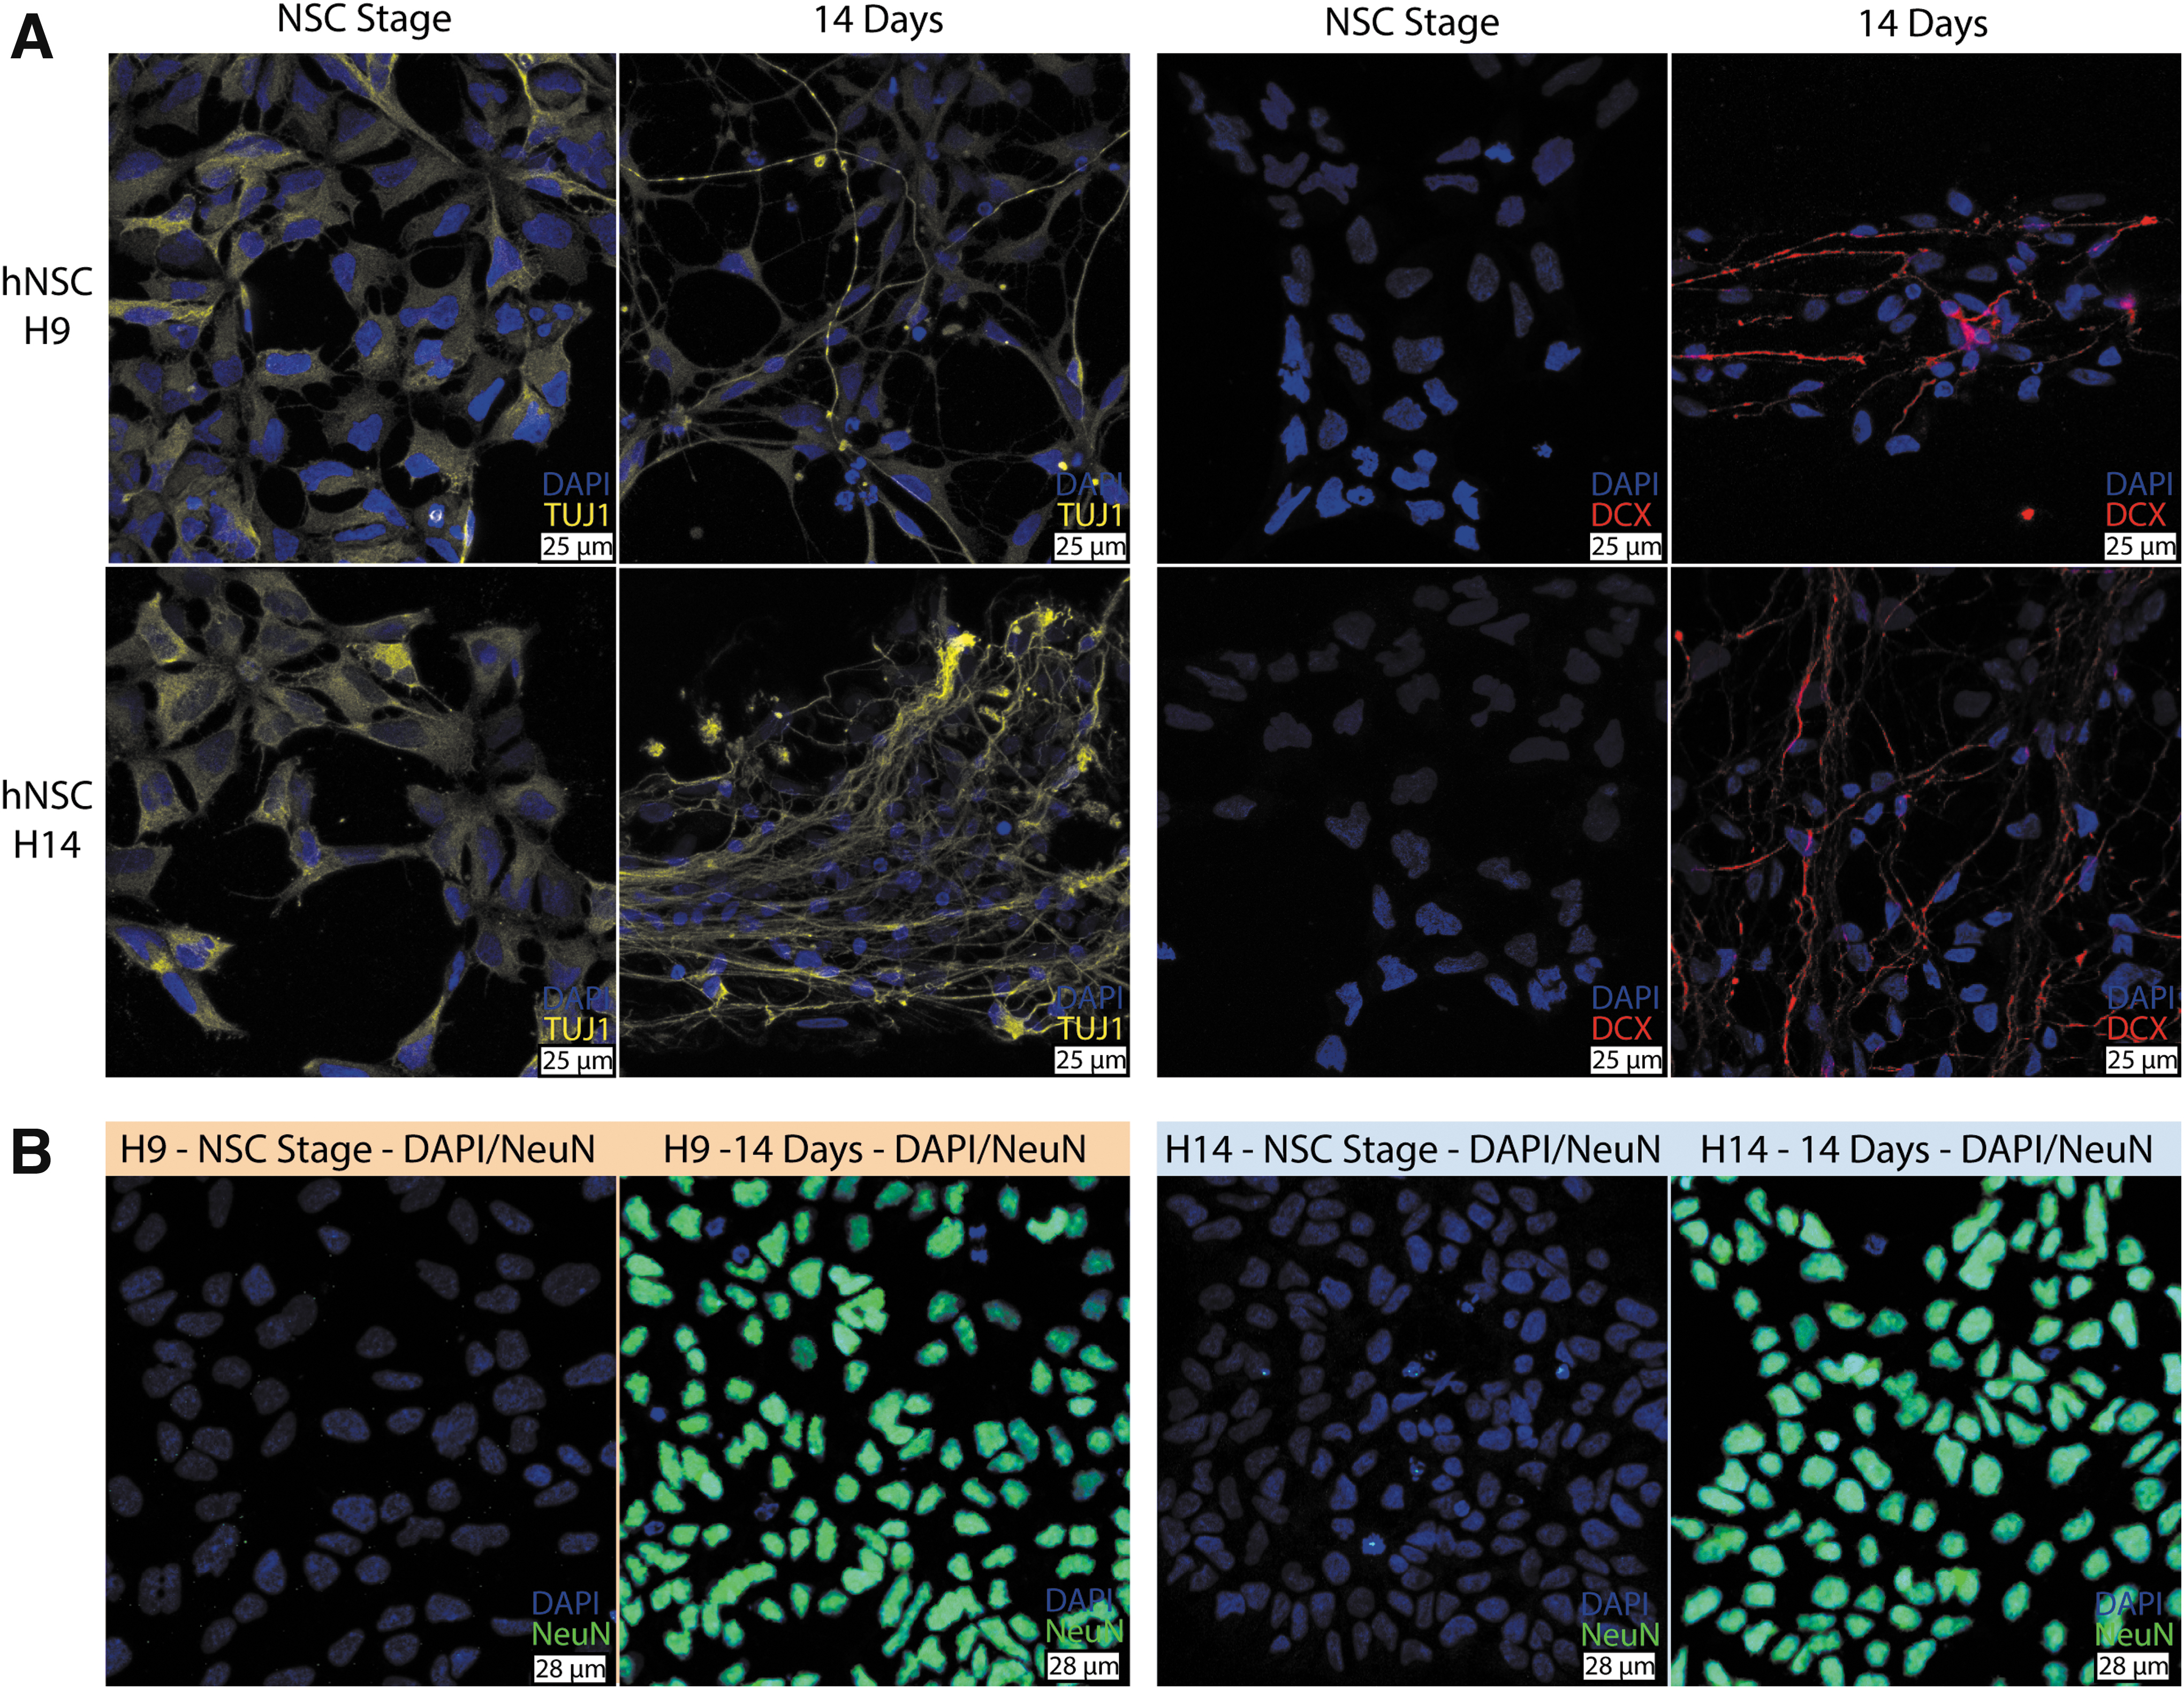
Immunofluorescence staining on female hNSC-H9 and male hNSC-H14 cells before (NSC stage) and after neural differentiation (14 days of differentiation). Immunofluorescence for TUJ1 (yellow), DCX (red), and NeuN (green) is shown together with nuclei stained with DAPI (blue).
However, not all markers showed an increase in expression levels for both cell lines to the same extent. For example, at day 4, male cells presented a 21-fold increase in expression of DCX (P < 0.001), a microtubule-associated protein expressed by neuronal precursor cells and immature neurons [20]. In contrast to our qPCR results, immunostainings for DCX at day 4 (data not shown) did not show staining in any of the cell lines. The reason can be that immunofluorescence is not sensitive enough to detect the low protein levels present at these early time points in differentiation, while qPCR is a high-sensitivity method to reliably detect very low levels of mRNA. At day 7 of differentiation DCX immunostaining was present to the same extent in both cell lines (data not shown). In addition to DCX, DLG4 and TUJ1 also presented significant higher expression in male cells at day 4 (P < 0.05). The differences in TUJ1 remained at day 14 (P < 0.05), while DLG4 was not significantly different between the female and male cells at this time point. In addition, female cells presented a 32-fold increase in RMST, a long noncoding RNA, which is indispensable during neurogenesis [21]. This difference was already present before differentiation (P < 0.001) and also at day 4 (P < 0.05), but disappeared at day 14.
The most striking expression differences between hNSC-H9 and hNSC-H14 cells after differentiation were found for reelin (RELN) with almost 100-fold higher levels in male cells (P < 0.001), and mammalian achaete scute homolog-1 (MASH1 also called ASCL1), with more than 1,000-fold higher expression in male cells (P < 0.05 at day 4 and P < 0.005 at day 14). The lower panel of Fig. 4 shows the results of three pluripotency markers (SOX2, NANOG, and OCT3/4), as well as the intermediate filament marker for mesenchymal-derived cells Vimentin (VIM), which did not present significant differences between the cells. We also measured the expression of Paired box 6 (PAX6), Nestin (NES), RE1 Silencing Transcription Factor (REST), Proliferation marker protein Ki-67 (MK167), Phorbol-12-Myristate-13-Acetate-Induced Protein 1 (PMAIP1 or NOXA), Solute Carrier Family 2 Member 1 (SLC2A1), Glucose transporter 1 (GLUT-1), and Neurofilament Heavy Polypeptide (NEFH) and did not observe any significant differences in expression levels between the cell lines (not shown). Expression for glial fibrillary acidic protein (GFAP), a marker for astrocytes, was not detected in hNSC-H9 or hNSC-H14, before or after differentiation (not shown).
Gene expression analysis of genes encoded on the X- or Y-chromosome
To identify whether X- or Y-encoded genes could have an effect on the differentiation of NSCs, we studied the expression of X- and Y-gametologous genes. Our first observation was that the X-chromosome seems to be subject to X inactivation in the hNSC-H9 cells since the expression of X-genes did not differ significantly between female and male cells before differentiation. For some genes, such as EIF1AX, TMSB4X, DDX3X, PRKX, ZFX, and TXLNGX, the expression was elevated during differentiation, but the expression of the X-encoded gene in female cells was not significantly different from the sum of the expression of the respective X- and Y-gametologous genes in male cells (Fig. 6). In contrast, one of the most noticeable sex differences in expression was observed for the demethylase pair UTX/UTY (also known as KDM6A/KDM6C). The expression in male cells for UTX/UTY was significantly larger than the expression of UTX in female cells, with an 18-fold difference between the sexes at four and 24-fold difference at 14 days of differentiation (P < 0.0005). This difference was due to increased expression of UTY at day 4 and 14 compared to the NSC stage. The expression of UTX did not increase significantly over these time points. Similarly, another pair of demethylases, KDM5C/KDM5D, was significantly increased in male cells during differentiation, due to larger expression of the Y-encoded gametolog in male hNSC-H14. In this case the difference was already significant at NSC-stage, and remained over day 4 and day 14 (P < 0.005 NSC-stage, P < 0.0005 day 4 and day 14). The protocadherin pair PCDH11X/PCDH11Y was also significantly increased in male cells during differentiation, with a 264-fold difference between the sexes at day 14 (P < 0.005 day 4 and P < 0.0005 day 14). The Y-encoded neuroligin NLGNY was also increased already at day 4 (P < 0.05 day 4 and 14). These results correlate well with our previous investigations, where we have shown that PCDH11X/PCDH11Y and NLGNX/NLGNY are expressed in a spatially restricted manner in early human embryos, in specific and heterogeneous cellular subpopulations of both glial and neuronal origin [9].

Gene expression analysis of genes encoded on the X- and Y-chromosome. Bars represent the average fold change of three biological replicates, and error bars represent the standard deviation. Significance was tested using Student's t-test on the sum of the ddCT values for each X/Y gametologous pair at each time point, measured from three biological replicates * ≤ 0.05, ** ≤0.01, *** ≤0.001.
Gene expression analysis of Y-chromosome long noncoding RNAs during differentiation of hNSC-H14
We have previously found six novel nonannotated long noncoding RNAs on the Y-chromosome (Y-lncs) These Y-lncs showed expression in early human embryos, before the formation and release of sex hormones, and conserved expression patterns in newborn chimpanzee [8]. To evaluate whether any of the six Y-lncs are also expressed in NSCs before or during differentiation, we measured their expression in hNSC-H14 cells. In addition to the six Y-lncs, we have investigated an additional long noncoding RNA, located on the gene anosmin 2 (ANOS2P also known as KALP). This Y-encoded gene is gametologous to the gene for Kallmann Syndrome (KAL) located on the X-chromosome, and it was first described as a nonprocessed pseudogene [22]. We added it to the analysis because inspection of databases indicated that this sequence is only expressed during very early human development, and we wanted to assess its presence in NSCs.
Six of these seven non-coding RNAs, excluding “ARSEP1 downstream”, were expressed in hNSC-H14 (Fig. 7). However, only two of them, the Y-lnc located downstream of UTY and the one located downstream of KDM5D, presented modified expression during differentiation, with significantly higher values already after 4 days of differentiation (P < 0.005 for UTY downstream and P < 0.05 for KDM5D downstream). These results suggest that the Y-lncs may be involved in the upregulation of the expression of UTY and KDM5D, which are also increased during the differentiation of male cells.
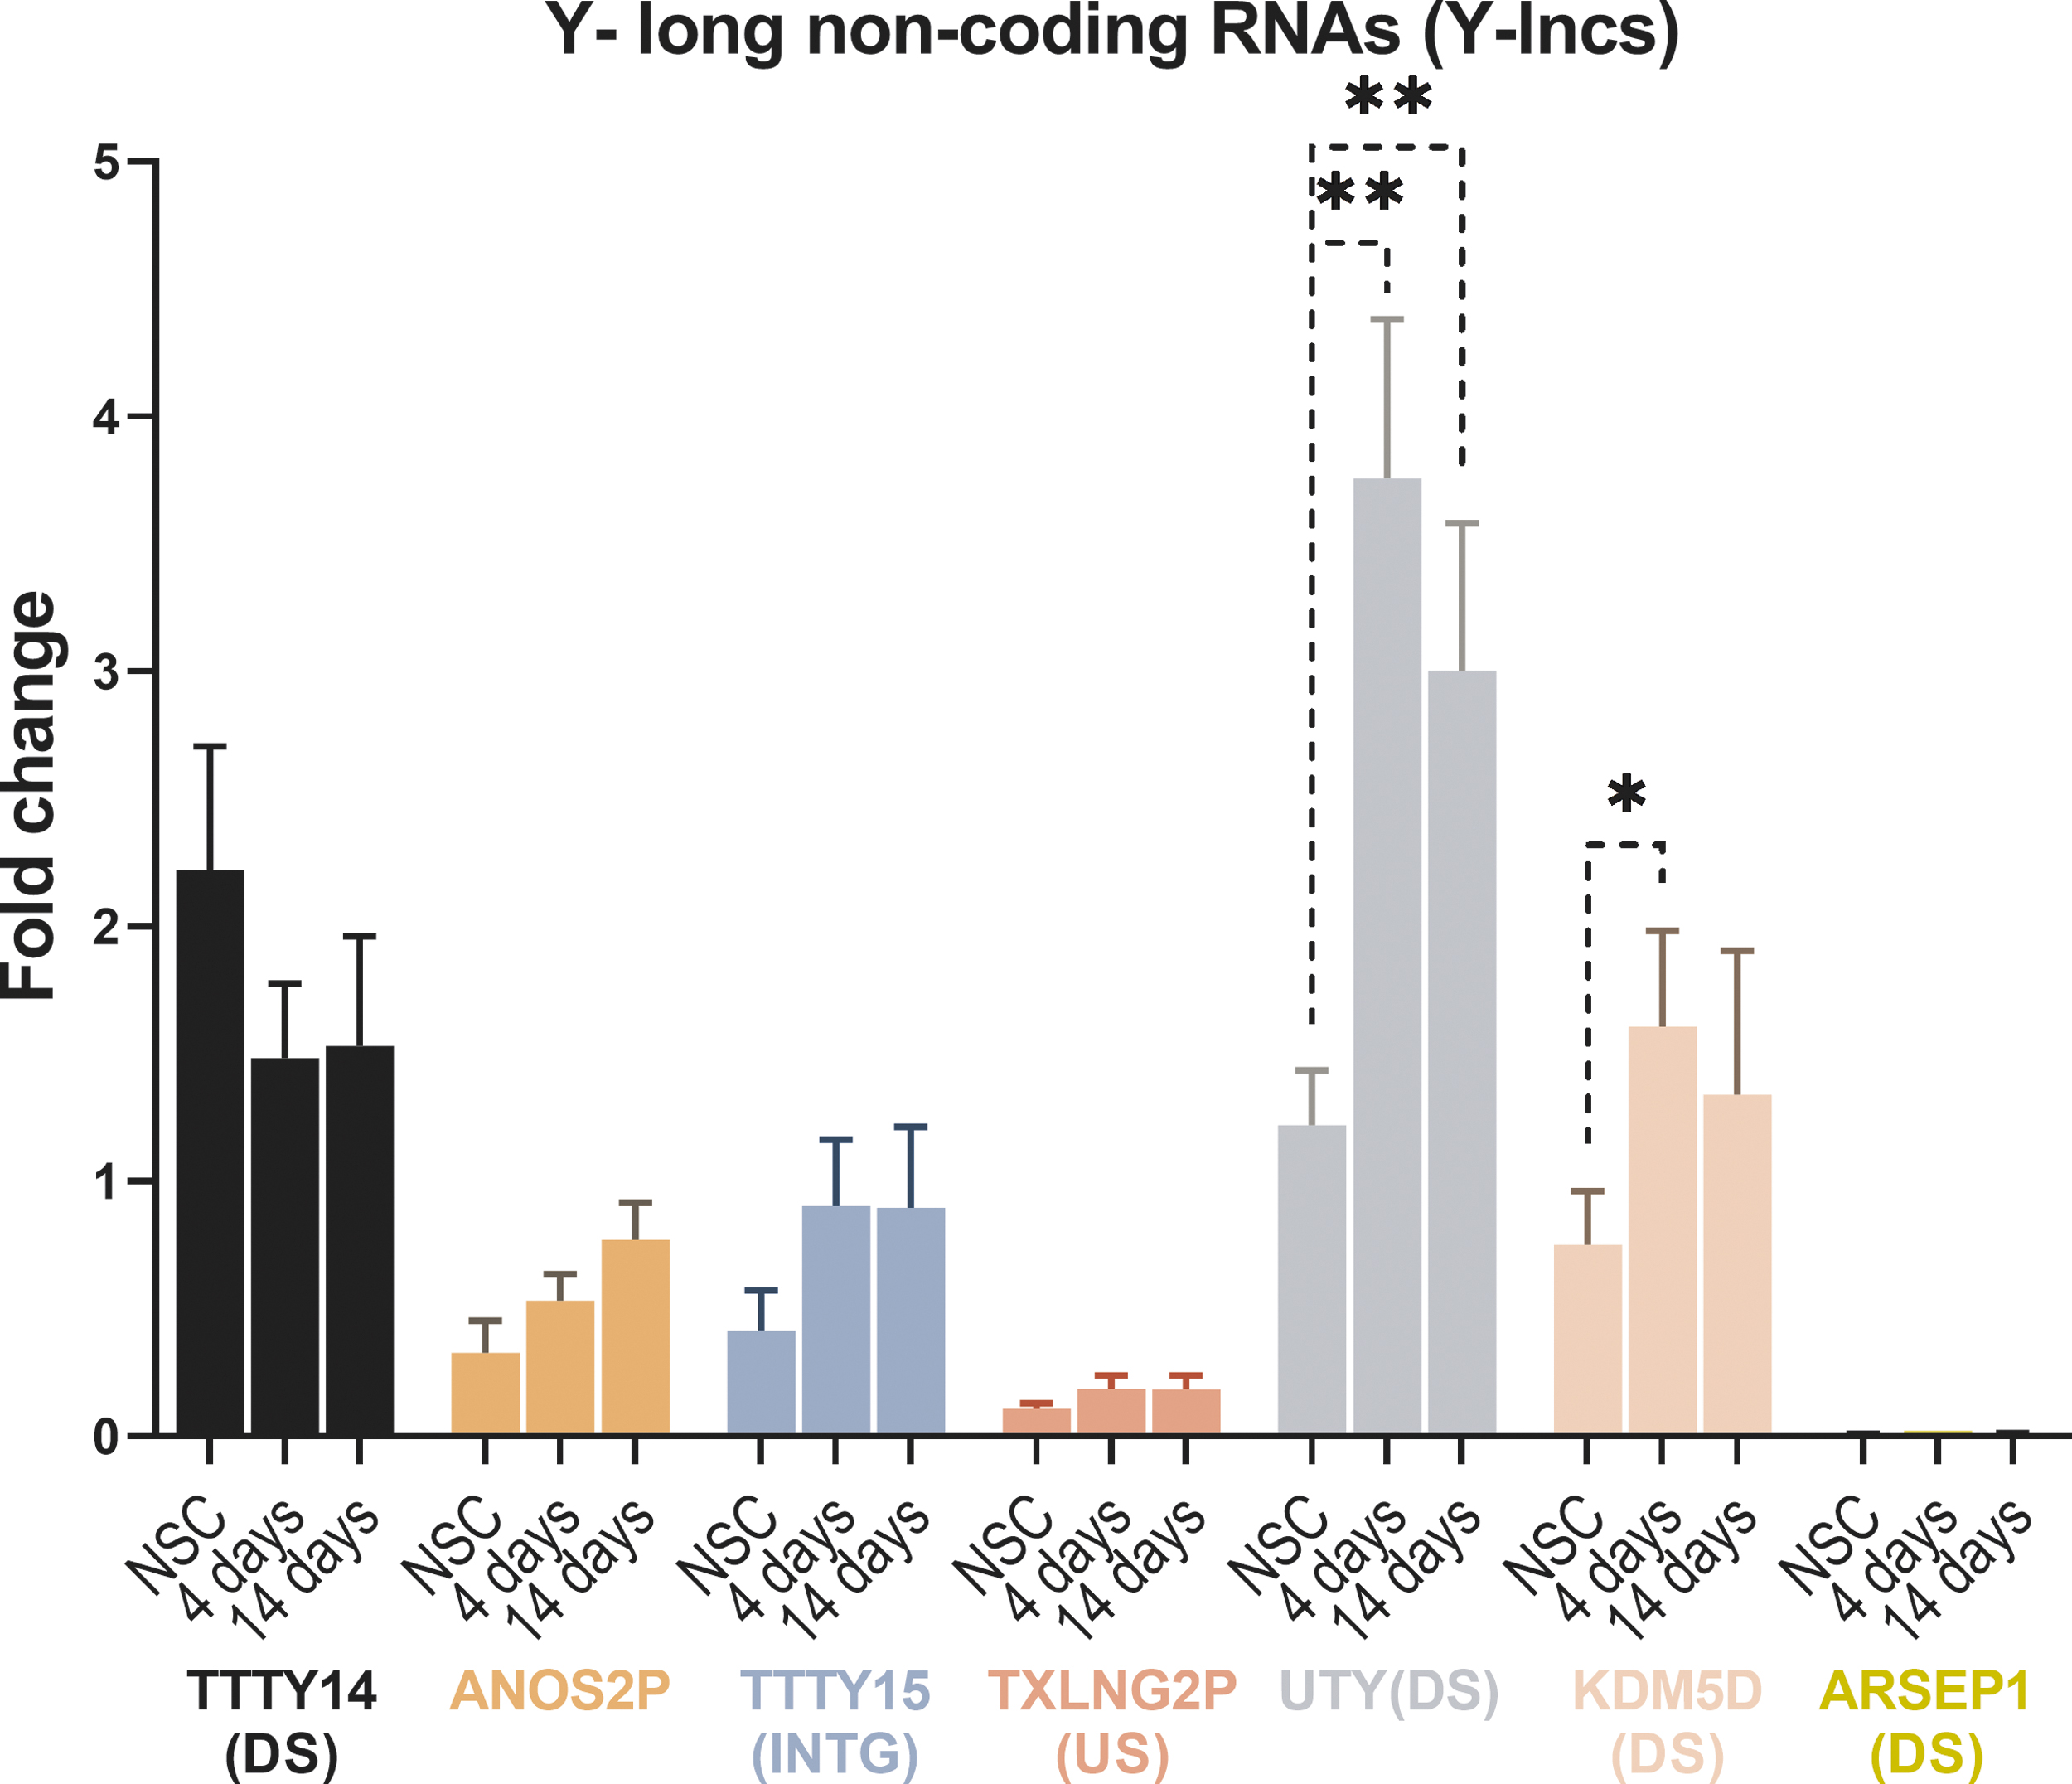
Gene expression analysis of Y-lncs in hNSC-H14. Bars represent the average fold change of three biological replicates, while error bars represent the standard deviation. The significance was tested using Student's t-test on ddCT values of biological replicates (* ≤ 0.05, ** ≤0.01). The average expression of all genes combined was considered “one-fold”, and the expression of each gene was compared to this value.
Discussion
Human neuronal stem cells have long been used as in vitro models to study neurogenesis, and they have been suggested as candidates for therapeutic approaches designed to repair the nervous system. A good understanding of the mechanisms and factors affecting stemness is crucial to fulfill these purposes. The commercially available hNSC-H9 have been suggested as good candidates for these endeavors, since these cells appear to retain their self-renewal and neuronal differentiative potential during long-term expansion [19].
We here investigated these hNSC-H9 cells, NSCs of female origin, together with another commercially available line of male origin, hNSC-H14. We show that the male cells grow faster, independent of the seeding density. We also show that both cell types are able to differentiate into neurons following similar timelines in exactly the same culturing conditions. For example, MAP2, DLG4, SYP, and DCX, four well-known markers of neuronal differentiation presented very similar expression levels after 14 days of differentiation, indicating that both cell lines were similarly successful in the production of neurons. But some markers such as MASH1 and RELN presented significantly higher expression in the male cells after differentiation. MASH1 is a transcription factor and promotes neuronal differentiation by a process known as lateral inhibition. MASH1 induces, for example, the expression of Notch ligands such as Delta-like 1, which in turn acts on neighboring cells by inhibiting their neuronal differentiation and maintaining their NSC potential [23]. Raising MASH1 levels alone or in combination with other factors has been proposed as a possible therapeutic approach in brain injury and cancer [24]. With this in mind, our results suggest that hNSC-H14 cells might maintain a higher level of stemness than hNSC-H9 after differentiation. RELN is a marker for Cajal-Retzius cells, essential pioneer neurons that guide neuronal migration in the developing neocortex. The correlation of expression levels of MASH1 and RELN in our studies is not surprising, since MASH1 is known to induce the expression of RELN during differentiation of Cajal-Retzius neurons [25].
Early during differentiation, namely 4 days after the medium was switched to differentiation medium, we also observed differences in the expression of some markers. For example, doublecortin (DCX) was significantly higher when expressed in male cells at 4 days, and RMST was significantly higher in female cells at the same time point. DCX is a microtubule-associated protein expressed by neuronal precursor cells and immature neurons [20]. Our results suggest that the process of differentiation into neurons might be accelerated in hNSC-H14 cells. This result is in contradiction with our visual inspection of cells, where we observed more morphological changes in hNSC-H9 at day 4 after differentiation (Fig. 4). The indication that hNSC-H9 may start to differentiate earlier is also supported by the higher expression of RMST, a long noncoding RNA, which is indispensable during neurogenesis [21]. Taken together, these results suggest that the two types of NSCs seem to differ in their differentiation trajectories.
Few studies have previously used and/or compared both hNSC-H9 and hNSC-H14. For example, an investigation of the proteome, phosphoproteome, and sialome in hNSC-H9 and H14 derived from their corresponding embryonal stem cells (ESC-H9 and ESC-H14) used hNSC-H14 to obtain most results. hNSC-H9 cells were only used for some confirmation experiments, thus not allowing a direct comparison [26]. In another publication, hNSC-H9 and H14 cells, derived from their corresponding ESCs, were compared for their ability to generate astrocytes in a chemically defined xeno-free medium culture system [27].
To our knowledge, no previous study has compared hNSC-H9 and H14 cells for their ability to grow and differentiate into neurons as described here. In contrast, H9 female NSCs have been used alone, without a male counterpart, in multiple investigations. For example, hNSC-H9 were used in a comparative study together with normal human neural progenitor cells (nhNPCs) isolated from the human brain cortex (obtained from Lonza), where multiple markers had differences in expression levels [28]. The nNSC-H9 were cultured as monolayers, while the nhNPCs were maintained as neurospheres. In addition, the media used for culture was different in both cases. Several factors may have contributed to the observed differences in expression. Among these, sex may have contributed. In fact, neither the published study by Oikari et al. nor the Lonza website provides information about the sex of the nhNPCs, precluding the possibility to evaluate whether sex may be involved in at least part of the observed differences. In another study, intracerebral grafts of fluorescently modified hNSC-H9 have been transferred into mice to evaluate their neuronal differentiation and potential use for transplantation [29]. Fully mature neurons were not observed before 3 months or longer after transplantation into male. The fact that donor cells and recipients differed in sex and possible consequences of this mismatch was not discussed. In a study using rats, a same sex transplantation strategy was followed, and hNSC-H9 were transplanted in sites of spinal cord injury in immunodeficient female rats. The grafts showed continuous neuronal maturation over a period of 1.5 years. One-year post-transplantation, the rats showed spinal cord functional recovery [30]. In our study, we observed that hNSC-H14 grow faster and seem to have higher expression of some neuronal markers after differentiation. It would be of interest to investigate whether shorter recovery rates would be observed after a transplantation of hNSC-H14. hNSC-H9 were also used in a study to evaluate functional changes after overexpression of the microRNA miR-146a. In hNSC-H9 female cells, miR-146 overexpression enhanced neurite outgrowth, caused changes in 10% of the transcriptome, and favored differentiation into neuronal-like cells [31]. This study was prompted by previous reports of miR-146 overexpression in the brain of children with autism spectrum disorder (ASD). Since ASD is more common in males, it would be relevant to conduct similar studies with male hNSC-H14 and possibly compare the results between the sexes.
To evaluate whether the sex difference between the hNSC-H9 and hNSC-H14 cells could influence growth and differentiation, we measured the expression of gametologous genes encoded on the X- or Y-chromosome. Often, their gene dosage is balanced, ensuring a similar functionality [32,33]. However, there is evidence that differential expression of gametologous genes can, in addition to sex hormones, affect the development of sexual dimorphisms in the nervous system [34,35] and our findings underpin this. The most significant difference we observed was in the expression of the demethylase gametologous pair UTX/UTY. UTX has been long known to be involved in development, since it was shown that small hairpin RNA-mediated knockdown of UTX altered the induction of ectoderm and mesoderm in mouse embryonic stem cells [36]. Recent experiments indicate a possible mechanism of action of UTX, involving its binding to p53-binding protein 1 (53BP1), a crucial component of DNA double-strand break signaling and repair in mammalian cells. The 53BP1-UTX interaction is required to upregulate key neurodevelopmental genes during the differentiation of human embryonic stem cells into neurons [37]. Yet another very recent investigation showed that knockout of UTX and/or JMJD3, encoding for another demethylase located on chromosome 17, determines the fidelity and lineage specification of human neural progenitor cells [38]. In their experiments they used hESC-H1, a male cell line, which means that the UTY gene is present. However, no remarks were made regarding the possible effect of the Y-encoded demethylase.
In our study, the most prominent sex difference in gametologous gene expression over the course of differentiation is the increase in UTY. Many previous experiments concerning the UTX/UTY pair ignored this Y-encoded gene because it was thought to have lost its demethylase activity and would represent a nonfunctional remnant of the ancestral UTX gene. However, this is not the case. Results with knockout mice showed that female mice with a homozygous deletion of UTX do not survive, but hemizygous males are viable [39]. This attributes to the presence and function of the UTY gene. In addition, the reanalysis and comparison of protein sequences, evolutionary genetics, transcription factor binding, and gene expression indicate that UTY has a functional role similar to UTX in metabolism and development [39]. Further support for the importance of UTY during neuronal differentiation comes from a study where nicotinamide adenine dinucleotide-dependent deacetylase, Sirt1, was knocked down in murine ESCs. It was found that Sirt1 antagonizes methylase Dnmt3l at the level of transcription and protein stability. In Sirt1 −/− ESCs several germ line genes, including UTY, were repressed and were highly methylated. These Sirt1 deficiencies impaired the differentiation potency of ESCs [40]. UTY is also essential for prostate differentiation. In human prostate cells, UTY is activated by NKX3.1, an homeobox gene that interacts with G9a histone methyltransferase. It has been proposed that an NKX3.1-G9a-UTY transcriptional regulatory network is essential for prostate differentiation [41].
Another large difference observed in our study involves the expression of a second pair of gametologous demethylases, KDM5C on the X-chromosome and KDM5D encoded on the Y-chromosome. KDM5C, also called JARID1C or SMCX, is known to be important during development, and mutations in this gene caused X-linked cognitive disability. Knockdown of Kdm5c in mouse embryonic stem cells and in neuronal progenitor cells deregulated transcription through local increases in H3K4me3. At core promoters, Kdm5c dampened transcription, but at enhancers Kdm5c stimulated their activity [42]. Further proof for a role in neurodevelopment was provided by behavioral, transcriptomic, and epigenomic analysis in Kdm5c null and forebrain-restricted inducible knockout mice. Together, genomic analyses and functional assays demonstrated that Kdm5c plays a critical role as a repressor responsible for the developmental silencing of germ line genes during cellular differentiation and in fine-tuning activity-regulated enhancers during neuronal maturation [43]. In none of the two studies described above a possible effect of the intact Y gametologous KDM5D was taken into consideration nor discussed. Interestingly, KDM5D, also known as JARID1D, SMCY, or H-Y, can specifically demethylate Lys-4 of histone H3. Furthermore, a short peptide derived from this protein is a minor histocompatibility antigen, which can lead to graft rejection of male donor cells in a female recipient [44].
Interestingly, not only UTY and KDM5D were increased during differentiation in this study but also two Y-lncs located close to these genes were upregulated early during differentiation. These results suggest that these Y-lncs may be involved in the control of expression of Y-encoded methylases, which should be investigated in the future.
To conclude, our results indicate that male (H14-derived) and female (H9-derived) human neuronal stem cells differ in their differentiation trajectories and stem cell potential after differentiation. Attention should be paid to the sex of donor and recipient while planning neurogenesis and transplantation experiments. Our results further suggest that demethylases encoded on the Y-chromosome may have a prominent role in the formation of sex differences during the differentiation of NSCs.
Footnotes
Acknowledgment
The authors thank Pascalina Suciu for the design and testing of primers specific for X- and Y-encoded genes.
Author Disclosure Statement
The authors declare no conflict of interest.
Funding Information
This study was funded by the Swedish Research Foundation (project number 2015-03542) and the Foundation for Zoological Research.
Supplementary Material
Supplementary Figure S1
Supplementary Figure S2
Supplementary Figure S3
Supplementary Figure S4
Supplementary Figure S5
Supplementary Figure S6
Supplementary Table S1
Supplementary Table S2
Supplementary Table S3
Supplementary Table S4
References
Supplementary Material
Please find the following supplemental material available below.
For Open Access articles published under a Creative Commons License, all supplemental material carries the same license as the article it is associated with.
For non-Open Access articles published, all supplemental material carries a non-exclusive license, and permission requests for re-use of supplemental material or any part of supplemental material shall be sent directly to the copyright owner as specified in the copyright notice associated with the article.