
Abstract
Periodontal disease (PD) is one of the main causes of periodontal bone resorption and tooth loss in adults. How to repair the alveolar bone effectively has always been a challenge. This study was designed to clarify the effects and the underlying molecular mechanisms of chlorogenic acid (CGA) on osteogenic differentiation of human dental pulp stem cells (hDPSCs). In this study, we used CGA to treat hDPSCs. The osteogenic experiment showed that CGA can promote hDPSCs osteogenic differentiation. RNA-Seq and quantitative real-time polymerase chain reaction showed that CGA treatment enhanced the expression of the osteogenesis genes for frizzled-related protein (FRZB) and pyruvate dehydrogenase kinase 4 (PDK4) and inhibit the expression of the osteoclastogenesis genes such as those for asporin (ASPN) and cytokine-like 1 (CYTL1). Western blot analysis showed that besides FRZB, CGA treatment also caused reduction of both active and total β-catenin, while increased the total calcium/calmodulin-dependent kinase II (CamKII), the phosphorylated CamKII (pCamKII) and the phosphorylated cAMP-response element-binding protein (pCREB). Likely, the increased osteogenesis was associated with reduced canonical Wnt/β-catenin signaling but increased noncanonical Wnt/Ca2+ signaling. The results suggested that CGA can promote the osteogenic differentiation of hDPSCs by regulating Wnt signaling. These findings will serve as a foundation for further studies on how to repair defective alveolar bone for the patients with PD.
Introduction
Periodontal disease (PD) can lead to alveolar bone resorption and tooth loss. The absorption of alveolar bone seriously affects the ability to effectively treat PD. Periodontal bone grafting and guided tissue regeneration have a certain curative effect on the restoration of alveolar bone, but it is difficult to meet clinical requirements using those techniques. Hence, there is an urgent need for new approaches to effectively repair alveolar bone.
Tissue engineering provides a good direction for the restoration of alveolar bone. Seed cells are one of the basic elements of tissue engineering. Human dental pulp stem cells (hDPSCs) are ideal seed cells because they come from a wide range of sources and are relatively easy to obtain. They have a strong ability to proliferate and clone in vitro [1]. They can differentiate into a variety of cells such as odontoblasts, osteoblasts, and endothelial cells through induction with different media [2 –5]. The osteogenic differentiation of hDPSCs can be induced by physical, chemical, and biological methods [6 –8].
Chlorogenic acid (CGA) is one of the main function components of Lonicera japonica and Eucommia ulmoides, two plants that have been used by Chinese for medical and health benefits for a long time [9,10]. This compound has antioxidant, antitumor, antiliver injury, and antiviral activities [11 –14]. It also has antiosteoporosis and bone-forming effects [15,16]. It has been reported that CGA can promote proliferation and osteogenic differentiation through the Shp2/phosphoinositide 3-kinase (PI3K)/Akt pathway and can prevent osteoporosis [17,18]. In addition, CGA can inhibit bone resorption by reducing the effect of receptor activator of nuclear factor kappa-B ligand (RANKL) and by regulating the proliferation and differentiation of bone marrow mesenchymal stem cells (BMSCs) through induction of the Akt and extracellular signal-regulated kinase (ERK) pathways [19].
In this study, we treated hDPSCs with CGA in an effort to study its function in promoting osteogenic differentiation and to determine its potential mechanism of action. We hypothesize that CGA promotes osteogenic differentiation of hDPSCs through Wnt signaling. The results may shed insight on whether CGA may offer potential benefits in tissue engineering and provide foundation for a novel theoretical strategy for alveolar bone repair for patients with PD.
Materials and Methods
Cell cultivation
hDPSCs (P16DP00181, SALIAI; Guangzhou SALIAI Stemcell Science and Technology Co. Ltd., Guangzhou, China) were thawed in a 37°C water bath, mixed properly in Dulbecco's modified Eagle's medium (DMEM)/F12 medium (SALIAI), and cultivated in an incubator with 5% CO2 and 95% humidity at 37°C. After 24 h, the medium was changed completely, and then refreshed every 48 h. Subculturing was made when the cells reached 80%–90% confluence.
Surface marker expression
hDPSCs were resuspended in cell staining buffer (SALIAI) at a density of 1 × 10⁶ cells/mL. To examine the surface marker expression, the cells were then incubated with the following fluorescence-conjugated antibodies to: CD73 (Catalog# 344004; BioLegend, BioLegend, Inc., San Diego, CA)-phycoerythrin (PE), CD45 (Catalog# 304017; BioLegend)-Alexa Fluor 488, human leukocyte antigen class II (HLA-DR, catalog# 307616; BioLegend)-phycoerythrin/Sulfo-Cyanine7(PE/Cy7), CD105 (Catalog# ab187575; Abcam, Abcam plc, Cambridge, UK)-Alexa Fluor 488, CD34 (Catalog# 343608; BioLegend)-allophycocyanin (APC), and CD90 (Catalog# 328114; BioLegend)-APC. Nonlabeled cells and isotypes were used as negative control. After mixing, the cells were incubated for 15 min in dark at 4°C. After the cells were washed twice with staining buffer, 500 μL phenol red-free 1640 Medium (Catalog# PM150120; Procell, Procell Life Science & Technology Co., Ltd., Wuhan, China.) was added to each tube. The cells were then filtered with a 70 μm disposable filter and subjected to flow cytometry (DxFLEX, Beckman Coulter, Inc., Brea, CA)
Cell proliferation assay
hDPSCs were incubated in 96-well culture plates at 37°C with 5% CO2 for 24 h. Five different experimental groups and one control, six separate wells each (n = 6), were used. The control group received 100 μL DMEM (Catalog# 11885-084; Gibco, Thermo Fisher Scientific, Waltham, MA). The experimental groups received 100 μL DMEM plus CGA (Catalog# C805057-1g; Macklin Biochemical Technology Co. Ltd., Shanghai, China.) at 0.1 μg/mL, 1 μg/mL, 10 μg/mL, 100 μg/mL, and 1 mg/mL, respectively. The cells were incubated at 37°C with 5% CO2 for 24, 48, and 72 h, respectively. Next, 10 μL 3-(4,5-dimethyl-2-thiazolyl)-2,5-diphenyl-2-H-tetrazolium bromide (MTT) solution (5 mg/mL, Catalog# M2128-100MG; Sigma-Aldrich, Saint Louis, MO) was added to each well, and the cells were incubated in the dark for 4–6 h. Then 100 μL dimethyl sulfoxide (DMSO, Catalog# D8418-100ML; Sigma-Aldrich) was added to each well. The absorbance of the cultures was measured at 492 nm with a microplate reader (Enzyme Marker DNM-9602; Beijing Pulang New Technology Co., Ltd., Beijing, China).
Alizarin red staining
After trypsinization, hDPSCs were plated in 12-well culture plates and incubated at 37°C with 5% CO2 for 24 h. hDPSCs were randomly divided into six groups, three each (n = 3). For the osteoinduction (OSI) group, hDPSCs were treated with osteogenic medium (osteogenic medium containing 10% fetal bovine serum (FBS), 5 mmol/L β-glycerophosphate (Sigma, St. Louis, MO), 100 nmol/L dexamethasone (Sigma), and 50 mg/mL ascorbic acid (Sigma). Four CGA groups, hDPSCs were treated with osteogenic medium plus CGA at either 0.1, 1, 10, or 100 μg/mL. For control group, hDPSCs were cultured in growth medium containing a low-sugar DMEM with 5% FBS (Gibco); The medium was refreshed every 3 days and continued for 21 days. After 21 days, the cells were fixed with paraformaldehyde, and washed with phosphate-buffered saline, then stained with Alizarin Red (Sigma-Aldrich) and observed under an optical microscope (Olympus CK 40, Japan), with images collected through an attached digital camera.
RNA-Seq and bioinformatics
RNA-Seq was used to detect the differentially expressed genes following osteogenic treatment. hDPSCs were plated in six-well culture plates, and randomly divided into three groups: CGA group receiving OSI medium plus CGA (10 μg/mL), OSI group receiving OSI medium, and negative control, three replicates each (n = 3). After osteogenic induction for 21 days, all cells were washed, followed by treatment with TRIzol reagent (Catalog# 15596026; Invitrogen, Thermo Fisher Scientific) as suggested by the manufacturer. Total RNA from hDPSCs was extracted according to the TRIzol instruction and then sent to Wuhan Bioacme Biological Technologies Corporation (Wuhan, China) for sequencing with an Illumina Nova sequencer (Illumina NovaSeq 6000, San Diego, CA). Differentially expressed genes are defined as those with a difference of twofold or more, either up or down, and with a P < 0.05, when two different groups were compared. Once identified, gene ontology (GO) enrichment analysis through clusterProfiler (Bioconductor release 3.12) and the Kyoto Encyclopedia of Genes and Genomes (KEGG) were further carried out using the default settings.
Quantitative real-time polymerase chain reaction
Quantitative real-time polymerase chain reaction (qRT-PCR) was used to further analyze the expression of the osteogenic differentiation-related genes, including frizzled-related protein (FRZB), pyruvate dehydrogenase kinase 4 (PDK4), asporin (ASPN), and cytokine-like 1 (CYTL1) and the housekeeping gene β-actin (ACTB) as a control. Briefly, total RNAs of the CGA, OSI-treated cells, and the negative control cells were isolated similarly as described above, and cDNA was synthesized using the OmniScript Reverse Transcriptase Kit (Catalog# 205111, Qiagen, GmBH, Hilden, Germany) following the manufacturer's instructions. The gene products were analyzed using a quantitative PCR reagent (2X SG Fast qPCR Master Mix, High Rox, Catalog# B639271, BBI, Sangon Biotech (Shanghai) Co., Ltd., Shanghai, China.), and a quantitative fluorescence PCR instrument (LightCycler480 II, Roche, Rotkreuz, Switzerland). The qRT-PCR program was as follows: 95°C for 3 min, 45 cycles at 95°C for 5 s, and 60°C for 30 s. All the primers are listed in Supplementary Table S1. All analyses were performed using the 2−(ΔΔCt) method from three technical replicates.
Western blot analysis
Western blot analysis was performed as previously described [20]. Briefly, hDPSCs were resuspended in radioimmunoprecipitation assay buffer (RIPA, Catalog# 2114-100; BioVision, Inc., San Francisco, CA). The protein content was estimated using the Pierce BCA Protein Assay Kit (Catalog# 23227; Thermo Scientific). Proteins were separated using a 10% sodium dodecyl sulfate–polyacrylamide gel electrophoresis (SDS-PAGE). Proteins were transferred onto a polyvinylidene fluoride membrane (PVDF; Merck Millipore, Overijse, Belgium), blocked, and the membranes were then treated with different primary antibodies, including mouse anti-FRZB monoclonal antibody (1: 2000, Catalog#67081-1-Ig, Proteintech; Proteintech Group, Inc., Rosemont, IL), mouse anti-active β-catenin (1:1,000, Catalog# 05-665-25UG; Millipore, MA, Billerica), rabbit anti-β-catenin (1:1,000, Catalog# 51067-2-AP; Proteintech), rabbit anti-Ca2+/CamKII (1:1,000, Catalog# 13730-1-AP; Proteintech), rabbit anti-phosphorylated CamKII (pCamKII, 1:1,000, Catalog# 12716T; Cell Signaling Technology), rabbit anti-CREB (1:1,000, Catalog# 9197T; Cell Signaling Technology), rabbit anti-phosphorylated CREB (pCREB, 1:1,000, Catalog# TA325389; OriGene, OriGene Technologies, Inc., Rockville, MD), and rabbit anti-glyceraldehyde 3-phosphate dehydrogenase (GAPDH) (1:10,000, Catalog# 10494-1-AP; Proteintech). Following addition of horseradish peroxidase-conjugated secondary antibodies, the reactive signals were detected using SuperSignal West Femto Maximum Sensitivity Substrate (Pierce, Thermo Scientific). The intensities of the target signals in gray values were measured using ImageJ software (version 1.46r; National Institutes of Health, Bethesda, MD), and further normalized with that of GADPH as an internal control.
Statistical analyses
The results were analyzed by one-way analysis of variance and Least significant difference test was used for multiple comparisons. All analyses were conducted using SPSS software (Version 20; SPSS, Inc., Chicago, IL). A difference of P < 0.05 is considered statistically significant. We graphed data using Prism 7 software (GraphPad, San Diego, CA).
Ethics approval statement
The study was approved by Affiliated Stomatological Hospital of Nanchang University (Permit No. 2018025).
Results
Characterization of hDPSCs
When examined using an inverted light microscope at 24, 48, or 72 h after cultivation, the hDPSCs were found not completely adherent to the plate at 24 h. They appeared to be round, triangular, or other irregular shapes and existed sparsely with a large gap. After 72 h, the hDPSCs were closely arranged, with a long spindle shape, uniform cytoplasm, round nucleus, and clear cell membrane (Fig. 1A). When flow cytometry was used to evaluate the surface markers of hDPSCs (Fig. 1B), hDPSCs were strongly positive for mesenchymal stem cell (MSC) markers CD73 (100%), CD90 (100%), and CD105 (99.7%), but were negative for hematopoiesis- and epithelium-specific markers CD34 (0%), CD45 (0.1%), and HLA-DR (0.1%). These results indicate that the cells fulfill the minimal criteria for defining MSCs [21]; and hence, the hDPSCs in our study were from a mesenchymal source.
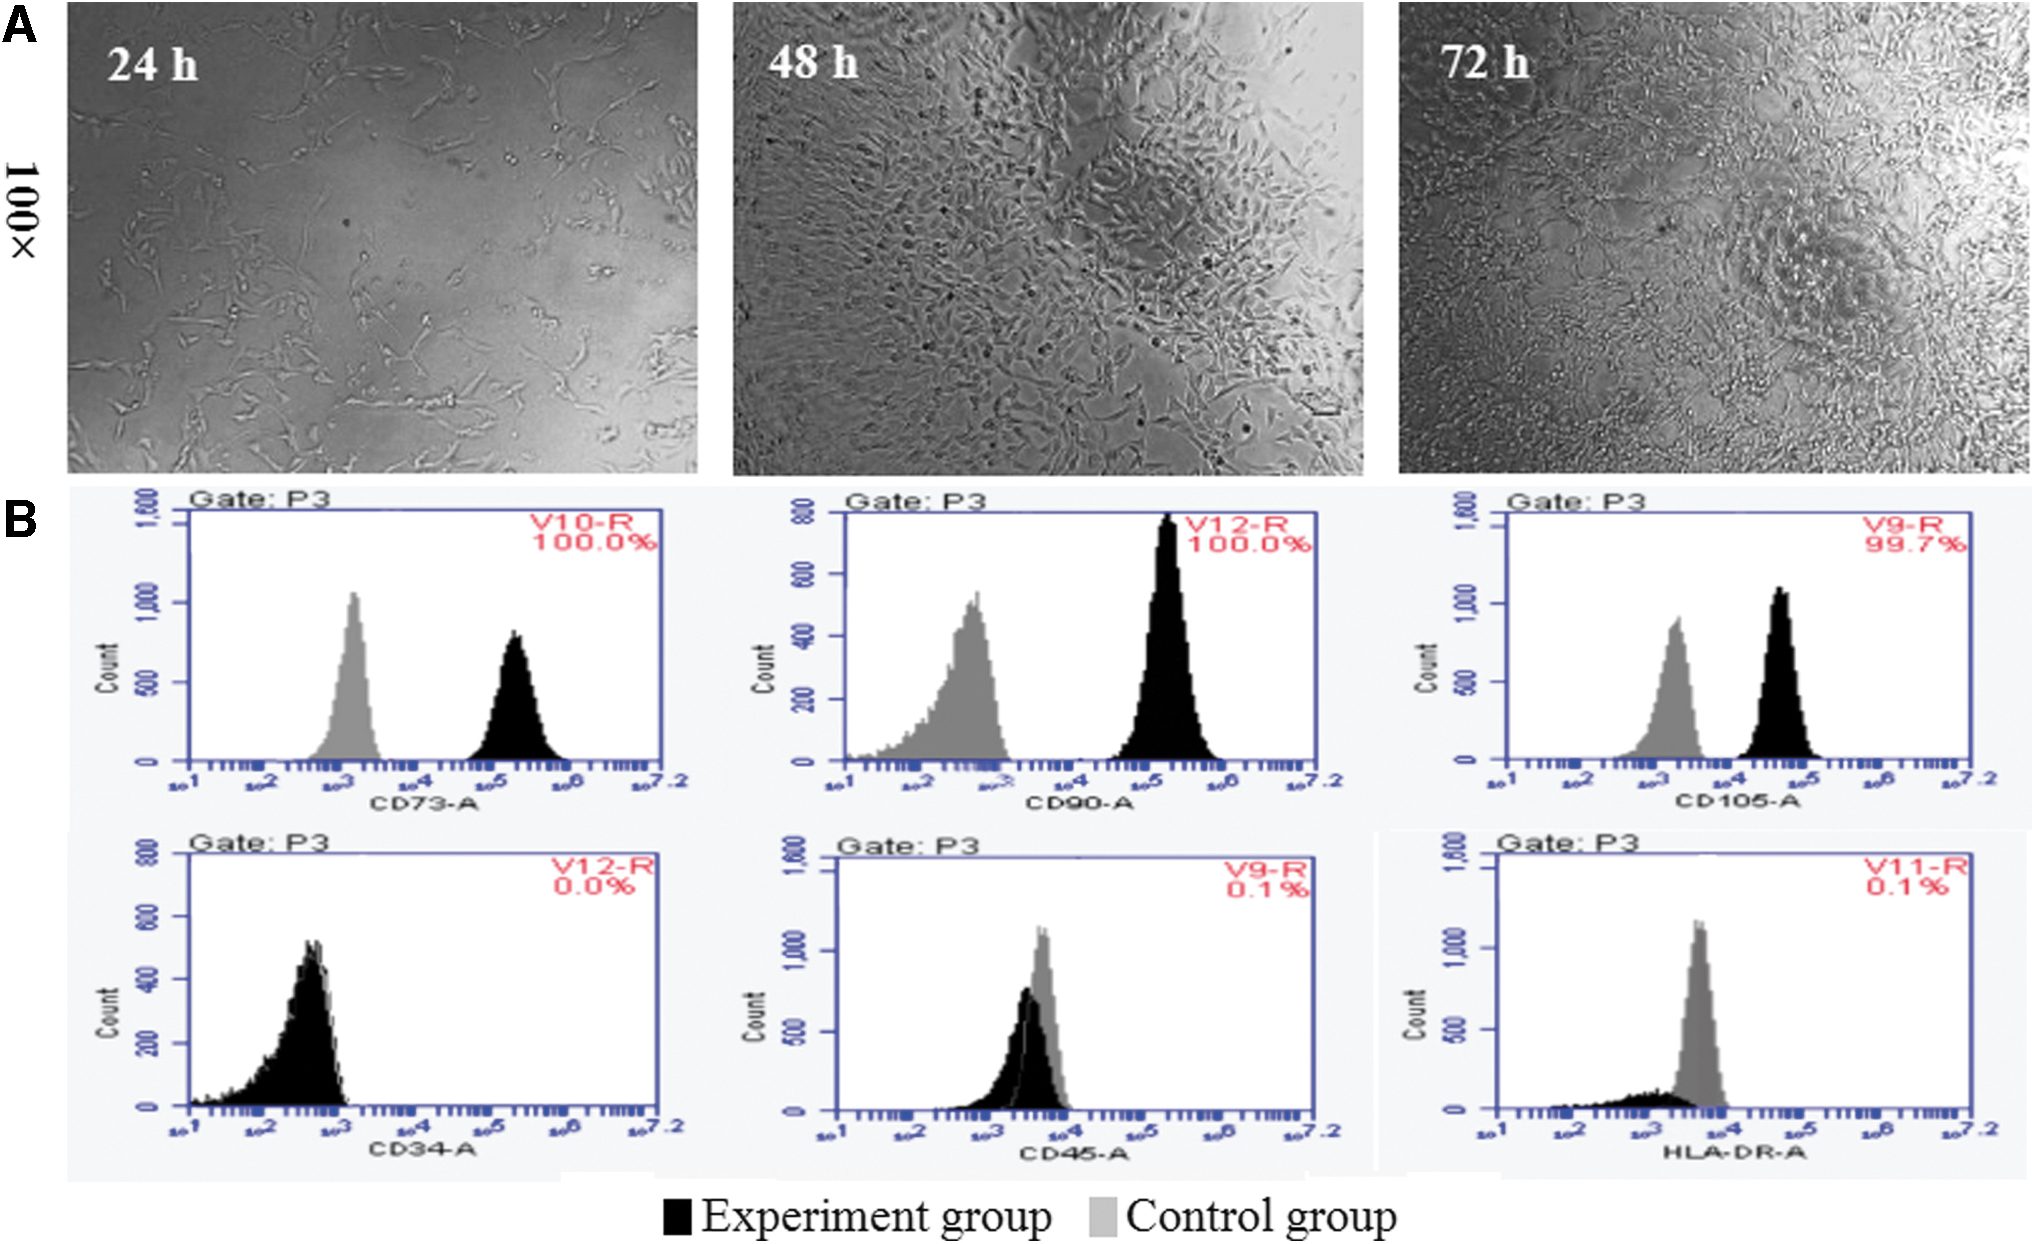
Flow cytometric analysis of hDPSCs.
CGA promoted hDPSC proliferation
The proliferation of hDPSCs exhibited a dose-dependent response to increasing CGA concentrations after 24 h cultivation (Fig. 2). Proliferation of hDPSCs treated with CGA at 100 μg/mL and 1 mg/mL was increased significantly compared with that of the other groups, and the proliferation was significantly increased following treatment at 10 μg/mL, compared with the control group. After 48 h, the proliferation decreased significantly between the 1 mg/mL group and the other groups. After 72 h, the proliferation for the 100 μg/mL group increased significantly compared with the 0.1, and 10 μg/mL and 1 mg/mL groups. When CGA was used at 1 mg/mL, it had a weak inhibitory effect on the proliferation of hDPSCs after culturing for more than 48 h. The results suggest that high concentration of CGA can inhibit the proliferation of cells, which is consistent with previous reports [17]. Therefore, the concentration of 1 mg/mL was excluded for subsequent experiments.

The effect of CGA on hDPSCs proliferation. hDPSCs were treated with CGA at 0.1, 1, 10, or 100 μg/mL, or 1 mg/mL for 24, 48, or 72 h and their proliferation was assessed by the MTT assay. Data are expressed in average ± standard deviation. *P < 0.05 when the related groups are compared. CGA, chlorogenic acid; MTT, 3-(4,5-dimethyl-2-thiazolyl)-2,5-diphenyl-2-H-tetrazolium bromide.
CGA promoted osteogenic differentiation of hDPSCs
After Alizarin Red staining, red cell clumps were apparent in both the OSI and CGA groups but not in the control group, and the red clumps in the CGA groups were larger than those in the OSI group. These results indicate osteogenic differentiation following OSI and CGA treatment, and ability of osteogenic differentiation in hDPSCs showed a positive dose-dependent response on CGA concentrations. However, at 100 μg/mL CGA, the red clumps became notably smaller and lighter (Fig. 3A). High concentration of CGA can inhibit the osteogenic differentiation of cells, which is consistent with previous reports and the results of the proliferation assays above [17]. Therefore, the concentration of 10 μg/mL was used for subsequent experiments. Before Alizarin Red staining, hDPSCs were homogeneous and there were no obvious bone nodules in the control group. There were multiple small scattered bone nodules in the OSI group, while larger ones in the CGA group (10 μg/mL) (Fig. 3B). After Alizarin Red staining, there were no red calcium nodules in the control group, scattered red calcium nodules in the OSI group, and enlarged red calcium nodules stained more deeply red in the CGA group (Fig. 3C).
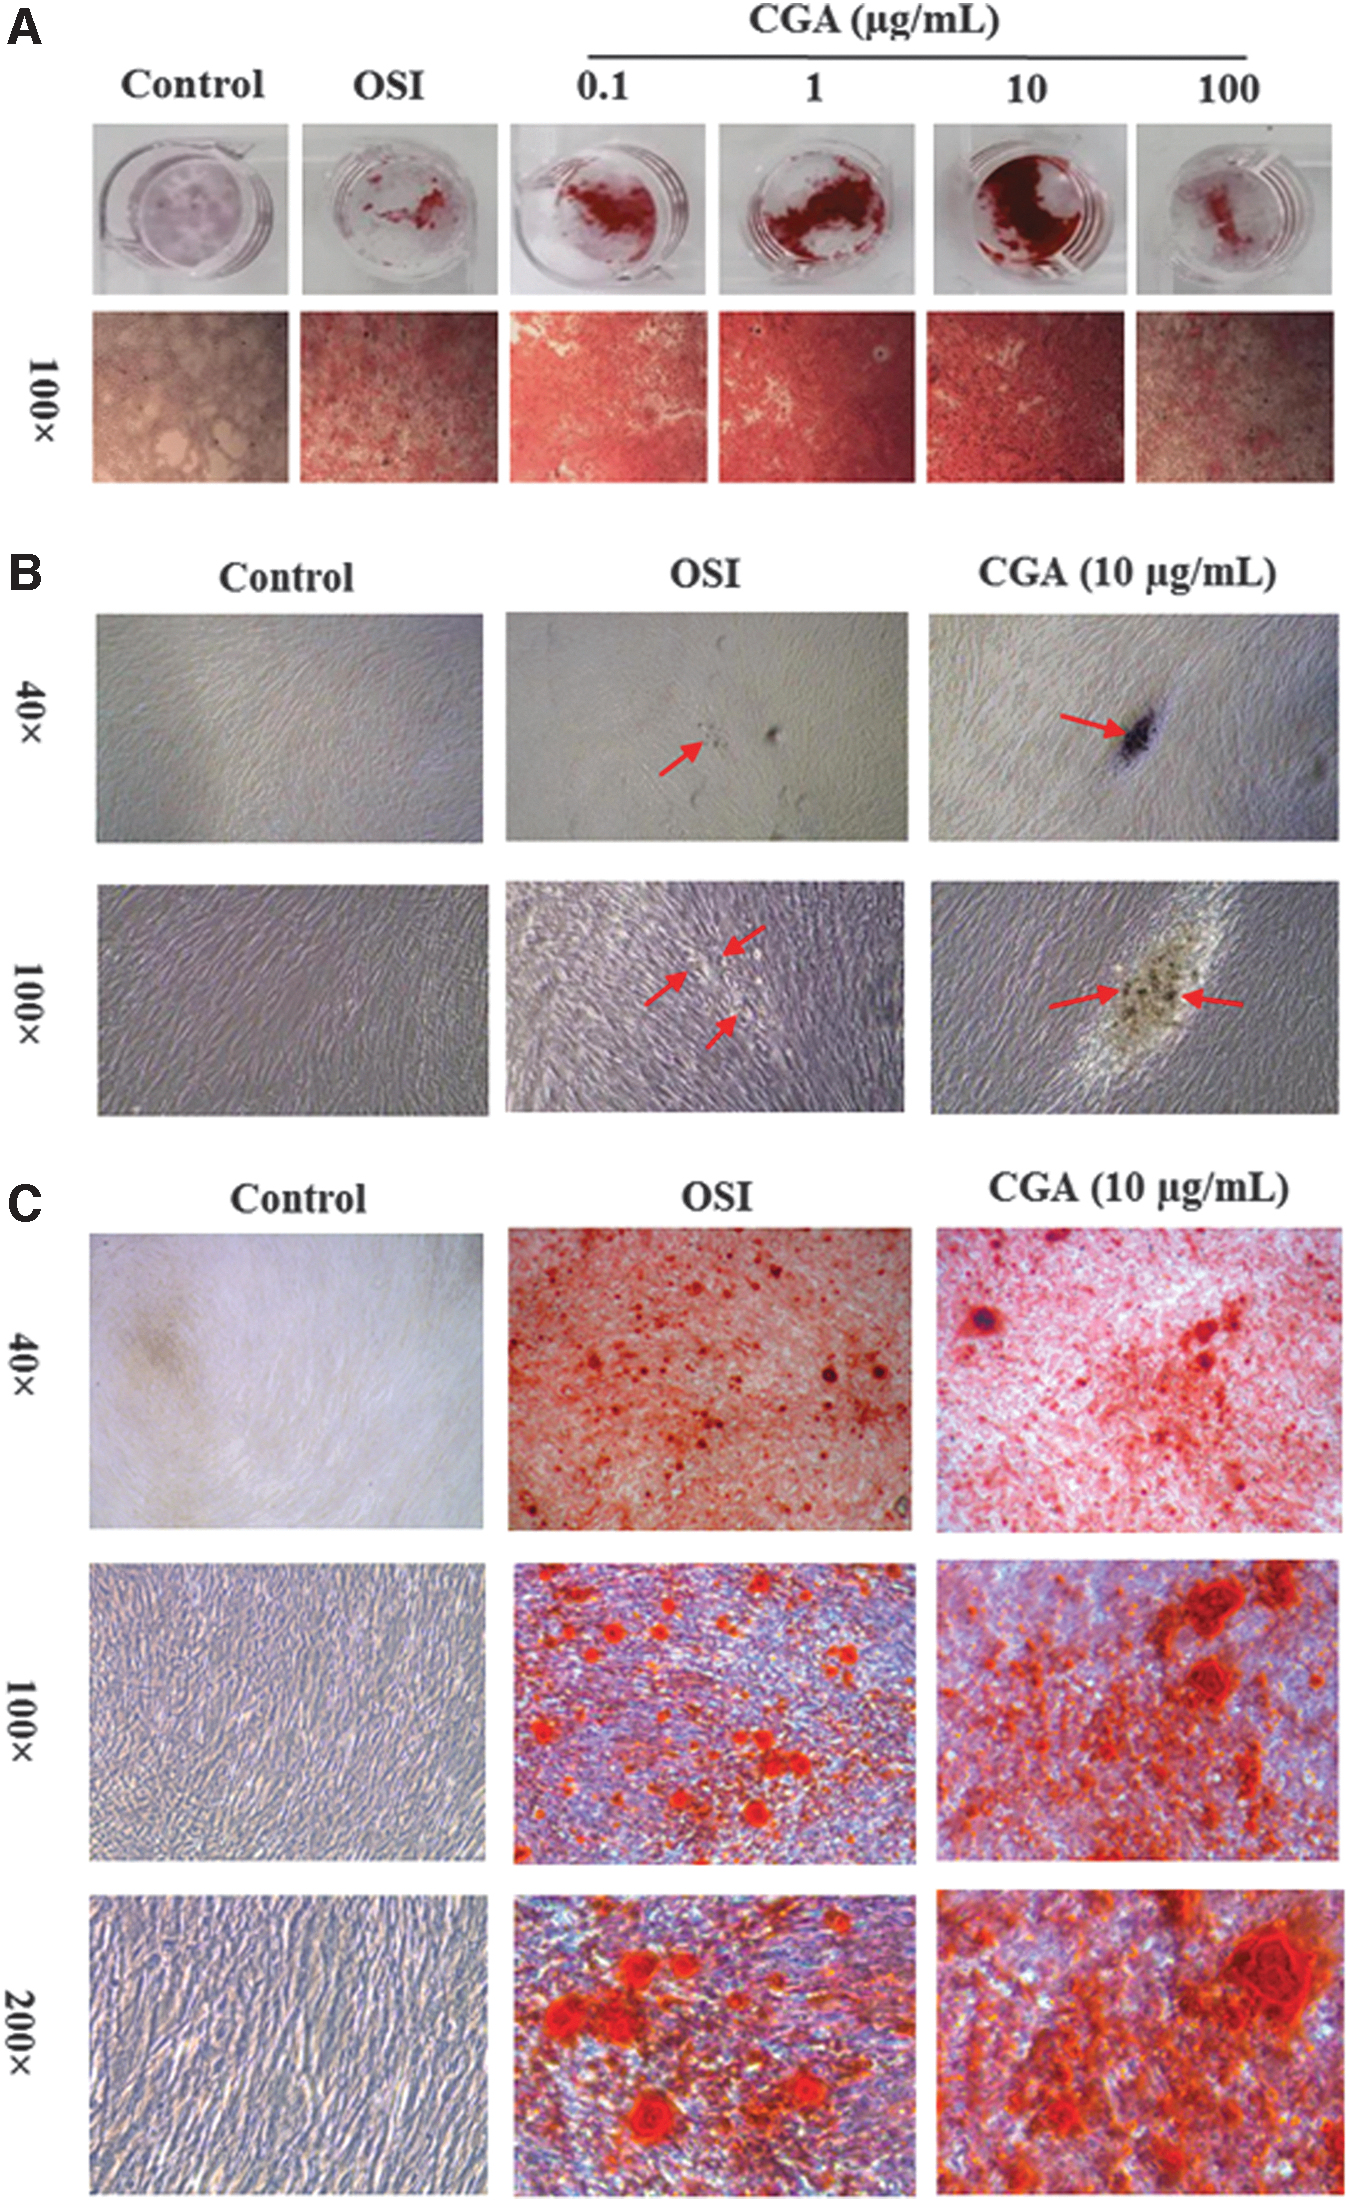
Effect of CGA on the osteogenic differentiation of hDPSCs after OSI for 21 days.
CGA affected the expression of osteogenesis-related genes
As many as 2,965 differentially expressed genes were identified following CGA treatment, while 2,388 genes were identified as up- or downregulated in response to OSI (Supplementary Table S2). When the two different profiles were compared, 726 different genes were identified between the CGA and the OSI group. As highlighted in the volcano plot (Fig. 4A), the expression levels were markedly different between the CGA and control groups and between the OSI and control groups, but there was only a small difference between the CGA and OSI groups. These results indicate some significant differences in response to the two different osteogenic treatments. The results of cluster analysis of the top 50 genes with the largest absolute difference among the groups are shown in Fig. 4B. The Venn diagram (Fig. 4C) shows the number of differentially expressed genes for each group. Of note, there were 99 differentially expressed genes common to all the groups.
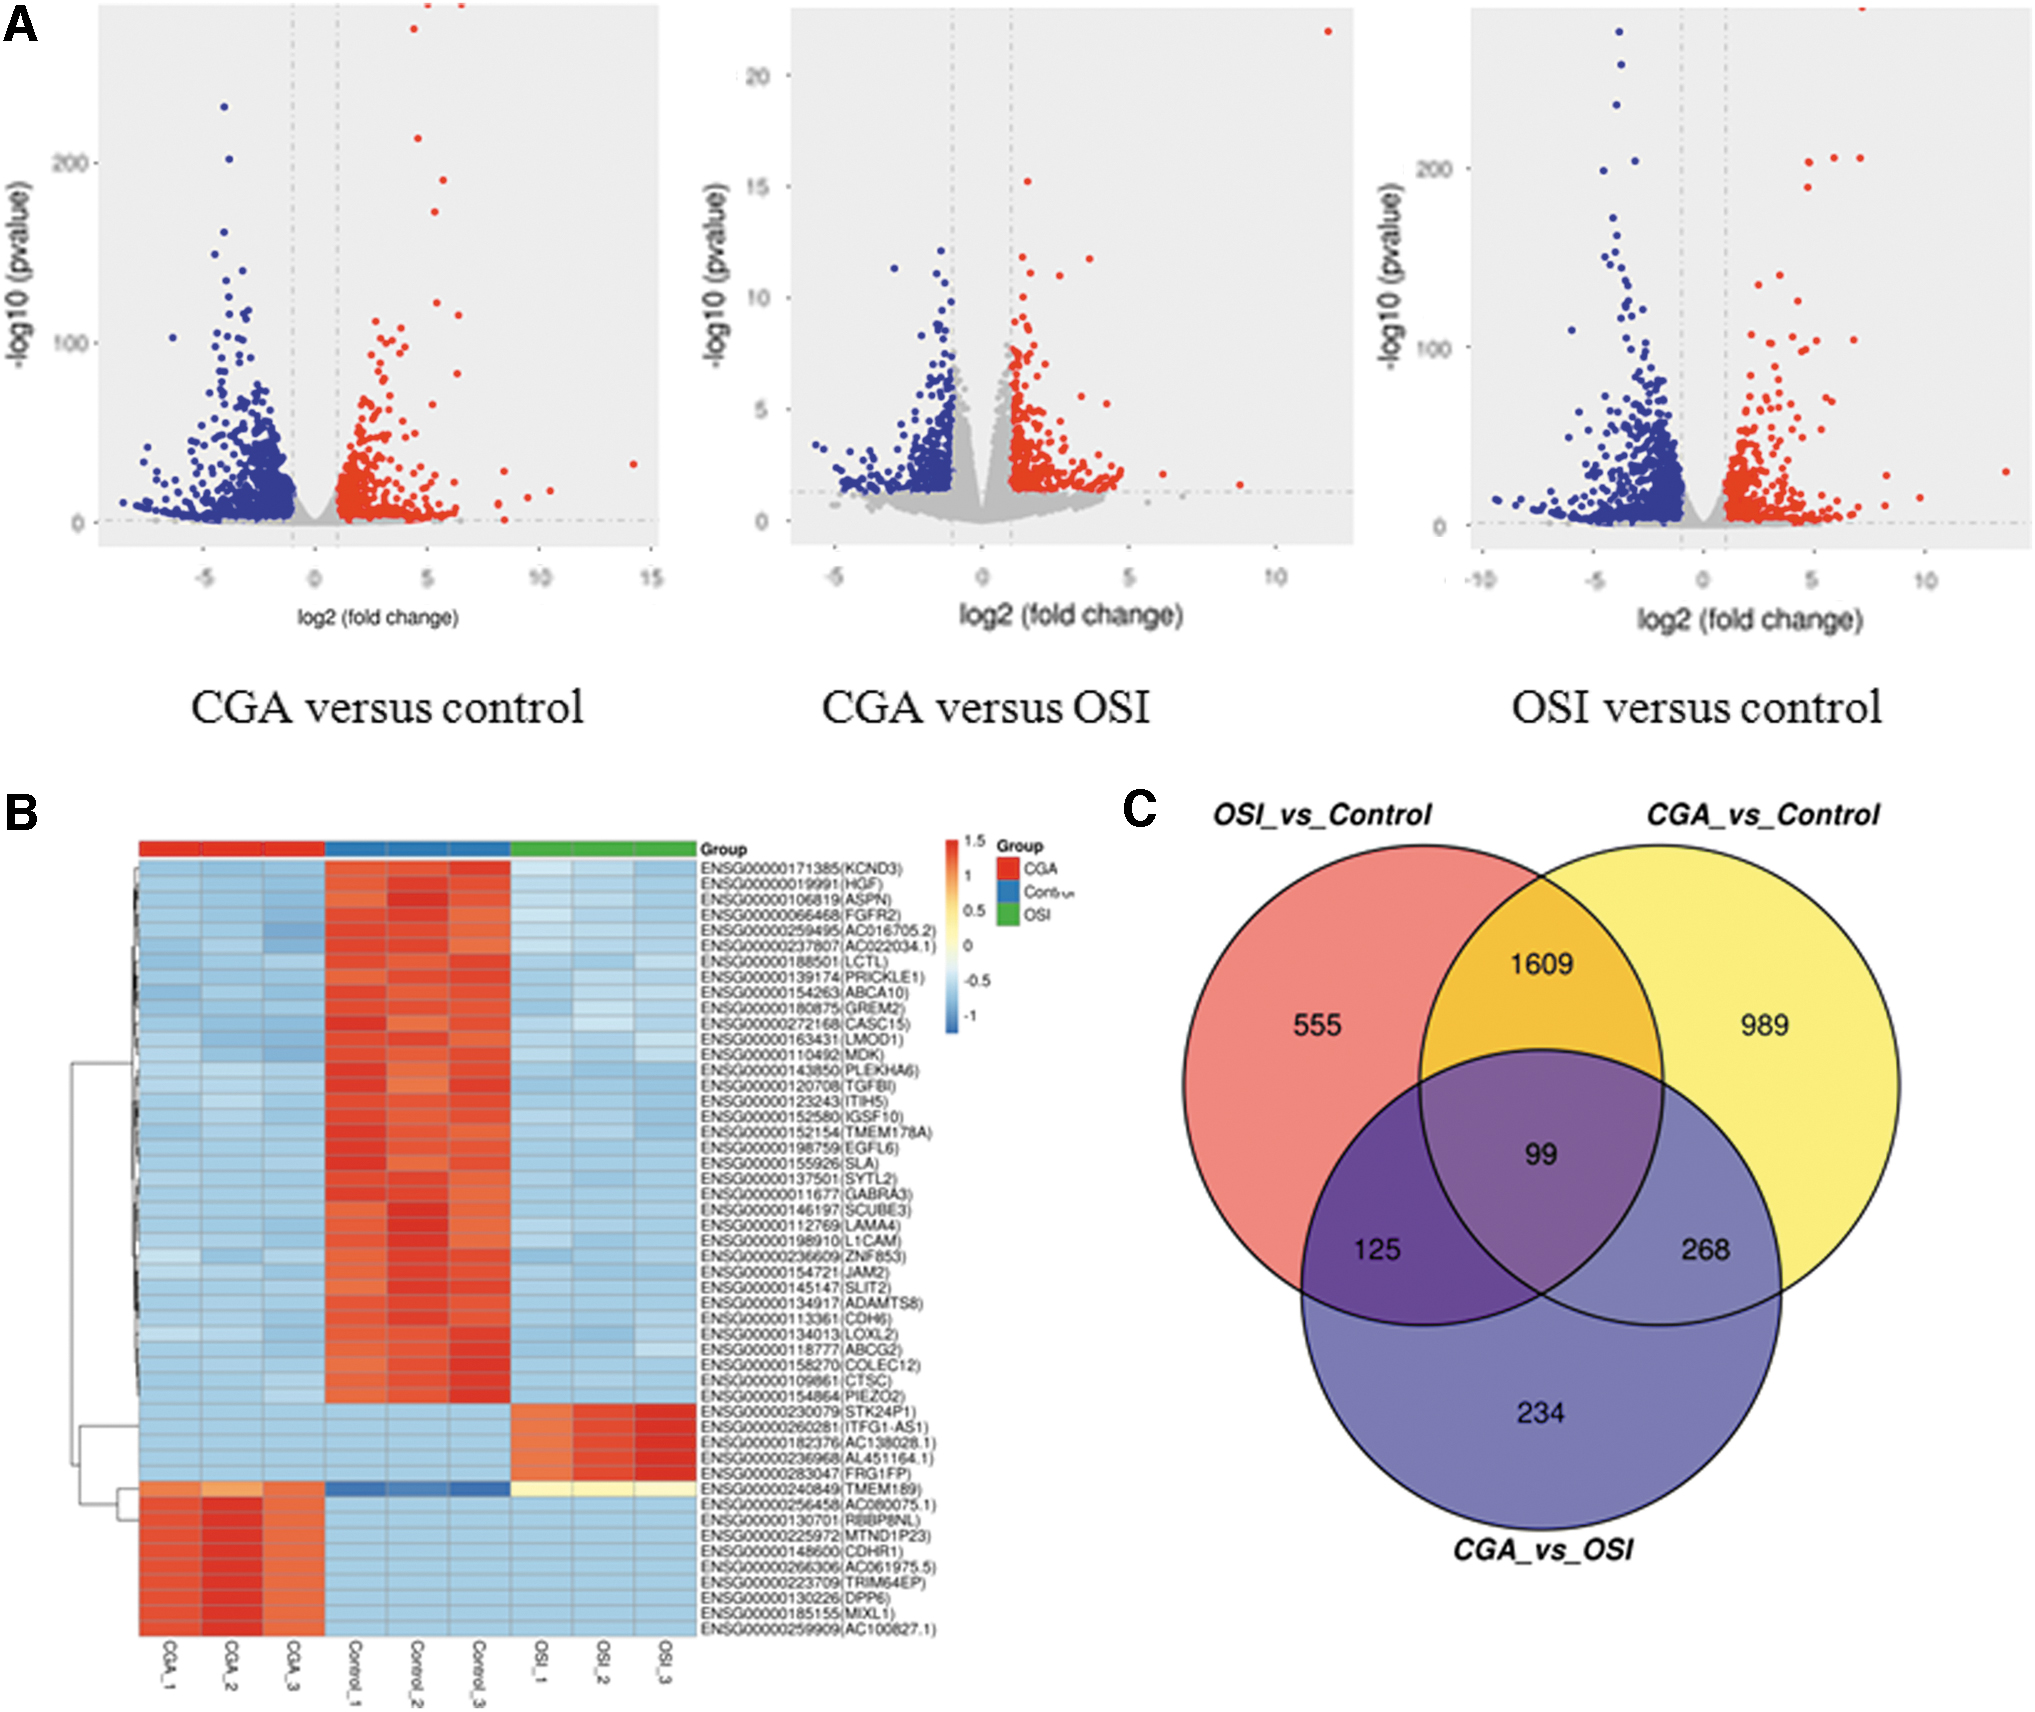
RNA-seq analysis of differentially expressed genes.
GO analysis indicated that the main functional categories related to osteogenesis were ossification, osteoblast differentiation, osteoclast differentiation, bone mineralization, bone remodeling, and regulation of cell proliferation. KEGG analysis indicated that the signaling pathways related to osteogenesis were Wnt, transforming growth factor beta (TGF-β), PI3K-Akt, mitogen-activated protein kinase (MAPK), and hypoxia-inducible factor 1 (HIF-1).
Several osteogenesis-related genes, including those for FRZB, PDK4, ASPN, and CYTL were among the most differentially expressed ones. Specifically, the genes for FRZB and PDK4 were upregulated, while the genes for ASPN and CYTL1 were downregulated in the OSI and CGA groups, compared with the control group (Fig. 5). The trend for differential expression was consistent among the CGA versus control, OSI versus control, and CGA versus OSI comparisons, as verified for selected genes by qRT-PCR. The genes for FRZB and PDK4 were found to be increased significantly in CGA group by RNA-Seq analysis, but just tended to increase by qRT-PCR analysis. Since RNA-seq and qRT-PCR are two different experimental platforms, the variation trend of the two results is consistent means a successful verification. Of note, the qRT-PCR data were consistent with the RNA-Seq data.
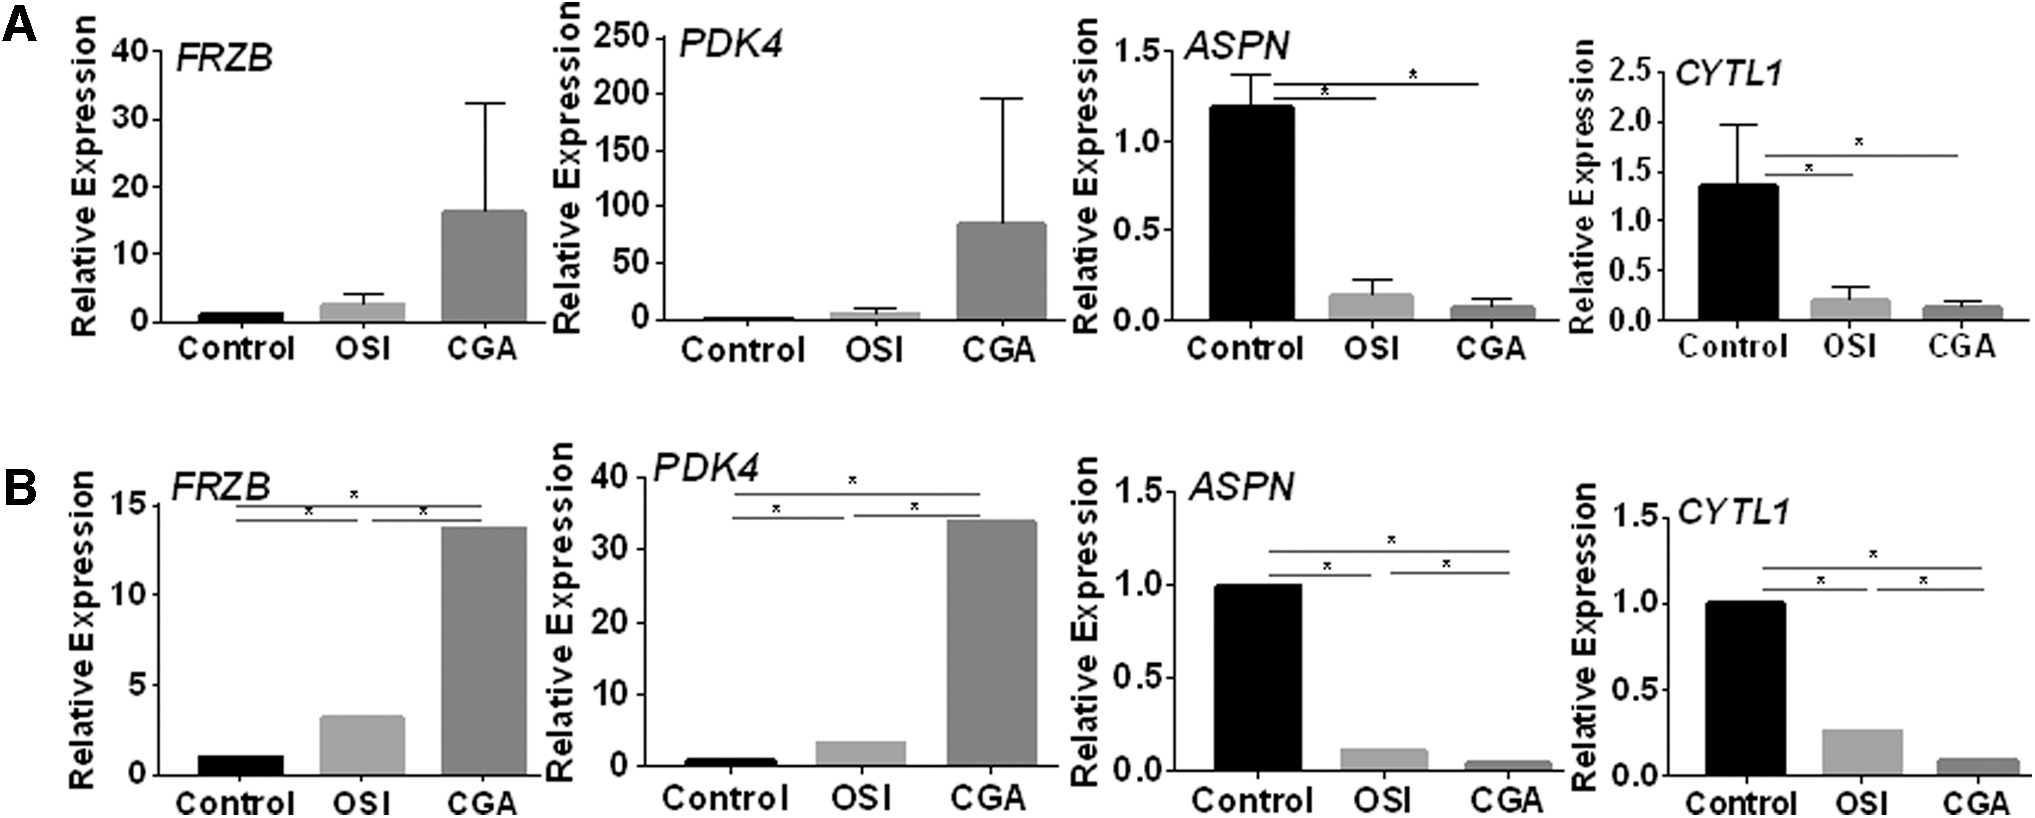
Relative expression of osteogenesis-related genes.
CGA increased the FRZB protein level and modulated Wnt signaling
The FRZB protein level, the total amount and pCamKII, and pCREB were significantly increased in both the OSI and CGA groups, compared with the control group, and existed higher in the CGA group than the OSI group. However, both active and total β-catenin protein levels were significantly decreased in both the OSI and CGA groups, and less in the CGA group than the OSI group. However, no differences were observed with the total CREB level between the different groups (Fig. 6). These results suggest that the related proteins may be part of the factors that underlie the effects of CGA in promoting osteogenic differentiation. The phosphorylation ratio of the proteins was list in Supplementary Table S3.
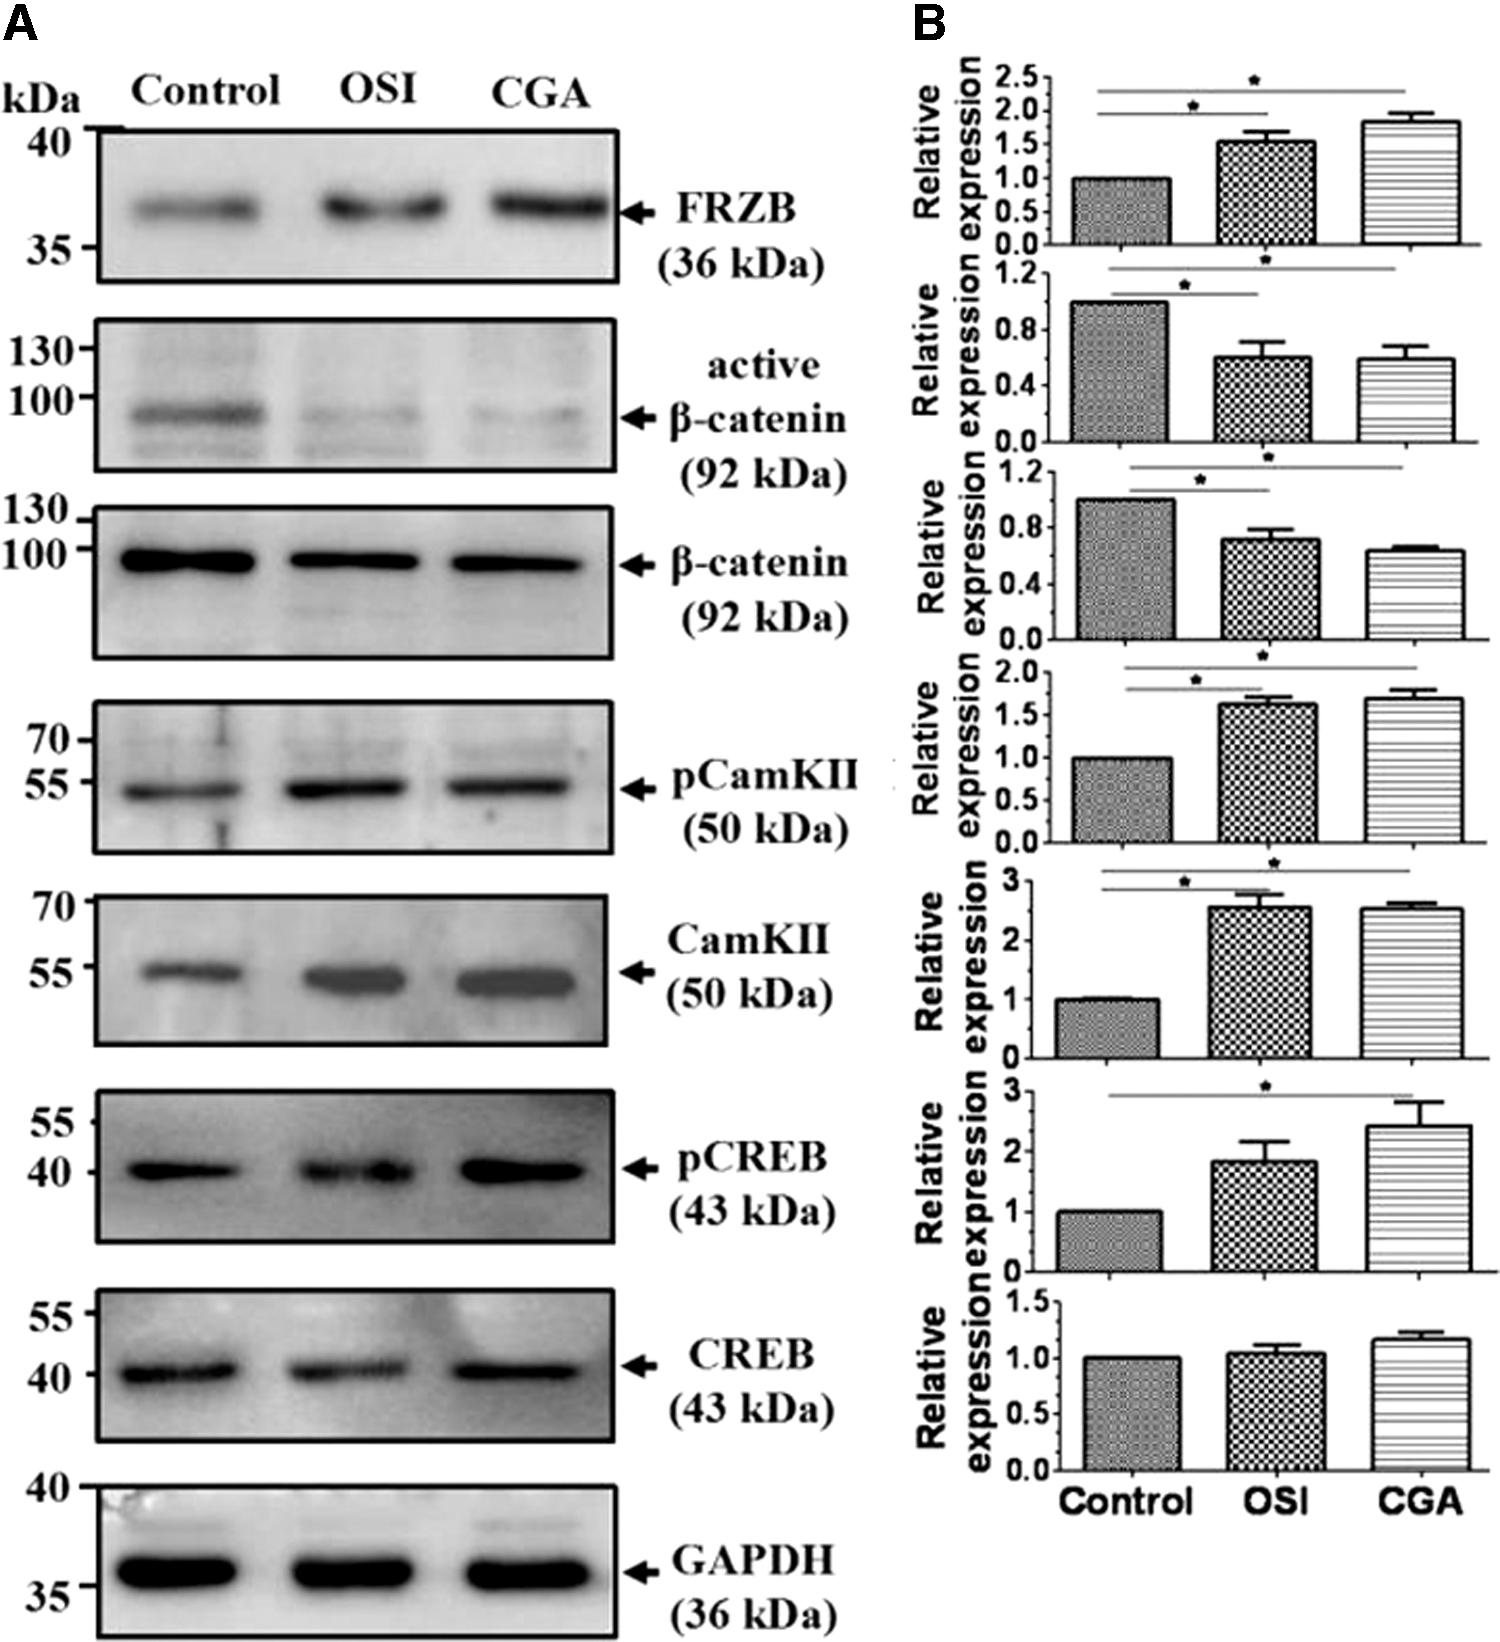
Western blot analysis of selected proteins.
Discussion
The results presented in this study showed that addition of CGA to the growth medium promoted the osteogenic differentiation of hDPSCs likely by increasing the expression of FRZB, which is known to be associated with reduced canonical and increased noncanonical Wnt signaling in vitro. hDPSCs have the capacity of self-renewal, proliferation, and osteogenic differentiation. They are easily accessible and can be obtained in a minimally invasive, less painful procedure, compared with BMSCs. The proliferative activity of DPSCs is greater than those of BMSCs and adipose tissue-derived stem cells [22,23], and DPSCs have a significantly higher osteogenic potential than endometrial stem cells [24].
FRZB is a member of secreted frizzled-related family proteins (SFPRs), also known as SFRP3. It is a modulator of Wnt signaling, which plays an important role in the osteogenic differentiation of MSCs [25,26]. Overexpression of FRZB in MC3T3-E1 cells was shown to increase calcium deposition and osteoblast markers [20]. In this study, FRZB expression significantly increased during osteogenesis of hDPSCs in CGA group, suggesting that CGA increased FRZB protein level and FRZB plays an important role in the later stages of osteogenesis and mineralization in hDPSCs.
SFPRs were originally identified as extracellular ligand-binding inhibitors of the Wnt signaling cascade. However, some data suggest that SFRPs could negatively and positively modulate the Wnt signaling [27]. Wnts activate a series of signaling pathways, including one canonical pathway also known as the Wnt/β-catenin pathway and two noncanonical pathways, the Wnt/Ca2+-dependent pathway and the Wnt/planar cell polarity (PCP) pathway. Activation of a particular Wnt pathway depends on the individual Wnt ligand and the repertoire of receptors expressed in the target cell [28]. The stable accumulation of β-catenin in cytoplasm and its precise transport to the nucleus are the precursor conditions for the sustained activation of Wnt/β-catenin signaling. However, both active and total β-catenin expressions were reduced in the CGA group. Meanwhile, total CamKII, pCamKII, and pCREB, which are downstream targets of Wnt/Ca2+ signaling [29], were increased in our study. These data suggested that FRZB decreased canonical Wnt/β-catenin signaling and increased the noncanonical Wnt/Ca2+ signaling. The canonical Wnt signaling and the noncanonical Wnt signaling reciprocally inhibitory for sharing the same Fz receptors. Typically, canonical Wnt signaling promotes osteogenic differentiation. However, we observed the effects of FRZB on osteogenesis weakened by a decrease in canonical Wnt signaling. The increase in osteogenesis could be caused by an increase in noncanonical Wnt signaling. Wnt/Ca2+ signaling through Frizzled (FZD) receptors to activate phospholipase Cβ (PLC), the activated PLC, can hydrolyze the membrane phospholipids, and then generate a second messenger diacylglycerol (DAG) and Inositol triphosphate (IP3). DAG can activate protein kinase C (PKC) and lead to raised intracellular Ca2+ levels and activation of PKC and CamKII.
CamKII further phosphorylates nuclear transcription factors such as CREB, thus with pCamKII regulating the transcription and expression of many genes to promote osteogenesis [30].
PDK4 can promote vascular calcification through the HIF-1α/PDK4 signaling pathway and inhibit the apoptosis of osteoblasts [31]. HIF-1α may regulate the osteogenic differentiation of BMSCs by regulating β-catenin and Runx2 [32]. We found that both FRZB and PDK4 were upregulated in the CGA group. It indicates that CGA probably promotes hDPSCs osteogenic differentiation through FRZB and PDK4 upregulation.
ASPN plays a negative regulatory role in the ossification process of the periodontal ligament by inhibiting bone morphogenetic protein 2 (BMP-2) and the TGF-β/Smad/Runx2 signaling pathway. ASPN expression is increased in osteoclasts during orthodontic treatment [33]. CYTL1 inhibits the osteogenic differentiation of hMSCS by blocking Runx2 and promotes osteoblast apoptosis by enhancing BAX expression. CYTL1 can also promote osteoclasts by increasing the expression of osteoclast factor Nfatc1a and its downstream factors Ocstamp and Trap [34]. ASPN and CYTL1 were downregulated in the CGA group. Thus, CGA likely inhibits the differentiation of hDPSCs into osteoclasts through ASPN and CYTL1 downregulation.
It is also worth noting that there were a lot of differentially expressed genes in the CGA group, and it is possible that many other proteins and signaling pathways may have a combined effect in promoting hDPSCs osteogenesis. Many genes may interact through Wnt, HIF-1α, and the GF-β/Smad/Runx2 signaling pathway to promote the osteogenic differentiation of the hDPSCs. However, further studies are needed to clarify the roles of the different genes and to fully understand the mechanisms that underlie the osteogenic differentiation promotion.
Conclusion
In summary, this study has shown that certain concentrations of CGA can promote the proliferation and osteogenic differentiation of hDPSCs. Our findings indicated that CGA regulates the osteogenic differentiation of hDPSCs by regulating FRZB, PDK4, ASPN, and CYTL1 expression, increasing FRZB protein, decreasing canonical Wnt/β-catenin signaling, and stimulating noncanonical Wnt/Ca2+ signaling. It awaits further study how some of the other gene/signaling pathways regulate osteogenesis.
Footnotes
Acknowledgment
The authors thank Dr. Tao Luo at Nanchang University for his help with revising this article.
Author Disclosure Statement
No competing financial interests exist.
Funding Information
The present study was supported by the Key Research and Development Program of Jiangxi Province (NO. 20192BBHL80012).
Supplementary Material
Supplementary Table S1
Supplementary Table S2
Supplementary Table S3
References
Supplementary Material
Please find the following supplemental material available below.
For Open Access articles published under a Creative Commons License, all supplemental material carries the same license as the article it is associated with.
For non-Open Access articles published, all supplemental material carries a non-exclusive license, and permission requests for re-use of supplemental material or any part of supplemental material shall be sent directly to the copyright owner as specified in the copyright notice associated with the article.