
Abstract
Dermal fibroblasts (DFs) share several qualities with mesenchymal stem cell/multipotent stromal cells (MSCs) derived from various tissues, including adipose-derived stromal/stem cells (ASCs). ASCs and DFs are morphologically comparable and both cell types can be culture expanded through the utilization of their plastic-adherence properties. Despite these similar characteristics, numerous studies indicate that ASC and DF display distinct therapeutic benefits in clinical applications. To more accurately distinguish between these cell types, human DFs and ASCs isolated from three individual donors were analyzed for multipotency and cell surface marker expressions. The detection of cell surface markers, CD29, CD34, CD44, CD73, CD90, and CD105, were used for phenotypic characterization of the DFs and ASCs. Furthermore, both cell types underwent lineage differentiation based on histochemical staining and the expression of adipogenic related genes, CCAAT/Enhancer-Binding Protein alpha (CEBPα), Peroxisome proliferator-activated receptor gamma (PPARγ), UCP1, Leptin (LEP), and Adiponectin (ADIPOQ); and osteogenic related genes, Runt related transcription factor 2 (Runx2), Alkaline phosphatase (ALPL), Osteocalcin (OCN), and Osteopontin (OPN). Evidence provided by this study demonstrates similarities between donor-matched ASC and DF with respect to morphology, surface marker expression, differentiation potential, and gene expression, although appearance of enhanced adipogenesis in the ASC based solely on spectrophotometric analyses with no significant difference in real-time polymerase chain reaction detection of adipogenic biomarkers. Thus, there is substantial overlap between the ASC and DF phenotypes based on biochemical and differentiation metrics.
Introduction
Adipose-derived stromal/stem cells (ASCs), a subtype of the multipotent stromal cell or mesenchymal stem cell (MSC) category, have the unique ability to self-renew in vitro and in vivo, are easily isolated, and can differentiate into mesenchymal tissues such as fat, bone, and cartilage. Like MSCs, ASCs show promise for clinical applications, including autologous cell transplantation, tissue engineering, and regenerative medicine [1,2]. Dermal fibroblasts (DFs) are mesenchymal-derived spindle-shaped cells that synthesize collagen and share a similar origin and morphology with MSC [3]. ASCs and DFs share many similarities, including differentiation and proliferative potentials and distribution; furthermore, the MSC-associated cell surface antigens are present on both ASC and DF [4]. It has recently been proposed that fibroblasts, myofibroblasts, and smooth muscle vascular cells are derived from a common stem cell. Consequently, fibroblasts, MSCs, and pericytes may be related cells present within the vascular wall, constituting an MSC compartment that extends throughout the entire organism [5]. However, unlike MSC and ASC, evidence suggests that DF lack anti-inflammatory and angiogenic capacity [4,6 –8]. For these reasons, recent studies are focusing on the identification of features that distinguish ASC from DF [7,9]. In the current study, we have evaluated human ASC and DF isolated from the same donors and quantitatively compared the proliferation, immunophenotype, and gene expression profile following lineage-specific differentiation.
Methods
The study was conducted at LaCell, New Orleans, LA (now merged with Obatala Sciences, Inc.) and at the Center for Stem Cell Research and Regenerative Medicine at Tulane University, New Orleans, LA.
All human tissues were obtained under a protocol approved by the Western Institutional Review Board (IRB Protocol number 1138160, March 2015).
Recruitment of skin and adipose tissue
Adipose tissue was obtained by abdominal dermolipectomy from three female, Caucasian patients with average body mass index (BMI) of 23.03 ± 1.56 kg/m2 (ranging from 22.03 to 24.83 kg/m2), without comorbidities, and a mean age of 39 ± 6.24 years). Lean donors were selected due to prior findings indicating a correlation between ASC function and donor BMI [10]. All surgeries were elective and performed by the same plastic surgeon. The tissue was transferred to the laboratory in closed insulated containers. The tissue sample was maintained at room temperature (RT) for no more than 24 h before use. All of the following procedures were performed in biosafety cabinets using universal precautions.
Isolation of stromal vascular fraction and ASC
Initially, the skin was dissected from the adipose tissue and retained for isolation of DFs. ASCs were isolated from the adipose tissue using a standard protocol [11,12]. Briefly, the adipose tissue was mechanically minced and washed repetitively with sterile phosphate-buffered saline (PBS) until the supernatant became clear. Next, collagenase Type I solution (0.1% Collagenase Type I; Worthington Biochemical Corporation, Lakewood, NJ) and 1% Fraction V bovine serum albumin (BSA; Sigma-Aldrich, Saint Louis, MO) suspended in PBS was added to the adipose tissue in a 1:1 volume ratio for enzymatic digestion. The tissue suspension was incubated at 80 to 120 revolutions per minute (rpm) (Innova 4200 Incubator Shaker; New Brunswick Scientific, Edison, NJ) for 60 min at 37°C. The digest was neutralized, then centrifuged (Table Top Centrifuge, Sorvall Legend, Kendro, Germany) for 5 min at 1,200 rpm (300 g) twice, and the supernatant aspirated. The stromal vascular fraction cell pellet was resuspended in stromal media [Dulbecco's Modified Eagle Medium (DMEM) High Glucose/F12 Hams supplemented with 10% fetal bovine serum (FBS), 1% Penicillin/Streptomycin], plated in the T-175 flasks and maintained in a humidified tissue culture incubator at 37°C with 5% CO2 (Heratherm® microbiological incubators; Thermo Scientific, Logan, UT) to obtain adherent ASC. The flasks were washed with PBS 48 h after plating, fed with fresh stromal medium, and maintained in culture with feeding every 2 to 3 days until reaching 80%–90% confluence based on phase-contrast microscopic monitoring [11,13].
Isolation of DF
The remaining human skin, free of the adipose tissue, was washed extensively with equal volumes of sterile PBS until the supernatant became clear. Fragments of dermal tissue (2 to 3 mL in diameter) were placed in 1 mL aliquots of 0.25% Type I collagenase, 0.025% DNase, 20% FBS, 80% DMEM/F12, 1% Penicillin/Streptomycin, and incubated at 37°C overnight without agitation. The next morning, DF medium (DMEM/F12, 20% FBS, 1% Penicillin/Streptomycin) was added, the tissue was triturated by pipetting, and plated in T-175 flasks. The flasks were incubated at 37°C in 5% CO2 for 2 days, media changed every 2 to 3 days, and maintained until reaching 80%–90% confluence based on phase-contrast microscopic monitoring.
Cryopreservation of the ASC and DF
After reaching at least 80%–90% confluency, cells were harvested from flasks by trypsin digestion, and Trypan Blue exclusion was used to determine the percentage of viability and total number of cells [13].
Tubes were centrifuged for 5 min at 300 g, medium was aspirated leaving behind the cell pellet, and cells were diluted to a final concentration of 1 million viable cells per milliliter of cryopreservation medium (80% Bovine Calf Serum, 10% DMSO, 10% Stromal Medium). The suspension was placed into cryovials within alcohol freezing containers (Mr. Frosty™), stored at −80°C overnight for controlled rate freezing and then transferred to a liquid nitrogen container for long-term storage [12].
Cell count and viability
The cells were thawed in a 37°C water bath, transferred to 15-mL tubes, diluted with stromal media, and centrifuged for 5 min at 300 g. Next, the supernatant was aspirated, the pellet was resuspended in 2 mL of stromal media, and the live and dead cells (Trypan Blue exclusion) were counted using a hemocytometer.
Colony-forming unit fibroblast assay
At passage 0, ASCs and DFs were plated into six-well plates at a density of 50 or 100 cells per well suspended in 2 mL/well of stromal or DF medium, respectively, and incubated at 37°C with 5% CO2. Medium was changed every 2 to 3 days for 2 weeks when the plates were rinsed with PBS, fixed in 1% paraformaldehyde, and stained with 0.1% Toluidine Blue. Aggregates with more than 32 blue stained cells were counted as a colony-forming unit fibroblast (CFU-F) based on microscopic examination [14].
Differentiation assays
To determine if isolated ASCs and DFs had a similar multipotent capacity to differentiate into adipocytes and osteoblasts, the cells were cultured until confluent in 6-well plates. ASCs and DFs were plated on 12-well plates at a density of 25,000 cells/cm2 and incubated at 37°C with 5% CO2. The cultures reached 90% confluence after 3 days for ASCs and 6 days for DFs. Cells were then induced for either the adipogenic or osteogenic differentiation lineage using the appropriate medium, and control wells were stromal maintenance media. Adipogenic induction medium contained DMEM High-Glucose/F-12 (HyClone, Logan, UT), 3% FBS, 1% antibiotic/antimycotic, 33 μM Biotin, 17 μM pantothenate, 100 nM insulin, 1 μM dexamethasone, 500 μM isobutylmethylxanthine, and 5 μM rosiglitazone. Osteogenic induction medium contained DMEM High-Glucose/F-12 supplemented with 1 μM dexamethasone, 10 mM β glycerol phosphate, and 50 μM ascorbate-2-phosphate. Cells were induced for 3 days and then maintained changing medium every 2 to 3 days. After 14 days in differentiation media, the appropriate wells were stained with Oil Red O (adipogenic wells) for evidence of neutral lipid accumulation or Alizarin Red (osteogenic wells) for evidence of mineralization using previously published protocols. The stain was then eluted and the optical density determined at 540 nm (Oil Red O) or 405 nm (Alizarin Red) using a plate reader. Background staining determined in blank wells (no cells) from the experimental points was subtracted. The relative staining intensity of the differentiated wells compared with the preadipocyte controls was determined. The remaining wells were harvested with TRIzol™ for stromal, adipogenic, and osteogenic total RNA and quantitative real-time polymerase chain reaction (qRT PCR) detection of biomarkers [15].
Flow cytometric analysis of cell surface marker expression
ASCs and DFs were characterized based on their cell surface expression of CD29, CD34, CD44, CD45, CD73, CD90, and CD105, with IgG PE and IgG FITC serving as controls using flow cytometry (Beckman Counter Epixs FC 500; Miami, FL with CXP Software (BD Biosciences, San Jose, CA).
Briefly, 1.5 million cells were centrifuged in a microcentrifuge tube for 5 min at 300 g at RT, the medium was aspirated, and the cells were resuspended in 1 mL of cold PBS. This volume was transferred to a 1.5-mL Eppendorf microcentrifuge tube, centrifuged at 1,874 g for 1 min at RT, and the cells were resuspended in 500 μL of cold PBS. Cell aliquots of 50 μL were distributed in 10 microcentrifuge tubes, to which fluorochrome-conjugated monoclonal antibodies were added: CD29 PE, CD105 PE, CD45 PE, CD34 PE, CD44 FITC, CD73 PE, and CD90 PE with IgG PE and IgG FITC as isotype controls. Samples were incubated in the dark for 30 min at RT. After the incubation period, cells were washed with 1 mL 1% BSA in cold PBS three times and resuspended in each microcentrifuge tube in 500 μL of 1% formaldehyde in PBS, transferred into 10 polystyrene tubes, and left at 4°C overnight for fixation [16,17].
Quantitative real-time polymerase chain reaction
Total RNA was extracted by the RNeasy® Mini Kit (Qiagen, Valencia, CA), quantified using NanoDrop and reverse transcribed using the iScript™ cDNA Synthesis Kit (Hercules, CA) according to the manufacturer's instruction. qRT PCR was performed using the CFX96 Touch™ Real-Time PCR Detection System (Hercules, CA) as follows: 1 cycle at 95°C for 4 min, 40 cycles of 95°C for 15 s, and 60°C for 1 min, then 1 melt curve of 55°C to 95°C with an increment of 0.5°C for 5 min. Cyclophilin B was used as a housekeeping control gene for normalization. Genes analyzed were adipogenic pathway genes—PPARγ, UCP1, CEBPα; osteogenic pathway genes—Runx 2, ALPL, Osteopontin, and Osteonectin (Table 1). Data are represented as fold change using the ΔΔCT method [18] and results were compared with a non-parametric Kruskal–Wallis test and Dunn's posthoc test using GraphPad Prism 5.0 (GraphPad, LaJolla, CA).
Quantitative RT-PCR from Induced (Adipogenesis or Osteogenesis) or Noninduced Human ASC and Human DF Were Analyzed by RT-PCR Using the Primer Sets Outlined
Results for each mRNA were normalized relative to the expression of CyCB as a control. DF exhibited a decreased adipogenic and osteogenic gene expression when compared with ASC.
ASC, adipose-derived stromal/stem cell; DF, dermal fibroblast; RT-PCR, real-time polymerase chain reaction.
Statistical analysis
All data are presented as the mean ± standard error. Comparisons between groups were made with Student's t-test. Values of P < 0.05 were considered significant.
Results
Viability and number of DFs and ASCs
The DFs and ASCs were characterized by number and viability after cryopreservation. The number of viable cells obtained after thawing the cryopreserved ASCs was 1.0 × 10⁶ ± 1.1 × 10⁵ cells/mL (ranging from 8.77 × 10⁵ to 1.08 × 10⁶), and no significant difference was found between donors. The cell yield for DFs was 7.5 × 10⁵ ± 1.0 × 10⁵ cells/mL (ranging from 6.6 × 10⁵ to 8.6 × 10⁵), which also did not have statistical difference between donors.
CFU-F assays
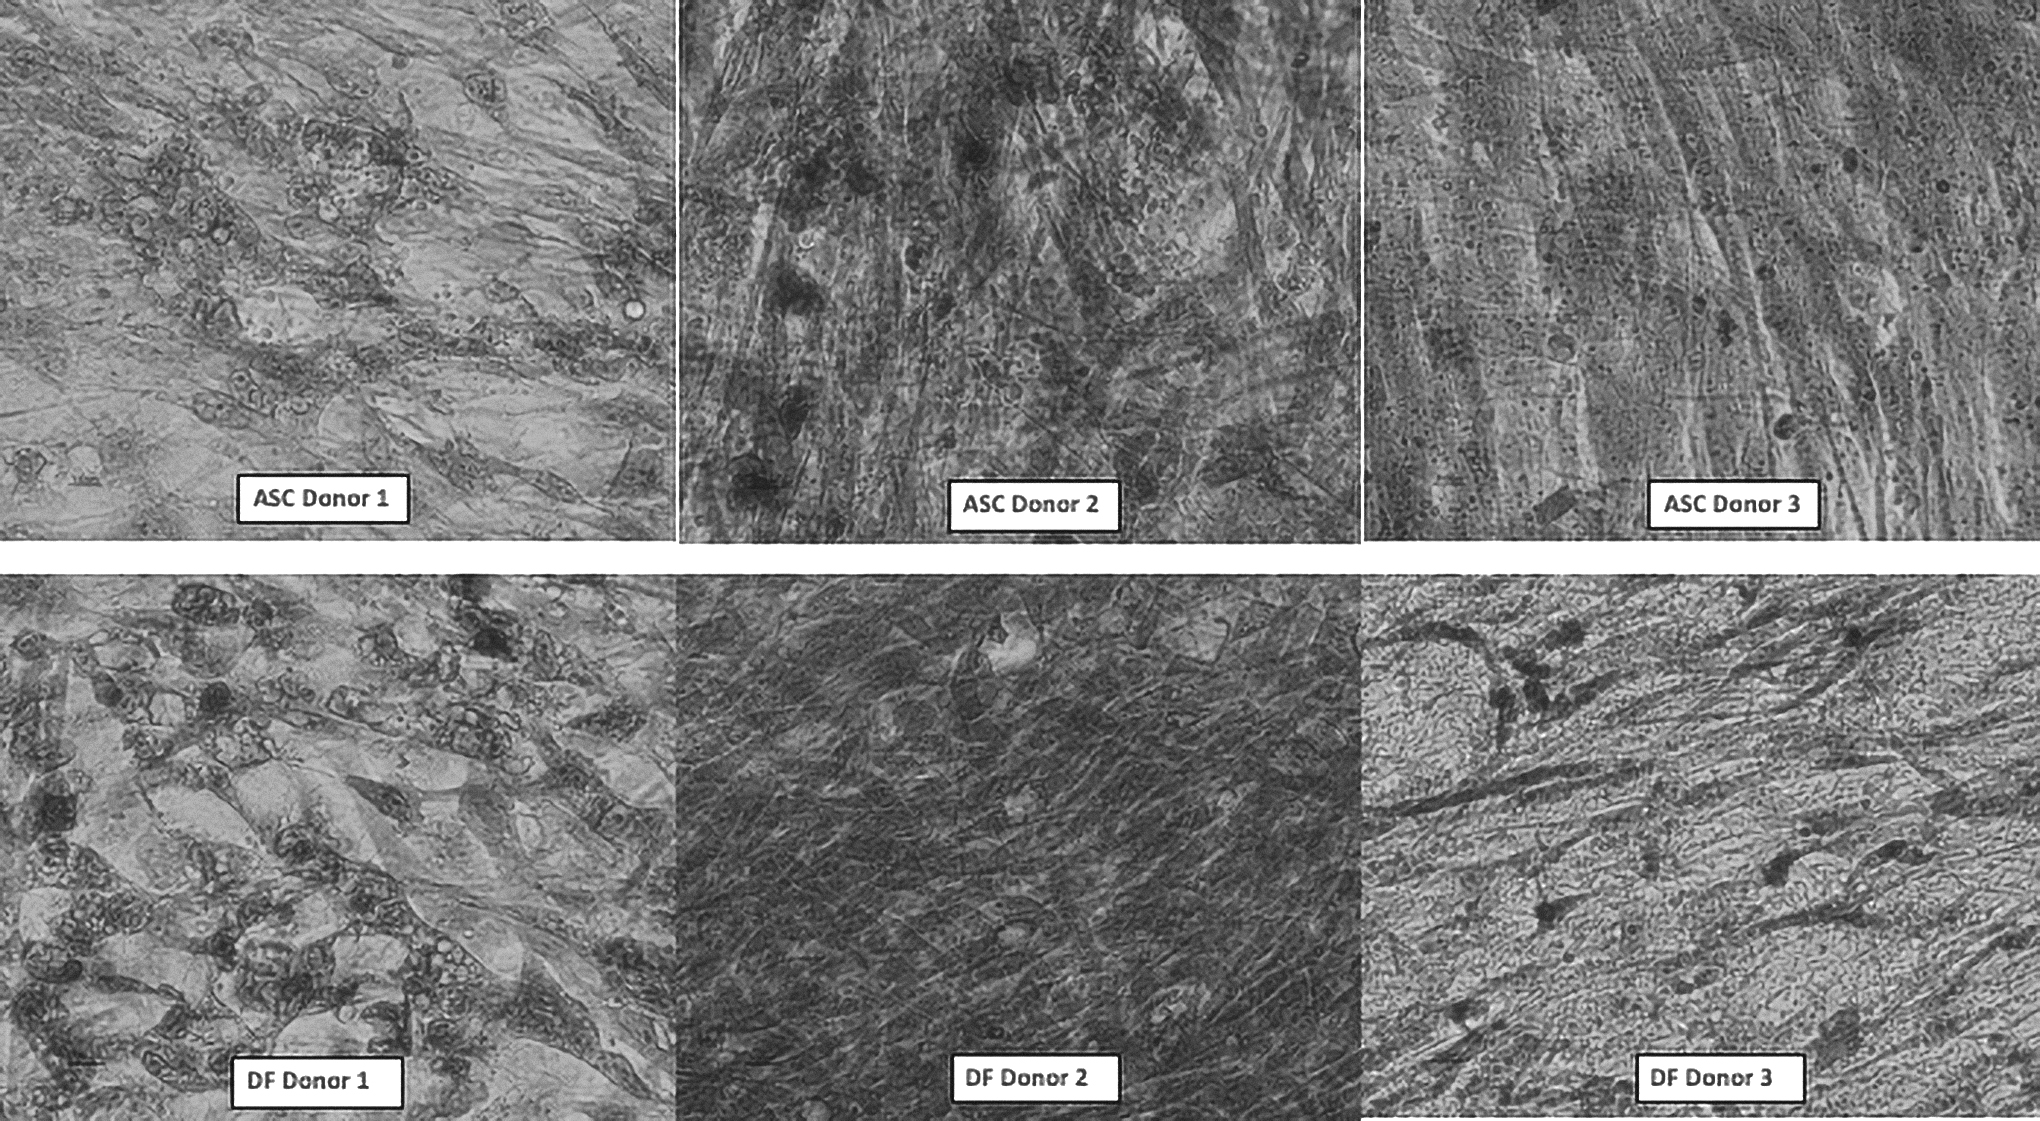
Both ASCs and DFs adhered to plastic dishes, displaying a phenotype consistent with a fibroblast-like morphology. Colony-forming unit fibroblast (CFU-F) assays were used to determine the frequency of adherent cells after cryopreservation [19]. The resulting average ASC CFU-F frequency was 7.1% ± 2.38%. No significant difference (P = 0.28) was found when compared with DF (13.45% ± 7.57%).
Differentiation
The Oil Red O staining showed varying degrees of positive ASC and DF differentiation into adipocytes, even though lipid droplets were smaller in the DF (Fig. 1). Differentiation into osteoblasts with mineralization was demonstrated by the Alizarin Red staining for both cell types (Fig. 2).

Adipogenic differentiation potential of ASC and DF. Adipogenic differentiation potential of ASC (Donors 1,2 and 3) and DF (Donors 1, 2 and 3) from 3 different donors stained with Oil Red O after 14 days of culture in Adipogenic Media. ASC, adipose-derived stromal/stem cell; DF, dermal fibroblast.
Osteogenic differentiation potential of ASC and DF. Osteogenic differentiation potential of ASC (Donors 1, 2, and 3) and DF (Donors 1, 2, and 3) from 3 different donors stained with Alizarin Red after 14 days of culture in osteogenic medium. Histochemical stained Alizarin Red photomicrograph; ASC, adipose-derived stromal/stem cell; DF, dermal fibroblast.
The relative induction of Oil Red O staining under adipogenic conditions relative to untreated controls for ASCs and DFs showed that the ASCs displayed a significant increase in adipogenesis (0.54 ± 0.05; P < 0.001) compared with DF (0.40 ± 0.04) based on spectrophotometric analysis of the eluted stains.
For osteogenesis, relative induction of Alizarin Red staining under osteogenic conditions relative to untreated controls for ASC and DF, similar results were observed for both ASC (0.55 ± 0.09) and DF (0.65 ± 0.08) with no significant difference (P = 0.48).
Cell surface markers
As cell surface markers are a defining tool for characterization of stromal/stem cell types we next sought to determine if there were observed differences in known cell surface proteins. Flow cytometry was performed for the MSC-associated markers, CD29 (β1 integrin), CD73 (ecto-5-nucleotidase), CD90 (Thy-1), and CD105 (endoglin). Additional markers selected detected the hematopoietic cell subpopulation (CD45), endothelial and stem cells (CD34), and the hyaluronate receptor (CD44); and the fluorochrome-labeled antibodies. IgG-PE and IgG-FITC served as controls. The ASC and DF displayed similar immunophenotypic profiles [17] (Table 2 and Fig. 3).
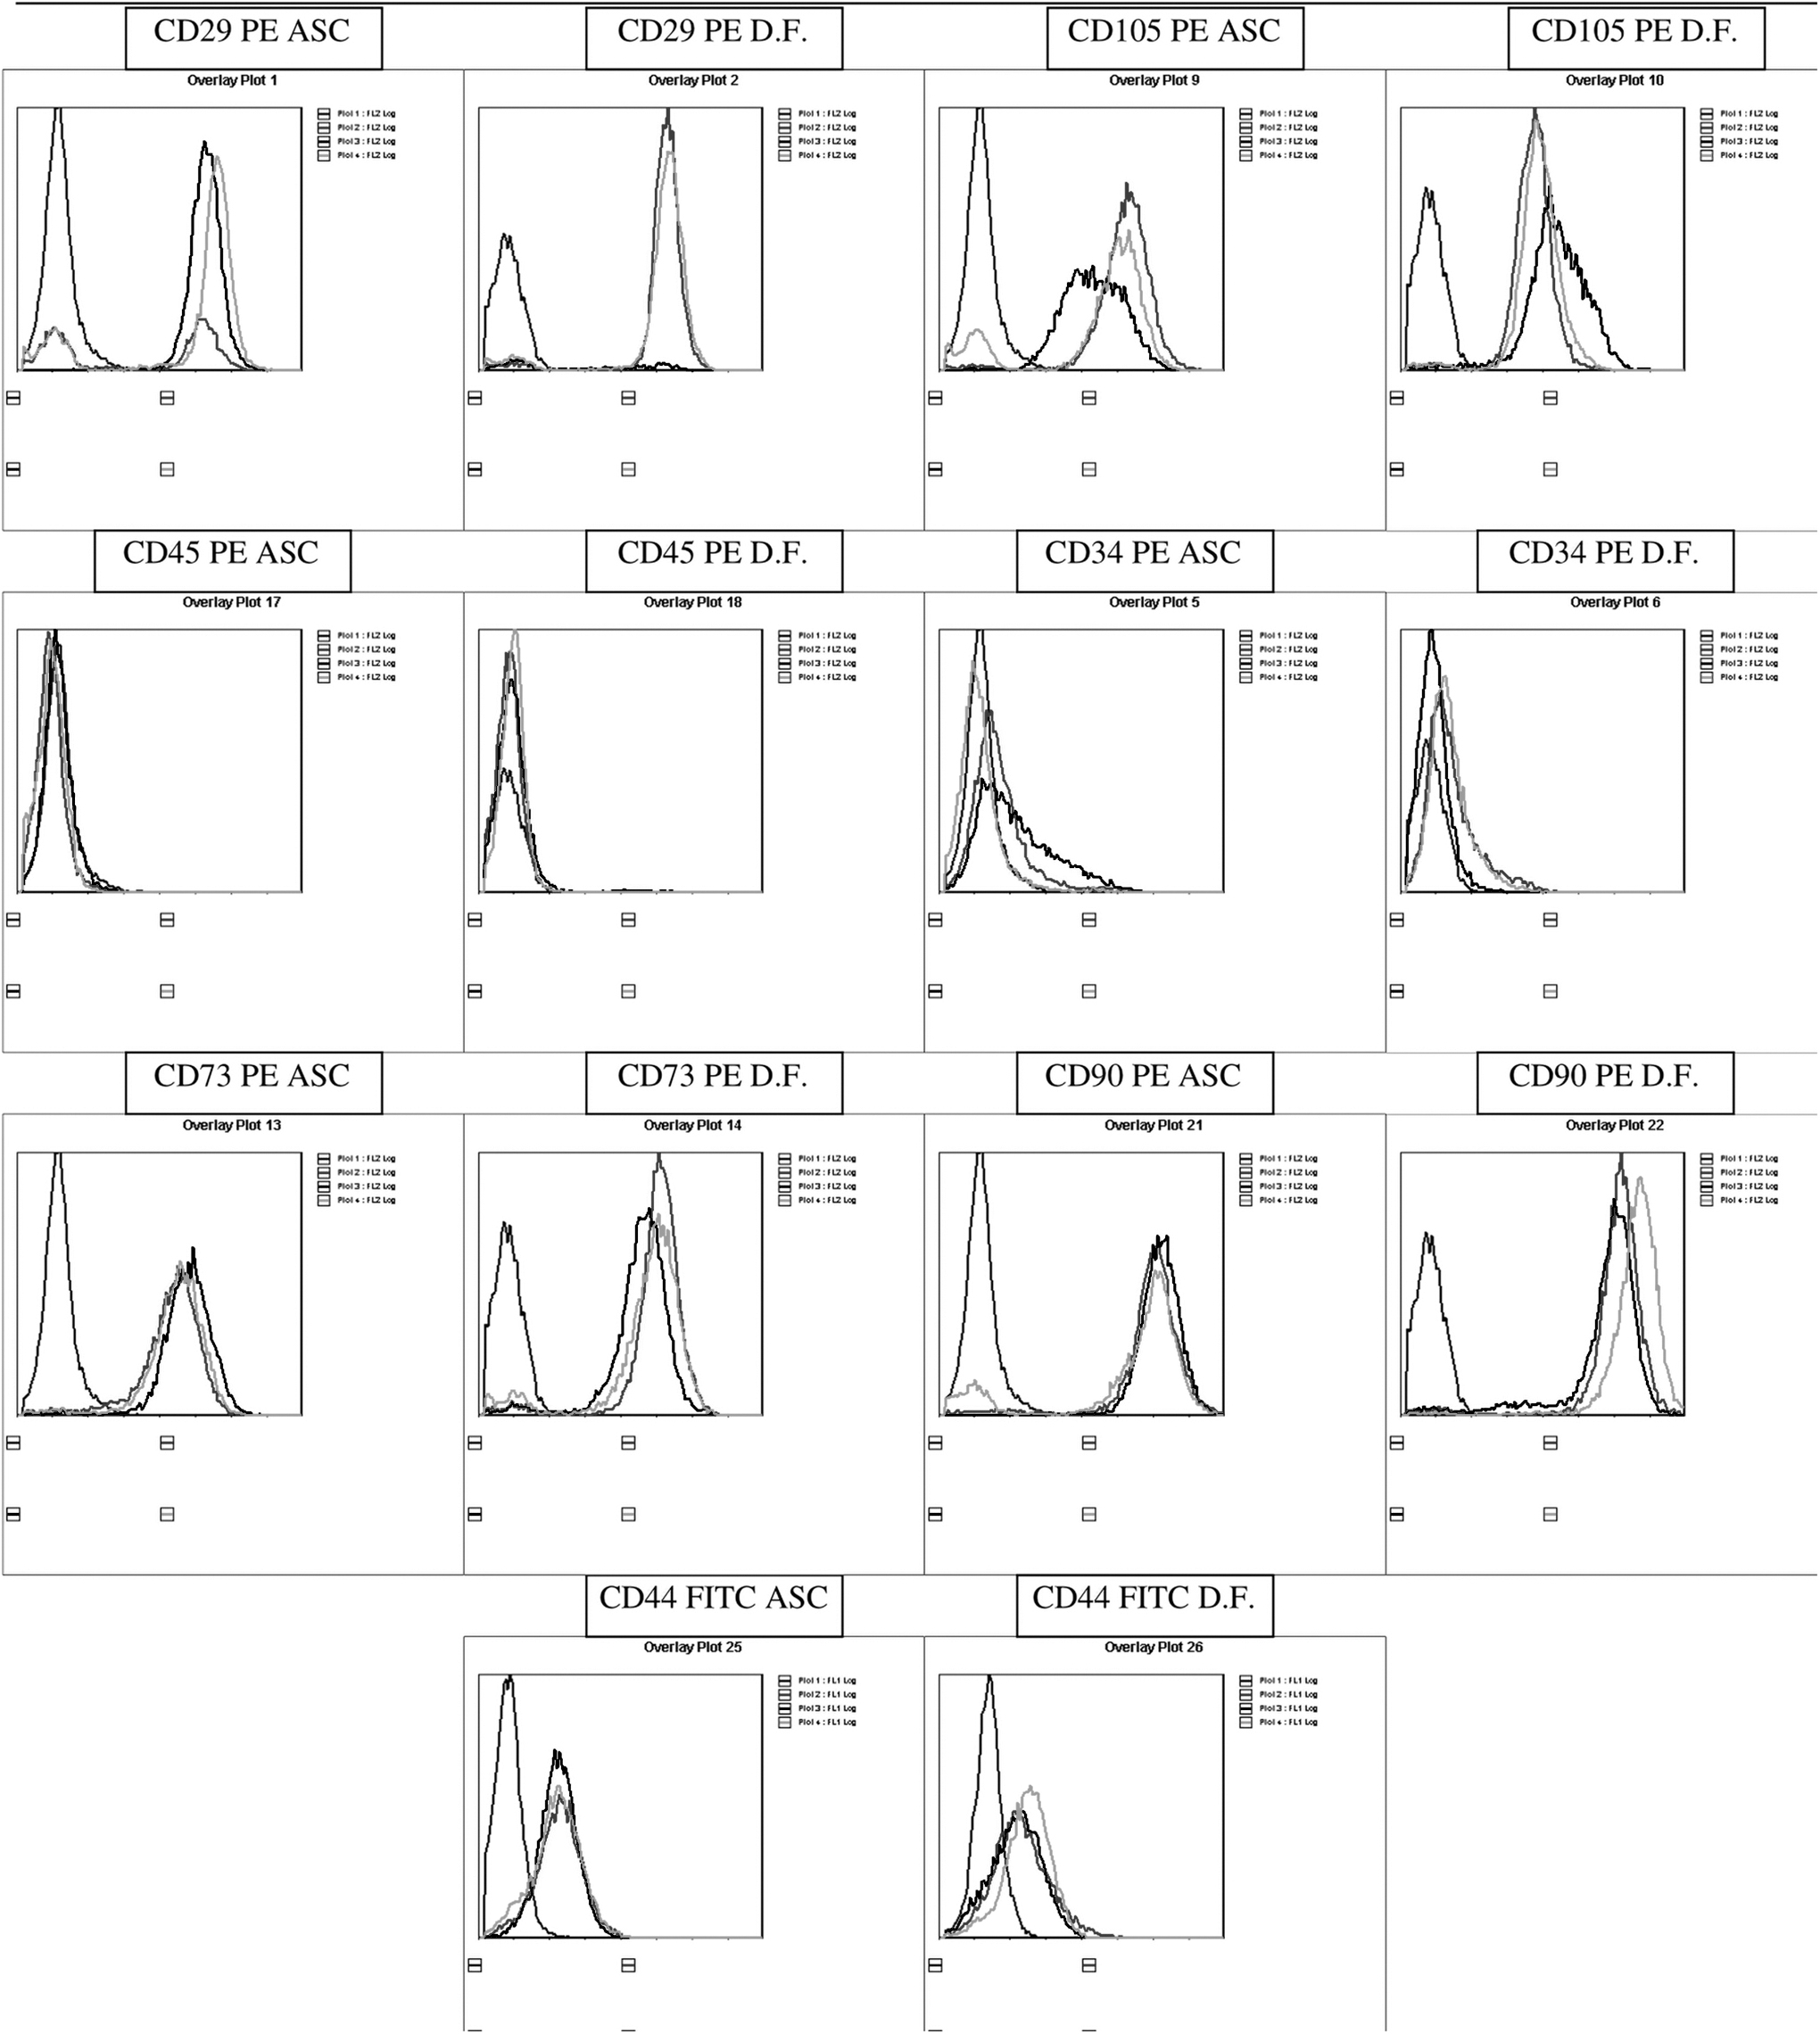
ASC and DF Flow Cytometry. Immunophenotypic characterization of the ASC and DF from same donors: separate histograms for three different donors (different curves in the graphic) with either ASC or DF analyses for each of the following surface antigens: CD29, 34, 44, 45, 73, 90, and 105. ASC, adipose-derived stromal/stem cell; DF, dermal fibroblast.
Comparative ASC and DF Surface Antigen Marker Expression by Flow Cytometry
The values reflect the mean ± SD normalized percentage gated surface-positive staining for a part of surface antigens, including hematopoietic, pericytic, and stromal markers. The P values were determined based on a paired, two-tailed t-test.
Immunophenotypic profile of surface antigens on the same donor.
ASC, adipose-derived stromal/stem cell; DF, dermal fibroblast; SD, standard deviation.
Gene expression
Since there was no observed phenotypic difference in differentiation potential between ASC and DF, we next sought to determine differences in gene expression for adipogenic and osteogenic genes. The ASC and DF showed increased gene expressions of CCAAT-enhancer-binding protein alpha (C/EBPα), peroxisome proliferator-activated receptor gamma (PPARγ), UCP1, Leptin (LEP), and Adiponectin (ADIPOQ) after adipogenic differentiation for 14 days when compared with the uninduced (stromal medium) controls. No differences between ASC and DF were found (Table 3).
Comparative ASC and DF Adipogenic and Osteogenic Gene Expression by RT-PCR
The values reflect the mean ± SD of relative adipogenic and osteogenic gene expression. CyCB was used as the housekeeping gene. The P values were determined based on a paired, two-tailed t-test.
Osteogenic induction increased the gene expressions of Alkaline Phosphatase liver/bone/kidney (ALPL), Runt-related transcription factor 2 (Runx2), Osteonectin (OCN), and Osteopontin (OPN) for both cell types compared with the uninduced controls. The expression of these genes was not significantly different between ASC and DF (Table 3).
Discussion
While MSCs are present in many different human tissues, they have been most extensively characterized in bone marrow (bone marrow stem-cell [BMSC]) and adipose tissue (ASC) (11). Until now, the best way to distinguish MSC from DF is based on the functional properties since DF less robustly retain self-renewal and multipotent differentiation capacity when compared with MSCs [20].
In literature, different articles have reported the investigation on the identity and functionality of these cells that appear indistinguishable by morphology, cell surface markers, differentiation potential, and immunologic properties. Several articles have extensively investigated and compared MSCs isolated from bone marrow, adipose tissue, and skin dermis with DFs. In particular, it was found that DFs contain specific percentages of heterogeneous progenitors with different levels of differentiation potential, and exhibiting specific phenotype, related to the expression of vimentin, nestin, CD271, and SSEA-4 [21,22]. The dermal phenotype with elevated mesenchymal differentiation capacity, identified as multipotent dermal MSC, and significantly more prone to undergo adipogenesis, as well as osteogenesis, chondrogenesis, and hepatogenesis under specific differentiating conditions, was characterized as nestin−, vimentin+, and CD271+. The dermal phenotype with limited adipogenesis and mesenchymal differentiation capacity was characterized as SSEA-4+ [21,22].
In the present study, we determine that human ASC and DF from the same donors shared MSC-like features, including adhesion to plastic, proliferation, immunophenotype by cell surface markers, cell differentiation potential, and gene expression profile. The different proliferation potential and mesenchymal differentiation ability of MSCs and DFs may be due to cell diversity depending on tissue source, donor age, BMI, or other demographic factors [23]. Analyzing the ASCs and DFs from the same donors to more precisely compare the characteristics of these cell types as demonstrated in this study confirms and extends these concepts.
According to the International Society for Cellular Therapy (ISCT) and the International Federation of Adipose Therapeutics and Science (IFATS), ASCs and MSCs are defined as cells isolated from a population of mononuclear cells, capable of adhering selectively to a plastic surface, and able to differentiate into adipocytes, chondrocytes, and osteoblasts. MSCs express CD105, CD73, CD29 and CD90 as surface antigens, but express CD34, CD45, CD14, CD11b, CD79, CD19, or HLA-DR on no more than 5% of the adherent cell population [16,23,24]. However, there is no single marker or characteristic that can distinguish ASC or MSC from other cell types [16]. Fibroblasts are mesenchymal cells essential in embryogenesis and in adult functions such as extracellular matrix syntheses and wound healing processes [23,25]. DF have been reported to share MSC properties, including cell surface markers [4,8].
Flow cytometric analyses of the cell surface marker expression of the culture-expanded ASC and DF showed very similar profiles, for both positive (CD29, CD73, CD90, and CD105) and negative markers (CD34, CD44, and CD45). This observation is consistent with previous studies reporting the immunophenotypes of MSCs and DF. Both cell types express similar cell surface markers (CD44, CD73, and CD105) while lacking hematopoietic-associated markers (CD14, CD34, and CD45) [4,6,7,21,25,26].
Both ASCs and DFs from same donors were able to undergo adipogenic and osteogenic differentiation, consistent with MSC characteristics [4,6,8,21,27]. Fibroblasts have been reported to have the capability to differentiate into adipogenic and osteogenic lineages demonstrating shared characteristics with MSC; however, most of the studies employed different donors for isolation of the DF and MSC, respectively [4,5,7,8,23,28 –31].
Numerous genes have been determined that correlate stem cells and their plasticity, differentiation potential, cycle regulation, signaling, maintenance, and specificity [5,32]. In the present study, ASC and DF showed similar gene expression profiles for adipogenic and osteogenic genes. Previous studies showed that fibroblasts from different areas of the body displayed distinct transcriptional patterns when analyzed by microarrays when compared with embryonic cells. This suggests that fibroblasts from different locations of the body should be considered different cell types; however, in contrast to the current work, neither cell differentiation nor immunophenotyping studies were performed [32]. In contrast, other articles reported similar gene-expression profiles between MSC and fibroblasts suggesting functional relationship between these cell types [5,30,31,33] although DF lacked the anti-inflammatory effects associated with MSC [6].
In conclusion, the present study demonstrates similarities between donor-matched ASC and DF with respect to morphology, surface marker expression, differentiation potential, and gene expression. While spectrophotometric analyses of histochemical staining suggested some level of enhanced adipogenesis, RT-PCR detection of adipogenic biomarker mRNAs did not substantiate this finding.
Footnotes
Acknowledgments
F.Z. received financial support from CAPES, Brazil (Process BEX 1524/15–1). The authors are thankful to Dr. James Wade and his staff that provided the adipose tissue and dermis under IRB Protocol for primary cell isolation.
Author Disclosure Statement
The authors, E.M., A.B., B.A.B., L.M.F., have no conflicts to disclose.
Funding Information
This work was funded in part by LaCell LLC. At the time of the study, Dr. L.C., Dr. J.M.G., and Dr. X.W. were employed at LaCell LLC, a for-profit biotech company cofounded and co-owned by Drs. J.M.G. and X.W.