
Abstract
Three-dimensional (3D) culture of human mesenchymal stem cells (MSCs) as spheroids enhances the production of important regulators of inflammation: prostaglandin E2 (PGE2), interleukin (IL)-6, and tumor necrosis factor–inducible gene 6 (TSG-6). The horse is a model species and suffers from musculoskeletal, ocular, and systemic inflammatory disease. It is unknown if 3D culture promotes enhanced production of immunomodulatory cytokines and regulators in equine MSCs and if there is variation between individual cell donors. We evaluated the feasibility, cell viability, and stem cell marker stability of 3D-cultured equine bone marrow–derived MSCs (eBMSCs) and determined the effect of inflammatory stimulation upon gene expression and secretion of key regulators of inflammation [PGE2, TSG-6, IL-10, IL-6, stromal cell–derived factor 1 (SDF-1)]. Variations in anti-inflammatory phenotype between six donors were investigated, with and without IL-1β stimulation, in either monolayer [two-dimensional (2D)] or 3D culture. Our results showed that eBMSCs self-aggregate in 3D culture while maintaining cell viability and markers of stemness CD90, CD44, CD104, and Oct4. In addition, 3D culture enhances the anti-inflammatory phenotype regardless of inflammatory stimulation by increasing PGE2, IL-6, TSG-6, SDF-1, and IL-10. Finally, anti-inflammatory phenotype was enhanced by IL-1β exposure but showed significant variation between cell lines in the degree of gene upregulation, and what genes were expressed. We conclude that 3D culture of eBMSCs as spheroids alters their anti-inflammatory phenotype, but this effect is influenced by cytokine exposure and cell donor.
Introduction
Mesenchymal stem cells (MSCs) exert anti-inflammatory and immunomodulatory effects in a paracrine manner [1 –3]. MSC production of prostaglandin E2 (PGE2), interleukin (IL)-10, and tumor necrosis factor–inducible gene 6 (TSG-6) induces macrophages to an anti-inflammatory phenotype, reduces neutrophil burden [3], and modulates the proliferation of T cells and antigen presentation of dendritic cells [1,2]. Pretreatment conditioning by exposure to exogenous cytokines [4 –10], hypoxia [11 –13], or through three-dimensional (3D) spheroid culture [14 –16] enhances the anti-inflammatory phenotype of MSCs.
Three-dimensional culture of human MSCs upregulates caspase-dependent IL-1 signaling during self-aggregation, causing enhanced production of the anti-inflammatory modulators PGE2, IL-6, and TSG-6 [14,15,17,18] and alterations in response to exogenous interferon-gamma (IFNγ) and tumor necrosis factor alpha (TNFα) [19] compared to monolayer [two-dimensional (2D)] culture. In horses, 3D culture of equine adipose-derived MSCs enhances PGE2 production and expression of IL-6 [20]. Despite these alterations in phenotype, human MSCs in 3D culture maintain stemness [21 –24] with enhanced differentiation ability [21,24,25] and expression of pluripotency markers Oct4 and GNL3 (nucleostemin) [22,25].
In vivo, 3D-cultured MSCs have a superior ability to mitigate systemic inflammation in murine models of peritonitis [14] and ischemic injury [26,27]. However, MSC response varies in response to the inflammatory milieu in the disease environment [28]. Both lipopolysaccharide (LPS) and IL-1β are optimal activators of modulatory cytokines for equine and human MSC [29,30]. LPS is a bacterial cell-wall TLR4 ligand, driving acute generalized inflammation, while IL-1β is activated by macrophages as a driver of continued inflammation in chronic disease [31]. Higher levels of IL-6, TSG-6, and PGE2 produced by MSC spheroids are correlated with greater conversion of macrophages from an M1 to an anti-inflammatory M2 phenotype [14 –18]. Thus, understanding alterations in secretory and expression profiles of MSC in 3D culture may indicate potential differences in biologic activity compared to 2D culture when MSCs are exposed to inflammatory stimuli.
MSCs respond to inflammatory stimuli with donor-dependent variation, both in the degree and type of anti-inflammatory response [3,32]. Park et al. [20] showed variation in the levels of PGE2, IL-6, and chemokines produced from different equine donors of adipose-derived MSCs cultured in 3D or 2D; however, the extent of variation was not analyzed. Expression of cytokines with direct anti-inflammatory effects also shows variation between and within donors. IL-10 expression varies in human MSCs, not only between donors but also within a single donor between clonal cell lines [32], and there are similar findings for interleukin 1 receptor antagonist (IL-1ra) [3]. IL-β has been identified to induce modulatory cytokine upregulation with more sensitivity to detect differences between donor cell lines than LPS or IFNγ [30,33]. Donor variation is an important consideration, especially in chronic inflammatory disease that is driven by IL-1β.
Equine bone marrow–derived MSCs (eBMSCs) have anti-inflammatory effects in vitro [34] by producing anti-inflammatory cytokines during inflammatory stimulation [35]. However, there is scope to enhance the ability of eBMSCs to further mitigate inflammation. For example, 2D-cultured eBMSCs did not significantly alter the progression or inflammatory mediator levels in an in vivo model of equine osteoarthritis [36]. 3D culture alters PGE2 production and expression of IL-6 of adipose derived equine MSCs; it is unknown if eBMSCs will have a similar response or show an enhanced ability to respond to inflammatory stimuli [20]. The overall objective of this study was to investigate the culture of eBMSCs as 3D spheroids and characterize their response to inflammatory stimuli. We hypothesized that eBMSCs would successfully form 3D spheroids while maintaining viability and stem cell marker stability and that secretion and expression of modulatory cytokines would be enhanced by 3D culture and dependent on the donor from which they were obtained.
Materials and Methods
Experimental design
Experiments were performed as described in Fig. 1 using passage 3 eBMSCs from seven donor horses (Table 1). Briefly, to validate 3D culture, eBMSC suspension (n = 3, Donors 2, 3, and 7, Table 1) was allowed to form 2D or 3D for 120 h. To compare generalized anti-inflammatory response, preformed 2D and 3D from the same three donors were stimulated with LPS. Subsequently, to evaluate donor variation in response to inflammatory mediators the donor pool was expanded (n = 6, Donors 1–6), and preformed 2D and 3D were stimulated with IL-1β. Equivalent starting numbers of eBMSCs in 2D and 3D cultures and four technical replicates per treatment group were used in all experiments.

Experimental workflow for investigation of 3D culture of eBMSCs. Three equine donors (2, 3, and 7) were used for two initial experiments to validate the ability of eBMSCs to form 3D culture (orange line, top) and response of 3D versus 2D culture to LPS stimulation (orange line, middle). The donor pool was expanded to six horses (donors 1–6) and IL-1β used to assess donor-dependent differences in response of 2D and 3D culture to inflammatory stimulation (blue line, bottom). 2D, two-dimensional; 3D, three-dimensional; eBMSCs, equine bone marrow–derived mesenchymal stem cells; IL, interleukin; LPS, lipopolysaccharide.
Equine Bone Marrow–Derived Mesenchymal Stem Cell Donor Information
IDH, Irish Draft Horse; F, female; M, male; MC, male castrate; TB, Thoroughbred.
Isolation and culture of eBMSCs
Bone marrow aspirate was harvested from the sternum of seven horses using protocols reviewed and approved by the Virginia Tech Institutional Animal Care and Use Committee. eBMSCs were isolated and assessed as previously described [37]. eBMSCs were expanded at 37°C, 5% CO2, and 90% humidity until 70%–80% confluency in eBMSC media: low-glucose GlutaMAX DMEM with 110 μg/mL sodium pyruvate (Gibco), 100 U/mL sodium penicillin, and 100 μg/mL streptomycin sulfate (Sigma), plus 10% MSC fetal bovine serum (FBS) (Gibco).
Media was supplemented every 48 h, and first passage eBMSCs were cryopreserved until use. eBMSCs were determined to undergo trilineage differentiation and to be Oct-4 and CD90 high and MHCII negative by flow cytometry and gene expression [38]. Bioperfecta™ 96-hanging drop plates were used to form 50,000-cell 3D spheroids and transferred to nonadherent 24-well plates at 72 h as per manufacturer instruction (3D Biomatrix, Inc., Ann Arbor, MI) in all experiments [39]. Randomized micrographs were obtained in triplicate using an AMG EVOSfl digital inverted microscope (Thermo Fisher Scientific, Waltham, MA).
Inflammatory stimulation of 2D and 3D eBMSCs
Two-dimensional eBMSCs were allowed to adhere in 24-well adherent tissue culture plates for 12 h and 3D allowed to form for 72 h before transfer into 24-well nonadherent culture plates. For 2D and 3D existing media was exchanged with low protein media composed of low-glucose GlutaMAX DMEM supplemented with 5% MSC qualified FBS. Equivalent numbers of 2D or 50,000 cells/3D culture were used to allow sufficient material for downstream assays. For LPS stimulation, eBMSCs (n = 3) as 100,000 2D cells/well or two 50,000 3D/well were exposed to either 0 or 100 ng/mL LPS (O55:B55 Sigma™) for 24 h. At 0, 6, 12, and 24 h, media was collected in 200 μL aliquots, and whole cells were treated with TRIzol reagent or harvested by trypsinization (2D) or centrifugation (3D). All samples were cryopreserved at −80°C until analysis. To determine donor dependent response to IL-1β, eBMSCs (n = 6) as 500,000 2D cells/well or ten 50,000 3D/well were exposed to either 0 or 10 ng/mL recombinant IL-1β (R&D Systems) [40 –42] for 24 h before cell and media harvest as described.
DNA quantification and assessment of viability
MSCs were collected and lysed, and DNA was quantified using NanoDrop 2000c spectrophotometry and validated with Quant-iT™ dsDNA Broad-Range Assay Kit (Invitrogen™). Live/Dead assay was performed as per manufacturer's instructions (Invitrogen) on 2D eBMSCs and 3D spheroids dissociated with Liberase TL (Roche) [43]. Cell counts were obtained with a hemocytometer viewed using AMG EVOS fl digital inverted microscope. Images were captured using EVOS integrated imaging software from 10 primary hemocytometer squares. For viability assessment in situ of adherent 2D or intact 3D, trypsinization and dissociation steps were omitted.
RNA isolation and gene expression analysis
Three-dimensional and 2D cells were lysed with TRIzol reagent (TRIzol Reagent; Thermo Fisher Scientific). RNA was isolated and purified using a commercially available column-based protocol (RNeasy; Qiagen, Hilden, Germany) that included an on-column DNase treatment. First strand complimentary DNA (cDNA) was synthesized by use of oligo(dT) priming and a commercial reverse transcriptase kit; nonreverse transcriptase controls were produced (High Capacity cDNA Archive Kit; Applied Biosystems, Foster City, CA). Complimentary DNA was amplified by fluorescent quantitative PCR (qPCR) (Absolute Quantitative PCR: ABI PRISM 7300 Sequence Detection System; Applied Biosystems) using TaqMan primers and MGB probes (Thermo Fisher Scientific, Waltham, MA) (Table 2).
Applied Biosystems Predesigned Primer-Probe Sets
IFNγ, interferon-gamma; IL, interleukin; TNFα, tumor necrosis factor alpha; TSG-6, tumor necrosis factor–inducible gene 6.
Sequences for custom primer-probe sets were designed to span exon–exon boundaries using available sequence data on GenBank (Primer Express Software Version 3.0; Applied Biosystems) and were cross-referenced against NIH Basic Local Alignment Search Tool (Table 3). Relative gene expression was calculated using the Comparative CT method (2−ΔΔCT). GAPDH RNA expression was the endogenous control, after verifying gene expression stability in 2D monolayer and 3D eBMSC samples compared to other potential endogenous controls (B2M, RPL13A, RPL32, HPRT1) using GeNorm algorithm normalization.
Custom Primer-Probe Sequences
Enzyme-linked immunosorbent assay of modulatory mediator secretion
Concentrations of TNFα, IL-6, IL-10, PGE2, IFNγ, and stromal cell–derived factor 1 (SDF-1) were assessed for cultures with or without LPS stimulation using commercially available kits (TNFα, Endogen, Inc.; PGE2, Cayman Chemical, Inc.) or primary reagents validated for use in the horse (IL-10, SIGMA™; IL-6, USCN Life Sci.; R and D Systems Duo-Set™, IFNγ; R and D Systems Duo-Set™; SDF-1, R and D Systems) as per manufacturer recommendations. ELISA data were normalized to DNA quantity to enable comparison of ng/ngDNA between 2D and 3D.
Statistical analyses
Data were tested for normality using the Shapiro–Wilk test. Paired t-tests were used to compare viability data and DNA quantity. Change in DNA quantity over 120 h was analyzed by Bivariate Regression Analysis. Relative gene expression data were log transformed and compared using paired t-tests for stem cell marker expression. Three-way ANOVA was used for LPS stimulation ELISA and gene expression data; two-way ANOVA was used for IL-1β stimulation gene expression data. If no significant interactions were encountered, post-hoc Tukey HSD pairwise comparisons were performed on significant main effects. Simple effects tests were used if significant interactions were encountered. Data were recorded in Microsoft Excel, and statistical analyses were performed with JMP® Pro 13.0.0 (SAS Institute, Inc.). A priori significance was set at P ≤ 0.05. Data are presented as mean ± S.E. Abbreviations for LPS stimulation treatment groups are: 2D, 2D control; 2D-LPS, 2D culture with LPS; 3D, 3D control; 3D-LPS, 3D culture with LPS.
Results
eBMSCs readily form spheroids in 3D culture with maintained viability and stem cell markers
3D-cultured eBMSCs aggregated into a spherical shape by 72 h (Fig. 2A). Culture type did not affect cell viability (P = 0.27), with ≥99% cell viability at 120 h (Fig. 2C). DNA quantity in 2D culture increased over time but decreased in 3D culture (P < 0.001). From 24 h, DNA was higher in 2D than 3D culture, but at 120 h this was not significant (Fig. 2B). At 120 h 3D MSCs had higher gene expression of the stem cell marker GNL3 than 2D culture (Fig. 2D), with a trend for increased CD90 gene expression (P = 0.07). There were no differences in CD44, CD105, or Oct4 expression between 2D and 3D culture.
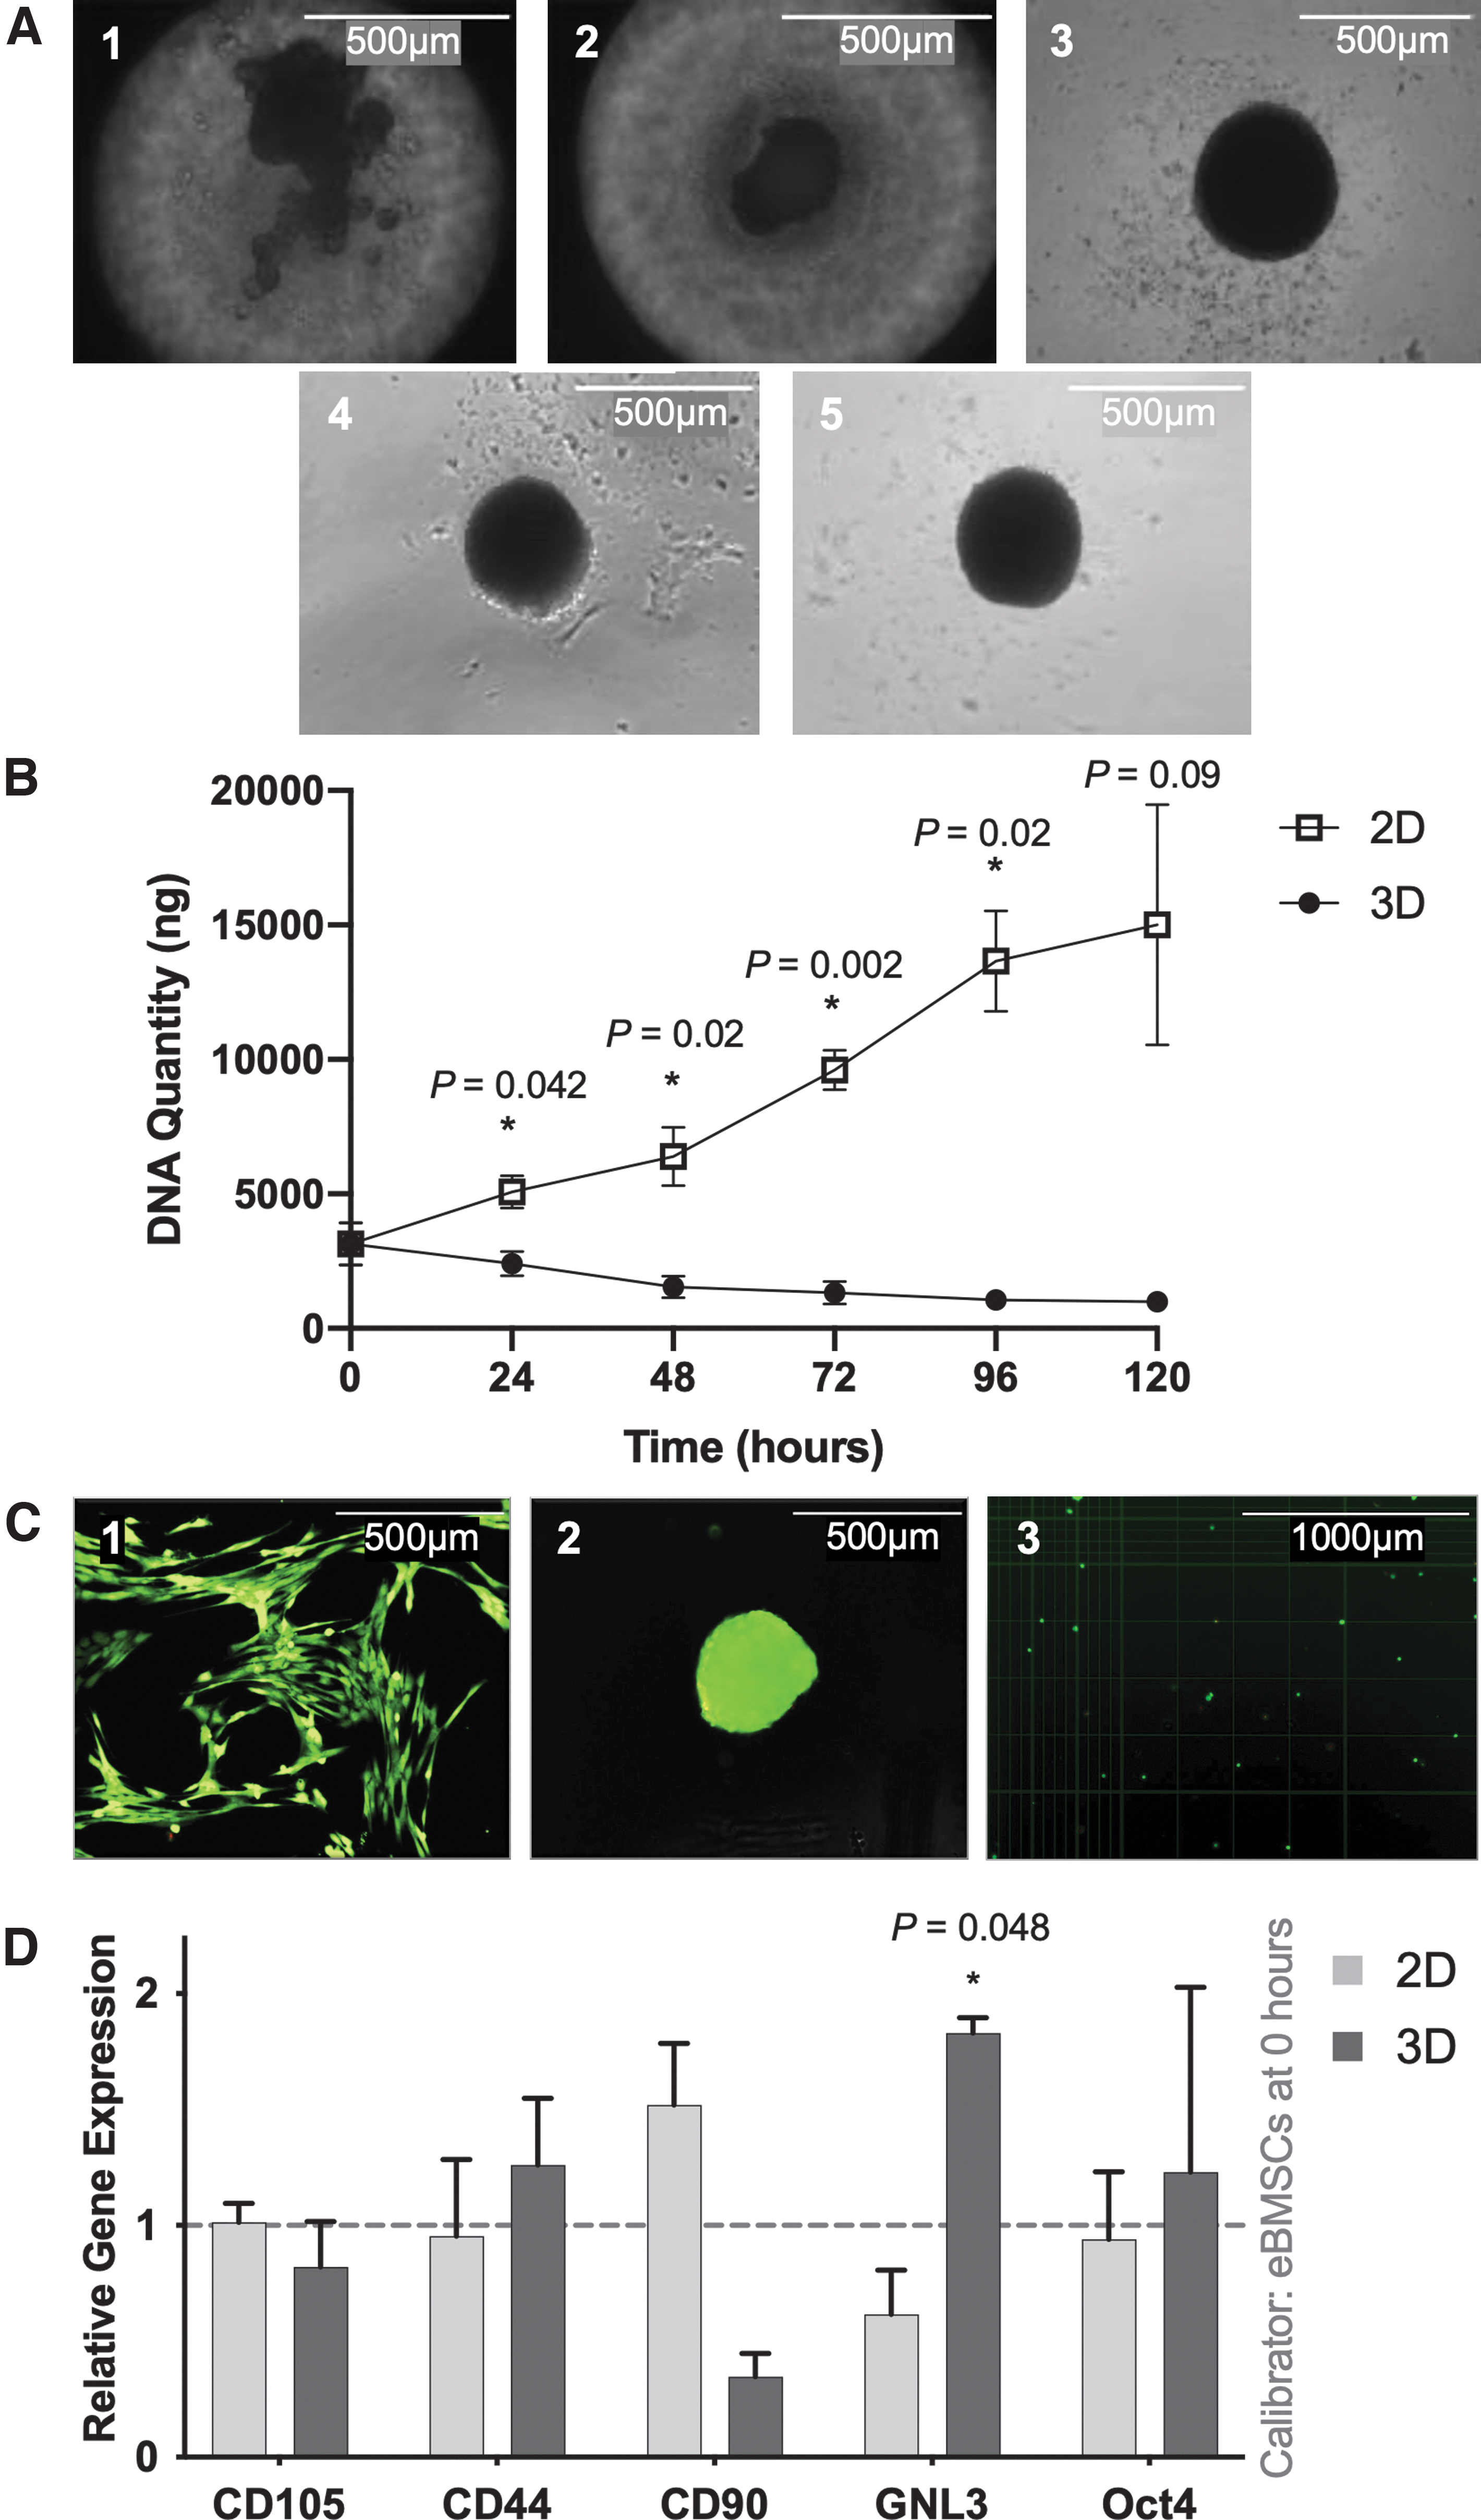
Micrographs of 3D aggregation and cell viability (n = 3).
3D culture enhances modulatory cytokine profile regardless of LPS exposure
LPS stimulation for 24 h did not significantly (P = 0.42) change cell viability in 2D and 3D cultures, with maintenance of 97%–98% viability. 3D culture significantly increased secretion and expression of all modulatory cytokines compared to 2D cultures (P < 0.05 Fig. 3). Both 3D culture and LPS stimulation significantly increased IL-6 expression (P < 0.001) and production (P < 0.005), PGE2 production (P < 0.05), microsomal prostaglandin E Synthase 1 (PGES1) expression (P < 0.001), and TSG-6 expression (P < 0.02). LPS was not a significant effect on increases in SDF-1 gene expression and production, which were both dependent on 3D culture alone (P < 0.01). Interaction between LPS stimulation and 3D culture was observed for PGES1 (P < 0.05).
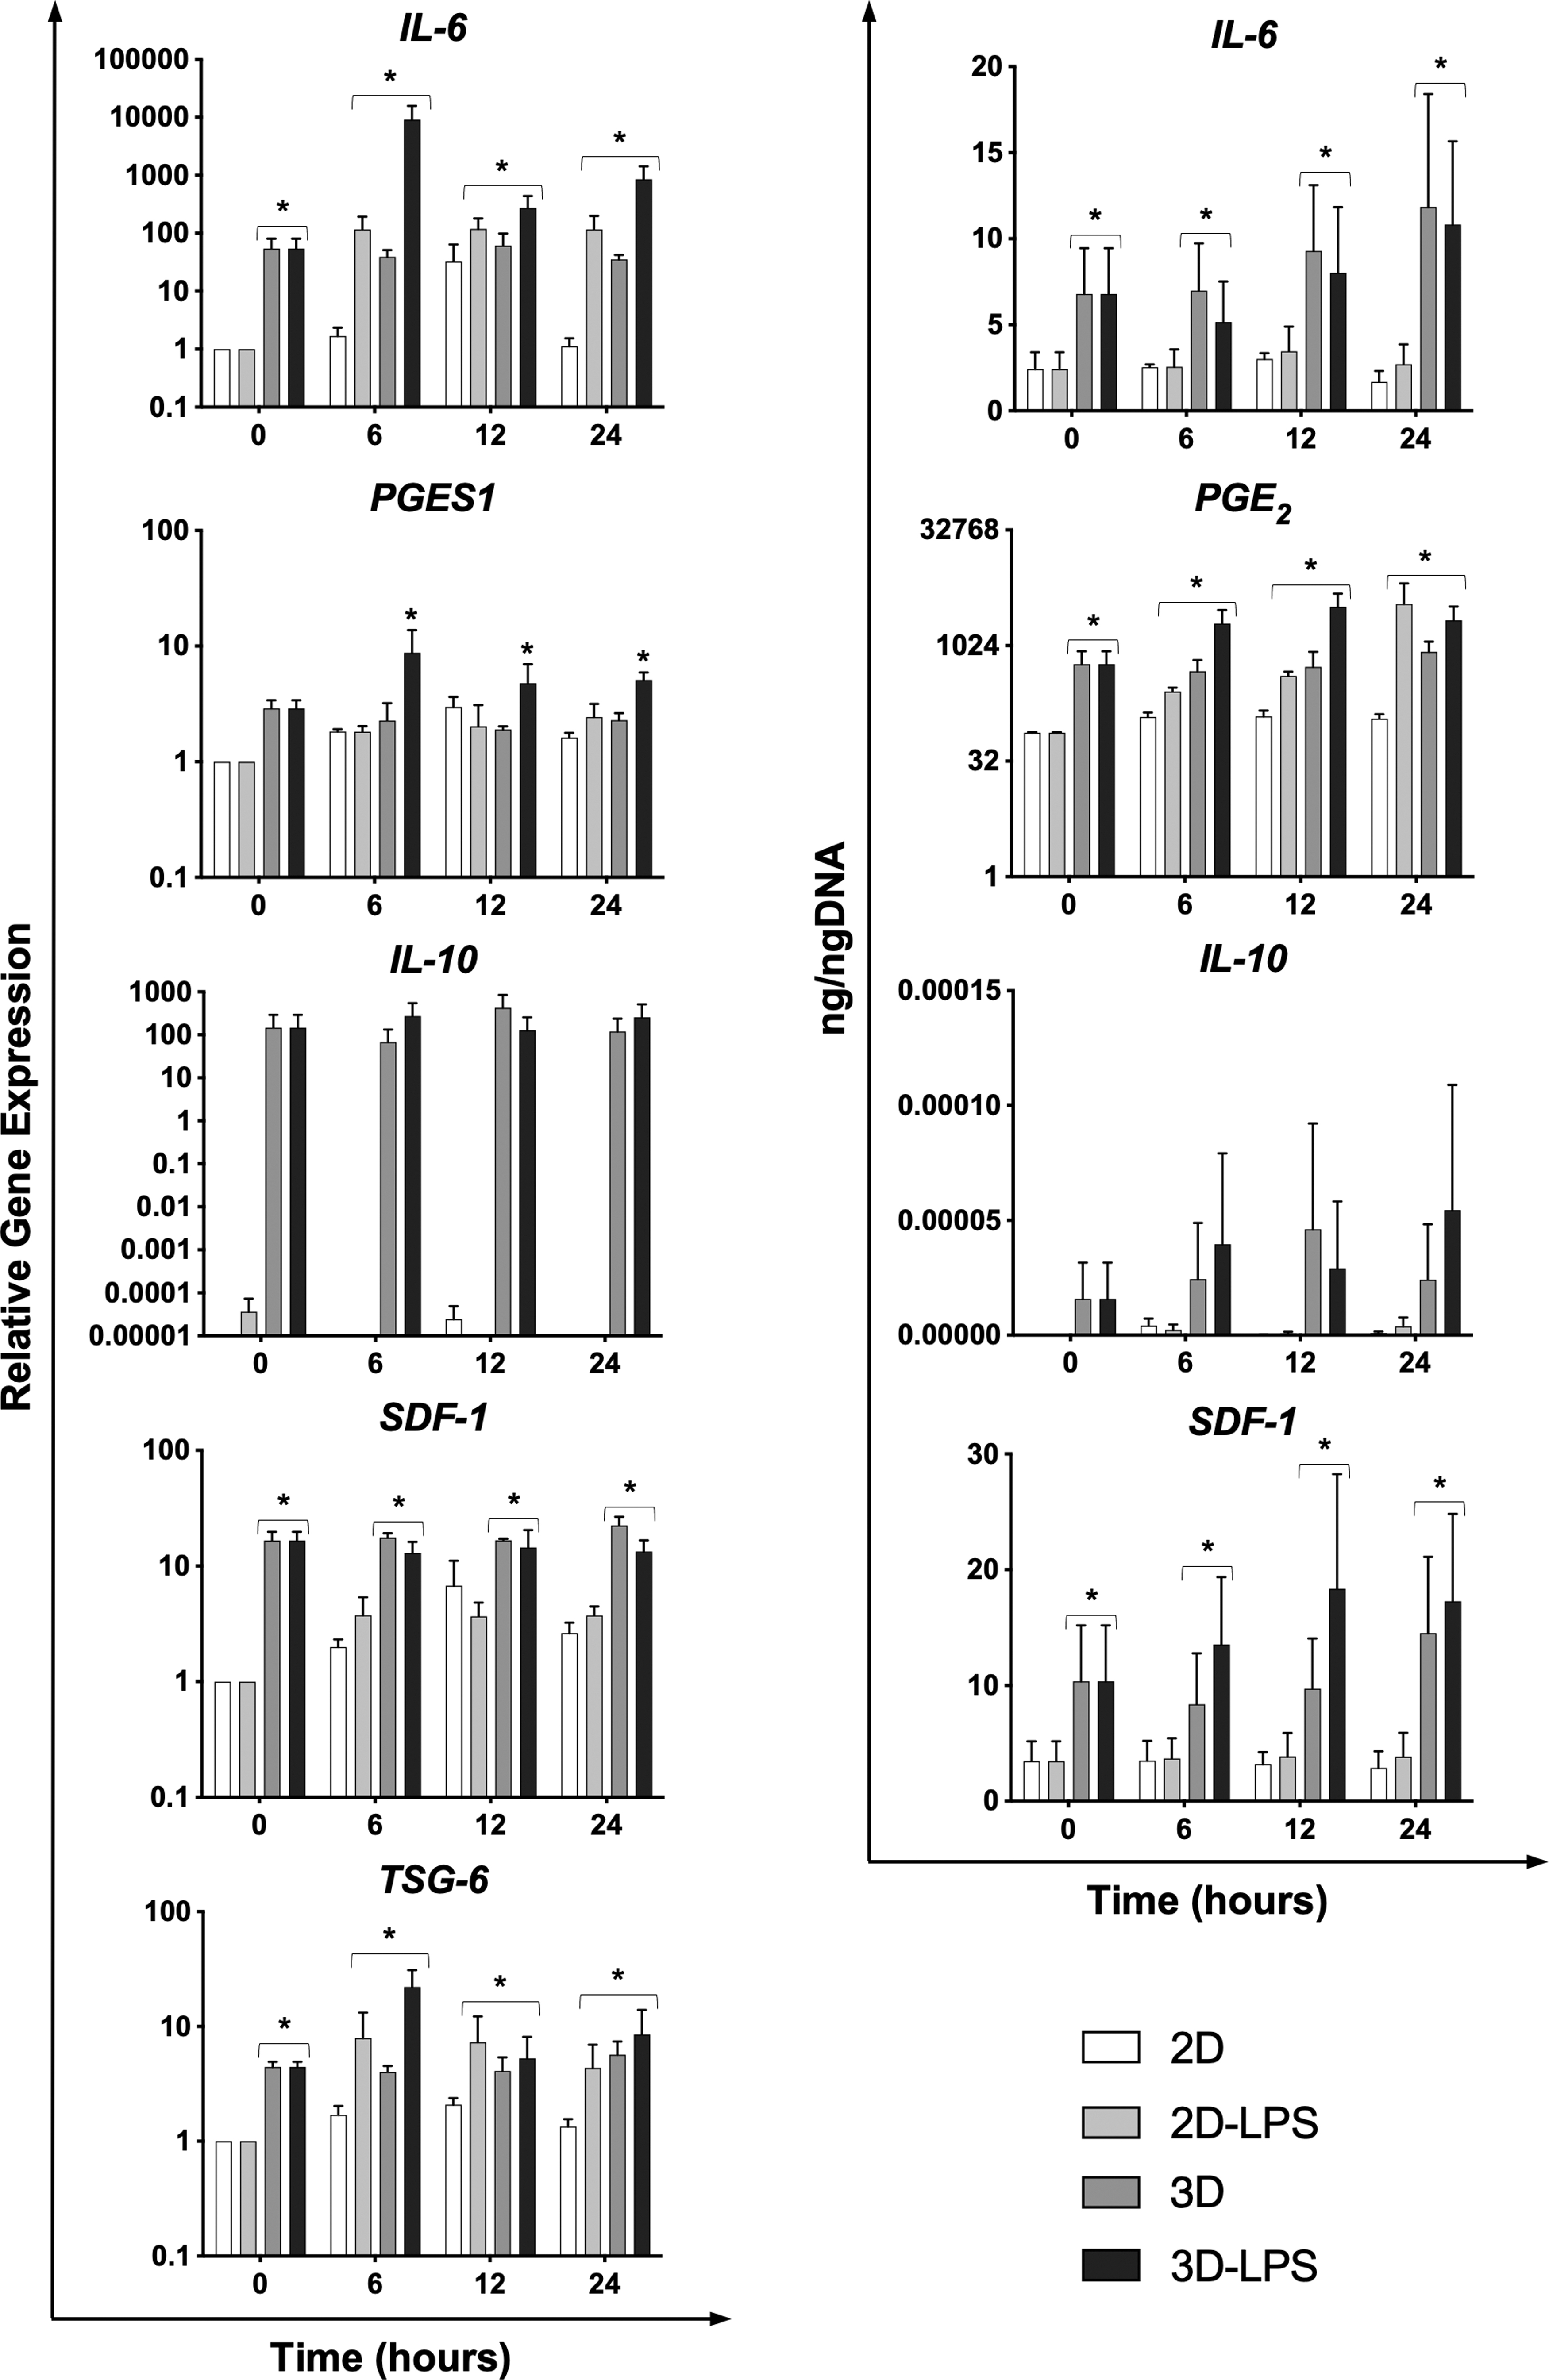
Relative gene expression measured by qPCR using the Comparative CT method (2−ΔΔCT) calibrated to 2D control at 0 h (left) and secretion (right) of anti-inflammatory mediators measured by ELISA for 2D control (white), 2D with LPS (light gray), 3D control (dark gray), and 3D with LPS (black) (n = 3). Data are reported as mean ± S.E. Significant differences compared to 2D control denoted by asterisks (*, P ≤ 0.05).
Pairwise comparisons for IL-6 showed that gene expression was upregulated in 3D and 3D-LPS compared to 2D control (P < 0.02) with similar results for protein production (P < 0.03). 3D-LPS had significant upregulation compared to 2D-LPS or 3D (2D-LPS P < 0.001, 3D P < 0.02). Similarly, pairwise comparisons for PGE2 showed significant increases for 3D (P < 0.05) and 3D-LPS (P < 0.001) compared to 2D control, but not 2D-LPS. PGES1 expression was significantly increased for 3D-LPS compared to other groups (P < 0.002). For TSG-6 expression, pairwise comparisons showed 3D, and 3D-LPS had significant upregulation of TSG-6 compared to 2D culture groups (P < 0.01). Although it appeared that 3D cultures from one cell line altered protein production and had higher gene expression of IL-10, due to variation between cell lines, there were no significant differences detected between 2D and 3D culture for IL-10 gene expression or protein production. No measurable levels of IFNγ or TNFα were produced or expressed by any of the cell lines or conditions tested.
3D culture enhances modulatory cytokine profile in synergy with IL-1β exposure
Changes in gene expression of each of six donor cell lines were induced by either 3D culture or IL-1β exposure compared to the 2D control, and the presence of both conditions was synergistic (Fig. 4). IL-1β and 3D culture upregulated IL-6 compared to 2D control (P < 0.001). Although IL-1β upregulated TSG-6 and PGES1 expression (P < 0.001), TSG-6 was downregulated in some cell lines by 3D culture alone (P < 0.001). In contrast, IL-1β downregulated prostaglandin E synthase 2 (PTGES2) (P < 0.001) but 3D culture alone had a mild upregulatory effect (P < 0.05). There was variable IL-10 expression depending on donor, culture type, and IL-1β stimulation, with some donor eBMSCs only expressing IL-10 under specific conditions (Fig. 4 and Table 4).
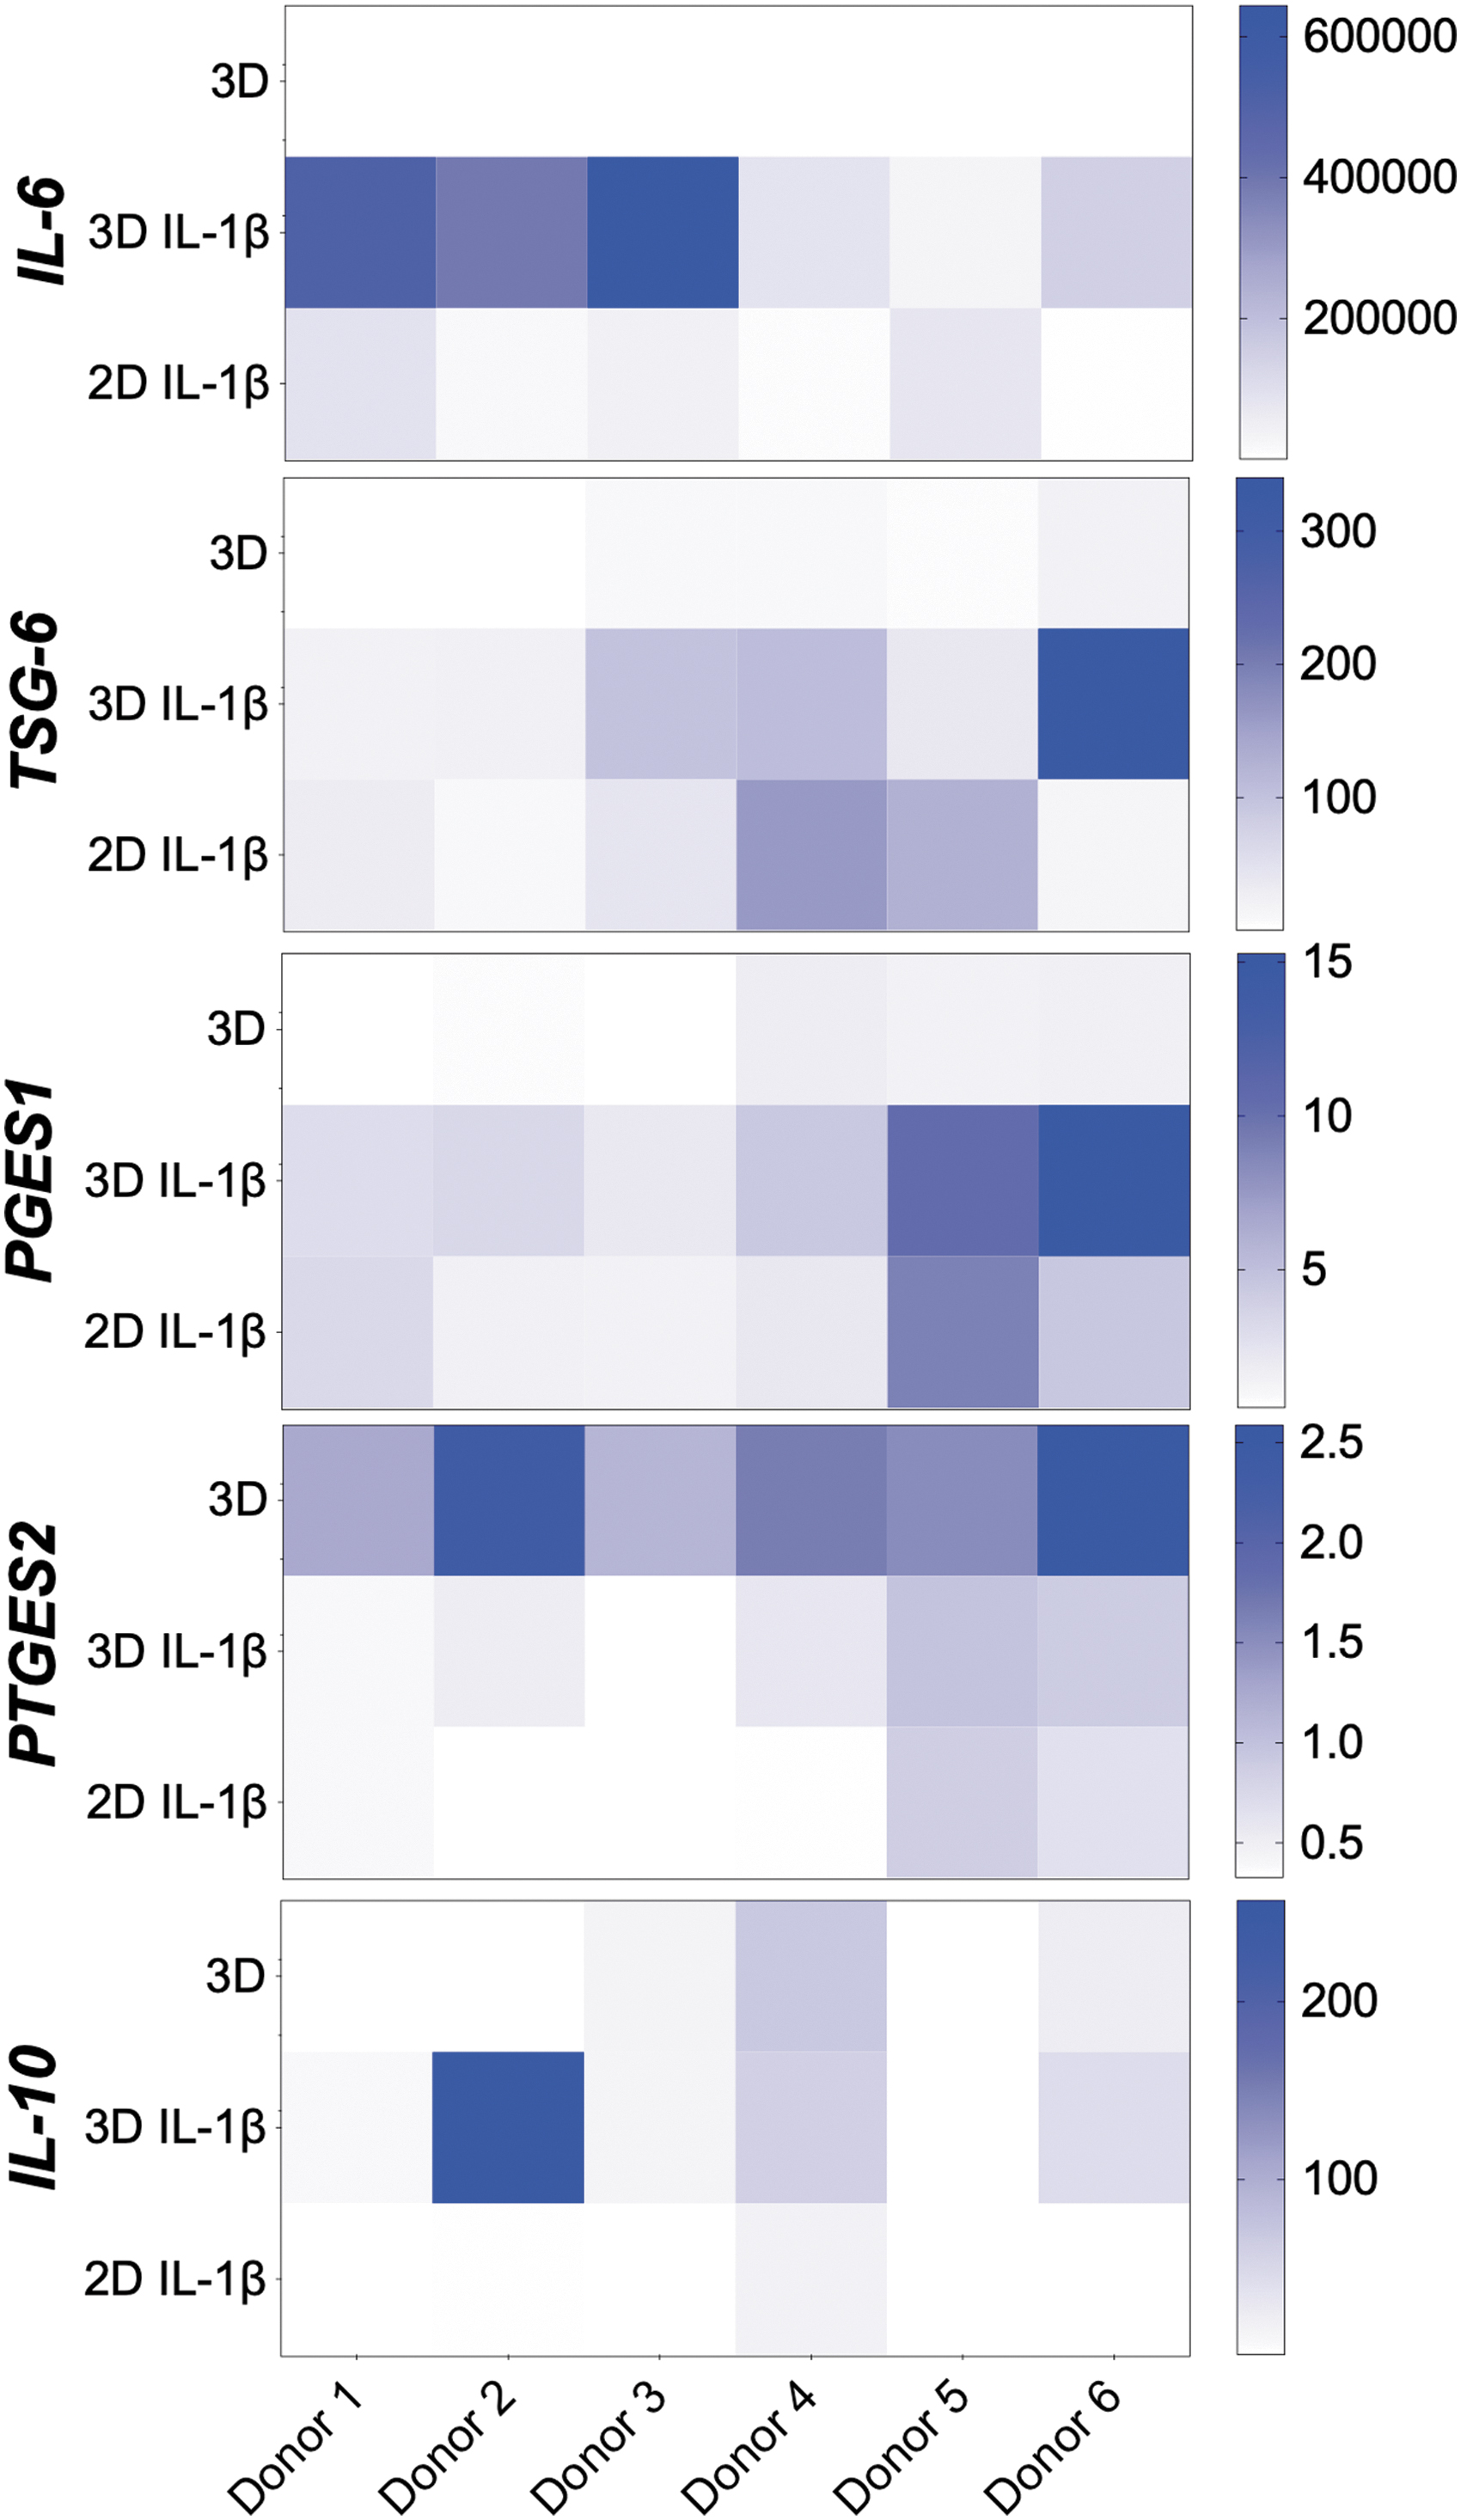
Color intensity representation of relative gene expression calibrated to 2D control for donors within treatment group (n = 6). The relative gene expression of each donor is compared across treatment group for each mediator target. High levels of relative gene expression for the given target are indicated by darker color. 3D, 3D control; 3D-IL-1β, 3D culture with IL-1β; 2D-IL-1β, 2D culture with IL-1β.
Pairwise Comparisons Between Individual Donors for Gene Expression of Cytokine Targets
Treatment groups are in bold for easier reference.
Numbers denote the donors with significantly different gene expression at P ≤ 0.05 within the same treatment group.
3D, 3D control; 3D-IL1, 3D culture with IL-1β; 2D-IL1, 2D culture with IL-1β; PGES1, microsomal prostaglandin E Synthase 1; PTGES2, prostaglandin E synthase 2.
eBMSC response to IL-1β and 3D culture is donor dependent
Significant individual variation was seen between donor eBMSCs under each type of condition for all genes (Fig. 4 and Table 4). Within 3D culture, donor (P < 0.001) and IL-1β treatment (P < 0.001) significantly influenced IL-6, TSG-6, PGES1, PTGES2, and IL-10 upregulation. 3D culture from some donors responded to a different extent to IL-β stimulation than others with significant interaction between them for TSG-6 (P < 0.05), PGES1 (P < 0.002), PTGES2 (P < 0.02), and IL-10 (P < 0.001). When IL-1β stimulated 2D and 3D cultures were compared, there was significant influence of both donor (P < 0.001) and culture method for IL-6, PGES1, IL-10 (P < 0.001), TSG-6 (P < 0.01), and PTGES2 (P < 0.005), with a significant interaction for IL-6, TSG-6, IL-10 (P < 0.001), and PGES1 (P < 0.005) suggesting that the degree of upregulation with 3D culture is donor dependent for gene expression of these modulatory cytokines. Significant differences between individual donors for gene expression are shown in Table 4.
Discussion
As a therapeutic tool, 3D culture of eBMSCs can be used to promote the expression and secretion of the modulatory cytokines IL-6, PGE2, SDF-1, and TSG-6 without an increase in the pro-inflammatory cytokines TNFα and IFNγ. This alteration occurs without the need for exogenous inflammatory stimulation but is synergistically enhanced by the addition of inflammatory stimulants like LPS and IL-1β. However, the response of eBMSCs to both 3D culture and inflammatory stimulation is dependent on the cell donor, which should be a consideration for allogeneic cell use or determining why unexpected therapeutic results may occur in some patients treated with autologous MSC. This study also demonstrated that equine eBMSCs successfully form 3D spheroids while maintaining cell viability and markers of stemness. eBMSC 3D culture may be more suitable as an end-stage preparation rather than for cell propagation. In 3D culture as spheroids, eBMSCs seem to halt cell proliferation, as DNA quantity does not increase over time.
Reduced spheroid cell division in our study is consistent with human MSC studies that have shown minimal or declining cell yield in 3D culture [16,24]. This may be a consequence of altered expression of genes that regulate the cell cycle such as GNL3, which was seen in our study. Overexpression of GNL3 (nucleostemin) causes G1 cell cycle arrest due to its role in the G1/S transition [44]. DNA quantity, rather than a metabolic assay for proliferation, was used as a measure of cell biomass because alterations in metabolism between 2D and 3D culture could be due to differences in genes that determine metabolic rate [24]. We performed stem cell marker analysis using qPCR as opposed to flow cytometry because enzymatic dissociation of 3D spheroids for flow cytometry could alter cell surface markers, and qPCR allowed assessment of the transcription factor Oct4 [43]. qPCR demonstrated a suitable alternative to flow cytometry for equine MSC when cross-reactive antibodies were not available [45].
This study is the first to investigate the ability of 3D culture to activate eBMSCs into an anti-inflammatory state. MSCs produce enhanced levels of PGE2, TSG-6, and occasionally IL-1ra or IL-10 when they are exposed to inflammatory conditions such as the addition of activated peripheral blood mononuclear cells, LPS, or inflammatory cytokines such as TNFα, IL-1β, or IL-17 [28,46]. Alterations in the MSC cytokine profile cause them to induce an anti-inflammatory M2 phenotype in macrophages and modulate T cells, dendritic cells, and neutrophils [15,28,47,48].
This study demonstrated that 3D culture of eBMSCs enhanced IL-6, SDF-1, PGE2, and TSG-6 without inflammatory stimulation. Similarly, Ylöstalo et al. [15] demonstrated increased PGE2 and TSG-6 from 3D human MSCs that decreased macrophage proliferation and induced IL-10 and IL-1ra production. A coculture model with leukocytes to assess the anti-inflammatory effects of 3D culture was not performed in this study. However, the profile of increased PGE2, TSG-6, and IL-6 alone has been used to investigate the anti-inflammatory phenotype of 3D spheroids without subsequent immunomodulatory testing in coculture [15 –18].
Three-dimensional culture impacted gene expression of all genes, but the degree or direction of change was dependent on the individual eBMSC donor. Human 3D BMSC cultures that produce high levels of IL-6, TSG-6, and PGE2 have enhanced anti-inflammatory effects on macrophages compared to cultures that produce lower levels [14 –18]. IL-10 is directly anti-inflammatory and anti-catabolic by blocking TNFα [49,50] and can elicit anti-inflammatory effects on immune cells [47]. IL-10 expression by 2D culture in this study varied by cell donor, which is consistent with findings in human BMSCs that show variation in IL-10 not only between cell donors but also within a single donor between clonal cell lines [32]. 3D culture enhanced IL-10 expression from some cell lines compared to 2D, which was enhanced further by the addition of IL-1β. 3D culture may be a viable method to enhance IL-10 production by specific eBMSC donor cell lines.
While a significant benefit of spheroid culture is the production of immunomodulatory cytokines without exogenous cytokine stimulation, eBMSCs in 3D spheroid culture further responded to pro-inflammatory environments with increased vigor compared to control, resulting in high levels of immunomodulatory regulators. Previous studies have shown that 2D cultured equine MSC did not improve clinical signs of osteoarthritis and synovitis [36,51]. The low levels of inflammatory cytokines in these disease models may not have adequately stimulated the anti-inflammatory profile of 2D-cultured eBMSCs. Thus, 3D eBMSCs as spheroids may have increased therapeutic efficacy when being used to treat diseases with low levels of inflammatory cytokines, due to the synergistic effect of 3D culture plus inflammatory stimulation once in situ.
Conclusion
We have demonstrated that 3D culture is a valid culture technique for eBMSCs, lending itself as a potential pretreatment conditioning technique. The induced differential expression of a range of immunomodulatory factors by 3D culture is independent of inflammatory stimulation but can be synergistic to enhance the eBMSC cytokine profile in inflammatory environments. However, the cytokine profile produced by eBMSCs is dependent on individual variations of eBMSC donors that influence the character, degree, and extent of the response to both 3D culture and inflammatory stimulation. The clinical utility of 3D culture to alter the cytokine profile of eBMSCs without the need for exogenous pretreatment conditioning warrants investigation of its efficacy to mitigate inflammatory disease.
Footnotes
Author Disclosure Statement
No competing financial interests exist.
Funding Information
Funding for this research was from the Virginia-Maryland College of Veterinary Medicine Internal Research Competition Grant and the Grayson Jockey Club Elaine Klein Career Development Award (S.H.B.).