
Abstract
Stem cell exhaustion is a hallmark of aging. Klotho-deficient mice (kl/kl mice) is a murine model that mimics human aging with significant bone abnormalities. The aim of this study is using kl/kl mice to investigate the functional change of bone marrow-derived mesenchymal stem cells (BMSCs) and explore the underlying mechanism. We found that klotho deficiency leads to bone abnormalities. In addition, kl/kl BMSCs manifested hyperactive proliferation but functionally declined both in vivo and in vitro. Mammalian target of rapamycin complex 1 (mTORC1) activity was higher in freshly isolated kl/kl BMSCs, and autophagy in kl/kl BMSCs was significantly decreased, possibly through mTORC1 activation. Conditional medium containing soluble Klotho protein (sKL) rescued hyperproliferation of kl/kl BMSCs by inhibiting mTORC1 activity and restoring autophagy. Finally, intraperitoneal injection of mTORC1 inhibitor rapamycin restored BMSC quiescence, ameliorated bone phenotype, and increased life span of kl/kl mice in vivo. This research highlights a therapeutic strategy to maintain the homeostasis of adult stem cell pool for healthy bone aging.
Introduction
Most human tissues contain a pool of incompletely differentiated cells named adult stem cells, which have the ability of self-renewal and differentiation [1]. Upon tissue injury, functional adult stem cells can differentiate into specific type of cells to regenerate damaged tissues. Stem cell decline or exhaustion is regarded as a hallmark of aging [2]. Compared with young people, the function of adult stem cells in the elderly gradually decreases, and the stem cell pool is also exhausted [3]. Moreover, although the stem cells in the elderly may still have proliferation ability, their multidirectional differentiation potential is greatly reduced [4]. Therefore, to better maintain the homeostasis of adult stem cell pool and slow down its exhaustion rate are conducive to the prevention or treatment of aging related diseases and also good for healthy aging process [5].
Mesenchymal stem cell (MSC) is a major kind of adult stem cells existing in a variety of tissues, including bone marrow, fat, placenta, and umbilical cord. MSCs have the self-renewal ability, osteogenic, adipogenic, chondrogenic, and other differentiation potential, as well as immunomodulatory ability. Thus, MSCs are widely used in cell therapy and regenerative medicine [6].
However, MSC aging really limits its medical application. At present, it is known that many signal pathways participate in the regulation of stem cell aging and exhaustion [7]. The mammalian target of rapamycin complex 1 (mTORC1) signaling pathway, for example, is overactivated in MSCs during aging, resulting in increased reactive oxygen species and DNA damage in MSCs which leads to the gradual loss of multidirectional differentiation potential and tissue repair ability [8]. Besides, autophagy is reduced in senescent bone marrow MSCs, and reactivation of autophagy by rapamycin restores bone loss in aged mice [9]. Therefore, exploring the signaling regulatory factors or the metabolic pathways underlying the resting state of MSCs is important for maintaining the stability of adult stem cell pool, enhancing body repair ability, as well as delaying aging.
α-Klotho (Klotho, KL) is a multifunctional antiaging protein [10]. Compared with wild-type mice (WT), klotho-deficient mice (kl/kl mice) show variety of phenotypes similar to human aging, such as shortened life span, osteoporosis, arteriosclerosis, ectopic calcification, and emphysema, as early as about 6 weeks after birth [11]. On the contrary, overexpression of klotho in WT can significantly prolong the life span of mice by 20%–30% [12]. Among those aging symptoms, bone abnormality is one of the major phenotypes of kl/kl mice [13]. Therefore, kl/kl mice have become a popular animal model to study aging and aging-related syndrome in vivo, including skeletal diseases. Recent studies provide clues that elevated Klotho expression promotes MSC function and its therapeutic potential [14], strongly indicating that the bone abnormality phenotype of kl/kl mice may be resulted from klotho-deficiency induced bone marrow-derived MSC (BMSC) dysfunction.
In this work, we used kl/kl mice as a premature aging model to study what is the physiological change of kl/kl BMSCs, why does the change happen, and how it is related to Klotho. Our results provided evidence of how mTORC1 signaling and autophagy affect BMSC dysfunction and suggested a possible role of circulating Klotho. Finally, we came up with using rapamycin as a pharmaceutical strategy to harmonize in vivo BMSC state and promote bone health in premature kl/kl mice.
Materials and Methods
Mice
The kl/+ mouse is a mixture strain of C57BL/6J and C3H/J, which were kindly provided by Dr. Jun Gu (Peking University, China). Animals were kept in a specific pathogen free animal facility at Sun Yat-sen University. All experiments were carried using the 6-week age matched littermates (mixed sex), and all the experimental protocols of mice were approved by the Institutional Animal Care and Use Committee of Sun Yat-sen University.
Analysis of bone morphology
The test of bone radiographs of tibiae used bones excised from 6-week WT and kl/kl littermates, measured by single energy X-ray absorptiometry utilizing a bone mineral analyzer (ZKKS-MCT-Sharp-III, Caskaisheng Co., Guangzhou, China).
Isolation and fluorescence activated cell sorting analysis of BMSCs
The procedure of isolation and analysis of mouse MSCs followed the previous published instructions [15,16]. Briefly, mice were sacrificed, and the crushed bones were chopped in phosphate-buffered saline (PBS) and incubated for 1 h at 37°C in 20 mL Dulbecco's modified Eagle's medium (Invitrogen, Waltham, MA, USA) containing 0.2% (wt./vol) collagenase IV (Gibco, Waltham, MA, USA).
The cell suspension was filtered through a 70-μM cell strainer (BD Falcon), and the bone fragment crush in Hanks' balanced salt solution (HBSS) (Gibco) was also collected together before red blood cell lysis (Beyotime Biotech Inc., Shanghai, China). The cell suspension was then washed and filtered again through a 70-μM cell sterile strainer, and the cells were centrifuged at 280 g at 4°C for 5 min, of which the pellet was suspended in 1 mL HBSS with no calcium or magnesium. The cell suspension was incubated with APC-conjugated PDGFR-ɑ (eBioscience®), FITC-conjugated Sca-1 (eBioscience), PE-conjugated CD45 (Affymetrix), and TER-119 (Affymetrix). Propidium iodide (Sigma, St. Louis, MO, USA) was added in after antibody labeling, followed by fluorescence activated cell sorting (FACS) gates determination on BD FACSAria II to exclude dead cells, as well as lineage-positive cells (CD45+ TER-119+). Each gate was determined referring to nonstaining negative cell samples.
For cell proliferation, differentiation, and biochemistry studies, three to four mice were pooled for once BMSC isolation, and three independent experiments were executed. After removing the bone marrow from the dissected bones, the flushed bones were chopped into 1–3 mm3 pieces, followed by collagenase IV digestion on 37°C shaker for 2 h at speed of 200 rpm. The digested bone fragments were washed, selected, and cultivated in MSC culture medium ɑ-MEM (Gibco) +15% fetal bovine serum (FBS; Gibco) until the third day to change culture medium. The BMSC clones became ready for further passage on Day 3.
Cell growth curve plotting
Isolated BMSCs were counted and seeded in 12-well plate at density of 1 × 10⁵/mL and conducted every other day. For each round of passage, 1 × 10⁵/mL cells were seeded. The logarithm of the cell numbers (Log2) was calculated and continuously added in each generation to complete the growth curve. Three biological repeats in kl/kl BMSC groups and two repeats in WT BMSC groups were recorded in this project.
Cell quiescence analysis using Pyronin Y staining
The analysis of MSC quiescence percentage was tested following literature instructions [17]. Briefly, harvested cells were suspended in 1 mL culturing medium containing 10 μg/mL Hoechst33342 (Beyotime Biotech Inc.), incubating at 37°C for 45 min. Then the cells were added in 5 μL of 100 μg/mL Pyronin Y (Sigma) and incubating at 37°C for further 15 min. Finally, the cells were washed and analyzed both Hoechst and Pyronin Y in linear scale, and a dot blot in which Hoechst presented in X and Pyronin Y presented in Y-axis showed the DNA and RNA distribution, while quiescent cells had less Pyronin Y staining. Each gate was determined referring to nonstaining negative cell samples.
SA-β-Gal staining
Cell SA-β-Gal staining was performed using Cell Senescence β-galactosidase Stain Kit (Beyotime Biotech Inc.). Briefly, primary BMSCs were seeded in 12-well plate at Day 4/10 for 24/48 h. Cells were fixed with fixative in room temperature for 15 min and then washed with PBS thrice. Then the cells were incubated with staining solution (930 μL solution C, 10 μL solution A, 10 μL solution B, 50 μL X-gal solution following the instruction from manufacturer) overnight in 37°C. For visualization, pictures were taken by 40 × microscopy.
Osteogenesis of BMSC
Mice BMSC osteogenic differentiation is performed using OriCell™ Osteogenic Differentiation Kit (Cyagen Biosciences Inc., Santa Clara, CA, USA). Briefly, mouse BMSCs of 70% density were cultured in osteogenesis induction medium (10 mM β-glycerol phosphate, 10−7 M dexamethasone, and 50 μM ascorbate-s-phosphate) for 21 days. BMSCs cultured in a culture medium of ɑ-MEM supplemented with 15% FBS were used as negative control. After 21 days induction, cells were fixed with 4% formaldehyde solution for 30 min and then stained with Alizarin Red (pH = 4.2) for 5 min, followed by rinsing with distilled water. The plate was scanned using HP Scanjet (G3110) with resolution of 300 × 300 dpi, 8 bits, red, green, blue (RGB) color system.
Adipogenesis of BMSC
Mice BMSC adipogenesis differentiation was performed using OriCell Adipogenic Differentiation Kit following the instruction (Cyagen Biosciences Inc.). Mouse BMSCs were seeded at 90% density in 96-well plates and changed into adipogenic differentiation medium after 24 h. Adipogenic differentiation medium was changed every other day, and cells were fixed at Day 21 with 4% formaldehyde solution for 30 min and then stained with Oil Red O for another 30 min. The stained cells were washed with 1 × PBS twice, and the plate was imaged using a phase-contrast microscope (Nikon EclipseTs2-FL).
Chondrogenesis of BMSC
Mice BMSC chondrogenesis differentiation was performed in well using OriCell Chondrogenic Differentiation Kit following the instruction (Cyagen Biosciences Inc.). Mouse BMSCs were seeded at 70% density in 96-well plates. After 24 h, BMSCs were cultured in chondrogenic differentiation medium, and medium was changed every other day. After 28 days of induction, cells were fixed with 4% formaldehyde solution for 30 min and then stained with Alcian Blue for another 30 min. The stained cells were washed with 1 × PBS twice, and the plate was imaged using a phase-contrast microscope (Nikon EclipseTs2-FL).
Histomorphometric analysis of the bone
Mice tibia and femur bones were decalcified using 10% ethylenediaminetetraacetic acid (EDTA) on 37°C shaker for 7 days. Medium was changed every 2 or 3 days. Bones were then fixed with 10% formalin in phosphate buffered saline for 1 day and dehydration in a graded alcohol series to 70% ethanol and stored at 4°C. Samples were embedded in paraffin and cut with a microtome at 2 μm. The sections were stained with Hematoxylin for 10 min, followed by washing in running water. Then the sections were stained with eosin for another 1 min and rinsed with 70%, 80%, 90%, 95%, and 100% ethanol, followed by xylene staining for 10 min. The sections were evaluated by light microscopy using Nikon EclipseTs2-FL.
Western blot analysis
Western blot analysis was carried out as described previously [18]. Briefly, cells were lysed using radio immunoprecipitation assay (RIPA) buffer (50 mM Tris-HCl pH 7.4, 150 mM NaCl, 1% sodium deoxycholate, 1% Triton X-100, 0.1% SDS, 1 mM EDTA) containing a protease inhibitor cocktail and phosphatase inhibitor (1 μg/mL). Then 20 μg of cell lysates was separated by 12% sodium dodecyl sulfate–polyacrylamide gel electrophoresis (SDS/PAGE). The polyvinylidene fluoride membranes (Millipore, Burlington, VT, USA) were then blocked and incubated with primary/secondary antibodies overnight at 4°C. The Odyssey Imaging System was used for imaging (LI-COR Biosciences, Lincoln, NE, USA). ImageJ was used to make the optical density quantification. Primary antibody information is listed in Table 1.
Antibodies Used for Western Blot and Immunostaining
IF, immunofluorescent staining; WB, western blot assay.
5-bromo-2′-deoxyuridine incorporation staining
For 5-bromo-2′-deoxyuridine (BrdU) labeling experiments, cells gained from FACS were immediately seeded in 24-well plate after isolation, growing on a glass slide with 10 μM BrdU addition for 16 h, and fixed in 4% formaldehyde in PBS. One hundred millimolar Glycine was added to stop reaction, and cells were permeated by 0.5% Triton X-100/PBS at room temperature. DNA was denatured by 2 M HCl followed by neutralization with 0.1% sodium borate solution (pH = 8.5). Then BrdU signal was recognized by its antibody following standard immunostaining protocol.
Fluorescence microscopy
Immunostaining was carried out as previously described [19]. Briefly, following the last wash with PBS, cells were fixed in 4% formaldehyde on ice for 10 min and then permeated for 30 min at room temperature (20 mM HEPES, NaCl 50 mM, MgCl2·6H2O 3 mM, Sucrose 300 mM, Triton-X 0.5%). After incubating in blocking buffer [0.1% bovine serum albumin (BSA) in PBS, 3% goat serum] for 1 h, cells were incubated at 4°C overnight with primary antibody, followed by secondary antibody incubation for 1 h at room temperature. The cells were washed and followed by a fluorescently labeled secondary antibody [Alexa Fluor 488 goat anti-Rabbit IgG (H + L)]. After three washes with PBS, coverslips were mounted with VECTASHIELD mounting medium containing 0.5 μg/mL 4′,6-diamidino-2-phenylindole (DAPI) and then visualized at 100 × on a charge coupled device camera mounted on a Leica TCS SP5 STED microscope using imaging software. Primary antibody information is listed in Table 1.
RNA isolation and quantitative reverse transcription–polymerase chain reaction detection
Total RNA was purified from mouse BMSCs using RNAiso Plus (TAKARA, Shiga, Japan), and 1 μg total RNA was used in reverse transcribed reaction using PrimeScript RT Reagent Kit with gDNA Eraser (TAKARA) following the instructions. Real-time polymerase chain reaction (PCR) was performed using ChamQ™ Universal STBR qPCR Master Mix (Vazyme, Nanjing, China). The candidate gene expression level was calculated based on threshold cycle (Ct) and using 2−△△Ct method, normalized with gapdh. Mouse primers used are listed in Table 2.
Primers Used for Quantitative Reverse Transcription–Polymerase Chain Reaction
Trichloroacetic acid precipitation and protein concentration determination
HEK293T cells were transfected with green fluorescent protein (GFP) (control) and soluble Klotho protein (sKL), and the supernatant was collected 48 h after transfection. Spin 1 mL sample in a cold microfuge for 5 min at 12,000 g and collected the clear supernatant again. Then added 1/9 volume of 100% trichloroacetic acid (w/v), reversed 10 times, and kept in −20°C for 5 min followed by 4°C for 15 min. Centrifuge the sample at 15,000 g at 4°C for 15 min and then wash the pellet by 200 μL acetone once, centrifuging at 15,000 g at 4°C for another 15 min. Finally, carefully removed the supernatant and dissolved the precipitate in SDS-PAGE loading buffer (50 mM Tris (pH = 8.0), 2% SDS, 100 mM DTT, 10% glycerol) and loaded on SDS-PAGE. sKL concentration was determined by referring to BSA standard sample series: 1600/800/400/200/100 ng/mL. ImageJ was used to make the optical density quantification, and sKL concentration was calculated by comparing to bicinchoninic acid assay standard series.
Mice rapamycin treatment
WT and kl/kl Mice both were injected with 1 mg/kg dimethyl sulfoxide (DMSO) or rapamycin every other day intraperitoneally, since week 3–6 (n = 3 in each group). Mice were sacrificed at week 6, followed by series of analysis. Another group of WT (n = 18) and kl/kl (n = 16) mice were kept with injection and feeding for survival test.
Statistical analyses
Data between WT and kl/kl BMSCs were analyzed using two-tailed Student's t-test (WT vs. kl/kl sample comparison) or one-way analysis of variance (ANOVA; in vitro WT vs. kl/kl BMSC growth curve). The statistics figures were shown as mean ± standard error of the mean. sKL and Rapamycin treatment data were analyzed using two-way ANOVA followed by Bonferroni post-tests. P < 0.05 is considered statistical significance.
Results
Abnormalities of bones in an aging model of kl/kl mice
Klotho deficiency in mice leads to series of aging-like phenotypes, including osteoporosis symptoms [11]. However, recent study showed that targeted deletion of Klotho from osteocytes led to increased bone formation and bone volume [20].
To elucidate Klotho's role in regulating bone mass, we harnessed 6-week-old klotho-deficient (kl/kl) mice to compare the bone phenotype with its WT littermates. The kl/kl mice were smaller in body size (Fig. 1A), and the average body weight was significantly lower than their WT littermates [average body weight: 21.09 ± 0.62 g vs. 6.50 ± 0.63 g (n = 8), Fig. 1B]. However, bone weight loss is not as significant as the body weight loss, as the bone to body weight ratio was higher in kl/kl mice (Fig. 1C). Besides, kl/kl mice show shorter length of both tibia and femur compared with their WT littermates [average Femur length: 1.33 ± 0.03 cm (n = 5) vs. 1.05 ± 0.02 cm (n = 9), average tibia length: 1.82 ± 0.04 cm (n = 5) vs. 1.59 ± 0.02 cm (n = 9), Fig. 1D]. Interestingly, we also noticed that there was a very obvious hyperplasia at the bottom of both tibia and femur in the kl/kl mice (Fig. 1E, yellow boxed), and the bones from kl/kl mice were more fragile when being dissected.
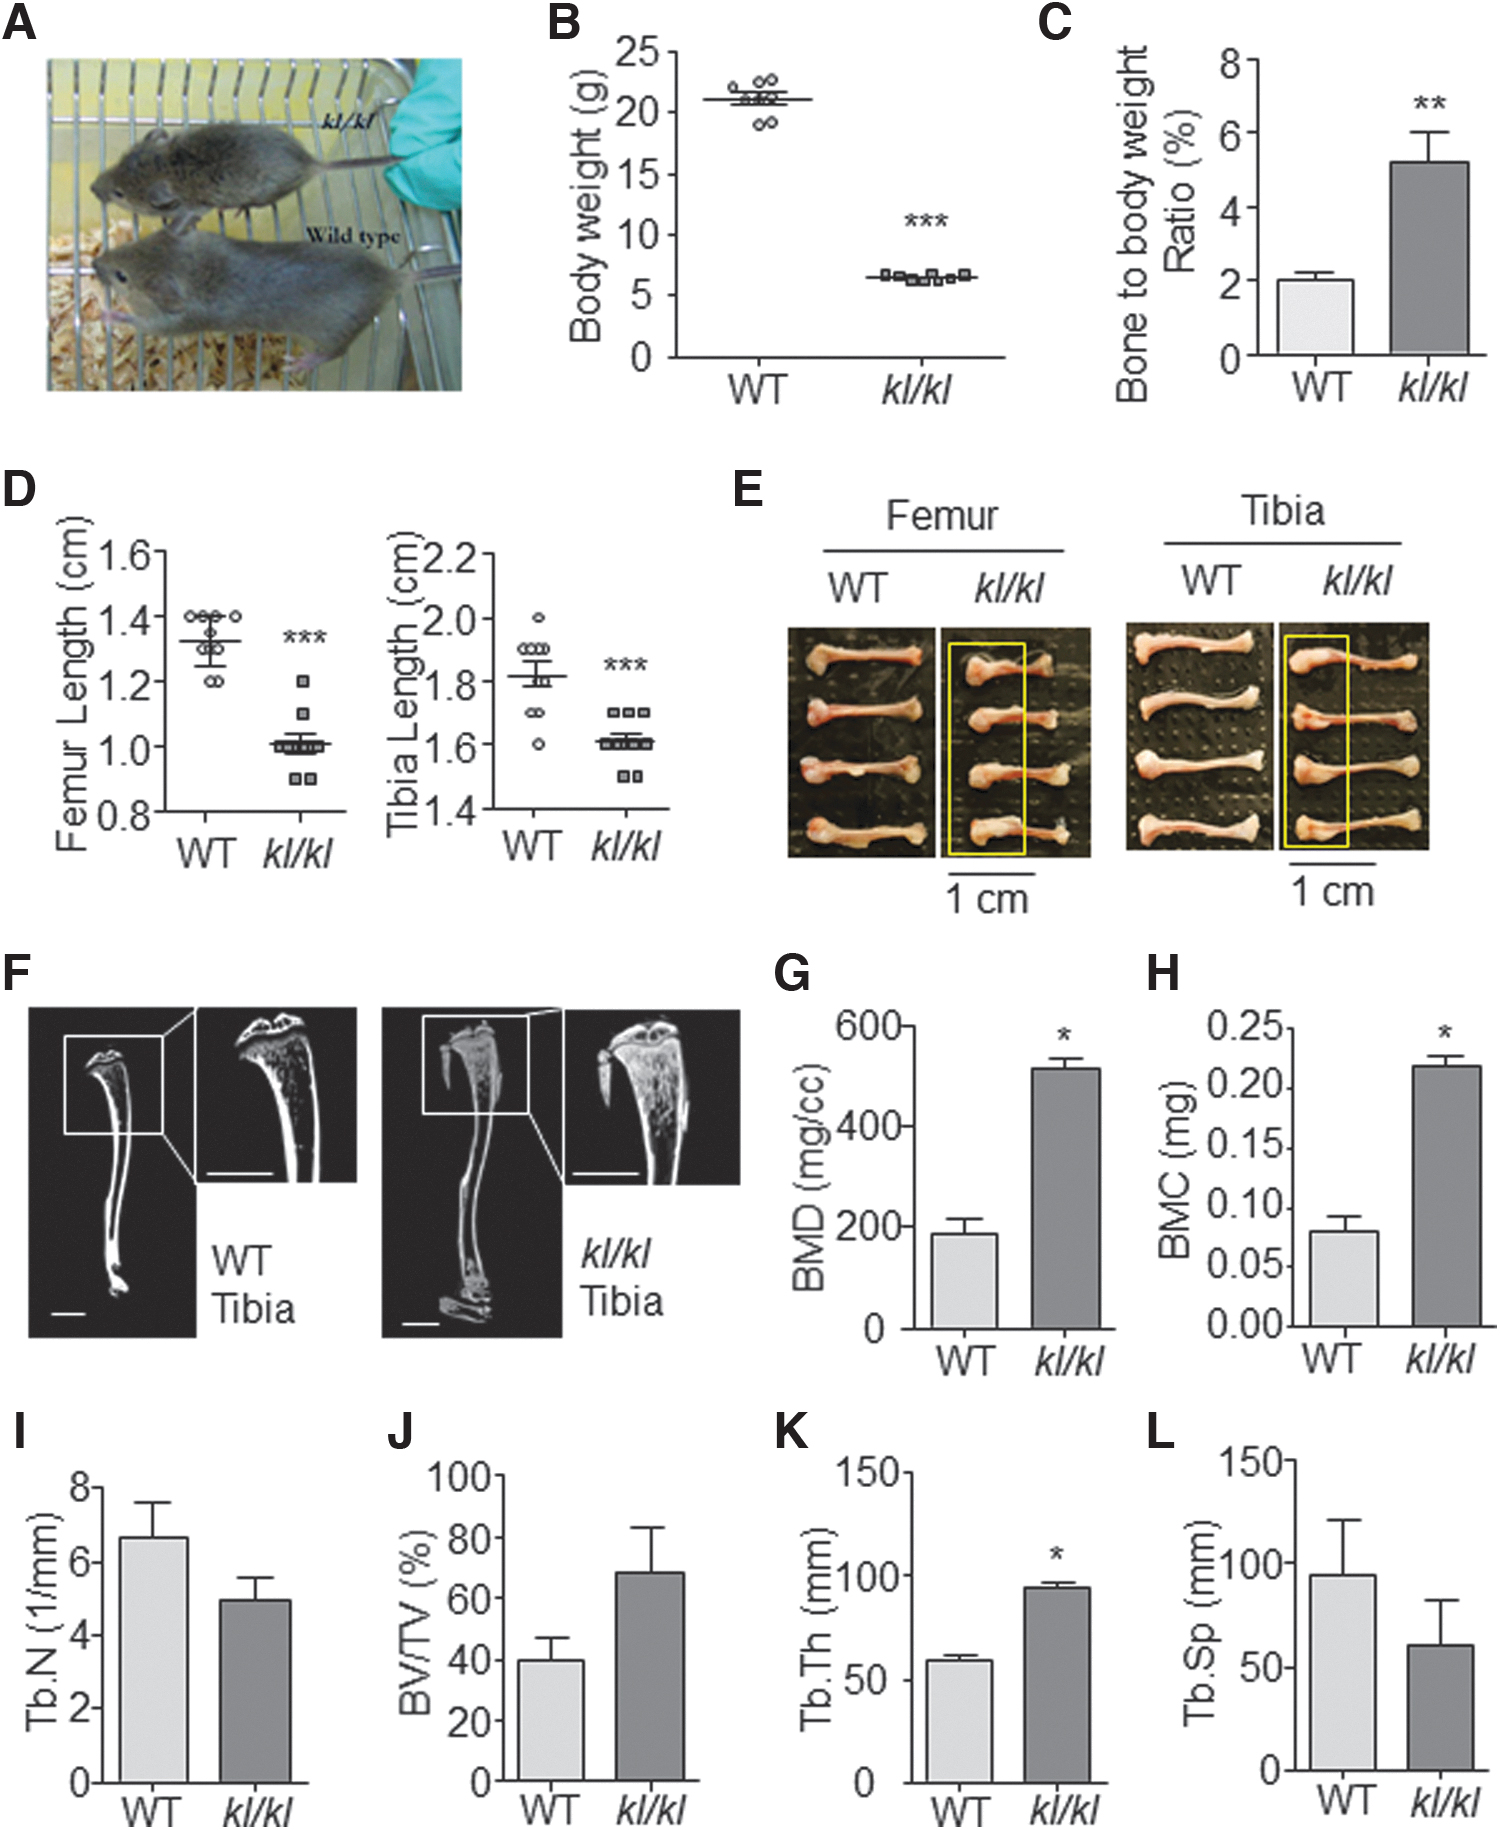
Bone abnormalities in kl/kl mice.
Microcomputed tomography (μCT) has been widely used to assess bone structure and density in physiological conditions. Tibia of kl/kl mice showed thinner cortical bone (Fig. 1F) but about 2.5-folds of bone mineral density (BMD, Fig. 1G) and bone mineral content (Fig. 1H). The radiography also showed a declined trabecular number in kl/kl mice (Tb.N, Fig. 1I), suggesting the characteristic of osteoporosis. However, higher trabecular bone volume ratio (BV/TV, Fig. 1J), trabecular thickness (
BMSCs are hyperactive in bone marrow of kl/kl mice
Trabecular structure is basically formed by the BMSCs; thus, then we analyzed WT and kl/kl BMSCs by FACS. CD45 negative, TER-119 negative, and Sca-1 and PDGFRα positive BMSCs were collected from both tibia and femur of WT or kl/kl mice as BMSCs [15] (Fig. 2A). This isolation method excluded unwanted dead cells and lineage of CD45+ hematopoietic cells entirely. We found that the percentage of BMSCs in WT is about 0.05% of total bone marrow cells, while the percentage of BMSCs from kl/kl mice is about 0.12%, which exceeded that of WT BMSCs for over twofolds (Fig. 2B).

Hyperactive proliferation of BMSCs in kl/kl mice.
It is presumed that adult stem cells exist in one of two states: (a) the quiescent state in which the cells are not actively cycling and (b) the active state in which the cells are evoked in cell cycle [21]. Thus, we further analyzed the proportion of G0 phase quiescent cells in the whole BMSC population using Hoechst/Pyronin Y staining followed by FACS analysis [17]. As shown in Figure 2C, the percentage of quiescent BMSCs in 6-week young WT was 94% and that in the 6-week kl/kl mice was 77% (Fig. 2C). This suggested that BMSCs in kl/kl mice were less quiescent, which possibly entered active cell cycle.
Then we used BrdU incorporation to identify actively proliferating cells. Anti-BrdU staining results showed more active proliferation of kl/kl BMSCs than WT BMSCs (Fig. 2D, E). In addition, the nucleus of kl/kl BMSCs were significantly enlarged compared with that of WT BMSCs (Fig. 2F), suggesting an elevated transition from quiescence to proliferation [22]. Moreover, kl/kl BMSCs grew faster in vitro during the first 7 days after isolation, but reached platform thereafter; however, WT BMSCs did not stop growing until the 12th day after seeding in culture (Fig. 2G). Comparing the BMSC β-gal staining at Day 5 and 9 after isolation, positive staining could be easily found in kl//kl BMSC but seldom in WT BMSCs at Day 5. At Day 9 positive staining could be found in both groups, showing that the BMSCs went senescent after in vitro passage and culturing (Fig. 2H). Taken together, kl/kl BMSCs manifested hyperactive proliferation and exhausted both in vivo and in vitro.
BMSCs in kl/kl mice are functionally defective
Having found hyperproliferated BMSCs in kl/kl mice, next we decided to test the BMSCs' function. Hematoxylin and Eosin staining of tibia section revealed that the trabecular structure of WT was well arranged in the bone marrow, while kl/kl mice showed more trabecular structure than the wild type but were unevenly accumulated (Fig. 3A), which went with our previous μCT observation of higher BMD in kl/kl mice (Fig. 1G).
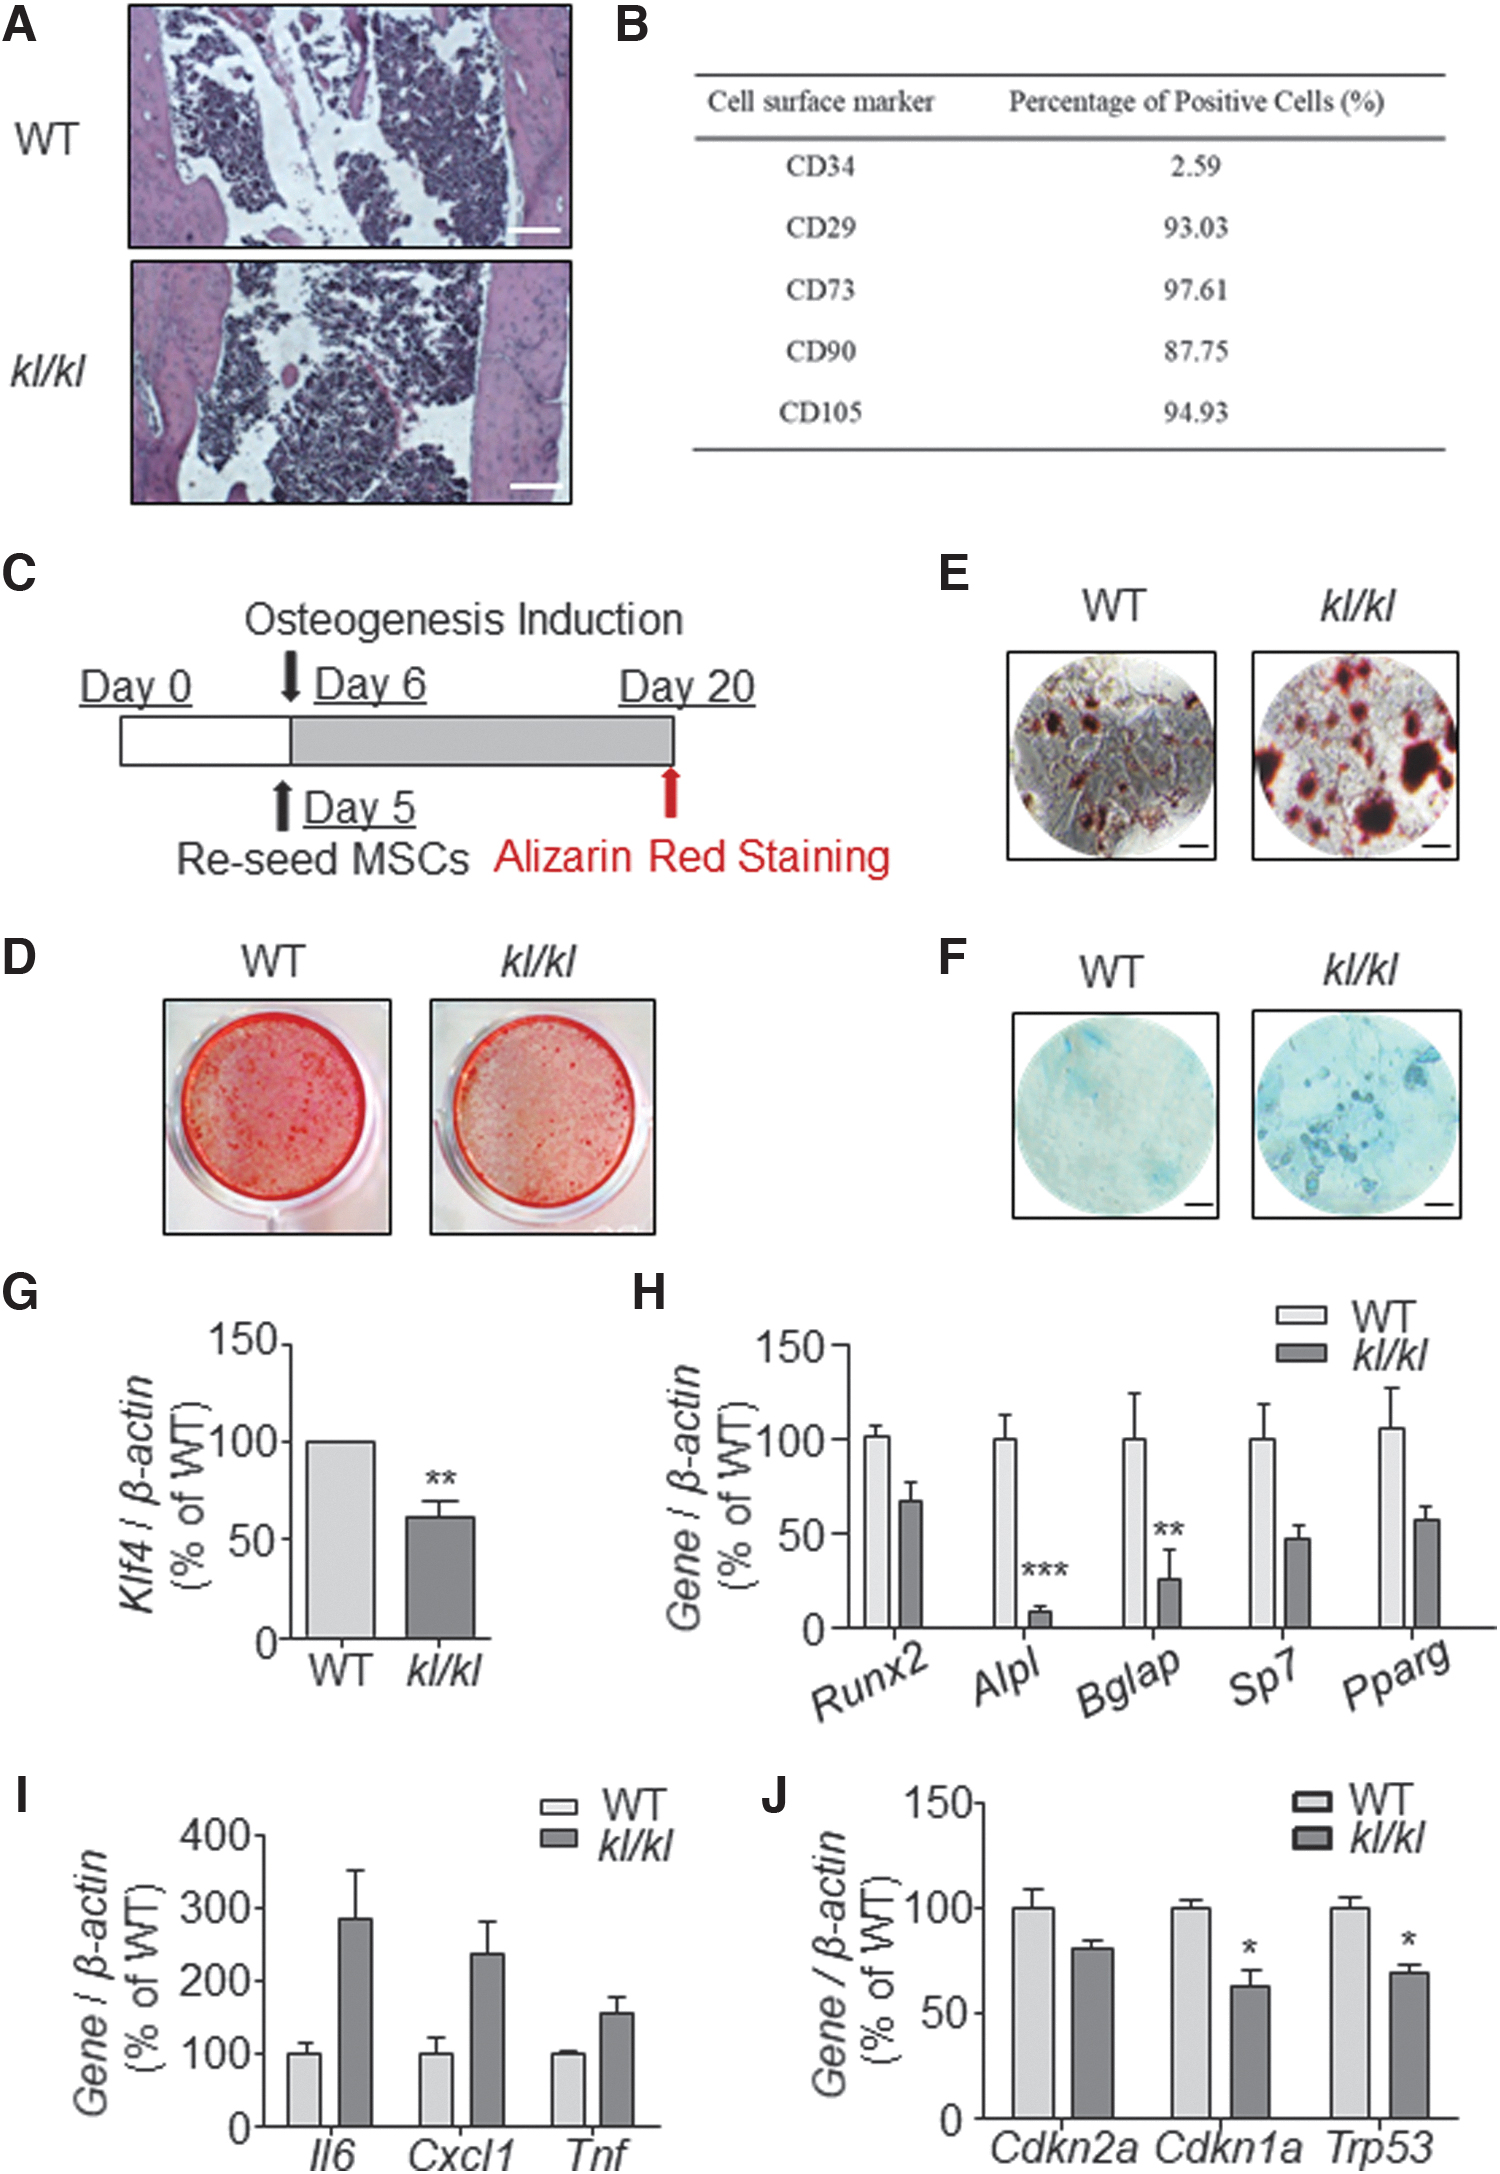
BMSCs in kl/kl mice are functionally defective. (A) H&E-stained paraffin sections of WT and kl/kl mice tibia at 6 weeks (scale bar: 100 μM).
Next, we isolated the mice BMSCs and tested their cell surface markers by FACS (Fig. 3B). Given that kl/kl BMSCs proliferated faster in vitro during the first 5 days after isolation, we reseeded both WT and kl/kl BMSCs at the same cell density on the fifth day after isolation for osteogenic induction experiment as indicated (Fig. 3C). We found that kl/kl BMSCs showed attenuated osteogenic ability in vitro, indicating a reduction of BMSC differentiation (Fig. 3D).
We also tested the adipogenesis and chondrogenesis of both WT and kl/kl BMSCs (Fig. 3E, F), of which kl/kl BMSC showed a reported aging-related balance changing favoring adipogenesis [18]. In addition, quantitative reverse transcription-PCR analysis showed that Klf4, a marker gene indicating BMSC stemness, was significantly downregulated in kl/kl BMSCs (Fig. 3G). Meanwhile, expression of osteogenic genes, especially Alpl and Bglap (osteocalcin), was also dramatically decreased in kl/kl BMSCs (Fig. 3H). Moreover, Il6, Cxcl1 (Gro1), and Tnf (TNF-α) were all upregulated in kl/kl BMSCs (Fig. 3I), consistent with the established knowledge that Klotho deficiency leads to inflammation [23]. However, no increased levels of Cdkn2a (p16INK4A) and Cdkn1a (p21) and Trp53 (p53) were detected in kl/kl BMSCs (Fig. 3J), suggesting that these cells underwent functional deterioration rather than simply cell senescence. Taken together, our results supported that the BMSCs were functionally declined in kl/kl mice.
mTORC1 signaling is activated in kl/kl BMSCs
It is reported that mTORC1 controls the adaptive transition of quiescent stem cells [22], and it is also a central cell growth regulator [24]. Thus, we decided to compare mTORC1 activity in WT and kl/kl BMSCs and took 4E-BP1 as downstream effectors of mTORC1 [24]. Since isolated BMSCs on Day 5 were too few to carry out western blot assay, we tested p-4E-BP1 in primary BMSCs by immunostaining. p-4E-BP1 signals in kl/kl BMSCs were stronger than in the WT and located across the nucleus and cytosol, compared to its cytosol location (less in the nucleus) in the WT (Fig. 4A). Meanwhile we investigated mTORC1 downstream gene expression to demonstrate the signal pathway activation instead [25]. Interestingly, mTORC1 downstream gene Hif1α and Pdk1, but not Pdha1 and Ldha, were remarkably elevated in kl/kl BMSC on Day 5 and quickly dropped down on Day 9 (Fig. 4B–E). These results suggested that mTORC1 signaling might be activated during the fast proliferation period of kl/kl BMSCs and then inactivated in the kl/kl BMSCs on Day 9.

mTORC1 activity and autophagy level in kl/kl mice BMSCs.
It is known that mTOR activation leads to repression of autophagy [26], and basal autophagy is also essential to regulate the fate of MSCs [27]. Therefore, we evaluated autophagy levels in kl/kl BMSCs. Majority of genes involved in autophagy pathways were globally downregulated (Fig. 4F), such as ATG7, Map1lc3a, and Sqstm1. Microtubule-associated protein 1A/1B-light chain 3 (LC3) is a reliable marker for monitoring autophagy [28]. Western blot analysis showed a decreased trend of total protein level of LC3-II, as well as another core ATG gene ATG7(Fig. 4G, H), and an increase of LC3 I/II ratio (Fig. 4I). Meanwhile, protein LC3 puncta number in kl/kl BMSCs was also significantly decreased (Fig. 4J), confirming the reduction of autophagy in kl/kl BMSCs. Taken together, above data indicated the weakened autophagy in kl/kl BMSCs.
Conditional medium containing sKL rescues hyperproliferation of kl/kl BMSCs
Klotho expression in bone is very low [29]. As a circulating protein, secreted and sKL can be either expressed from mRNA transcript encoding secreted protein or sheared from its membrane form [30,31].
To test whether the BMSC exhaustion phenotypes in kl/kl mice were caused by defect of circulating Klotho, we cloned mouse sKL and confirmed its expression in the HEK293T cell culture medium (Fig. 5A) and determined its concentration referring to BSA standard samples (Fig. 5B). We started adding conditional medium containing sKL (1000 pg/mL) into kl/kl BMSCs at Day 5 and found that the BMSCs resupplemented with sKL grew significantly slower than the control group of kl/kl BMSCs with GFP until Day 12 (Fig. 5C). Immunostaining of p-4E-BP1 of BMSCs (Day 12) revealed suppressed mTORC1 activity with sKL conditional medium addition (Fig. 5D), but autophagy-related protein ATG7 and LC3 showed no significant change of both mRNA level (data not shown) and protein level (Fig. 5E, F). Meanwhile LC3 I/II ratio showed no significant change, too (Fig. 5G). However, LC3 puncta number was significantly increased after addition of sKL in kl/kl BMSCs (Fig. 5H), suggesting a potent autophagy evocation.
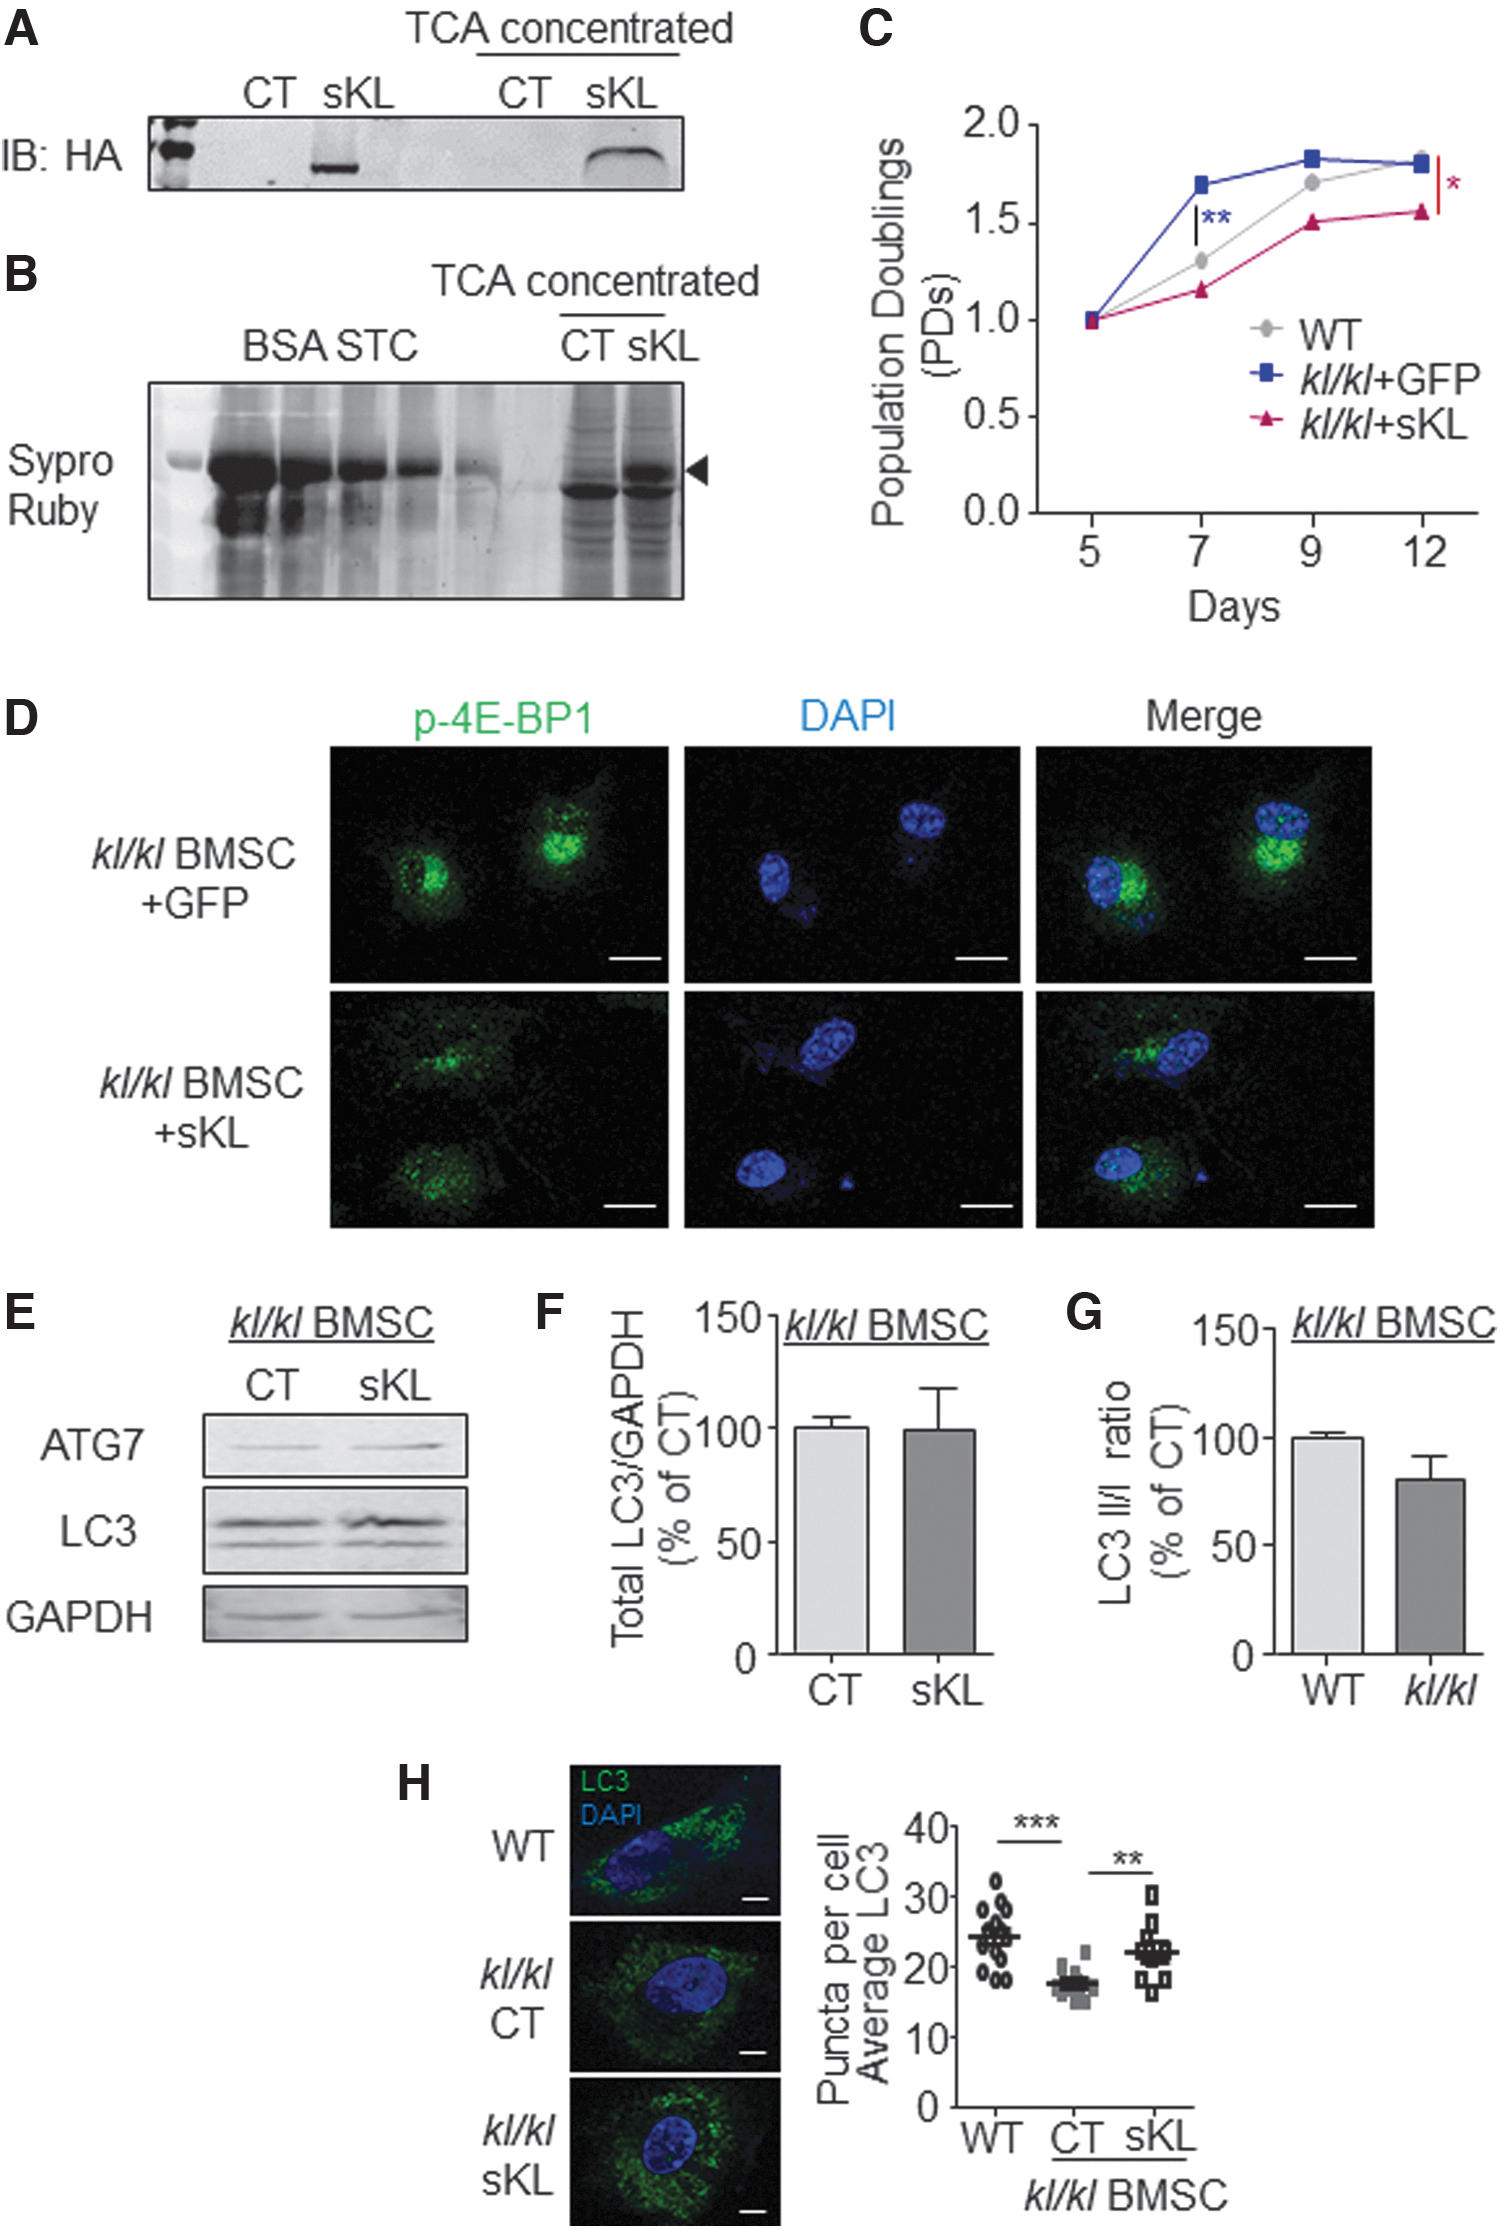
Conditional medium containing sKL rescues hyperproliferation of kl/kl BMSCs.
Rapamycin improves bone phenotype and increases life span of kl/kl mice
Food and Drug Administration (FDA)-approved drug Rapamycin is a specific inhibitor of mTORC1 signaling and an activator to trigger autophagy [32]. Given that kl/kl BMSCs showed elevated mTORC1 signaling and decreased autophagy, we investigated the role of rapamycin in ameliorating kl/kl phenotypes. We intraperitoneally injected mice with 1 mg/kg rapamycin or control solvent DMSO every other day from the third week after birth. Rapamycin significantly extended the life span of kl/kl mice from 46.76 to 65.88 days (Fig. 6A). The mTORC1 activity change was indicated by the inhibition of p-4EBP1 and p-S6 (Fig. 6B).
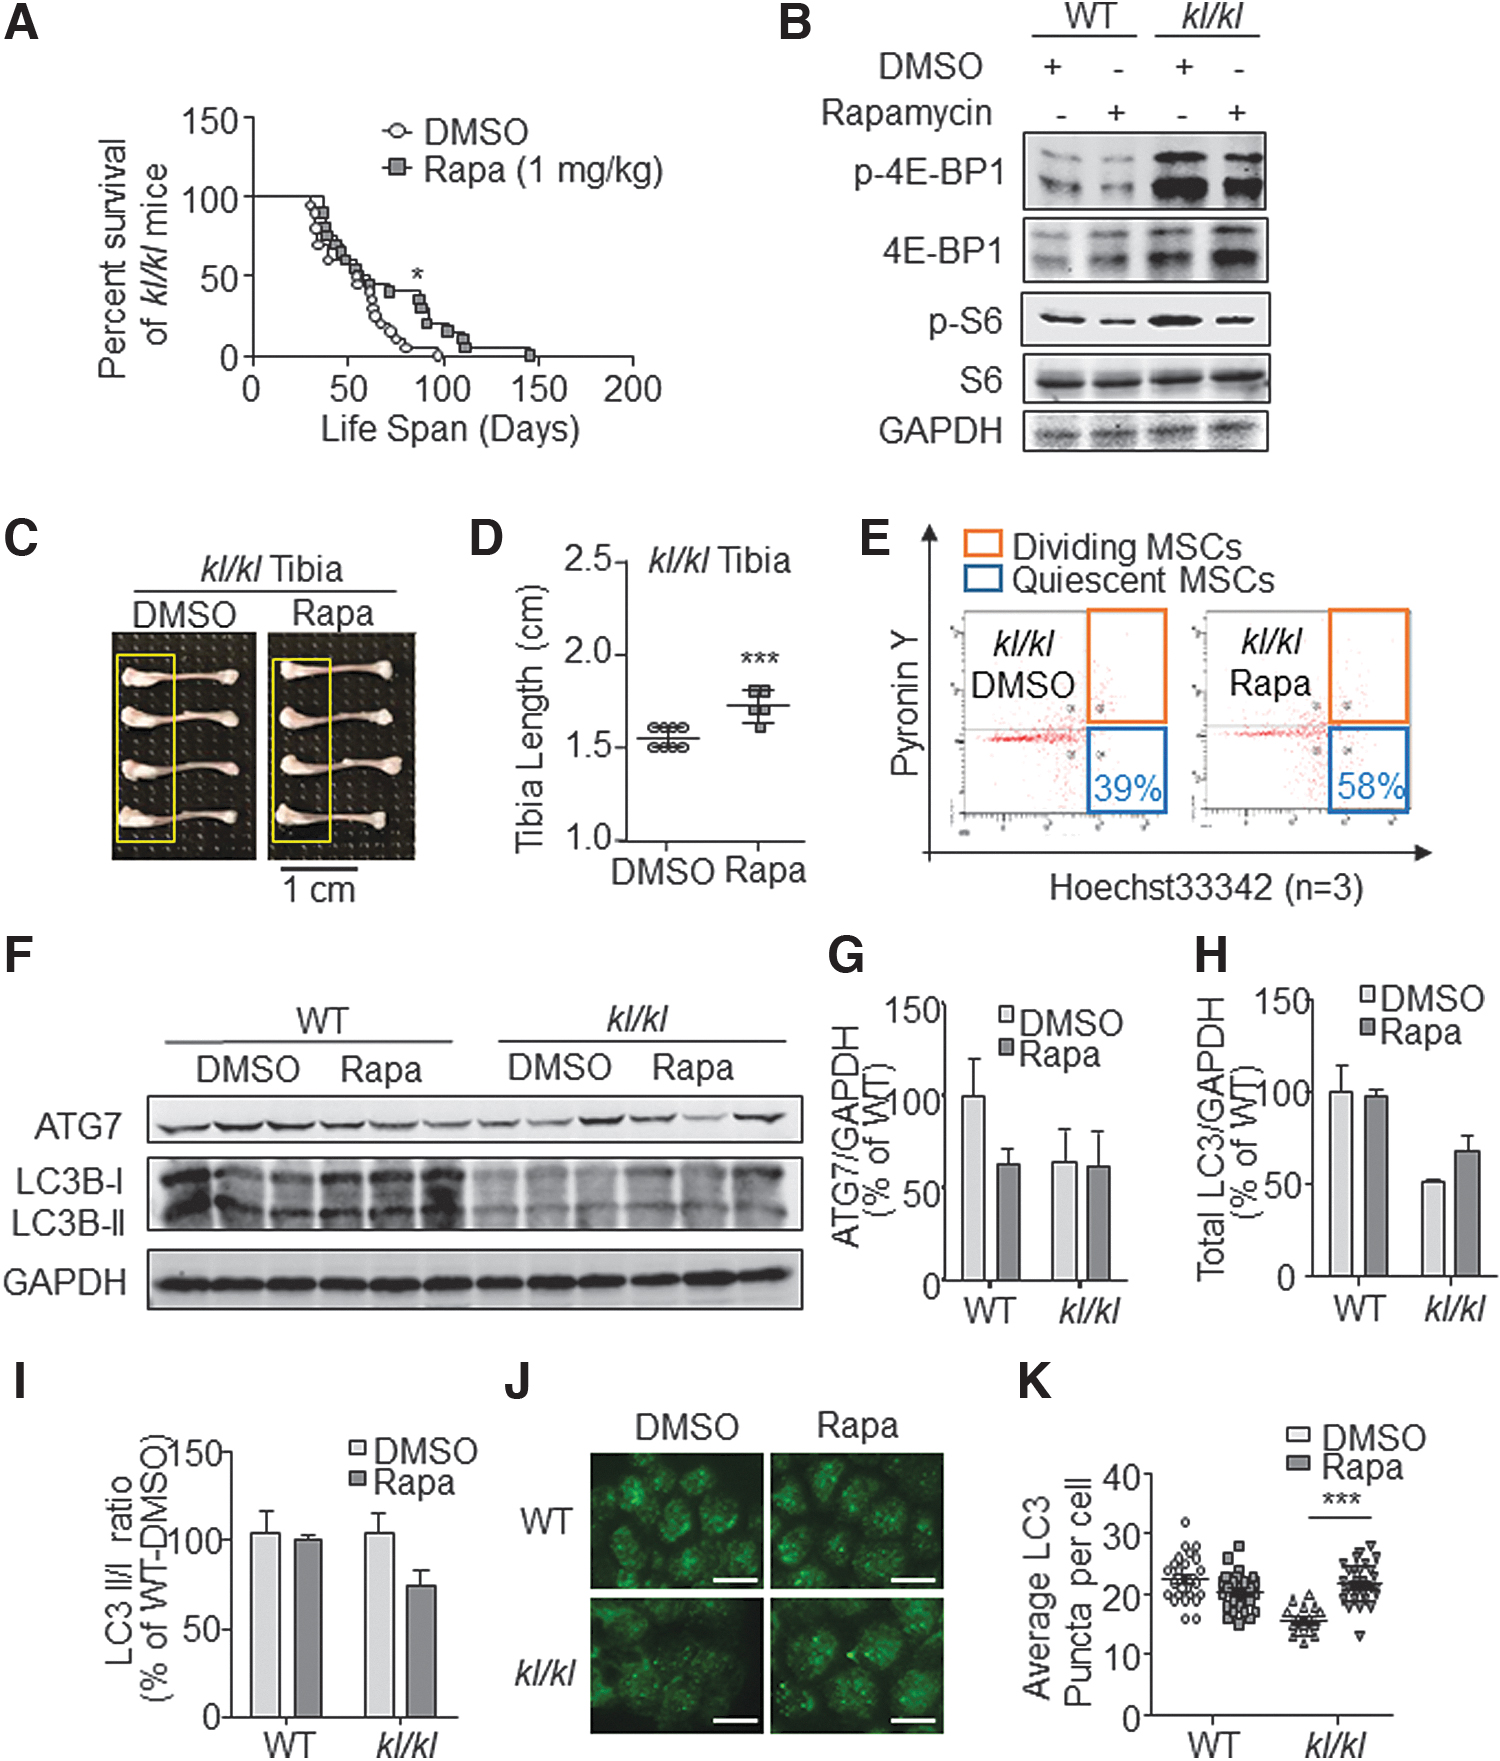
Rapamycin rescues kl/kl mice bone abnormalities.
For the evaluation of bone phenotype and molecular signatures, we treated WT and kl/kl mice with DMSO or rapamycin by the fore-mentioned paradigms for 3 weeks and sacrificed these mice at the end of sixth week after birth. We noticed that the bone hyperplasia on the kl/kl tibia was greatly alleviated, and the average tibia length was also increased after rapamycin treatment. While the hyperplasia on DMSO- kl/kl tibia was obvious, it was hardly seen in Rapamycin-kl/kl group (Fig. 6C, D). In addition, FACS analysis showed that the percentage of quiescent kl/kl BMSCs (CD45−/Ter-119−/Sca-1+/Pyronin Y−) increased from ∼39% to 58% (Fig. 6E). In the sacrificed mice samples, we found that rapamycin treatment hardly rescued kl/kl mice ATG7 protein levels (Fig. 6F, G), but total LC3 protein level seems increased in kl/kl mice after rapamycin treatment (Fig. 6H, P > 0.05). Meanwhile LC3I/II ratio showed decrease in kl/kl mice after rapamycin treatment (Fig. 6I). However, the LC3 foci in kl/kl BMSCs were also significantly increased after rapamycin treatment (Fig. 6J, K). In summary, we provided evidence that rapamycin harmonized mTORC1 activity and autophagy in kl/kl mice, promoted BMSC rejuvenation, recovered the bone phenotype, and prolonged life span (Fig. 7).

Schematic diagram of how mTORC1 and autophagy affected kl/kl mice BMSC exhaustion and bone abnormality. In klotho-deficiency mice, mTORC1 is hyperactive and the BMSCs are proliferating fast, accomplished by declined autophagy, which leads to aging-like phenotype such as bone abnormality and shortened life span (Upper panel). After rapamycin treatment, mTORC1 activity is restricted and autophagy is restored, which facilitate BMSC quiescence and bone health. mTORC1, mammalian target of rapamycin complex 1.
Discussion
Aging is an irreversible process which affects almost all physiological activities, including the alterations in bone and osteopenia/osteoporosis development [33]. In this study, we used an established premature aging model, kl/kl mice, to study the underlying mechanisms of osteo-geriatric phenotype. We observed significant exhaustion of kl/kl BMSCs, manifested by enhanced quiescent-to-proliferation transition, and reduced osteogenesis capability. In 60-week-old mice we also observed BMSC exhaustion (data not shown), suggesting that the loss of BMSC reservation might be a universal reason contributing to the high occurrence of osteopenia/osteoporosis during natural aging and the difficulty of fracture healing in the elderly.
mTOR signaling is one of the most important signaling pathway controls for nutrition response and growth, as well as in aging and cancer development. Thomas A. Rando's group first reported that mTORC1 activity is necessary and sufficient for the transition of satellite cells from quiescent G0 state to GAlert state in response to injury-induced systemic signals [22]. In preaging kl/kl mice bone study we also found a transition of the BMSCs from quiescent to active state but without injury signal to evoke reserved BMSC, and very probably mTORC1 activation was also involved. Stem cell exhaustion and the decline in the tissue regenerative potential is one of the characteristics of aging [2], and our results connected klotho gene deficiency leading to BMSC exhaustion for the first time.
According to Makoto Kuro-o's first reports of kl/kl mice serum and blood data [11], a slight increase in calcium and phosphorus was observed which may contribute to abnormal bone phenotype that we observed such as BMD increase and ectopic calcification. But kl/kl mice were also found to be hypoglycemic with decreased insulin of unclear reason, which is not in favor of mTORC1 activation. Other reports suggested tight interaction of klotho and GH-IGF-I axis [34], and we are also very interested in the mechanism of how Klotho affected mTORC1 signaling.
Klotho is an antiaging protein. Three forms of Klotho that have been identified are as follows: a full-length transmembrane form (mKL), a truncated soluble form (tsKL), and a soluble Klotho (sKL). tsKL comes from cleavage of full length mKL and the soluble Klotho is originated from alternative splicing from the full length, both of which were released and existed in circulation [35]. Membrane-localized Klotho acts as receptors for FGF23 [36] and represses signals of insulin and insulin-like growth factor 1 intracellularly [12]. Although sKL could bind to FGF receptor or be self-dimerized with its transmembrane form [37], no receptor has been identified presently.
Klotho is expressed in several tissues particularly in the kidney and brain, but its expression level is low or absent in bones [29]. Bone phenotypes of kl/kl mice supported the physiological function of sKL, which may act like a hormone [12]. Indeed, when sKL was resupplemented into cultured kl/kl BMSCs, both the defect in autophagy and hyperproliferation were ameliorated (Fig. 5). These results prompt us to further explore the possible receptor(s) of circulating Klotho, which would be important to unveil the mechanism of how klotho-deficiency leads to aging like symptoms. Considering the similar hyperproliferation of kl/kl BMSCs and cancer cells, finding a smaller functional peptide of sKL may also be of great interest for future cancer therapy.
Autophagy is a biological degradative process for maintaining homeostasis of cells and tissues. Growing evidence suggests that basal autophagy is necessary to keep stem cells in quiescence state by clearance of senescent cells [38]. In kl/kl mice, we found that autophagy was impaired both at level of both gene expression and autophagy flux formation (Fig. 4F–H). Senolysis is a recent breakthrough in aging study, meaning the specific elimination of senescent cells [39,40]. Although we failed to identify the altered expression of senescent markers, such as p16INK and p21CIP , in the kl/kl BMSCs, β-gal staining showed stronger signals at both Day 5 and 9 of kl/kl BMSCs (Fig. 2H). We also found increased expression of inflammatory factor (Fig. 3F), which is also an indicator of aging process and might accelerate BMSC exhaustion and bone aging. Deteriorated autophagy in kl/kl mice would weaken the senolysis of the senescent and inflammatory cells, finally promoting bone aging.
Rapamycin, which is an FDA-approved drug and a general inhibitor of mTORC1 signaling, was found effective in preventing BMSC exhaustion and bone abnormality in our prematuring mouse model. In our test we found little promotion of elevating autophagy proteins after rapamycin treatment (Fig. 6E–G), and it is possibly due to rapamycin that would have an inhibition effect on protein translation. Since mTORC1 signaling is a major controller of the speed of cell proliferation, we think that the BMSC exhaustion in kl/kl mice would majorly be due to accelerated proliferation, which deteriorated by inhibition of autophagy.
As a specific inhibitor of mTOR, rapamycin has been shown useful in treatment of several diseases. It may benefit the body by affecting cell metabolic reprogramming [41], inhibiting cancer cell growth/proliferation [42], and prolonging life span [43]. However, there are several challenges to rapamycin in practical usage. The first is the poor solubility and the fast pharmacokinetics, which greatly limits rapamycin's clinical application. Thus water-soluble derivatives of rapamycin, such as Temsirolimus [44] and Everolimus [45], were approved by FDA and tested in clinical trials.
The second challenge is the complicated feedback loops regulated by mTORC1. The transient and partial inhibition of 4EBP1, the increased phosphorylation of Akt through the loss of negative feedback loops, and the activation of alternative oncogenic pathways through crosstalk support that Rapalogs may be more effective in combination with other targeted agents or to enhance activity of hormones and chemotherapy [46]. Another approach is to design small-molecule inhibitors with broader spectrum of activities in the PI3K/AKT/mTOR pathway [47]. Dual PI3k/mTOR kinase inhibitor and the chemotherapeutic drug Taxotere are significantly more effective in eradicating tumors in prostate cancer model than monotherapy [48].
In summary, we use kl/kl mice, an established premature aging mice model, to demonstrate the MSC exhaustion that happens during aging. By exploring the association of autophagy, metabolic switch, and the maintenance of BMSC quiescence, we found that circulating Klotho might regulate BMSC exhaustion as a hormone, possibly through regulating mTORC1 signaling activity. Finally, FDA-approved drug rapamycin manifested therapeutic effect for aged bone.
Our study unveiled the physiological change of BMSCs during aging using premature mice model and revealed that mTORC1 activation would be one of the intrinsic mechanisms of BMSC exhaustion, as well as it's connection with circulating Klotho. We are very interested in verifying these mechanisms in natural aging model and also noticed the functional difference of circulating Klotho and mTORC1 signaling inhibition. Exploring the application of circulating Klotho and mTORC1 inhibitors to aging-related bone abnormality will be of great clinical value.
Conclusion
In this study, we used kl/kl mice to demonstrate the loss of BMSC reservation that contributed to the aging related bone abnormalities, such as osteopenia/osteoporosis. By exploring the association of autophagy, metabolic switch, and the maintenance of BMSC quiescence, we found that sKL might regulate BMSC exhaustion as a hormone. Finally, FDA-approved drug rapamycin manifested therapeutic effect for aged bone, which showed benefit to aging bones.
Footnotes
Acknowledgments
The authors thank the microscopy core and flow cytometry core at School of Life Sciences, Sun Yat-sen University for their services. The authors also thank Ms. Yingxia Wu especially for her help of the FACS analysis.
Author Disclosure Statement
No competing financial interests exist.
Funding Information
This work was funded by grants from National Natural Science Foundation of China (NSFC 81871111 and 32071433 to F.L., 32070778 to S.W., 31930058 to Z.S.); Guangdong Basic and Applied Basic Research Foundation (2020B1515020044 to F.L., 2019A1515011552 to S.W.).