
Abstract
Lupus nephritis (LN) is the common complication of systemic lupus erythematosus. The pathogenesis of LN kidney injury is unclear. In addition to systemic (extrarenal) immune cells, local (intrarenal) immune cells residing in “kidney regional immunity” are momentous in LN. Mesenchymal stem cell (MSC) therapy is effective for LN. However, mechanisms of MSC therapy remains unclear. In this study, we first systematically investigated the effects of MSC on immune cells in kidney regional immunity in LN using single-cell sequencing. We found that MSC reduced proinflammatory central memory CD4+ T cells, cytotoxic tissue-resident memory CD8+ T cells and exhausted CD8+ T cells, increased anti-inflammatory Naive/Effector CD8+ T cells and type 1 regulatory T cells; reduced infiltrating proinflammatory Ly6c hi/inter/lo era2+ macrophages, increased anti-inflammatory resident macrophage and Ly6c lo ear2− macrophage; and reduced long-lived plasma cells and proinflammatory neutrophils and dendritic cells. This study laid a foundation for clinical applications of MSC.
Introduction
Systemic lupus erythematosus (SLE) is a chronic systemic autoimmune disease affecting multiple organs [1]. Its pathogenesis is not well understood. A variety of factors lead to the dysfunction of immune regulation [2]. A large number of autoantibodies [such as anti-dsDNA antibodies, antinuclear antibodies (ANA)] are generated, forming the deposition of immune complex (IC) in the kidneys, and leading to immune inflammation [3,4]. Lupus nephritis (LN) is the most common and serious complication [5].
The pathogenesis of LN kidney injury is unclear. The activation of systemic (extrarenal) immune cells can cause renal local immune response involved in the occurrence of LN kidney injury. In addition, the activation of local (intrarenal) immune cells also plays a more important role in LN [6,7]. Kidney has unique anatomical structure and microenvironment. During kidney injury, infiltrated immune cells from peripheral blood and local resident immune cells in kidneys together form the “kidney regional immunity” [8]. The latter may have a unique immune regulatory function in the kidneys, maintaining regional immune homeostasis and forming local defenses in the kidneys [9]. Several studies found that inflammation of the kidneys during the course of LN may be associated with regional immune disorders [10,11].
It has been found that there is a significant increase of dendritic cells (DC) in the kidney tissues in LN, which function as antigen presentation to amplify inflammation [12]. In LN, Ly6c− tissue-resident macrophages and Ly6c+ monocyte-derived macrophages take on a mixed anti-inflammatory, proinflammatory, and wound healing profile [11]. Tissue-resident memory T cells (Trm), effector memory T cells (Tem), and central memory T cells (Tcm) are also found in renal tissues in LN [13 –15]. A significant increase in the number of CD8+CD103+Trm cells in the kidney tissues in LN leads to inflammation and injury of the kidneys [16]. Tem and Tcm are also involved in renal regional immunity in LN, but their role is unclear [17]. Treg cells in LN patients are lower than those in healthy people, and increasing the proportion of Treg cells in renal immune cells is also a strategy for LN treatment [18].
In addition, long-lived plasma cells (LLPCs) exist in the kidney tissues of LN, which can produce autoantibodies in the local kidney tissues, form IC in the local kidneys, activate neutrophil and DC, and lead to kidney inflammation [19]. Therefore, effective correction of regional immune dysregulation in LN may be a crucial target for LN.
At present, immunosuppressive agents and hormones are commonly used in the treatment of LN [20]. But, prolonged use of these drugs causes the deficiencies of immune system leading to adverse reactions and even death [21]. Mesenchymal stem cells (MSCs) are nonhematopoietic, multipotent stromal precursor cells resident in most adult tissues. They have reparative potential through their self-renewal and differentiation capabilities and are increasingly recognized as being able to have immunomodulatory activity on a variety of immune cells [22]. MSCs can modulate immune responses during chronic inflammation by regulating the recruitment, function, and fate of cells in the innate and adaptive immune system. These properties make MSC an attractive and promising cell therapy for chronic inflammatory diseases [23].
Animal and clinical studies have shown that MSC therapy is safe and effective for SLE [24,25]. In lupus, MSCs reduced disease severity in the lpr-mutant model of SLE by inhibiting the proliferation of T cell populations and inducing the expansion of Treg cells. MSCs may also ameliorate LN kidney injury by reducing macrophage infiltration and polarizing macrophages into an anti-inflammatory phenotype [26]. Currently, a multicenter clinical study has found that MSC therapy is safe and beneficial for patients with LN who are refractory to current therapies [27].
However, most studies on the treatment of LN by MSCs only focus on observing the changes of a specific immune cell subset, such as Treg, cytotoxic T lymphocyte (CTL), B cells, and macrophages, and there is no systematic and comprehensive study on the effects and mechanism of MSCs on the immune response in the renal region. Therefore, to explore how MSC regulates the infiltrating and resident immune cells in LN renal region immunity is a key issue worth investigating. In this study, we systematically investigated the regulatory effects of MSC therapy on various immune cells in the kidneys of LN using single-cell RNA sequencing. We found some novel immune cell subsets in renal regional immunity. This study provides an initial insight into the local immune mechanisms of MSC in LN, laying the theoretical foundation for future clinical applications of MSC in LN.
Materials and Methods
Animals
The animal experiments in this study were conducted in accordance with the experimental protocol approved by the Medical Ethics Committee of the Chinese PLA General Hospital (Ethic Approval No. SQ2021209). Thirty female MRL/lpr mice (as LN model) and 10 female BALB/C mice (4 weeks of age) were used. These animals were obtained from the Shanghai SLAC Laboratory Animal Company Limited (Shanghai, China). The animals were housed in the Medical Experimental Animal Center of the Chinese PLA General Hospital in a specific pathogen-free environment with a 12-h light–12-h dark cycle, and the temperature was maintained at 24°C–26°C.
Transplantation protocol of MSCs
All umbilical cord MSCs used in this experiment were obtained from Qingdao Hualing Aoyuan Bioengineering Technology Group Co., Ltd. MSC isolation and culture were performed in accordance with the standardized operating procedures of the Stem Cell Research Center. A fourth-generation MSC was used for the treatment. The 16-week-old MRL/lpr mice showed high levels of urinary albumin/creatinine ratio (ACR), indicating the occurrence of LN. Then, the mice were randomized into three groups: (1) the control group, age-matched BALB/C mice (n = 10); (2) the LN model group, MRL/lpr mice were injected with 1 mL normal saline (NS) through the tail vein (n = 14); and (3) the MSC group, MRL/lpr mice were injected with MSCs (1 × 10⁶ cells, 1 mL) through the tail vein (n = 14). Mice in each group were injected with NS or MSCs at 16, 18, 22, and 24 weeks of age, respectively. After treatment, random urine samples were taken every 2 weeks. At 26 weeks of age, 24-h urine samples were taken and mice were anesthetized and sacrificed.
Evaluation of kidney coefficient and spleen coefficient
Body weight of the mice was acquired before euthanasia. The organs were weighed. Organ coefficients were calculated as follows: kidney coefficient = 100 × kidney weight/body weight (g/100 g); spleen coefficient = 100 × spleen weight/body weight (g/100 g) [28].
Analysis of serum and urine samples
The urinary protein concentration was determined by the Albumin Assay Kit (Abcam, USA). The creatinine concentration was measured by the Cayman Urinary Creatinine Kit (Cayman, USA). Urinary ACR was calculated to evaluate mouse urine protein excretion. Concentrations of serum creatinine and urea nitrogen were measured using an automatic biochemical analyzer. Concentrations of serum anti-dsDNA and serum ANA were measured using the ELISA Kit (ADI, USA).
Kidney pathological analysis
Kidney tissues from mice fixed in formaldehyde solution for 2 days was dehydrated, embedded, and sectioned (2 μm). Hematoxylin–Eosin (HE) and periodate Schiff (PAS) staining were used to observe the pathological changes. Images were collected using a light microscope (BX53F; OLYMPUS). Renal histopathology was assessed by an experienced pathologist.
Kidney immunofluorescent staining
After the paraffin sections were dewaxed, 2 μm sections were placed in water. Antigen recovery was carried out using citrate solution for 10 min at high temperature. The sections were blocked in sheep serum blocking solution (ZSGB-Bio, ZLI-9022) for 1 h and then incubated with PBS diluted primary antibody for 24 h (4°C). The following antibodies were used: IgM (1:50), IgG (1:50), C3(1:50), CD49b (1:100), Lag-3(1:100), and Foxp3(1:100). The sections were then incubated with secondary antibody and DAPI, respectively, and then mounted on slides. Images were acquired using a digital confocal microscope (FV1000-D; OLYMPUS).
Flow cytometry analysis
We prepared and stained kidney single-cell suspensions as described previously in the literature [29]. The antibody was added into 100 μL single-cell suspension tubes of kidney and incubated for 30 min at room temperature in the dark. The erythrocytes were lysed with lysis buffer for 5 min. The following antibodies were purchased from BioLegend: CD45, CD4, CD49B.LAG-3, CD226, CD11B, F4/80, and Ly6c; Dead kidney cells were excluded by staining with the Zombie Aqua™ Fixable Viability Kit (BioLegend). Data were analyzed by FlowJo V. 10.0.7 software.
Antibody array analysis
The antibody microarrays steps were conducted by RayBiotech (Guangzhou, China). The kidneys homogenates (three kidneys from LN and three kidneys from MSC) were analyzed with a glass slide-based antibody cytokine array, including 200 proteins (GSM-CAA-4000-1; RayBiotech). Laser fluorescence scanning (GenePix 4000B scanner) was used to visualize the signals. Signal intensity data after background subtraction and normalization were exported directly into the RayBio Analysis Tool software.
10 × single-cell RNA sequencing
CD45+ immune cells were enriched by positive selection from kidneys for single-cell analysis. Before magnetic enrichment, kidneys were minced in Roswell Park Memorial Institute 1640 containing 5% fetal bovine serum, 0.25% Trypsin (Thermo Fisher), and 10 μg/mL DNase I (Sigma), and then incubated at 37°C with gentle rocking for 10 min. CD45+ immune cells were magnetically labeled and enriched by positive selection (Miltenyi Biotec). Cells were diluted with Trypan Blue and counted using a hemocytometer. Kidneys from three different mice were pooled per sample, and two samples were prepared according to the MSC transplantation condition. For a target of 5,000 single cells, 8–9,000 live cells were loaded onto the Chromium Controller (10 × genomics).
Single-cell mapping and clustering
The unique molecular identifiers counts for each gene in each cell were imported into R software (version 4.1.2) by Seurat package (version 4.0.5). Quality control was assessed priorly, by filtering out cells with the following criteria: <200 or >6,000 unique genes expressed, or >6% of reads mapping to mitochondria, resulting in a final dataset of 25,945 cells (12,051 from the LN group and 13,894 from the MSC group). Sequencing data from each group was further normalized and scaled, and detected for highly variable features by using Normalized function, ScaleData, and FindVariableFeartures function, respectively, in Seurat package. Thereafter, principal component analysis (PCA) and linear dimensional reduction based on the selected top 3,000 high variable genes on the scaled data were performed. Subsequently, cells were clustered into 20 groups for leukocytes different types of identification using FindNeighbors and FindClusters function in Seurat package.
Differential expression analysis
Marker genes in each cluster were determined using Wilcoxon Rank-Sum test through the FindAllMarkers function in Seurat, with a false discovery rate adjusted P-value cutoff of 0.05. Differential expressed genes (DEGs) in individual cell type between different experimental conditions and between different cell clusters were recognized under limitation of an estimated log fold change >0.25 and detectable expression in >10% of cells in any of the compared cell cluster by FindMarkers function in Seurat. Relevant cell marker gene expression was visualized on Violin Plot to illustrate specific cell genotypes.
Functional enrichment analysis
Gene ontology (GO) and kyoto encyclopedia of genes and genomes (KEGG) enrichment analysis was performed on Metascape (
Cell development trajectories construction
Single-cell pseudotime trajectories of monocyte/macrophage populations were reconstructed by Monocle 2 (version 2.22.0) package. Genes used for pseudotime ordering were taken from DEGs identified by function differential GeneTest with full Model Formula Stri set. Dimension reduction and cell ordering along the trajectories were completed with DDRTree method.
Cell–Cell interaction/communication analysis
We conducted cell–cell interaction analysis utilizing cellphonedb function curated by the CellPhoneDB database. The significant cell–cell interactions were selected with P < 0.01.
Statistics
Data are presented as mean ± standard deviation. The Kolmogorov–Smirnov test normality test was conducted for all data in the article using GraphPad Prism 8.0.1 software. The data from analysis of serum and urine samples, kidney and spleen coefficient, kidney pathological, and kidney immunofluorescent staining were compared using one-way analysis of variance followed by post hoc Tukey's multiple comparison tests. Other data from flow cytometry and immunofluorescence costaining were compared using the Mann–Whitney U test. Statistical significance is expressed as follows: No significance; *P < 0.05; **P < 0.01.
Results
MSC transplantation increased survival rate and improved renal function in LN mice
LN mice were injected intravenously with MSCs or NS at 16 weeks of age, and were repeatedly injected after 2, 6, and 8 weeks (Fig. 1A). At 10 weeks after treatment, mortality was 50% in the LN group and 21.4% in the MSC group (Fig. 1B). At 6 weeks after treatment, urinary ACR began to decrease in the MSC group compared with the LN group (Fig. 1C). Compared with the LN group, the ratio of kidney weight/body weight (Kidney Coefficient) and spleen weight/body weight (Spleen Coefficient) in the MSC group were lower (Fig. 1D, E). Compared with the LN group, MSCs also reduced the level of 24-h urine protein (Fig. 1F-a), urinary ACR (Fig. 1F-b), serum creatinine (Fig. 1F-c), and blood urea nitrogen (BUN; Fig. 1F-d).

MSC transplantation increased the survival rate and improved renal function in LN mice.
MSC transplantation improved renal pathological injury in LN mice
After treatment of 10 weeks, compared with the LN group, HE and PAS staining showed a significant reduction in mesangial cell proliferation, tubular lesion, and inflammatory cell infiltration in the MSC group (Fig. 2A, B. Supplementary Fig. S1A). Compared with the LN group, the electron-dense deposits under glomerular epithelial cells or endothelial cells, and podocyte effacement were significantly less in the MSC group than the LN group (Fig. 2C, Supplementary Fig. S1B). Compared with the LN group, MSCs reduced deposition of IgM, IgG, and C3 (Fig. 2D, Supplementary Fig. S1C). Compared with the LN group, MSCs also reduced the level of anti-dsDNA and ANA in serum (Fig. 2E, F).
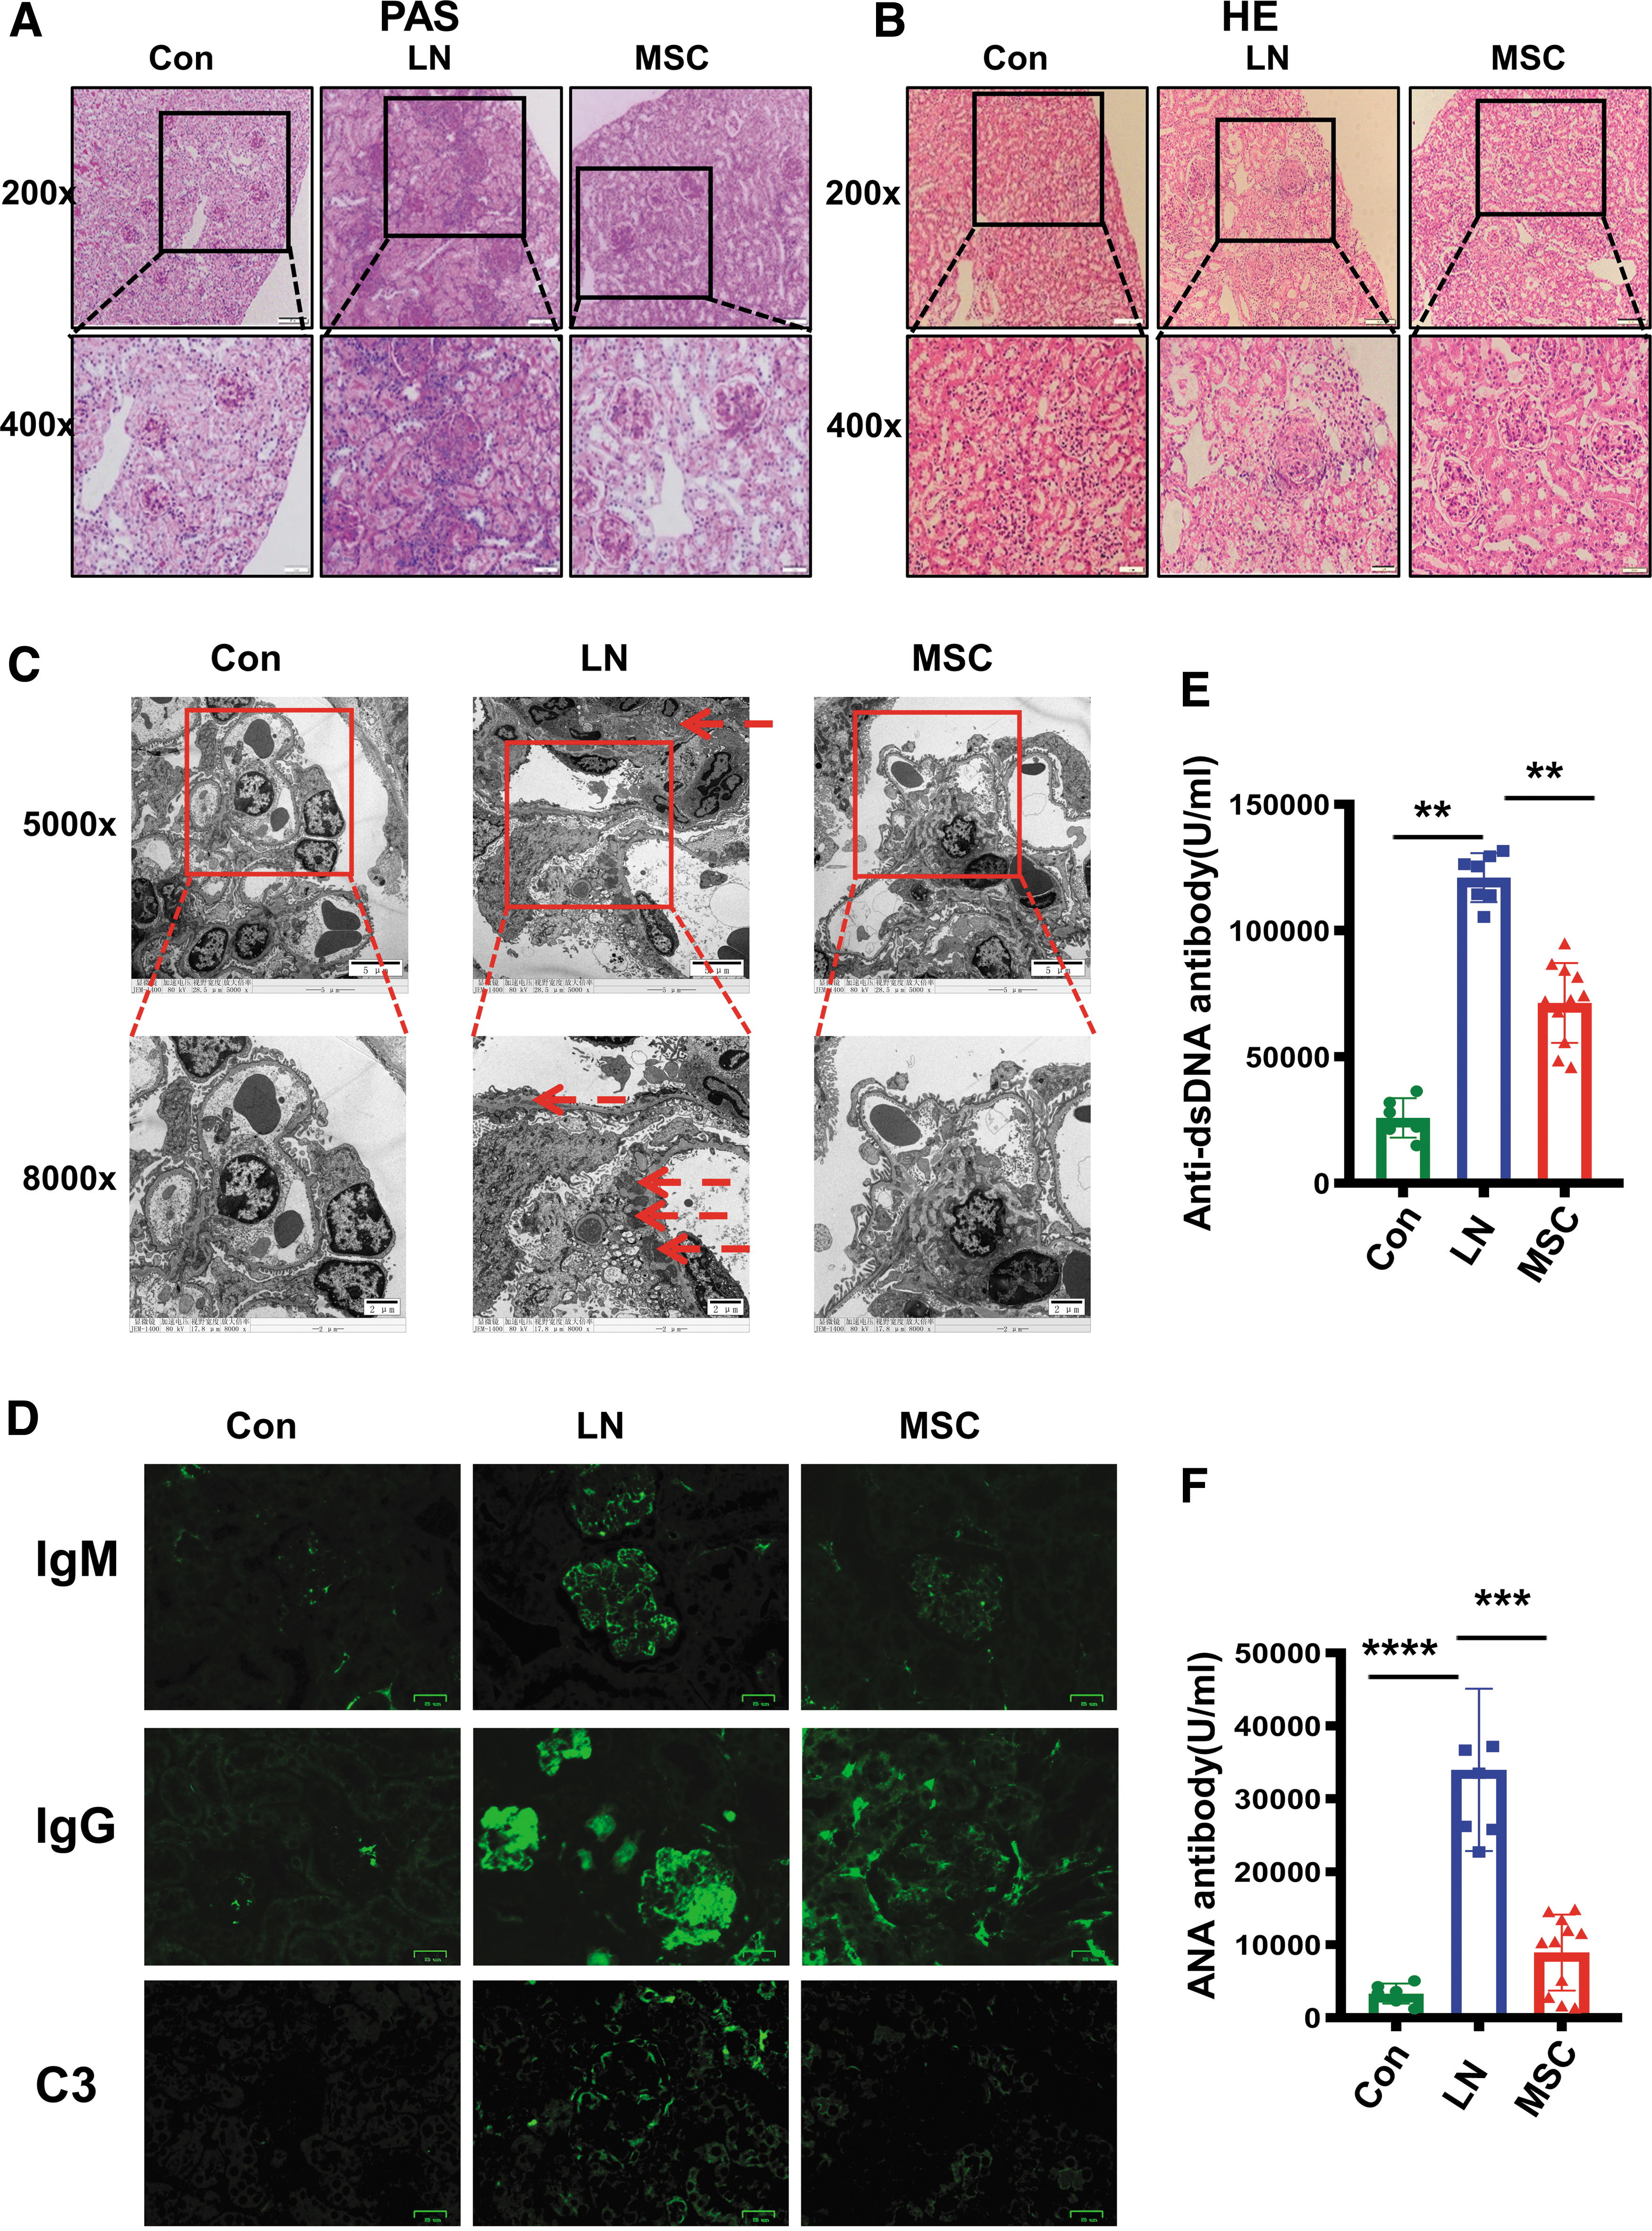
MSC transplantation improved renal pathological injury, reduced deposition of IgM, IgG, and C3 in renal tissues, and decreased concentrations of serum anti-ds-DNA and ANA in LN mice.
MSC downregulated the expression of renal inflammation-related proteins in LN mice
RayBiotech antibody microarrays were used to identify renal inflammation
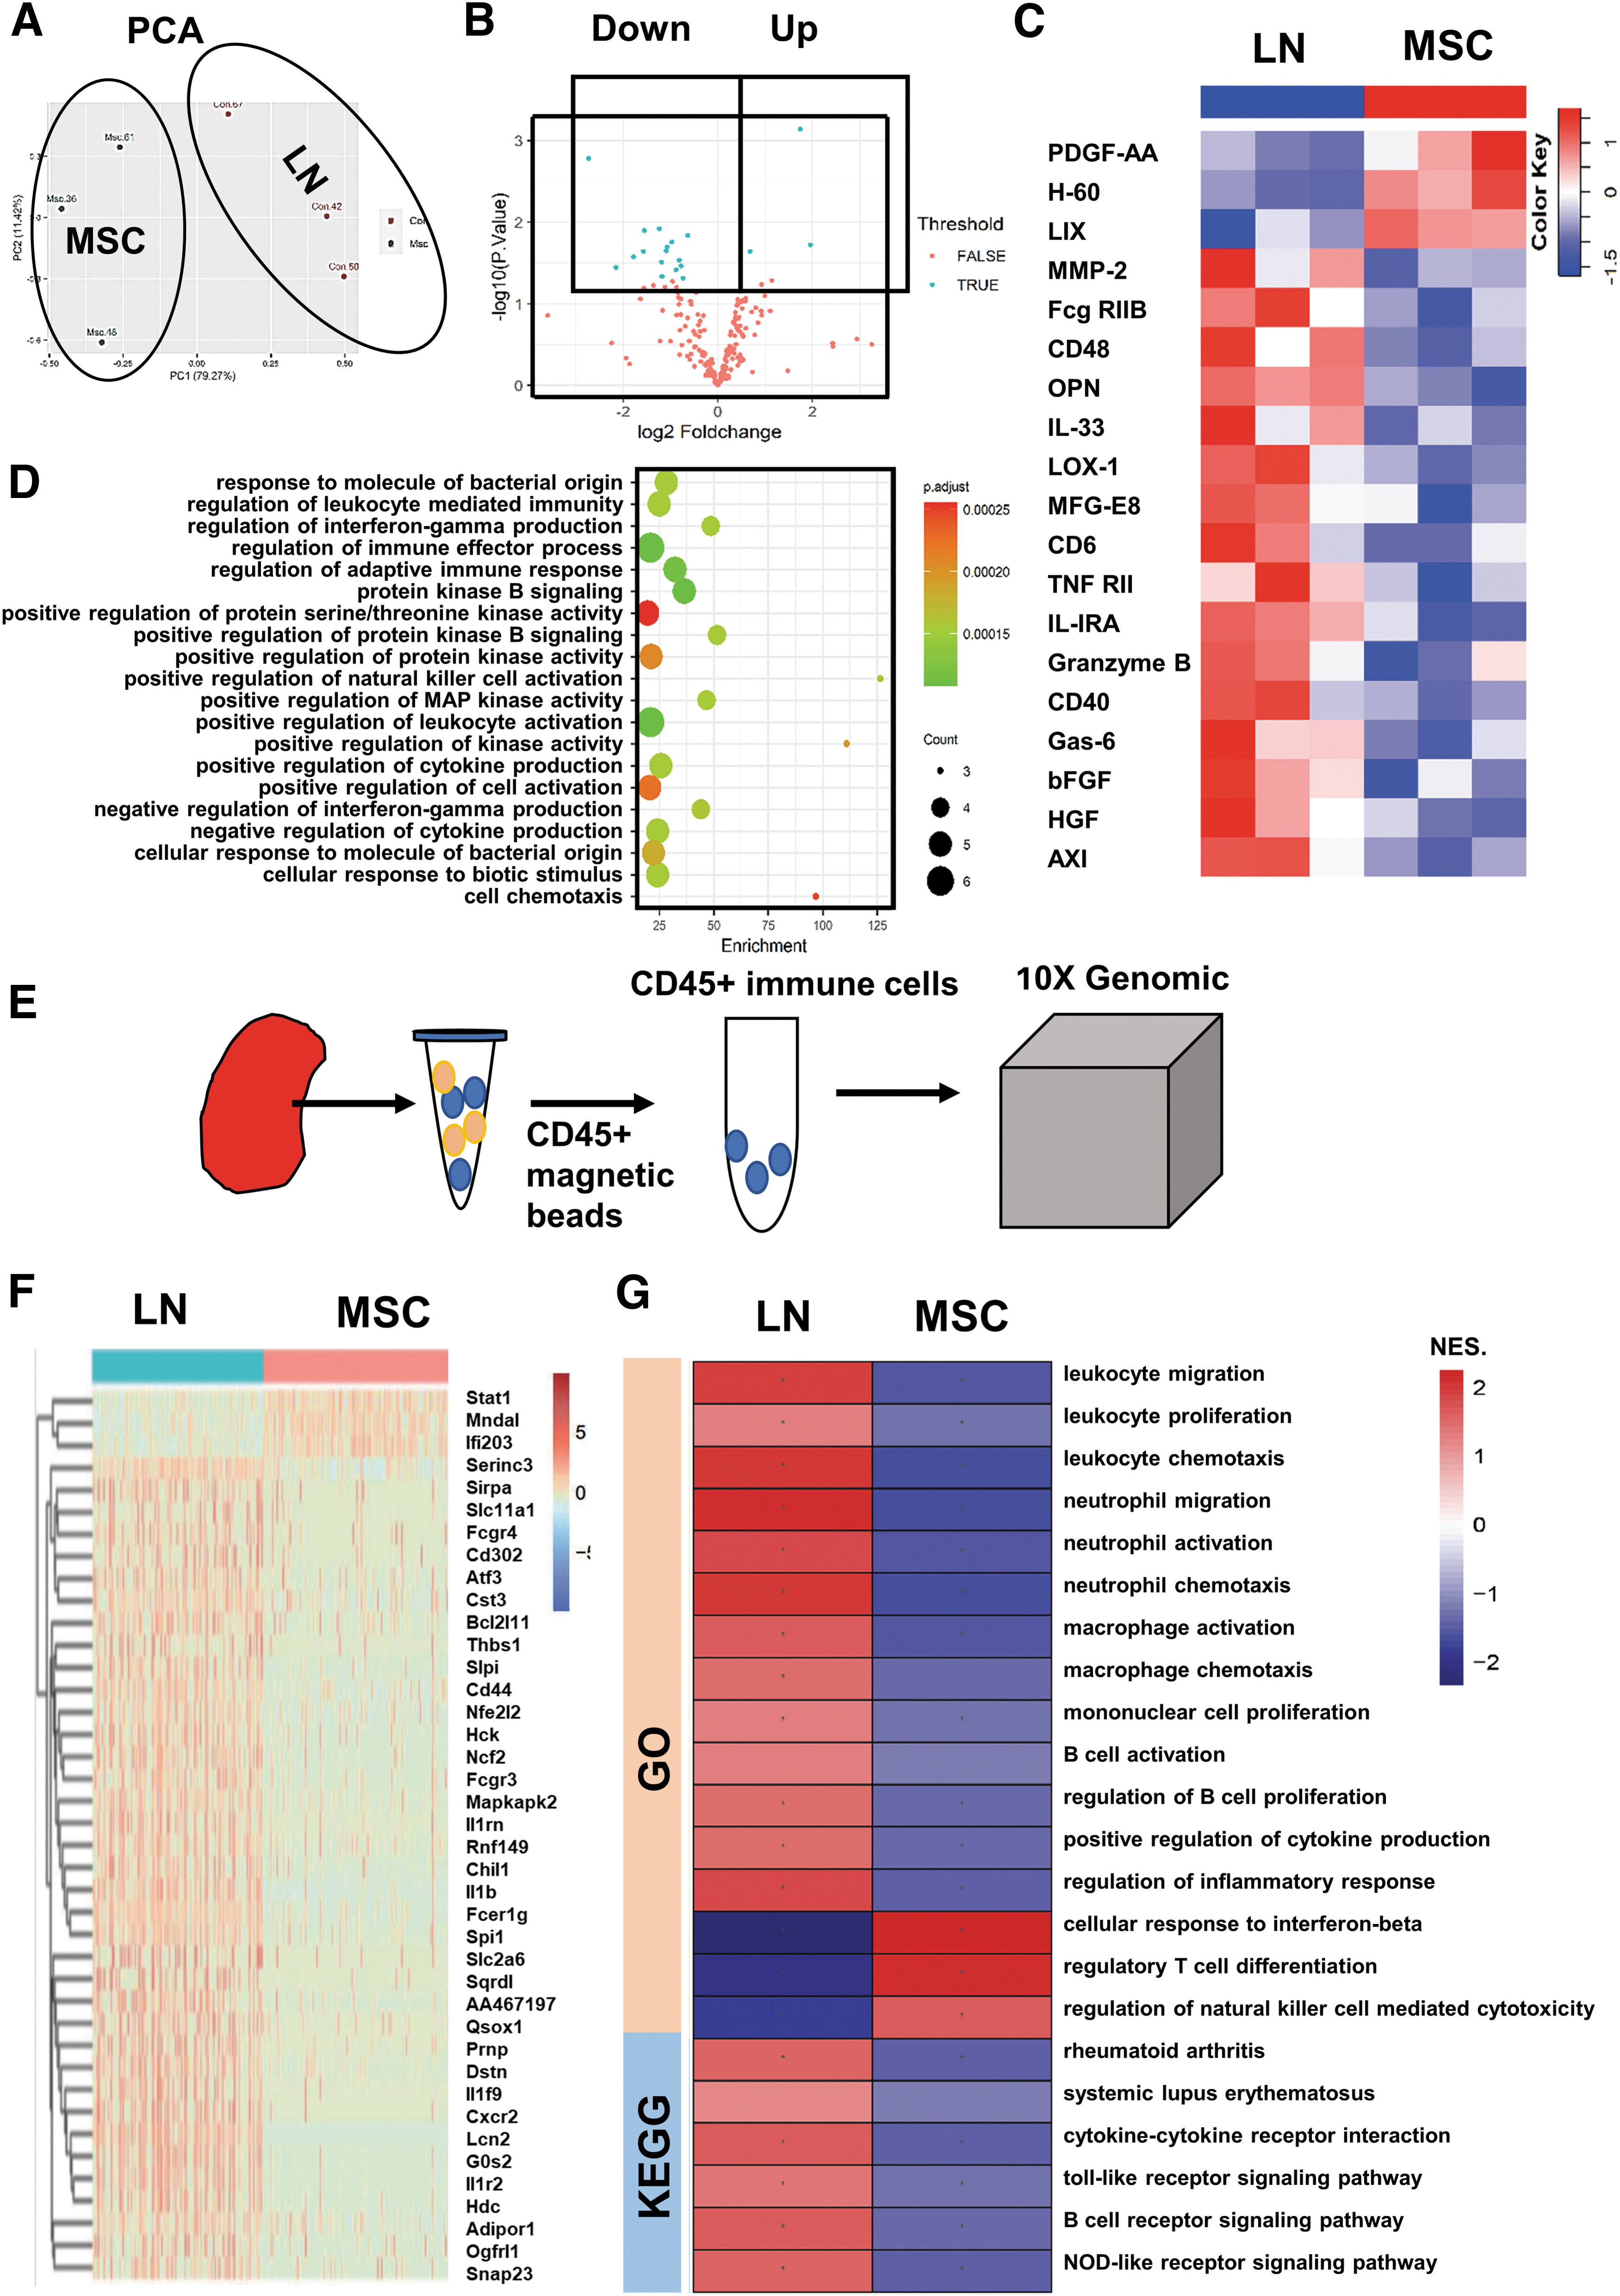
MSCs downregulated the expression of renal inflammatory proteins and the immune activation pathway of immune cells in LN mice. The kidney cytokines were detected by RayBiotech antibody array. The analysis of renal immune cells by Single-Cell RNA Sequencing.
MSC significantly downregulated expression of immune-related genes in renal immune cells in LN mice
Single-cell RNA sequencing for CD45+ renal immune cells (Fig. 3E) revealed that MSC affected the activity of various immune-related pathways by altering the expression levels of immune-related genes in renal immune cells. Compared with the LN group, the expression of genes in the immune cells in the MSC group was downregulated, and only a few genes were upregulated (e.g., Mndal, Ifi203, STAT1) (Fig. 3F). GSEA analysis was performed to determine whether immune-related pathways were up- or downregulated between the two groups. GSEA analysis of GO showed that, compared with the LN group, MSCs downregulated the pathways of immune cells activation/proliferation/chemotaxis, while upregulated the pathways of regulatory T cells (Treg cells) and interferon-β (Fig. 3G). GSEA analysis of KEGG showed that immune disease-related pathways and receptor-mediated signaling pathway were downregulated in the MSC group (Fig. 3G).
MSC significantly changed the immune cell landscape in renal regional immunity in LN mice
Using scRNA-Seq, we identified 25945 CD45+ immune cells (12,051 cells from the LN group and 13,894 cells from the MSC group). In the merged samples of LN and MSC, based on the expression of typical lineage markers and other genes specifically upregulated in each cluster, we identified them as CD4+T cells, CD8+T cells, double-positive T cells (DPT), double-negative T cells (DNT), DC, macrophages, B cells, neutrophils, natural killer (NK) cells, and unknown cells (Fig. 4A). CD4+T cells expressed CD3E and CD4; CD8+T cells expressed CD3E and CD8A; DPT cells expressed CD3E, CD4, and CD8A; DNT cells only expressed CD3E with lack of CD4 and CD8A; DC expressed CD68 and CD11C (Itgax); macrophage expressed CD68; B cell expressed CD79a; neutrophil expressed S100a9; NK lacked CD3E expression (Fig. 4B).
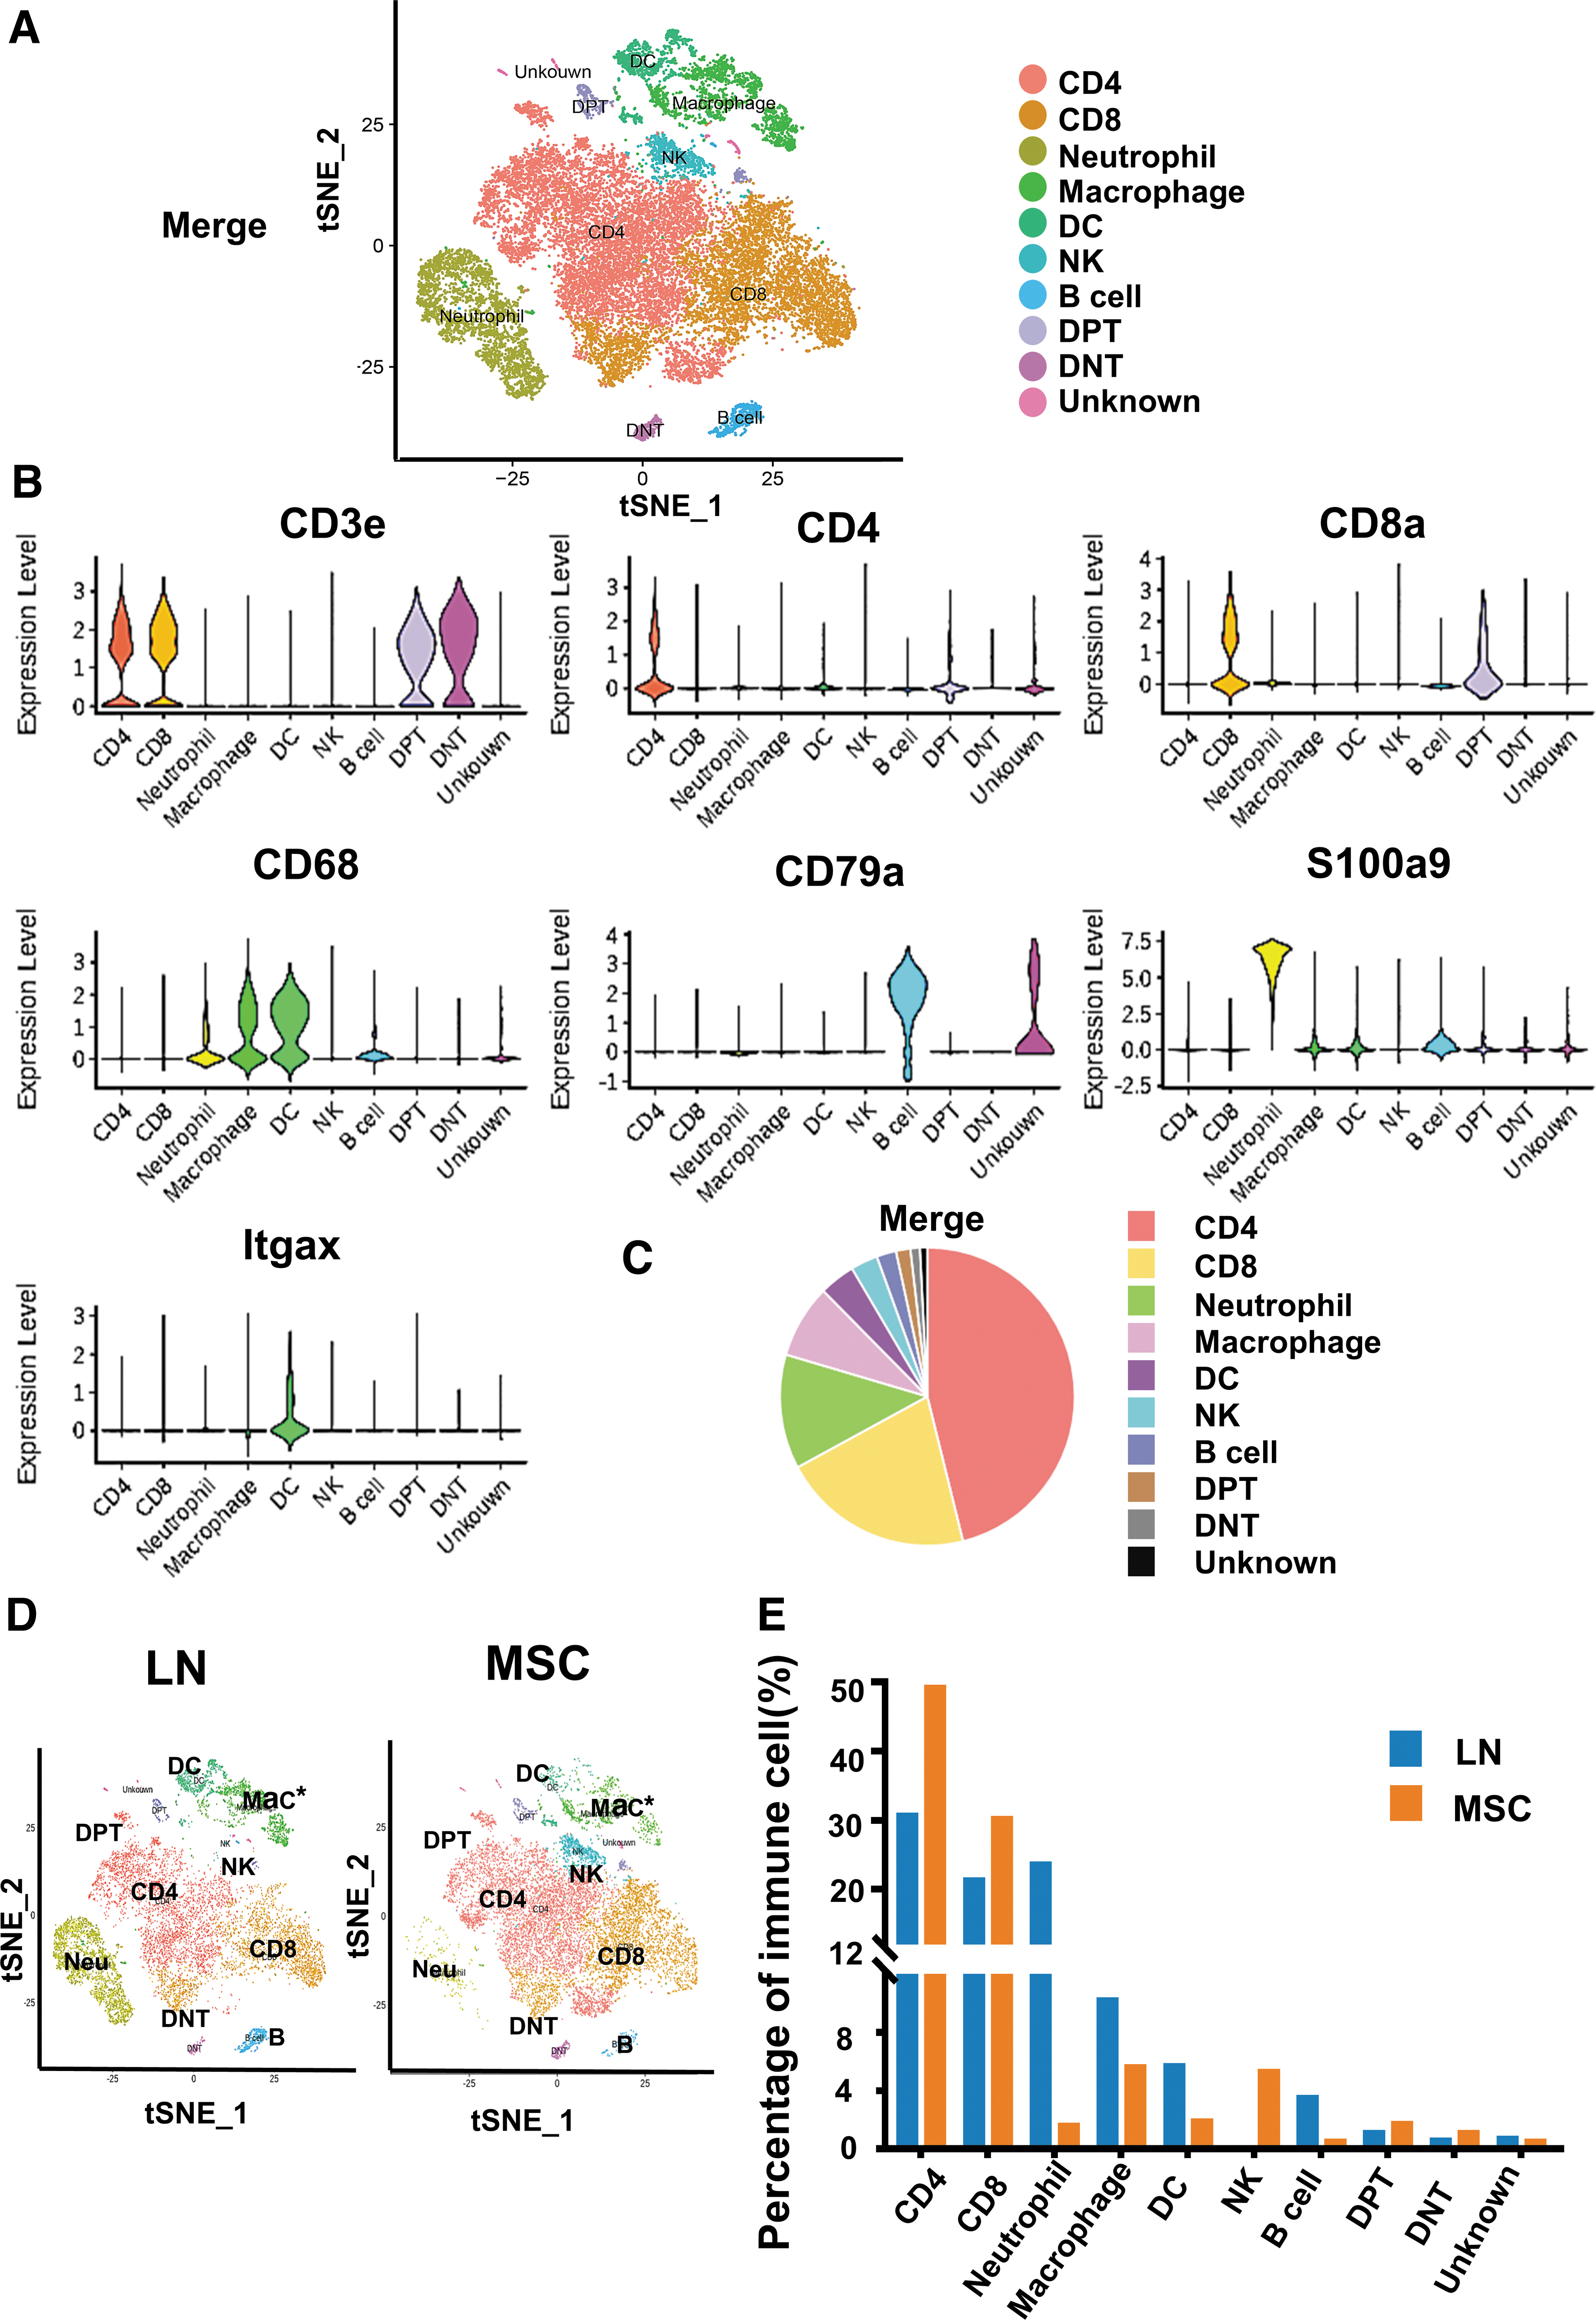
Single-cell RNA sequencing of renal CD45+ immune cells identified 10 distinct immune cell subpopulations in LN and MSC-treated mice.
*Correction added on May 22, 2023 after first online publication of May 17, 2023: The panel D of Figure 4 has been corrected.
In the merged samples of LN and MSC, the proportion of T lymphocytes in immune cells was relatively high, followed by neutrophils, DC/macrophages, and the proportion of B cells and NK cells was relatively low (Fig. 4C). There were differences in renal immune cell landscape between LN group and MSC group (Fig. 4D). MSC treatment reduced neutrophils, DC/macrophages, and B cells, while increased NK cells (Fig. 4E; Supplementary Table S2).
MSCs reduced Tcm in CD4+T cells in renal regional immunity in LN mice
Once naive T lymphocytes are activated, they proliferate rapidly, producing effector cells that migrate to the site of inflammation [30]. According to the expression level of Ccr7, Effector T cells can be divided into Tcm and Tem [31]. Tem cells respond quickly to the stimulus and produces various effector molecules. Tcm cells have strong proliferation ability and can support and replenish Tem [32]. A recent single-cell sequencing study also found the presence of Tem and Tem in kidney biopsies from LN patients [17].
We identified five clusters of CD4+T cells in the merged kidney tissues: Effector memory CD4+T cells (Ccl5+), Central memory CD4+ T cells (Ccr7+), Foxp3 CD4+T cells (Foxp3+), Tr1 CD4+T cells (CD226+), and ISG-high CD4+T cells (ISG15+/ISG20+) (Fig. 5A–C). Central memory CD+4 T cells expressed Ccr7, while Effector memory CD4+T cells did not. We found that Central memory CD4+T cells in CD4+T cells were decreased in the MSC group, while Effector memory CD4+T cells did not change significantly (Fig. 5D; Supplementary Table S3). The pathways of activation of immune response, cytokine production in Tem and Tcm were more significantly enriched than Treg, Tr1, and ISG-high CD4+T (Fig. 5E). In addition, we also found that Tem was also associated with the pathways of negative regulation of immune activation. Therefore, compared with Tcm, Tem may have both proinflammatory and anti-inflammatory effects.
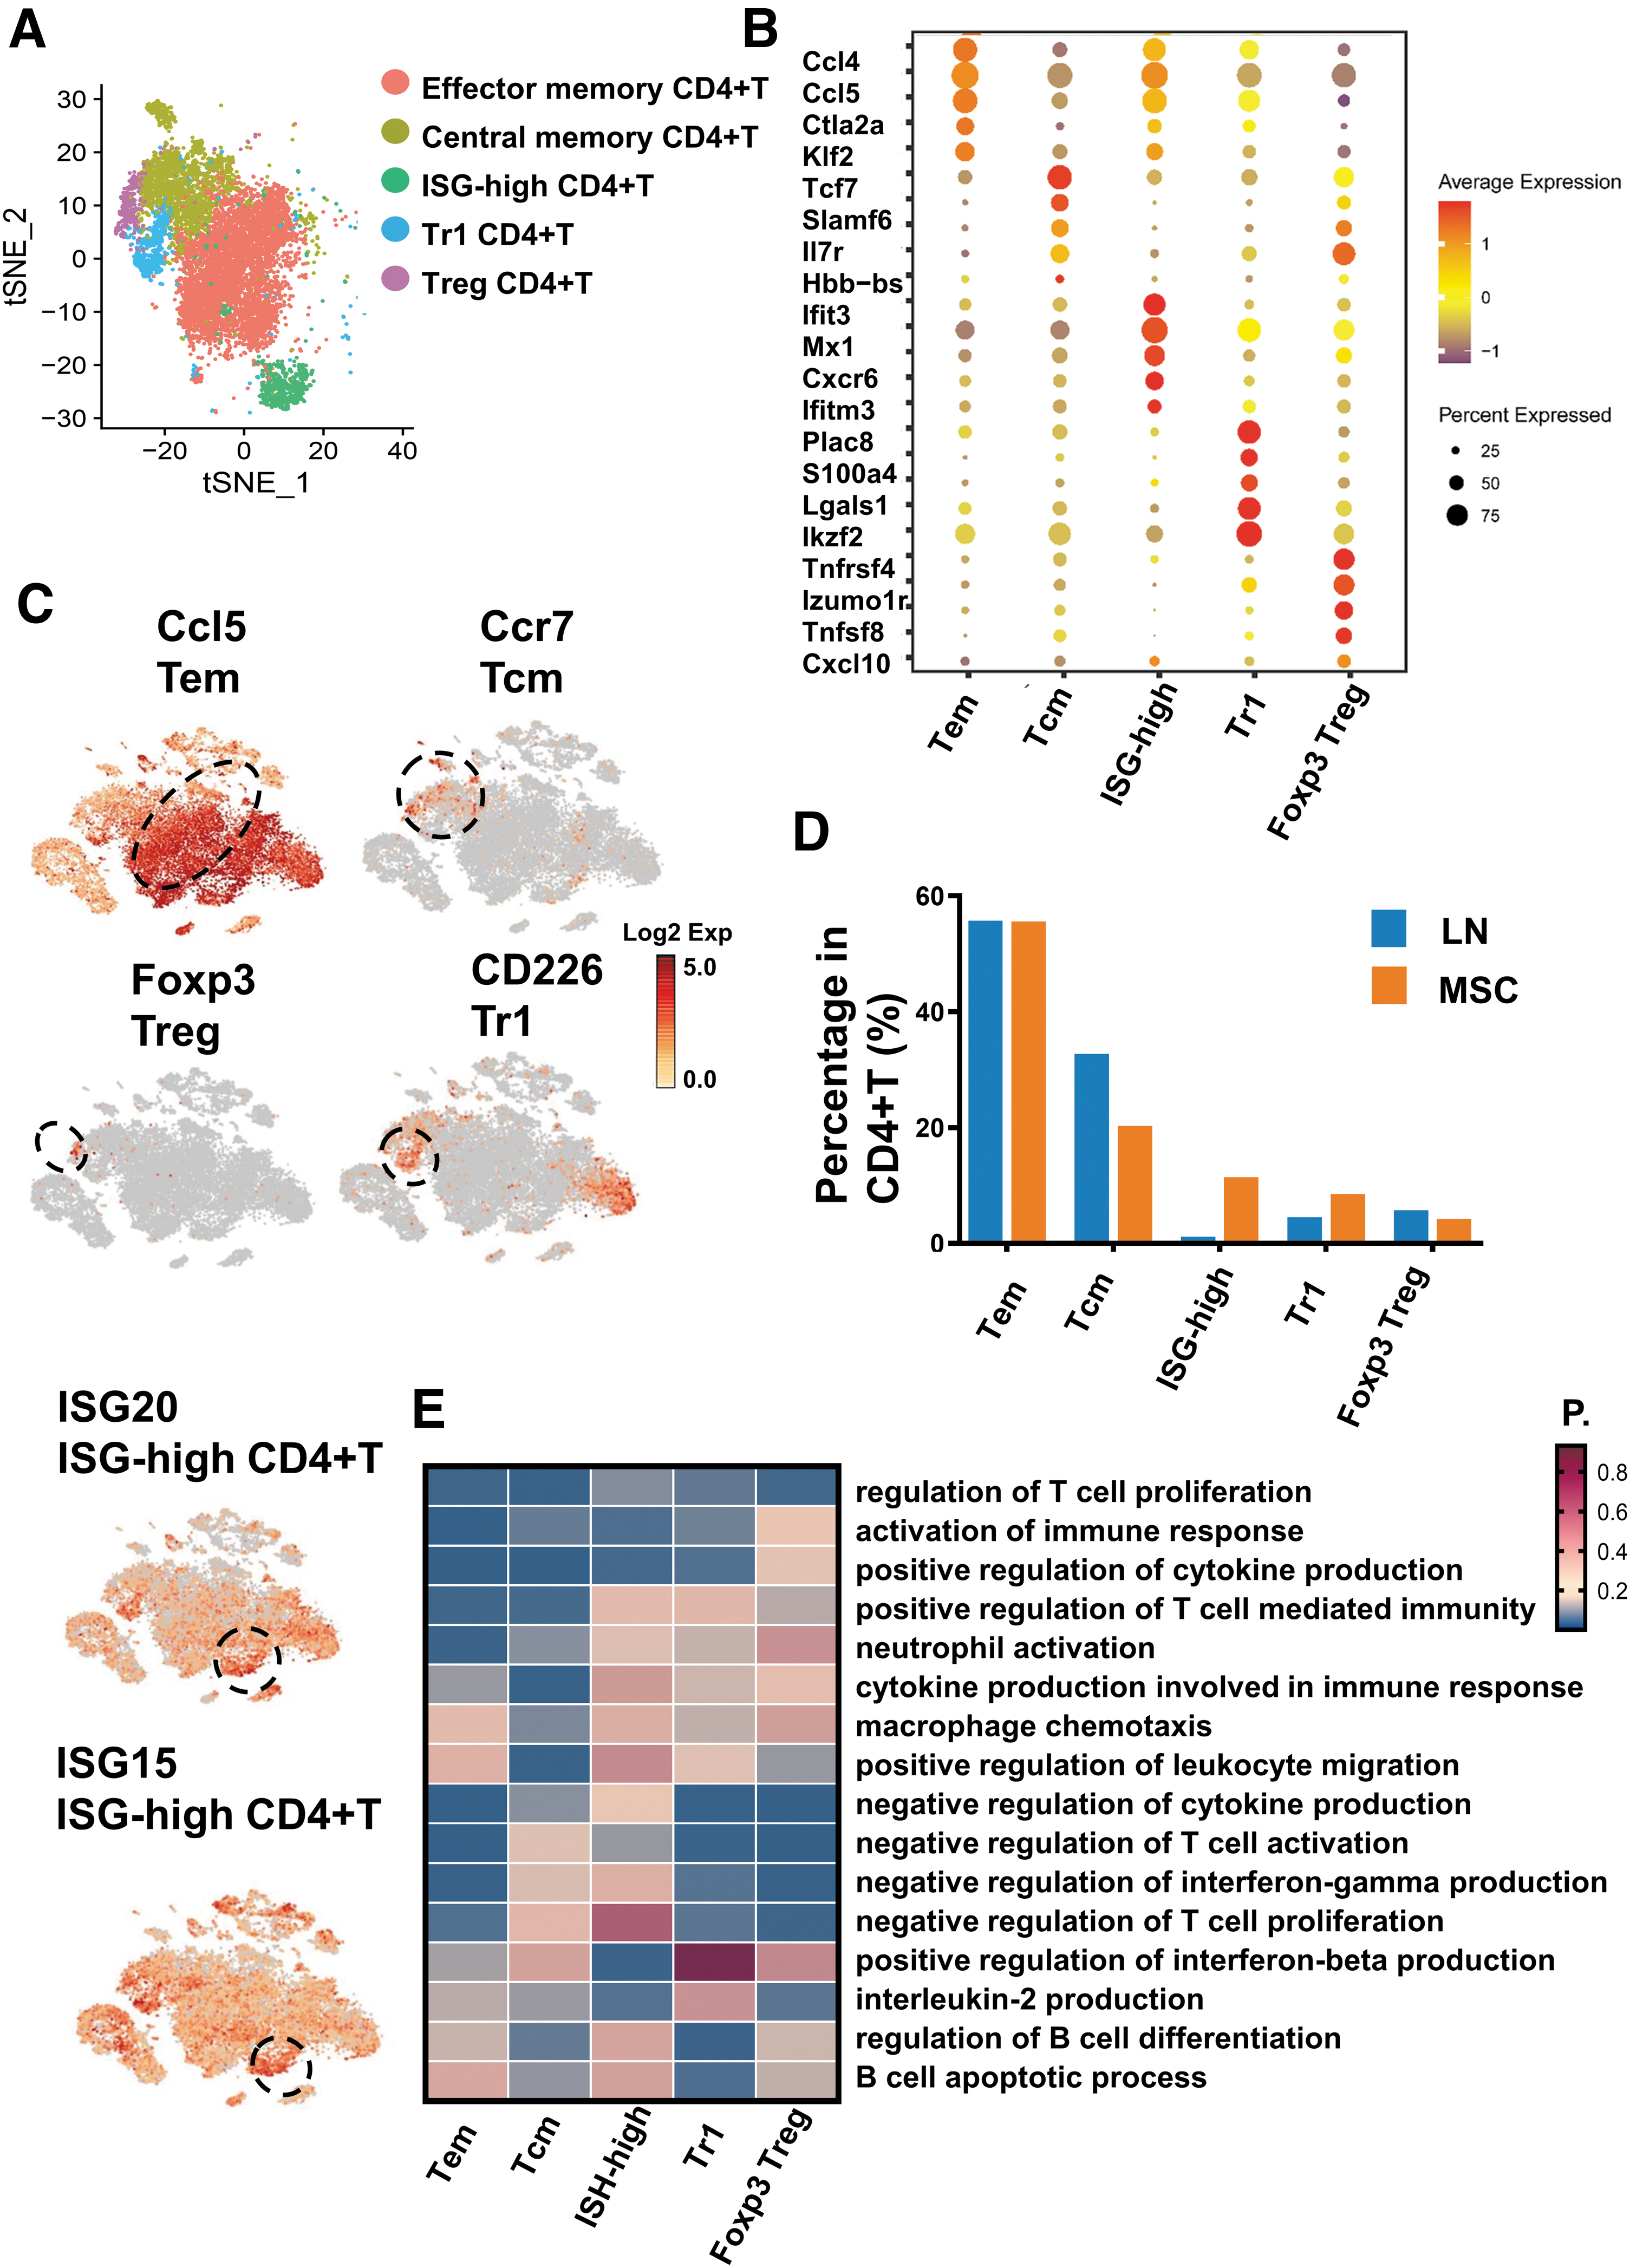
Single-cell RNA sequencing revealed the differences of CD4+T lymphocyte in the kidney tissues in LN and MSC-treated mice.
MSCs increased Tr1 Treg in CD4+T cells, not Foxp3 Treg, in renal regional immunity in LN mice
Treg cells can be recruited to the kidneys to play an immunosuppressive role during inflammation [18]. Treg cells may reside in the tissues for a long time and do not enter the circulation [31]. Treg cells can be divided into naturally generated natural Treg cells (nTregs) and induced adaptive Treg cells (aTregs or iTregs), such as Tr1 (type 1 Treg cell) and Th3 [33]. nTregs express the transcription factor Foxp3. Tr1 cells do not express Foxp3. Tissue-resident Treg cells may originate in the thymus (nTREG) or may be induced in peripheral tissues (iTREG). Both typically Treg cells and aTreg cells can inhibit immune inflammation [34].
We have identified two types of Treg cells in renal tissue by single-cell sequencing: Foxp3+ Treg and Tr1. Tr1 cells are marked by CD226, CD49b, and Lag3 [35,36]. Our results showed that Tr1 did not express Foxp3 but expressed CD226 (Fig. 5C). Tr1 and Foxp3 Treg cells showed similar gene expression (e.g., Tnfrsf4, CTLA-4, IL2ra, Tnfrsf18, Pdcd1, and Ikzf2) (Supplementary Fig. S2A), and these genes are also commonly expressed in Treg cells [37]. We found that the proportion of Tr1 cells in CD4+T increased after MSC transplantation, but there was no change in Foxp3 Treg (Fig. 5D). Functional enrichment of CD4+T cell subsets also showed that Foxp3 Treg and Tr1 may have similar functional characteristics. Foxp3 Treg and Tr1 CD4+T cells were associated with the pathways of negative immune cell activation and cytokine production. (Fig. 5E).
Therefore, we speculated that MSCs may exert its therapeutic effect on LN by Tr1 rather than Foxp3 Treg. To test this hypothesis, we analyzed the proportional changes in Tr1 and Foxp3 Tregs in renal tissues after MSC transplantation by flow cytometry and immunofluorescence. Renal tissue flow cytometry showed that the mean proportion of CD49b+ Lag3+CD4+ Tr1 cells in CD4+T in the LN group was 3.35%, while the mean proportion in the MSC group was 24.6%. Compared with the LN group, the proportion of Tr1 was significantly higher (P < 0.01), but there was no difference in the proportion of Foxp3 Treg between the two groups (P > 0.05; Fig. 6A–C). Kidney immunofluorescence showed similar results. Compared with the LN group, the counts of CD49b+ Lag3+ Tr1 cells was higher (P < 0.01; Fig. 6D, E). Thus, MSC seemed to have a greater regulatory effect on Tr1 cells in the kidney than Foxp3 Treg.
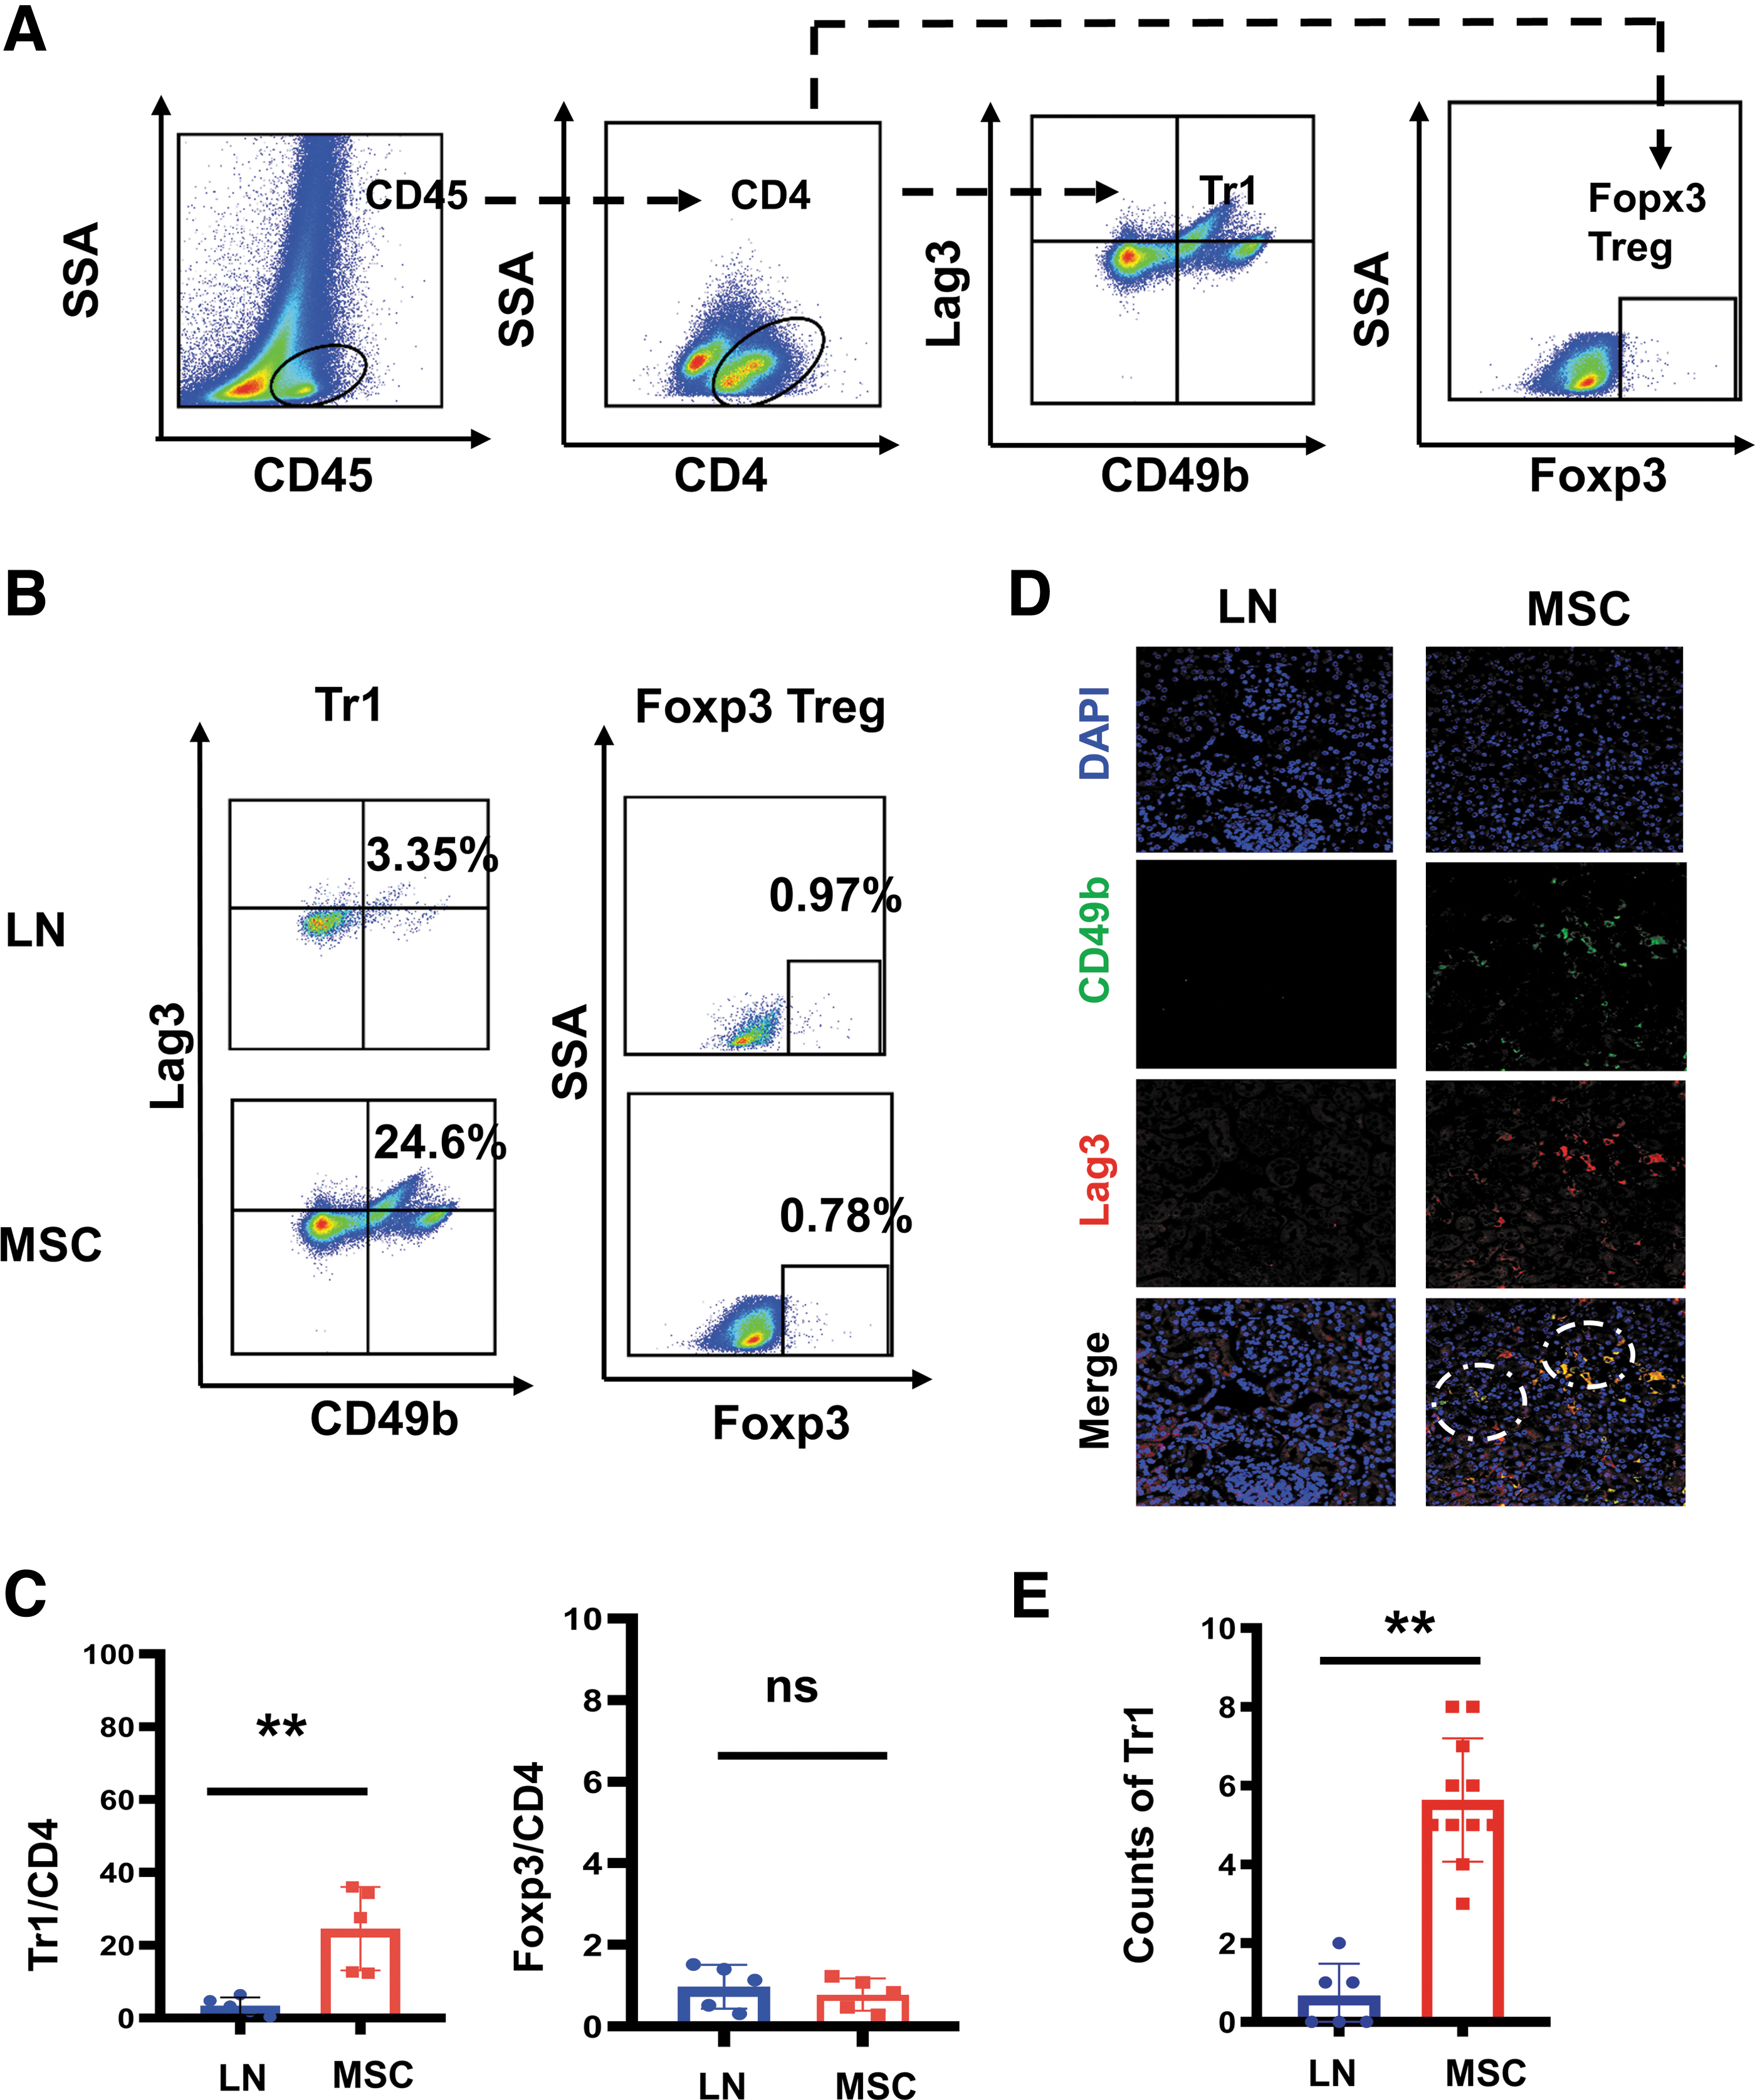
Flow cytometry and immunofluorescence revealed proportional differences of Foxp3 Treg, Tr1 in kidneys between the LN mice and the MSC-treated mice.
In addition, we also found that ISG-high CD4+T cells were increased and related to the pathways of positive regulation of interferon-beta production and interleukin-2 production (Fig. 5E), suggesting that this subset of cells may also have a renal protective effect.
MSCs reduced resident memory cytotoxic CD8+T cells (Trm CD8+T) in CD8+T cells in renal regional immunity in LN mice
In LN, CD8+T cells are heterogeneous after infiltrating into tissues [38]. In LN single-cell sequencing studies, CD8+T cells present different phenotypes in the kidneys: exhaustion T (Tex), Tem, Trm, CTL, etc. [17]. Trm is a subset of memory T cells residing in organs with high expression of CD69, CD49a, and CD103, and does not participate in systemic circulation [32,39]. Studies have shown that CD8+Trm cells are amplified in the kidneys of LN patients or MRL/lpr mice [40].
We identified three subsets of CD8+ T cells: cytotoxic CD8+ T cells (Gzmb+), exhausted CD8+ T cells (Pdcd1+), and Naive/Effector CD8+ T cells (Sell+/IL7r+) (Fig. 7A–C). We found that cytotoxic CD8+ T not only expressed CTL marker genes (Gzmb), but also specifically expressed tissue-resident memory markers, CD103(Itgae) and CD49a(Itga1) (Fig. 7C). In other words, Trm cells and cytotoxic CD8+T cells had the overlapped gene expression in LN, and both may be the same kind of CD8+T cells, resident memory cytotoxic CD+8 T cells (Trm CD8+T). MSCs reduced Trm CD8+T and exhausted CD8+T in CD8+T, while increased Naive/Effector CD8+T cells (Fig. 7D; Supplementary Table S4). Functional enrichment analysis for these CD8+T cell subsets (Fig. 7E) showed that cytotoxic CD8+ T cells and exhausted CD8+ T cells were associated with pathways of lymphocyte activation and cytokine production. Besides, cytotoxic CD8+ T cells were more related to the pathways of immune activation than exhausted CD8+ T cells.
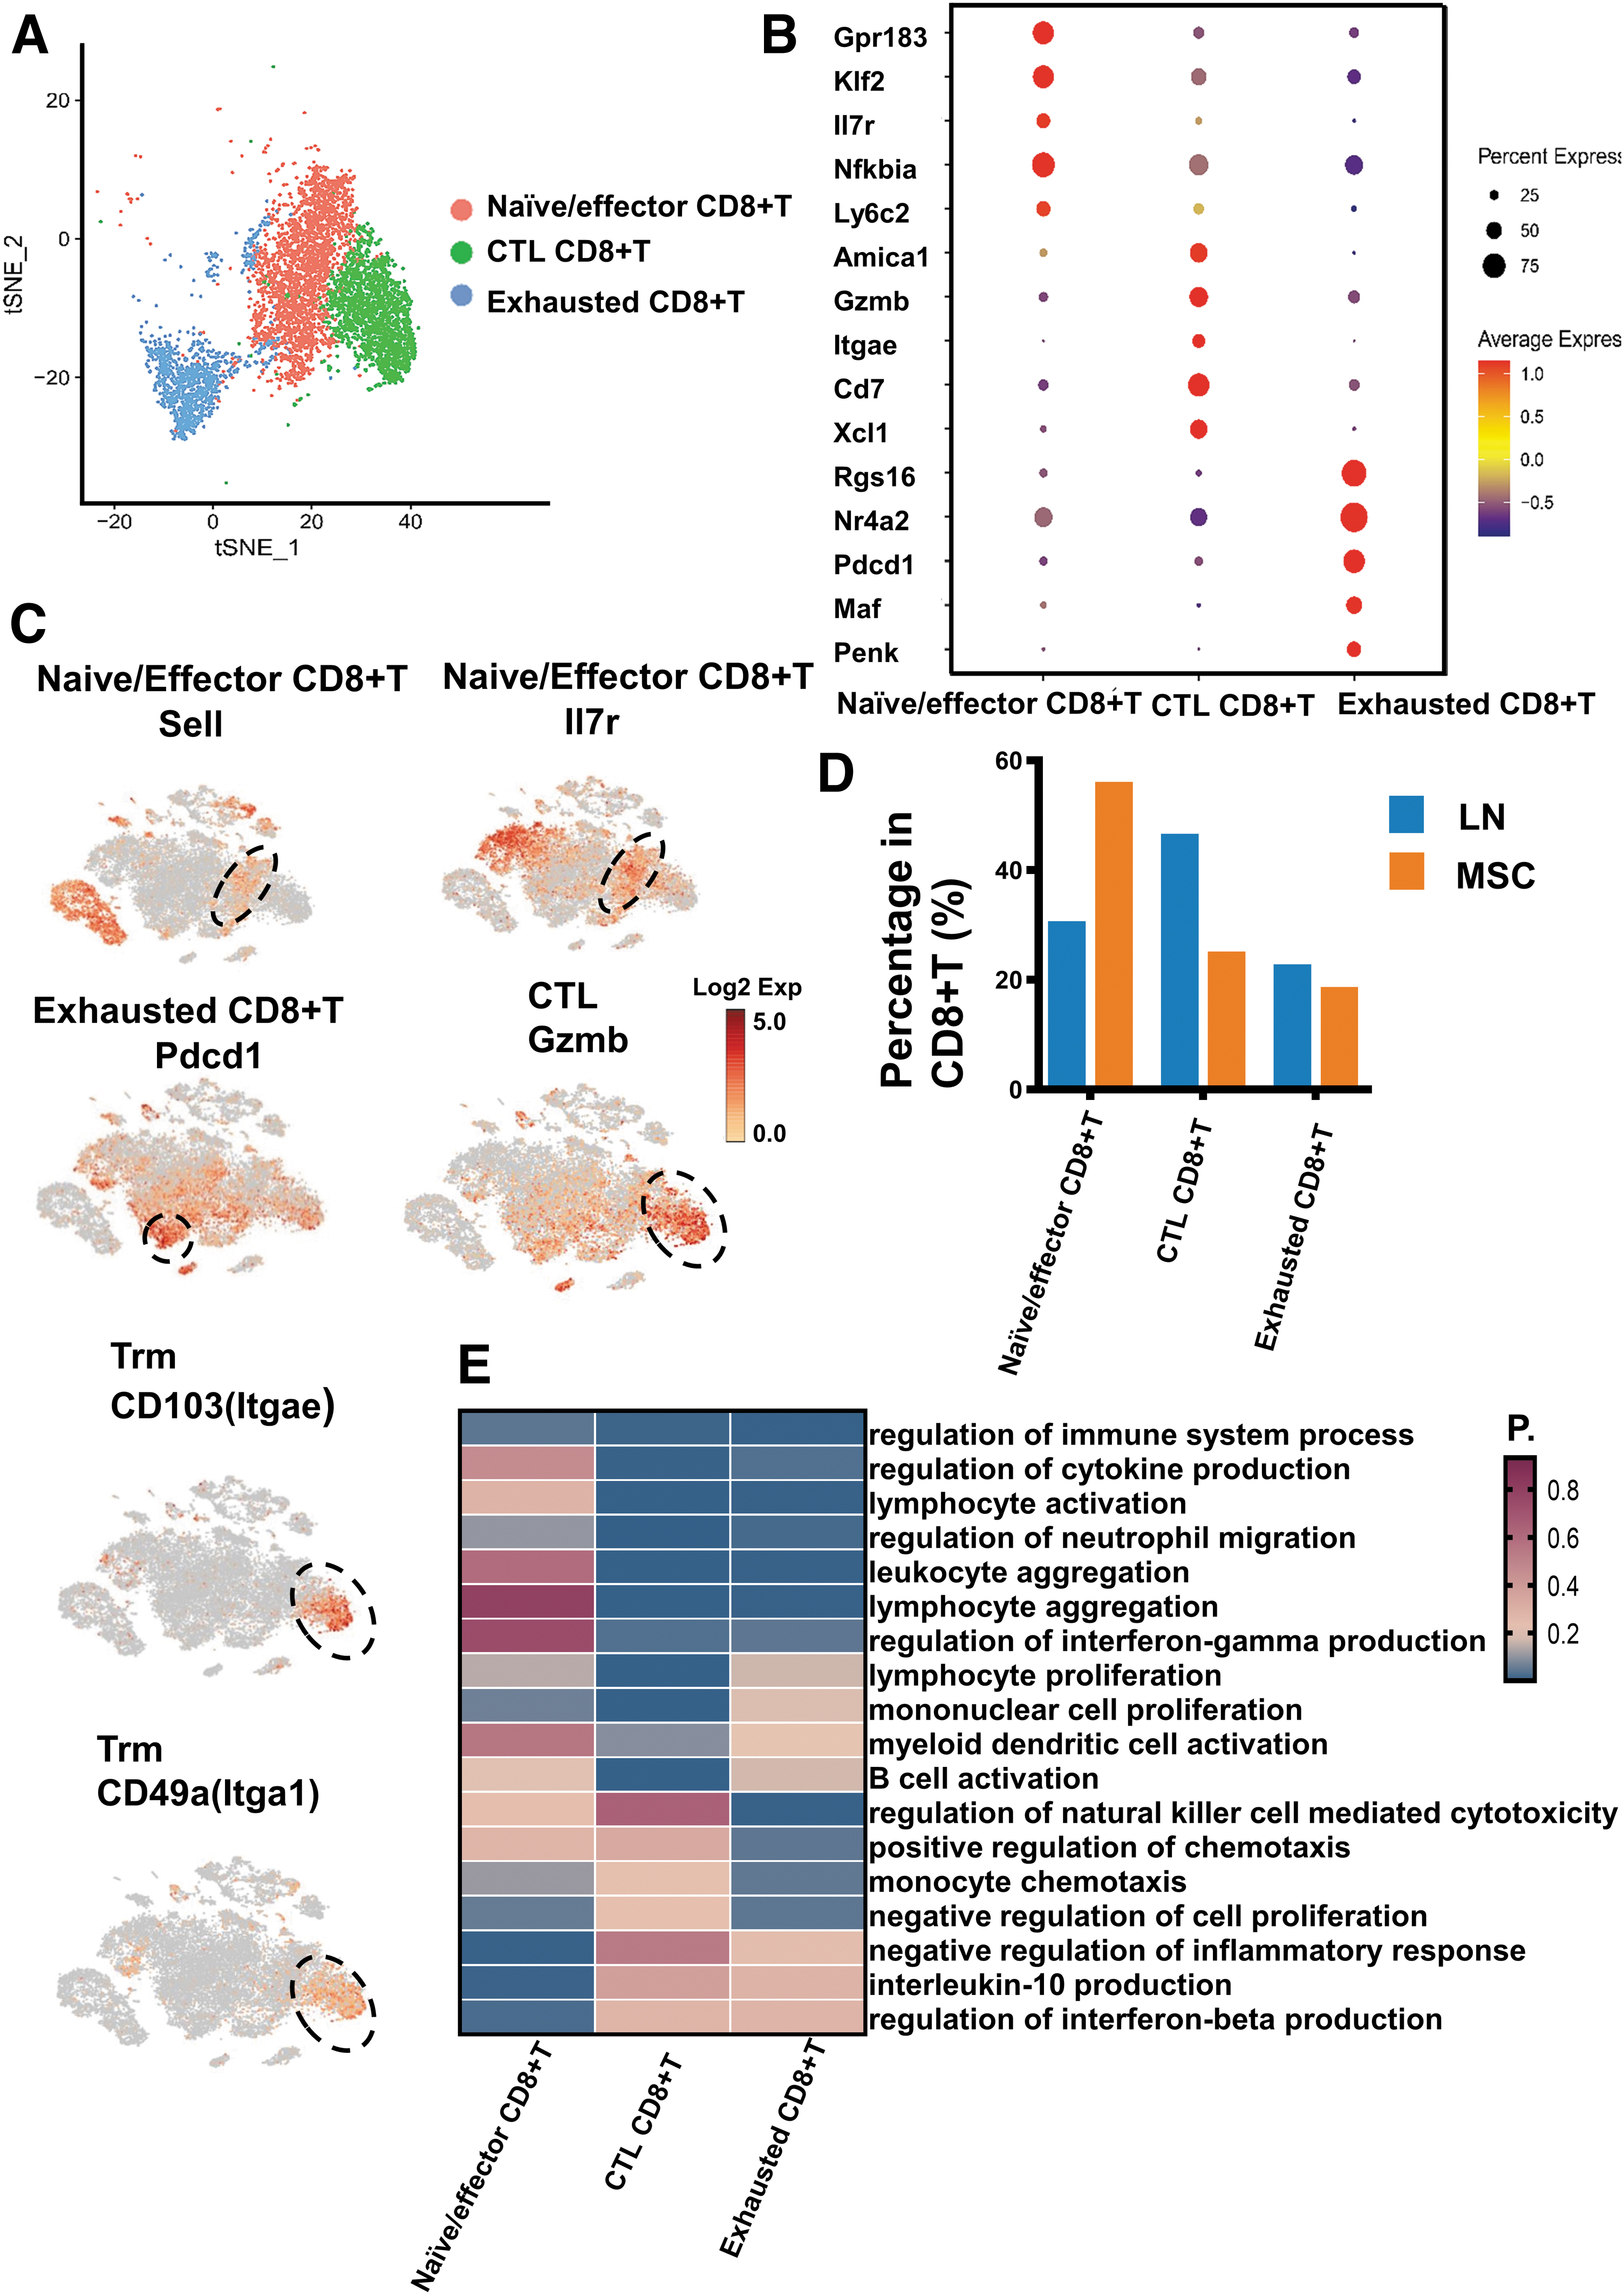
Single-cell RNA sequencing revealed CD8+T lymphocyte differences in the LN mice and the MSC-treated mice.
MSCs increased anti-inflammatory resident macrophages, and reduced proinflammatory infiltrating macrophages in renal regional immunity in LN mice
Macrophages can be divided into two categories: Monocyte-derived macrophages and Tissue-resident macrophages [41]. Renal macrophages in LN consist of infiltrating macrophages and resident macrophages [11]. Ly6c is a cell surface glycoprotein that is used to identify the type of macrophages. Ly6c+ macrophages are considered to be from the peripheral blood and have proinflammatory function, while Ly6c− macrophages, also known as tissue-resident macrophages, have anti-inflammatory function [42].
First, macrophages were defined as two groups: Ly6c+ macrophages and Ly6c− macrophages, based on the expression level of Ly6c. Ly6c+ macrophages were further divided into Ly6c hi macrophage, Ly6c inter macrophage, and Ly6c lo macrophage. All three groups of macrophages could be regarded as peripheral infiltrating macrophages. While Ly6c− macrophage could be considered as a resident macrophage. Then Ly6c lo macrophages could also be divided into two different groups of cells, according to ear2 gene expression. So, macrophages in our single-cell sequencing data were divided into five distinct subgroups: Ly6c hi macrophage (Ly6c hi Mφ), Ly6c inter macrophage (Ly6c inter Mφ), Ly6c lo ear2+ macrophage (Ly6c lo ear2+ Mφ), Ly6c lo ear2− macrophage (Ly6c lo ear2− Mφ), and resident macrophage (resident Mφ) (Fig. 8A–C). Besides, CD14 and CD16 are also common markers used to distinguish peripheral origin mononuclear macrophages from tissue-resident macrophages. CD14+CD16+ macrophages are commonly referred to as proinflammatory monocyte-derived macrophages [43].
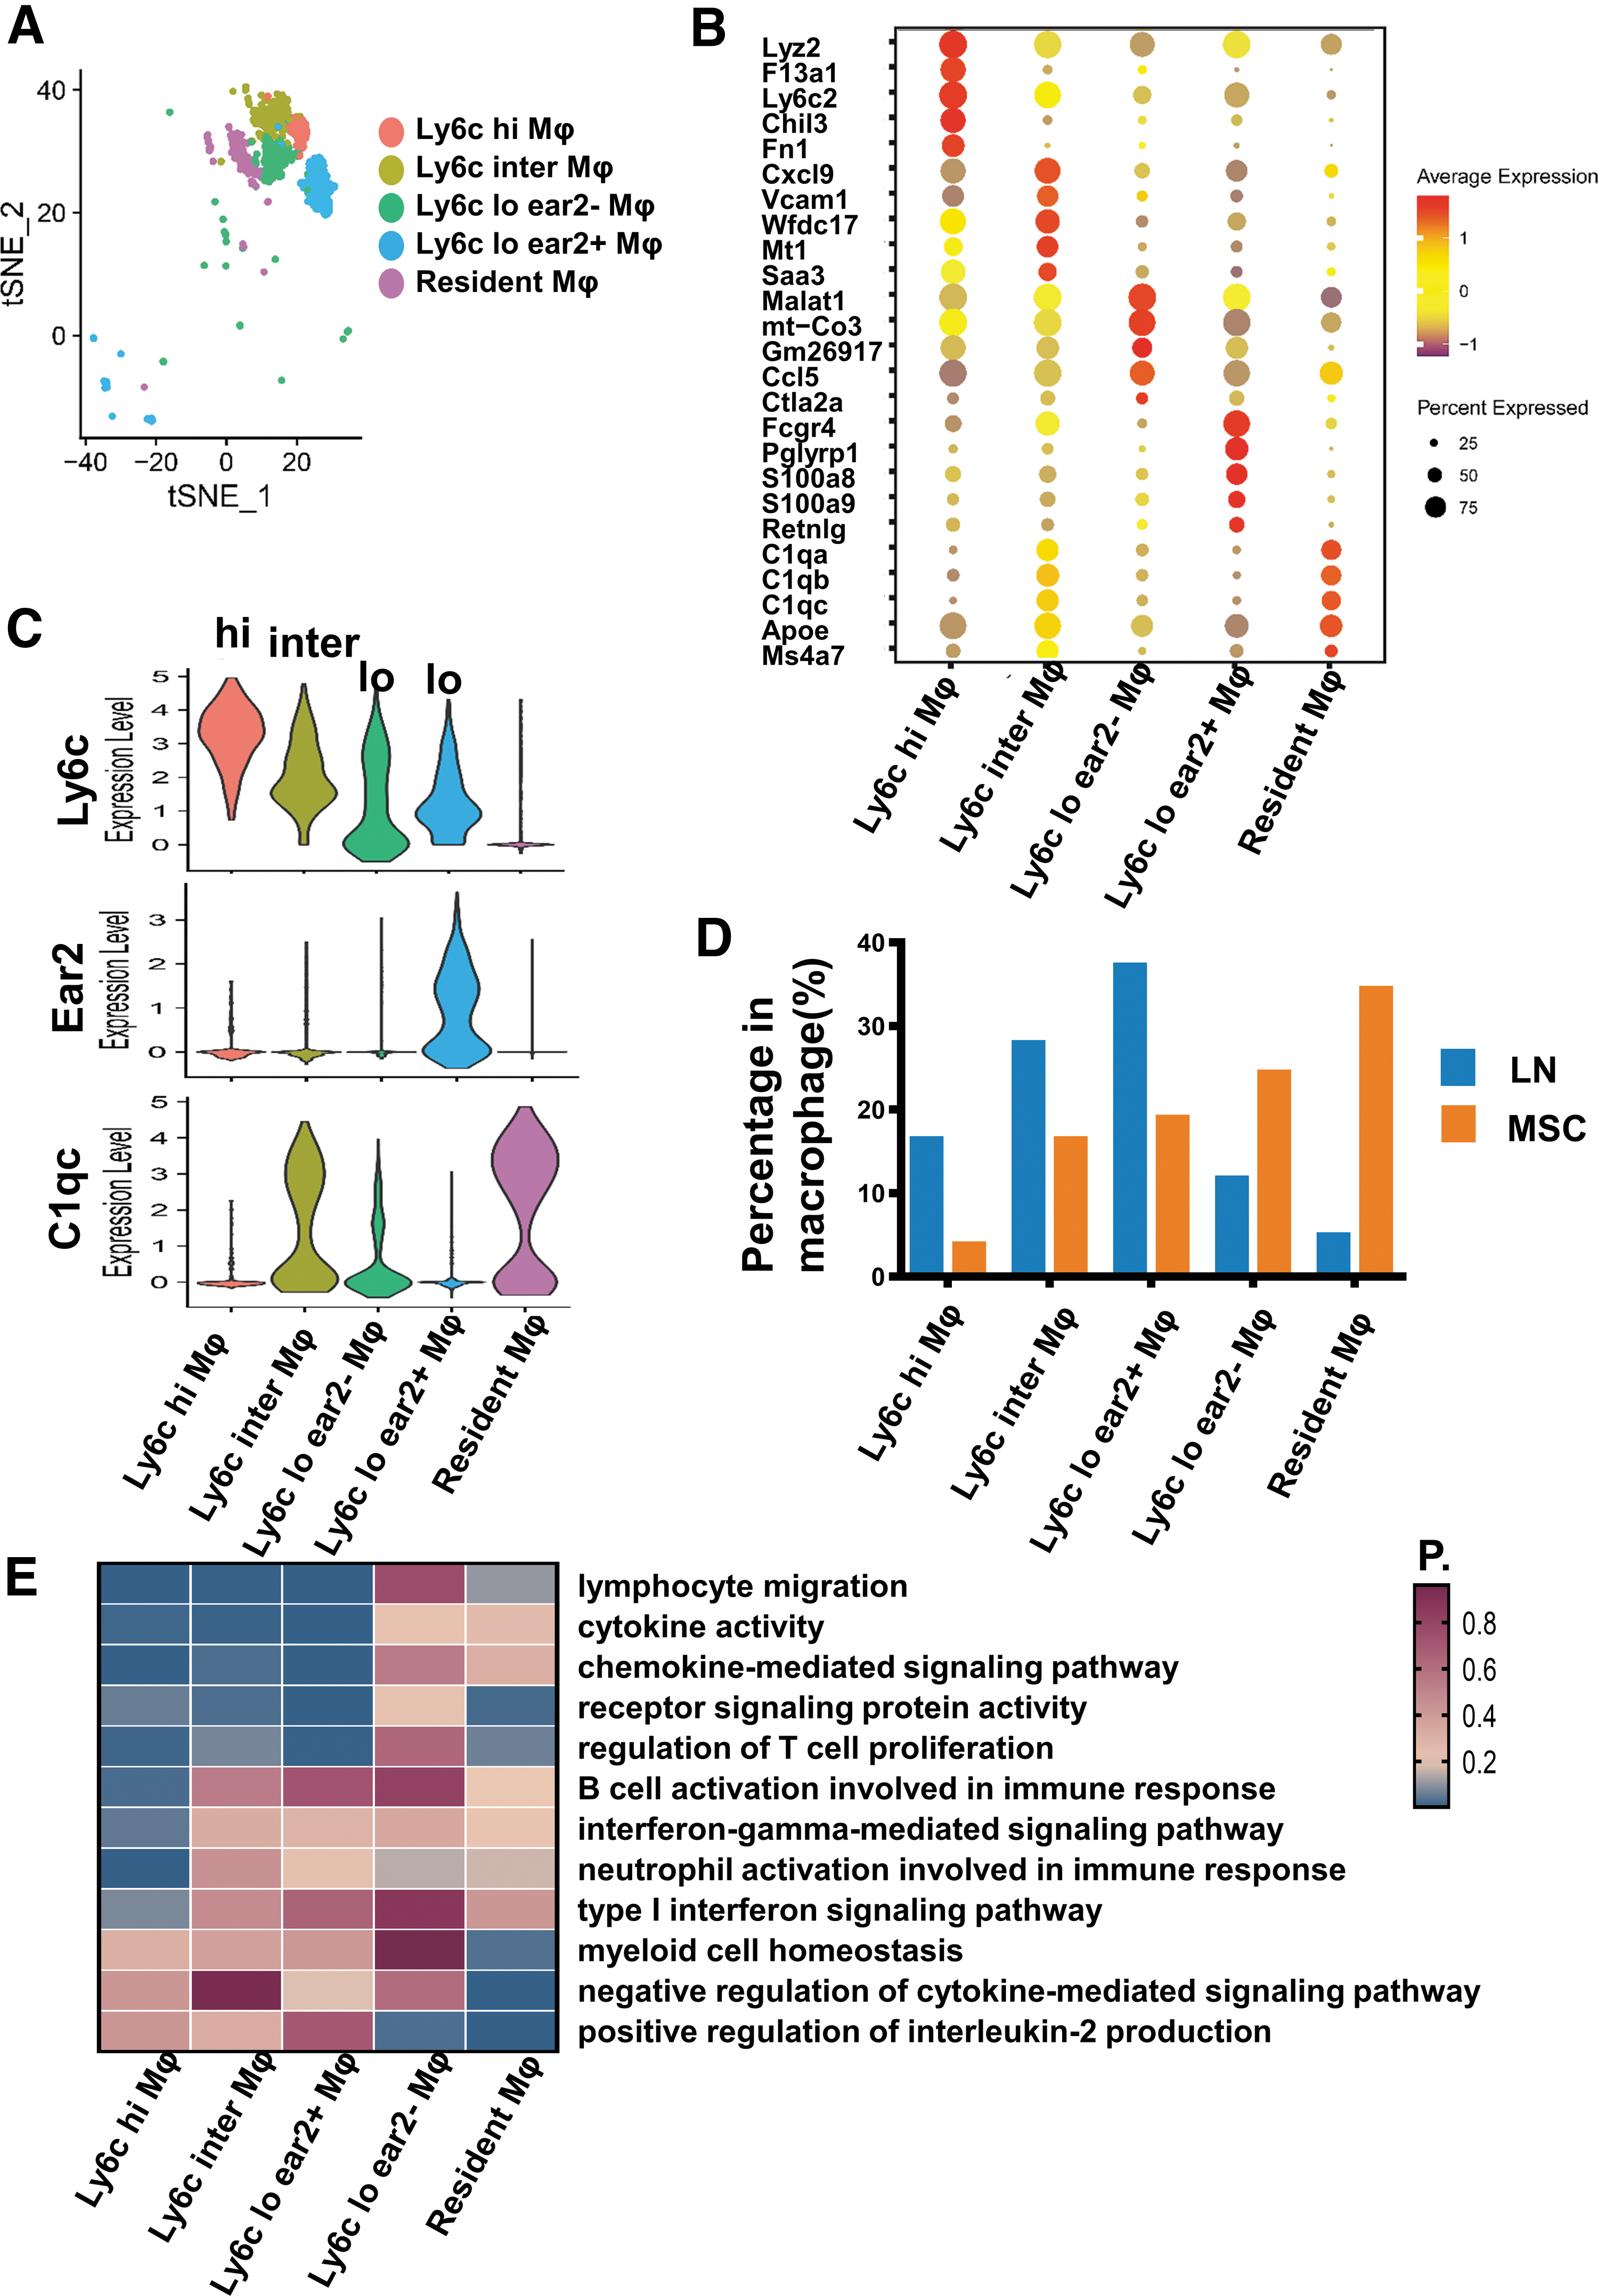
Single-cell RNA sequencing revealed macrophage differences in the LN mice and the MSC-treated mice.
In our data, Ly6c hi, Ly6c inter macrophage, and Ly6c lo ear2+ macrophage also highly expressed CD14 and CD16, while Ly6c lo ear2− macrophage and resident macrophage did not (Supplementary Fig. S2B, C).
MSCs prominently decreased the proportion of Ly6c hi, Inter, and lo ear2+ macrophages, and increased the proportion of Ly6c− resident macrophage and Ly6c lo ear2− macrophage (Fig. 8D; Supplementary Table S5). Next, we performed functional enrichment analysis for these macrophage subsets (Fig. 8E). The results showed that Ly6c hi, inter, and lo ear2+ macrophages were primarily involved in the function of immune cells activation and proinflammation. Resident macrophages were more associated with anti-inflammatory effect. Except for positive regulation for interleukin-2 production pathway, Ly6c lo ear2− macrophages were not as enriched in other immune-related pathways as the other four macrophage clusters.
Then, renal flow cytometry was used to further verify the changes of renal Ly6c+ and Ly6c− macrophages after MSC transplantation. The results showed that MSCs decreased infiltrating Ly6c+ macrophages and increased Ly6c− tissue-resident macrophages (Fig. 9A–C). From the results of single-cell sequencing and flow cytometry, we could see that MSCs could increase anti-inflammatory renal resident macrophages and decrease proinflammatory infiltrating macrophages.
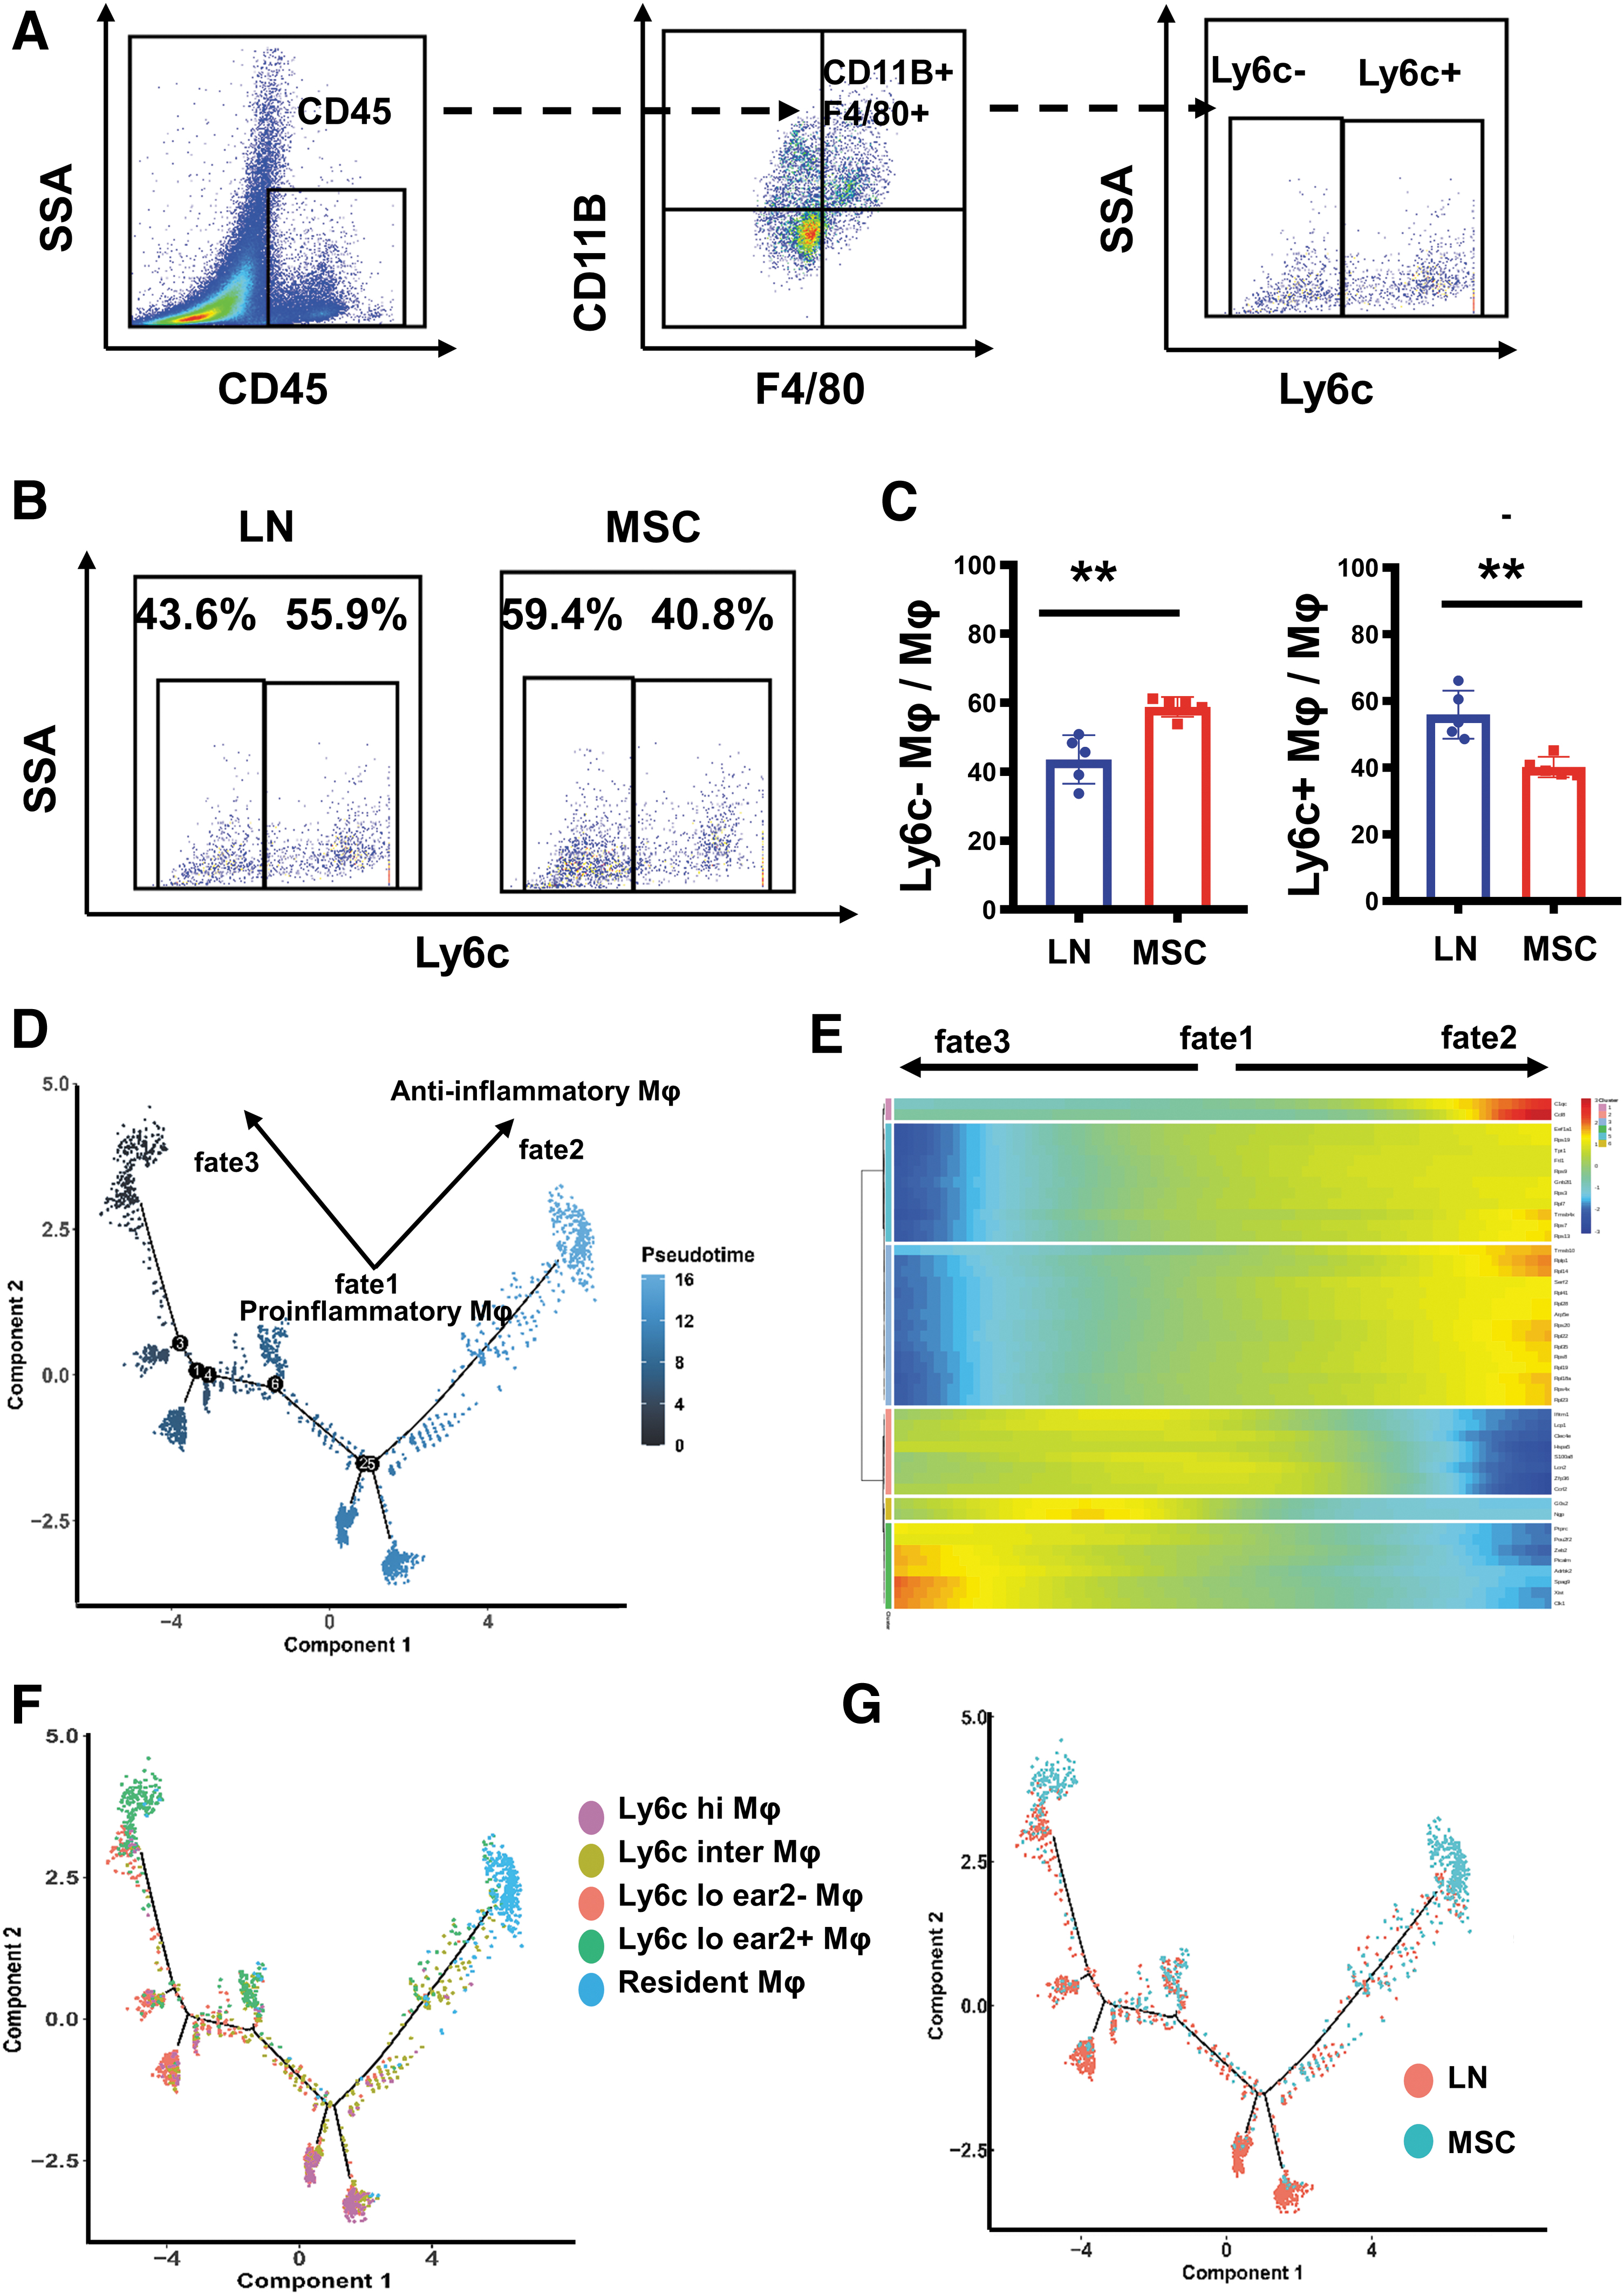
Flow cytometry revealed proportion differences of Ly6c+/Ly6c− macrophage in kidneys between the LN and the MSC-treated mice. Single-cell RNA sequencing revealed the differentiation trajectories of macrophage in the LN and the MSC-treated mice.
MSCs facilitated the conversion of macrophages into renal resident macrophages and Ly6c lo ear2− macrophages in LN mice
It is generally believed that early fetal yolk sac macrophages are the main source of renal resident macrophages. However, many studies have shown that monocyte-derived macrophages can also be the complement of classical tissue-resident macrophages, which are recruited from the peripheral and then colonized in tissues [44]. To further reveal the dynamic differentiation changes between infiltrating macrophages (Ly6c hi/inter/lo macrophage) and resident macrophages (Ly6c− resident macrophage), we constructed the differentiation trajectories of macrophages based on scRNA-seq data.
Using pseudotemporal analysis, we divided macrophages into three distinct fate stages: fate1, fate2, and fate3 (Fig. 9D, E). Ly6c hi/inter/lo ear2+ macrophages were located in the trajectories of fate1; Ly6c− resident macrophages were located in the trajectories of fate2, and Ly6c lo ear2− macrophages were located in the trajectories of fate3 (Fig. 9F). Therefore, we identified proinflammatory infiltrating Ly6c hi/inter/lo ear2+ macrophage as fate1 macrophage; anti-inflammatory resident macrophage as fate2 macrophage; Ly6c lo ear2− macrophage with hypoimmunofunction as fate3 macrophage. Based on macrophage differentiation studies and pseudotemporal analysis data, we suggested that peripherally recruited proinflammatory infiltrating macrophages in fate1 phase could differentiate to resident macrophages in fate2 phase and Ly6c lo esr2− macrophage in fate3 phase.
We also found that macrophages in the LN group were distributed at the trajectories of fate1, while macrophages in the MSC group were distributed at the trajectories of fate2 and fate3 (Fig. 9G). In summary, we speculated that MSCs may promote differentiation of proinflammatory mononuclear macrophages into anti-inflammatory resident macrophages and immunocompromised macrophages, thus reducing renal inflammation.
MSCs reduced LLPCs in renal regional immunity in LN mice
Naive B cells can be activated to differentiate into plasma cells (PC). Autoantibodies are generally produced by short- or long-lived plasma cells. PC migrates to the organ and further differentiated into LLPCs [45]. In LN, the kidneys are the primary source of PCs that produce autoantibodies, and the proportion of self-reactive PCs in the kidneys appears to be higher than in other organs (about 50% of PC is in kidneys, 20% in spleen, and 30% in bone marrow) [19]. In our data, we detected a B cell subset characterized by CD79a+, CD79b+, and Ly6d+ (Fig. 10A, B). This subset also expressed the marker genes of PCs, Jchain, Eaf2, and CD138(Sdc1) (Supplementary Fig. S1B). CD138 is often used to distinguish LLPCs from other B cells [46]. We found that MSCs reduced LLPCs in the kidneys (416 cells from LN group and 85 cells from MSC group; Supplementary Table S1). In addition, this subset cells were mainly related to immune activation and cytokine production (Fig. 10C). In addition, GSEA functional enrichment analysis showed that MSCs also downregulated pathways related to immune activation (Fig. 10D).
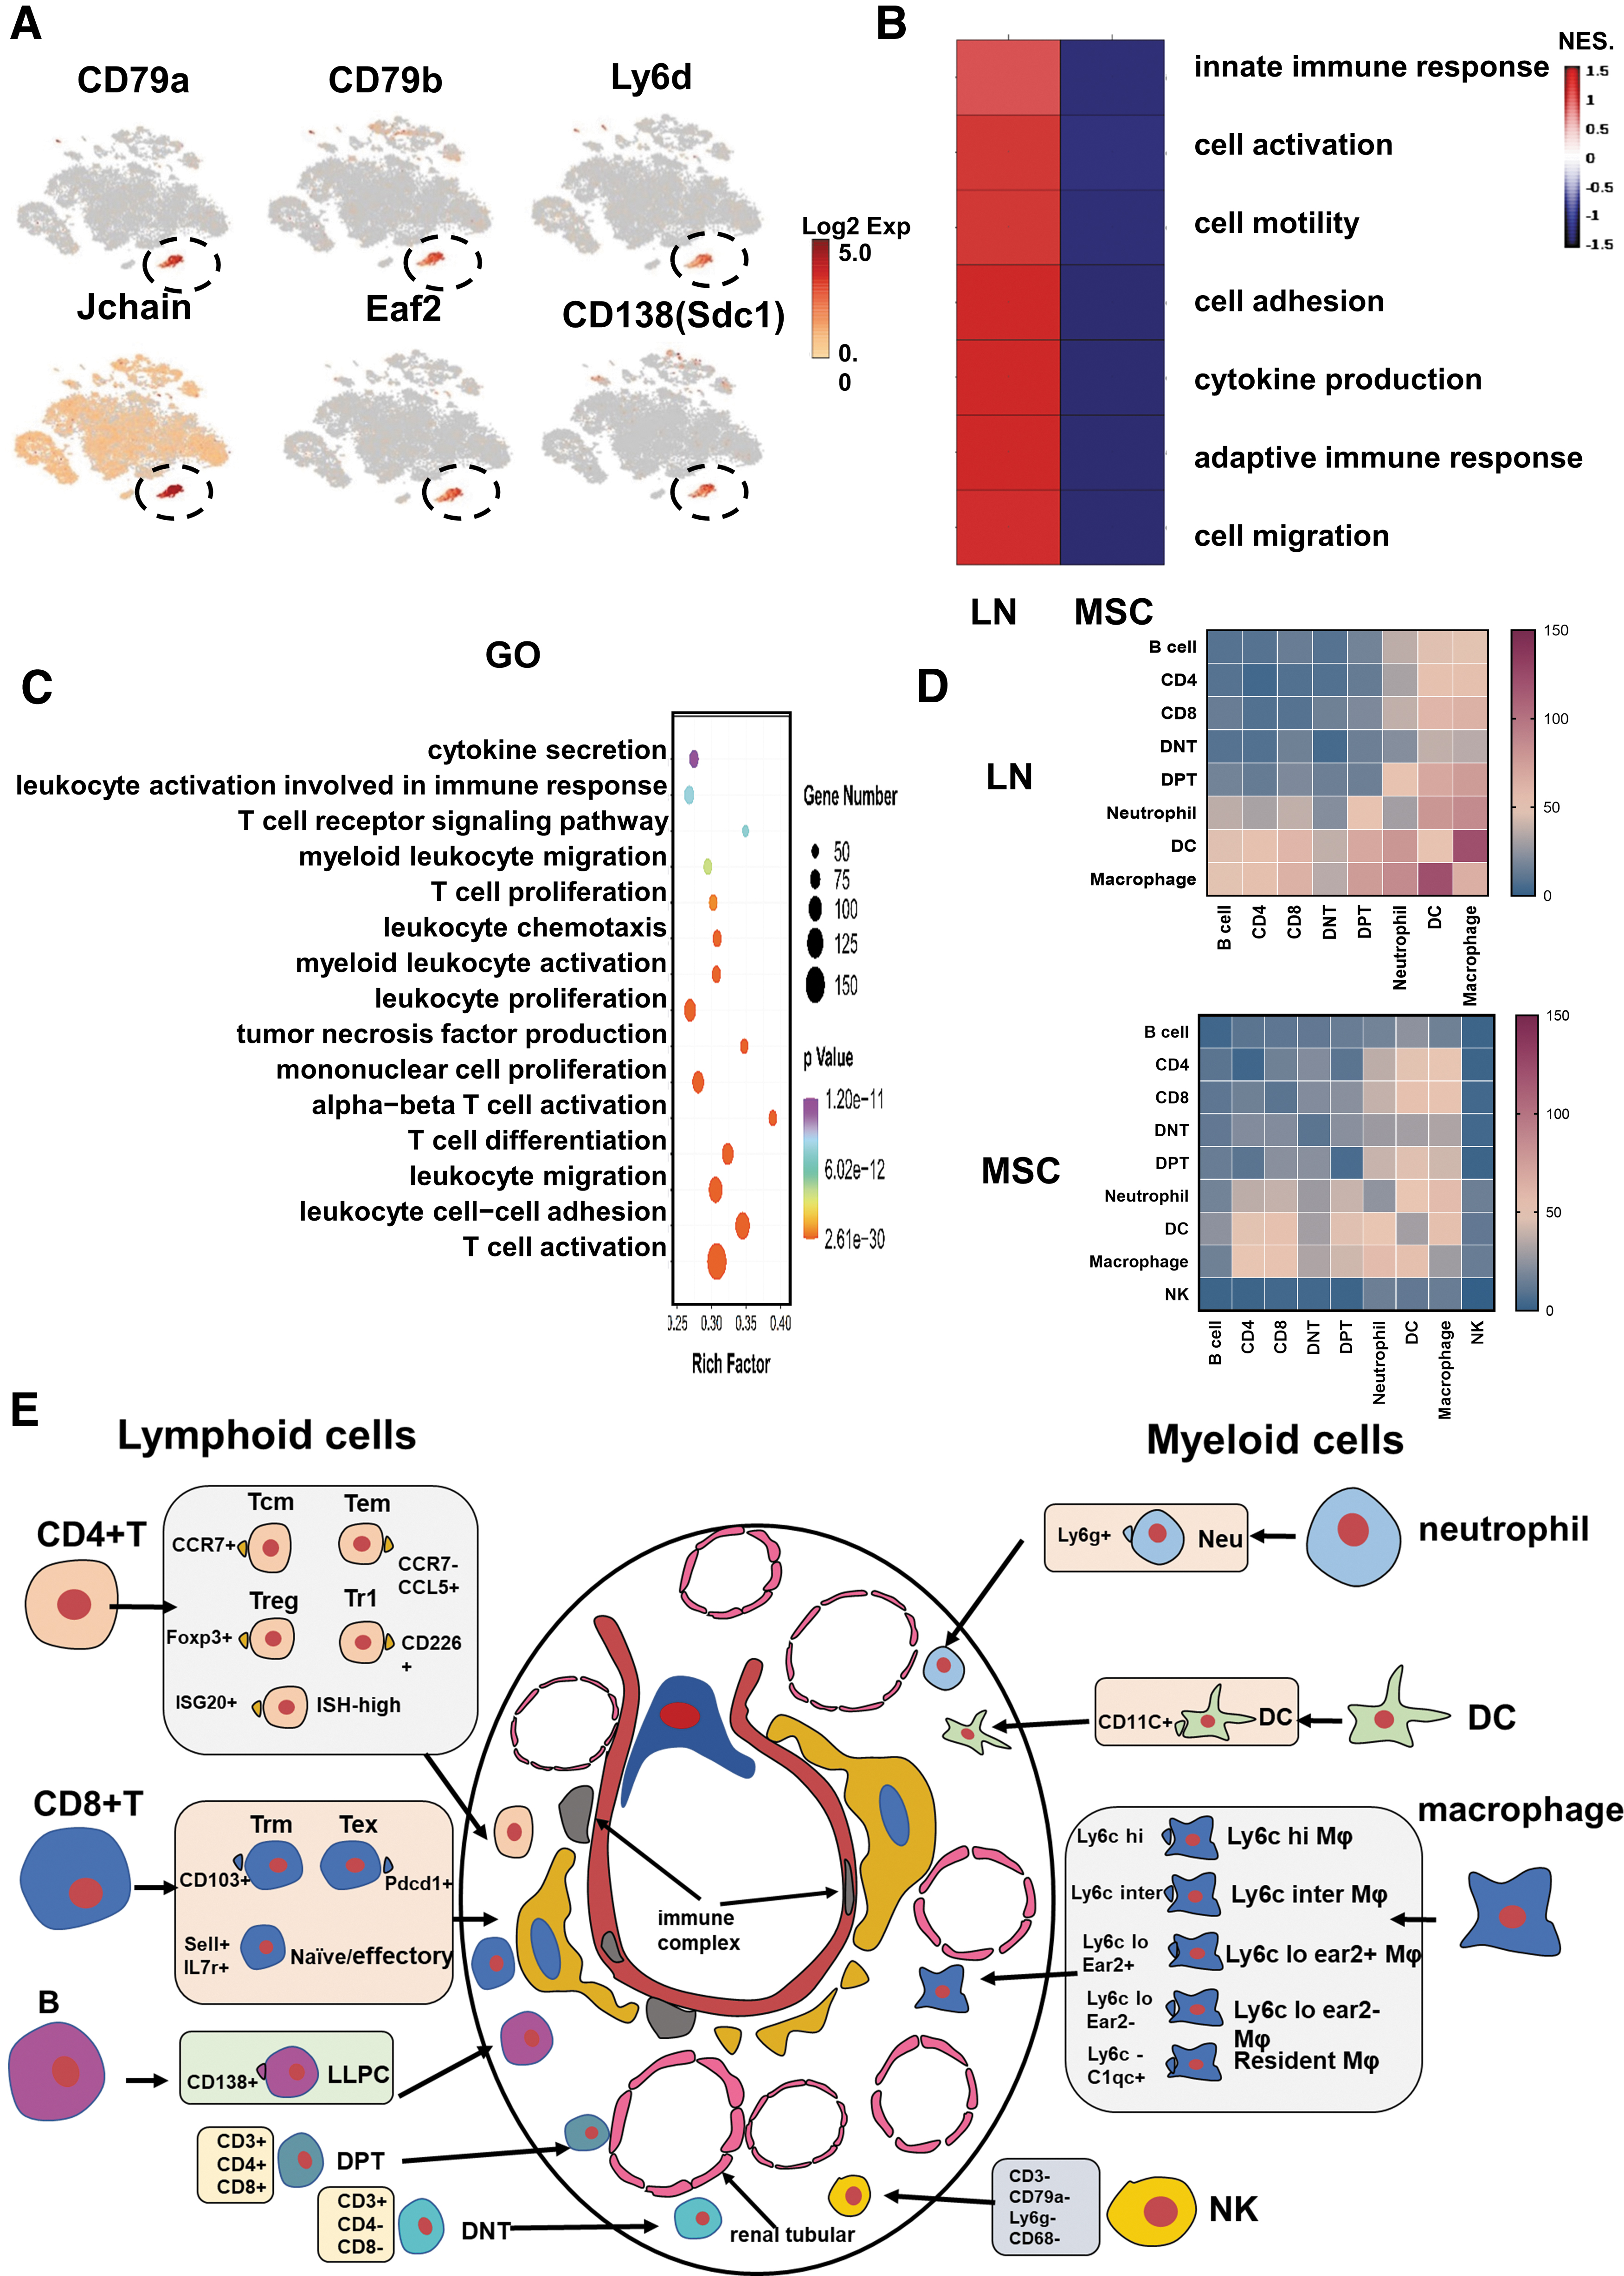
Single-cell RNA sequencing revealed B lymphocyte differences, cell–cell interactions, and renal regional immunity in the LN and the MSC-treated mice.
MSCs reduced neutrophils and DC in renal regional immunity in LN mice
Neutrophils can induce autoimmunity to LN through a unique form of cell death called NETosis (neutrophils extracellular trap) [7]. In LN, DC infiltrate the kidneys and perform the function of presenting antigens, amplifying inflammation. DC and monocyte-derived macrophages originate from myeloid progenitor cells in the bone marrow [11]. In contrast to macrophages, CD11C expression is high in DC [47]. In our RNA-Seq data, 2,891 neutrophils (2,677 cells from the LN group and 214 cells from the MSC group) were found (Supplementary Fig. S3A, B; Supplementary Table S2); 469 DCs specifically expressing CD11C and Ciita were detected (662 from the LN group and 253 from the MSC group; Supplementary Fig. S3E, F; Supplementary Table S2). The number of proinflammatory neutrophils and DC were decreased after MSC transplantation. MSCs also downregulated the pathways of immune cell activation and cytokine production in neutrophils and DC (Supplementary Fig. S3C, D, G, H).
MSCs increased NK, DNT, and DPT cells in renal regional immunity in LN mice
In our scRNA-seq data, we identified a cluster of cells that do not express the marker of T, B, DC, neutrophils, and macrophages (Supplementary Fig. S4A, B). These cells also did not express NK marker genes, KLRB1 and TYROBP. However, this subset of cells expressed Klrc2 and Ikzf2, which also are common genes in NK cells (Supplementary Fig. S4C) [48,49]. This subset of cells was mainly distributed in the kidneys of MSC group (21 from the LN group and 671 from the MSC group; Supplementary Table S2). According to the GSEA analysis, we inferred that these NK cells were different from the traditional NK cells, mainly manifested as the silencing and loss of immune cell markers and cell functions (Supplementary Fig. S4D).
DNT cells are a unique subset of T lymphocytes, which do not express CD4, CD8, and NK cell markers [50]. DPT cells express both CD4 and CD8 [51]. Two hundred forty-three DNT cells were detected (90 from the LN group and 153 from the MSC group) and 368 DPT cells (140 from the LN group and 228 from the MSC group) were detected (Supplementary Table S2). DNT and DPT cells accounted for a low proportion of renal immune cells (1.5% and 1.0%). To get a better understanding of these two clusters, we need to enrich them.
MSCs reduced immune cell interaction in renal regional immunity in LN mice
The pathogenesis of LN is complex, involving activation and infiltration of various immune cells in renal regional immunity. CellPhoneDB was used to identify ligands/receptors and molecular interactions among the major cell types. Among them, myeloid cells (macrophage/DC/Neutrophil) harbored the highest pair numbers (Fig. 10D). The results indicated that myeloid cells could be the key effectors and amplifiers of the proinflammatory response in the LN. MSCs reduced ligand/receptor pairs between myeloid cells and other cells. Thus, MSC transplantation suppressed immune cell interactions and attenuated the proinflammatory response in the kidneys.
Discussion
LN is the most common and serious complication of SLE. Long-term usage of glucocorticoids and other immunosuppressive agents often induces diverse side effects. MSCs have attracted attention because of their powerful immunoregulatory ability. In this study, we found that MSC therapy is safe and effective for LN. Even though the application of intravascular MSC administration appears to be safe, the majority of the MSCs get trapped in the lungs with only a small fraction reaching their target tissue. The cause of this problem may be the formation of microthrombi in the lungs. It has been shown that a targeted MSC administration through the renal artery immediately reduces renal perfusion, coinciding with the presence of microthrombi in the glomeruli and signs of an instant blood-mediated inflammatory reaction [52]. MSCs can have podoplanin on them that binds and activates platelets causing microthrombi, which is a key issue worth investigating [53].
There is growing evidence that some subsets of nonrecirculating cells, such as macrophages, NK, intrinsic lymphocytes, memory T cells, and Tregs, exist in multiple nonlymphoid tissues and promote regional immune responses according to the characteristics of each regional tissue [31]. These infiltrating and resident immune cells in the kidneys form specific “renal regional immunity”. In this study, we found that CD4+T cells (Tem, Tcm, Treg, Tr1, ISG-high CD4+T), CD8+T cells (Trm, Tex, Naive/Effector CD8+T), macrophages (Ly6c hi Mφ, Ly6c inter Mφ, Ly6c lo ear2+ Mφ, Ly6c lo ear2−Mφ, resident Mφ), DC, B cells, neutrophils, NK cells, DPT, and DNT constituted the kidney regional immunity (Fig. 10E). MSCs not only changed the proportion of infiltrating immune cells in the kidneys (such as Tcm, Tem, Ly6c hi/inter/lo Mφ), but also changed the proportion of resident immune cells (such as Trm, resident Mφ, LLPC).
Treg cells are necessary to control the immune response. There are two major subsets, which show a strong capacity to suppress effector T cells: Foxp3+ Treg cells and Tr1 cells. In both types of Treg cells, IL-10 plays a major role in cell maintenance and, thereby, in sustaining homeostasis. They have the potential to suppress Th17 and Th1 cells directly through IL-10 [54]. Tr1 cells have been less studied than classical Tregs and even less in kidney diseases. A 2022 clinical study of LN found that enhancing the expression of functional CD4+ CD46+ Tr1 cells may be an effective treatment for LN [55]. Besides, a SLE study found that the proportion of Foxp3+Treg did not change significantly after MSC treatment, which was consistent with our results [56]. It was found that function of classic Treg was deficient in SLE patients compared with normal people [57]. Therefore, the functional role of Tr1 cells in LN is a key issue worth investigating. The limitation of this study is the lack of in-depth studies to verify the function of Tr1 cells and elucidate how MSC induces Tr1 production. In the following studies, we will focus on further research on Tr1 cells.
Based on the expression level of Ly6c, macrophages are defined as Ly6c+ peripheral mononuclear macrophages and Ly6c− resident macrophages. Intrarenal monocyte recruitment and Ly6c hi macrophage expansion can induce renal parenchymal cell apoptosis during LN [11]. Some resident macrophage populations are maintained by monocytes through longevity, proliferation, and recruitment. A recent study in 2022 showed that whereas established resident peritoneal macrophages largely fail to migrate to the omentum, monocyte-derived resident cells readily migrate and form a substantial component of omental CD102+ macrophages in the months following resolution of peritoneal inflammation [58]. The resident macrophages differentiated by peripheral infiltrating macrophages had higher migration capacity. A full appreciation of the complexity and functions of renal macrophages in LN will require further exploration of their distinct molecular and functional characteristics. In our single-cell data, we also found some complexity in identification and function of macrophage subsets.
What is more, recent renal single-cell transcriptional sequencing studies have shown that ear2 is expressed in Ly6c lo macrophages [59]. However, there is relatively little research on this subset of macrophages. Our single-cell data suggested that Ly6c lo ear2+ macrophages and Ly6c lo ear2−macrophages had different immune functions. In our next study, genes and pathways of interest can be studied in more detail in LN so as to determine which cellular functions are pathogenic and which are protective. The ultimate goal is to make the MSC more targeted at preventing kidney inflammation by preventing either the influx of pathogenic macrophages or the activation of pathogenic pathways.
From this study, we could see that neutrophils accumulate in LN kidneys. MSCs could reduce the recruitment of neutrophils in the kidney. An increased number of neutrophils is common in patients with lupus. Neutrophils are important contributors to autoimmunity through a unique form of cell death called NETosis (neutrophil extracellular trap) [60]. Endothelial cell injury plays an important role in the inflammatory processes associated with SLE [61]. Meanwhile, a study has shown that there is a crosstalk between endothelial cells and MSC. MSCs can inhibit neutrophil recruitment through endothelial cells [62]. In LN, MSCs may inhibit neutrophil recruitment by regulating endothelial cells, which needs to be further verified in our next study.
So far, only a limited number of articles on the use of scRNA-seq in LN have been published. In this study, we used scRNA-seq to perform a comprehensive classification and description of these immune cell subtypes, including their specific marker genes and functional characteristics. Taken together, the results in this study may provide us with a more comprehensive insight into the immunological characteristics of the renal regional immunity in LN in mice after MSC transplantation, as well as valuable information for future clinical applications of MSC.
Ethics Approval and Consent to Participate
The animal experiments in this study were conducted in accordance with the experimental protocol approved by the Medical Ethics Committee of the Chinese PLA General Hospital (Ethics Approval No. SQ2021209). Procedures for the MSC culture and consent of patients followed the standards approved by the Chinese PLA General Hospital Ethics Committee (No. S2019-059-01).
Availability of Data and Materials
The data used to support the findings of this study are available from the corresponding author upon request.
Footnotes
Author Disclosure Statement
No competing financial interests exist.
Funding Information
This work was supported by the National Key Research and Development Program of China (Grant No. 2020YFA0113004) and the National Natural Science Foundation of China (Grant No. 81830060).
Supplementary Material
Supplementary Figure S1
Supplementary Figure S2
Supplementary Figure S3
Supplementary Figure S4
Supplementary Table S1
Supplementary Table S2
Supplementary Table S3
Supplementary Table S4
Supplementary Table S5