




Abstract
The homeostasis of the intestinal epithelium heavily relies on the self-renewal and differentiation of intestinal stem cells (ISCs). Although the orchestration of these processes by signaling pathways such as the Wnt, BMP, Notch, and MAPK signals has been extensively studied, the dynamics of their regulation remains unclear. Our study explores how the Wnt signaling pathway temporally regulates the differentiation of ISCs into various cell types in an intestinal organoid system. We report that the duration of Wnt exposure following Notch pathway inactivation significantly influences the differentiation direction of intestinal epithelial cells toward multiple secretory cell types, including goblet cells, enteroendocrine cells (EECs), and Paneth cells. This temporal regulation of Wnt signaling adds another layer of complexity to the combination of niche signals that govern cell fate. By manipulating this temporal signal, we have developed optimized protocols for the efficient in vitro differentiation of ISCs into EECs and goblet cells. These findings provide critical insights into the dynamic regulation of ISC differentiation and offer a robust platform for future investigations into intestinal biology and potential therapeutic applications.
Introduction
The homeostasis of the intestinal epithelium is driven by actively renewing intestinal stem cells (ISCs) located at the crypt base [1,2]. These stem cells undergo self-renewal and differentiation processes, continuously producing various differentiated cell types essential for maintaining the integrity and function of the intestinal epithelium [3,4]. This includes absorptive enterocytes, secretory goblet cell, enteroendocrine cell (EEC), Paneth cell, and tuft cell, each with unique functional roles [5]. Goblet cells, for example, secrete mucins to create a protective layer over the intestinal epithelium [6,7], while EECs sense luminal content and release numerous hormones that regulate digestive processes [8 –10]. Paneth cells also play a crucial role in supporting the self-renewal of ISCs [11,12] and provide an additional protective layer for the intestinal epithelium by secreting antibacterial peptides [13,14].
The self-renewal and differentiation of ISCs are tightly regulated by a combination of signaling pathways that form distinct gradients along the crypt–villus axis [15 –20]. The dynamic equilibrium of these pathways, notably the Wnt, BMP, Notch, and MAPK signals, orchestrates the intricate self-renewal and differentiation processes of ISCs, ultimately guiding the cell fate specification toward multiple functional mature cell types [19,21 –24]. Specifically, Notch signaling regulates the specification of absorptive versus secretory cell types, where Notch pathway inactivation induces secretory cell differentiation [22,25].
These cellular processes of the intestinal epithelium can be reproduced in vitro using an intestinal organoid system [26 –28]. This system, generated from isolated crypts or single ISCs in a 3D environment, recapitulates the cellular constitution, structural organization, and function of the intestinal epithelium [29,30]. Moreover, the intestinal organoid model captures the dynamic self-renewal and differentiation processes in the intestinal epithelium, offering a physiologically relevant model to explore the regulation of cellular behavior of intestinal epithelial cells [29,31]. Past studies have leveraged this system to dissect the signals and their combinations in differentiating intestinal epithelial cells [22,32]. These include the interplay between Wnt and Notch signals [22], the role of the MAPK pathway in EEC differentiation [24], and the influence of the BMP gradient in EEC subtype specification [33].
While the core signals governing intestinal epithelial differentiation have been defined, how these pathways dynamically regulate cell fate is yet to be fully understood. In this study, we further explored the signals that control the differentiation of intestinal epithelial cell types using the intestinal organoid system. We uncovered that the Wnt signal regulates the specification of secretory cell types in a temporally regulated manner, where the duration of Wnt exposure following Notch inactivation dramatically affects the differentiation direction of intestinal epithelial cell types toward multiple secretory cell types, including goblet cells, EECs, and Paneth cells. This adds another layer of regulation over the combination of niche signals. By integrating this temporal Wnt signal with other niche signals, we developed an optimized and efficient differentiation protocol to generate EECs and goblet cells. This work enhances our understanding of intestinal biology and provides a robust platform for future research.
Materials and Methods
All experiments involving animal tissues in this study were performed in accordance with guidelines approved by the Laboratory Animal Ethics Committee of Tongji University (approval no.: TJAB04720101).
Mouse intestinal crypt isolation and culture
Crypts were isolated as previously described [26]. Briefly, the proximal half of the small intestine from 6- to 12-week-old C57BL/6J mice was harvested, opened longitudinally, and washed three times with cold Dulbecco's phosphate-buffered saline (DPBS) to remove luminal content. The intestine tissue was then cut into pieces with scissors and washed with cold DPBS 5–10 times by pipetting up and down using a 10 mL pipette. Tissue fragments were incubated with 2 mM ethylenediaminetetraacetic acid (EDTA) in DPBS on ice for 30 min. After the removal of EDTA, tissue fragments were washed with DPBS to release crypts. The released crypts were collected and passed through a 70-μm cell strainer. Isolated crypts were embedded in Matrigel (Corning) and plated at the center of wells in 48-well plates.
The basal medium contained advanced Dulbecco's modified Eagle's medium (DMEM)/F12 (Gibco) supplemented with B-27 (Gibco), 10 mM HEPES (Corning), 2 mM GlutaMAX (Gibco), penicillin–streptomycin (Gibco), and 1 mM N-acetyl-
Direct differentiation of small ISCs
For cell differentiation experiments, the cell culture medium was removed and replaced with a medium containing growth factors and small molecules. The medium was changed every 1–2 days depending on the differentiation condition used.
EEC differentiation was as follows: recombinant murine EGF (50 ng/mL), DMH1 (2 μM), DAPT (10 μM; TargetMol), CHIR (4 μM) for 2 days, and then replace CHIR with Wnt-C59 (5 μM; ApexBio) and add PD0325901 (1 μM; ApexBio) for 2 days.
Goblet cell differentiation was as follows: recombinant human fibroblast growth factor (FGF)-basic (FGF-2, 50 ng/mL; PeproTech), DMH1 (2 μM), DAPT (10 μM; TargetMol), CHIR (4 μM) for 1 day, and then replace CHIR with Wnt-C59 (5 μM) for 3 days.
RNA extraction and reverse transcription-quantitative polymerase chain reaction
Organoids or differentiated cells were harvested and washed with ice-cold DPBS before lysis in the TRIzol reagent (TransGen Biotech). Total RNA was isolated according to the manufacturer's instructions. Up to 1 μg of total RNA was used for cDNA synthesis using the NovoScriptPlus Reverse Transcriptase kit (NovoProtein). Quantitative polymerase chain reaction (qPCR) was performed using the ChamQ Universal SYBR qPCR Master Mix (Vazyme) on a CFX384 Real-Time System (BioRad). Relative gene expression levels were calculated using the ΔΔCt method. A list of the primer sequences for qPCR is provided in Table 1.
Primers Used for Real-Time Polymerase Chain Reaction Analysis
Flow cytometry
Differentiated cell colonies were dissociated from the Matrigel with TrypLE (Gibco) and dissociated into single cells by repeated pipetting using a P1000 pipette tip. The digestive process was stopped by dilute samples in advanced DMEM/F12 containing 20% fetal bovine serum (FBS; Vistech) and then centrifuged at 800 relative centrifugal force (RCF) for 5 min at 4°C. To mark dead cells, samples were incubated in 4′,6-diamidino-2-phenylindole (DAPI, 1:1,000; ApexBio) diluted in 2% FBS/2 mM EDTA/DMEM for 20 min at room temperature, then centrifuged at 800 RCF for 5 min at 4°C and washed in 2% FBS/2 mM EDTA/DMEM for three times. Cells were then incubated in 4% paraformaldehyde (Sangon Biotech) for 10 min at room temperature, washed with 2% bovine serum albumin (BSA; Sigma)/DPBS, and then permeabilized in DPBS containing 0.5% Triton X-100 (Sigma), 0.5% Tween 20 (Sigma), and 2% BSA for 1 h at room temperature.
Cells were washed with ice-cold DPBS and filtered into fluorescence-activated cell sorting (FACS) tubes through a 40 μm cell strainer (Falcon). FACS was performed on a BD FACSVerse (BD Biosciences), and data were analyzed in FlowJo. The gating strategy was consistent throughout this study (Supplementary Fig. S1A).
Immunostaining
Immunofluorescence was performed as previously described. Briefly, organoids were released from Matrigel with DPBS, fixed with 4% paraformaldehyde (Sangon Biotech) for 10 min at room temperature, and permeabilized in DPBS containing 0.5% Triton X-100 (Sigma), 0.5% Tween 20 (Sigma), and 2% BSA(Sigma) for 1 h at room temperature. Samples were blocked and incubated in a blocking buffer (0.1% BSA, 0.5% Tween 20 in DPBS) containing primary antibodies at 4°C overnight. Primary antibodies used in this study were as follows: rabbit anti-lysozyme (1:500; Invitrogen), rabbit anti-mucin 2 (1:200; ProteinTech), mouse anti-Chr-A (1:100; Santa Cruz), rat anti-somatostatin (1:200; Millipore), mouse anti-glucagon (1:200; Santa Cruz), rabbit anti-Neurod1 (1:200; Abcam), and mouse anti-Klf4 (1:100; Santa Cruz).
Samples were washed and incubated with secondary antibodies (1:1,000; Invitrogen) for 1 h at room temperature, counterstained with DAPI (1 μg/mL; ApexBio), imaged on a Zeiss LSM880 or Olympus IX73, and analyzed in ImageJ. Alkaline phosphatase activity was detected using a commercial kit (Beyotime) according to the manufacturer's instructions. Specific markers for each cell type are summarized in Table 2.
Annotation of Genes
EECs, enteroendocrine cells; ISCs, intestinal stem cells.
GLP-1 secretion assay
GLP-1 secretion assay was performed as previously described [34]. Clones from 48-well plates were collected in 1.5-mL tubes and incubated in basal medium [Hanks' balanced salt solution (Life Technologies) supplemented with 10 mM HEPES, 0.1% fatty acid-free BSA, and no glucose, pH 7.4] for 2 h in a thermomixer at 300 rotations per min. Clones were then washed and incubated in 100 μL basal solution containing 1 mg/mL Diprotin-A (Sigma Aldrich) for 1 h. The supernatant was collected and the clones were further incubated in 100 μL basal solution containing 1 mg/mL Diprotin A and 10 mM glucose for 1 h. The supernatant was collected and clones were then lysed in CelLytic M buffer (Sigma-Aldrich). GLP-1 concentration was determined by Multi-Species GLP-1 total ELISA (Millipore) and DNA was quantified using the PicoGreen Kit (Invitrogen).
Library preparation for RNAseq
Total RNA of each sample was extracted using the TRIzol reagent (TransGen Biotech), quantified and qualified by the Agilent 2100 Bioanalyzer (Agilent Technologies), NanoDrop (Thermo Fisher Scientific), and 1% agarose gel. One microgram of total RNA with an RNA integrity number value above 6.5 was used for the following library preparation. Next-generation sequencing library preparations were constructed according to the manufacturer's protocol of VAHTS mRNA-seq V3 Library Prep Kit for Illumina (NR611). Sequencing was carried out on a NovaSeq6000 System (Illumina).
RNAseq data analysis
Quality control of the raw sequencing counts was initially performed using FastQC (v0.12.1) to assess metrics such as base quality, sequence length, and adapter contamination. After the QC analysis, Illumina-specific adapters and low-quality bases were trimmed using Trim Galore (v0.6.10) using default parameters. The cleaned reads were then aligned to the Mus musculus reference genome (mm10) using HISAT2 (v2.2.1). Postalignment, the sequence alignment/map (SAM) files were converted into binary alignment/map format and sorted using SAMtools (v1.13). Gene quantification was executed using FeatureCounts (v2.0.1) to generate a count table based on the aligned reads. The count data underwent normalization using variance-stabilizing transformation methods implemented in DESeq2. Differentially expressed genes (DEGs) between experimental conditions were identified based on adjusted P values and log2-fold change, following false discovery rate correction. The results were visualized using volcano plots constructed with ggplot2.
To interpret the biological relevance of the DEGs, Gene Ontology (GO) enrichment analysis was conducted using the clusterProfiler package. Significance of the enriched terms was determined based on adjusted P values following the Benjamini–Hochberg correction.
Statistical analysis
Data are presented as mean ± standard deviation. Statistical analysis was performed in GraphPad Prism software version 7.0. Two-tailed Student's t-test, one-way analysis of variance (ANOVA) with Dunnett's multiple comparisons test, and one-way ANOVA with Tukey's multiple comparisons test were used to determine the statistical significance. The significance levels are ****P < 0.0001; ***P < 0.001; **P < 0.01; and *P < 0.05.
Data and code availability
The raw sequence data reported in this article have been deposited in the Genome Sequence Archive [35] in the National Genomics Data Center [36], China National Center for Bioinformation/Beijing Institute of Genomics, Chinese Academy of Sciences (GSA: CRA013070) that are publicly accessible at (
Results
Secretory cell differentiation induced by a combination of niche signals
Mouse ISCs cultured with EGF, Noggin, and R-Spondin1 (ENR condition) form organoids containing multiple spontaneously differentiated cell types, including enterocytes, goblet cells, EECs, and Paneth cells [26]. Adding CHIR99021 and VPA (CV) maintains ISCs, producing cultures rich in ISCs but lacking differentiated cells [22]. We assessed combinations of niche signals on ISC differentiation, including EGF (E), BMP inhibitor Noggin (N), Wnt activator CHIR99021 (CHIR) and R-Spondin1 (R), Wnt inhibitor Wnt-C59 (C59), HDAC inhibitor VPA (V), and Notch inhibitor DAPT (D), for their ability to induce secretory cell differentiation.
As shown in previous studies, DAPT markedly increased differentiation into secretory cells [22,25], including EEC and goblet cell, as indicated by the elevated expression of markers such as Chga, Gcg, and Clca1 (Fig. 1A). VPA inhibited their differentiation (Fig. 1A). Prior studies suggest that Wnt activation induces Paneth differentiation, while inhibition promotes goblet differentiation, although both yield suboptimal EEC differentiation (Fig. 1B) [22]. Remarkably, the omission of Wnt modulators (EN.D condition) induces higher EEC differentiation than EN.D.C59 or EN.D.CHIR (Fig. 1A–D), as demonstrated by immunostaining of the EEC marker Chga (Fig. 1B) and flow cytometry analysis (Fig. 1C, D, and Supplementary Fig. S1A). Removing EGF decreased viability, and so, it was retained. Under EN.D, cells differentiated to goblet cells, EECs, Paneth cells, and enterocytes (Supplementary Fig. S1B).
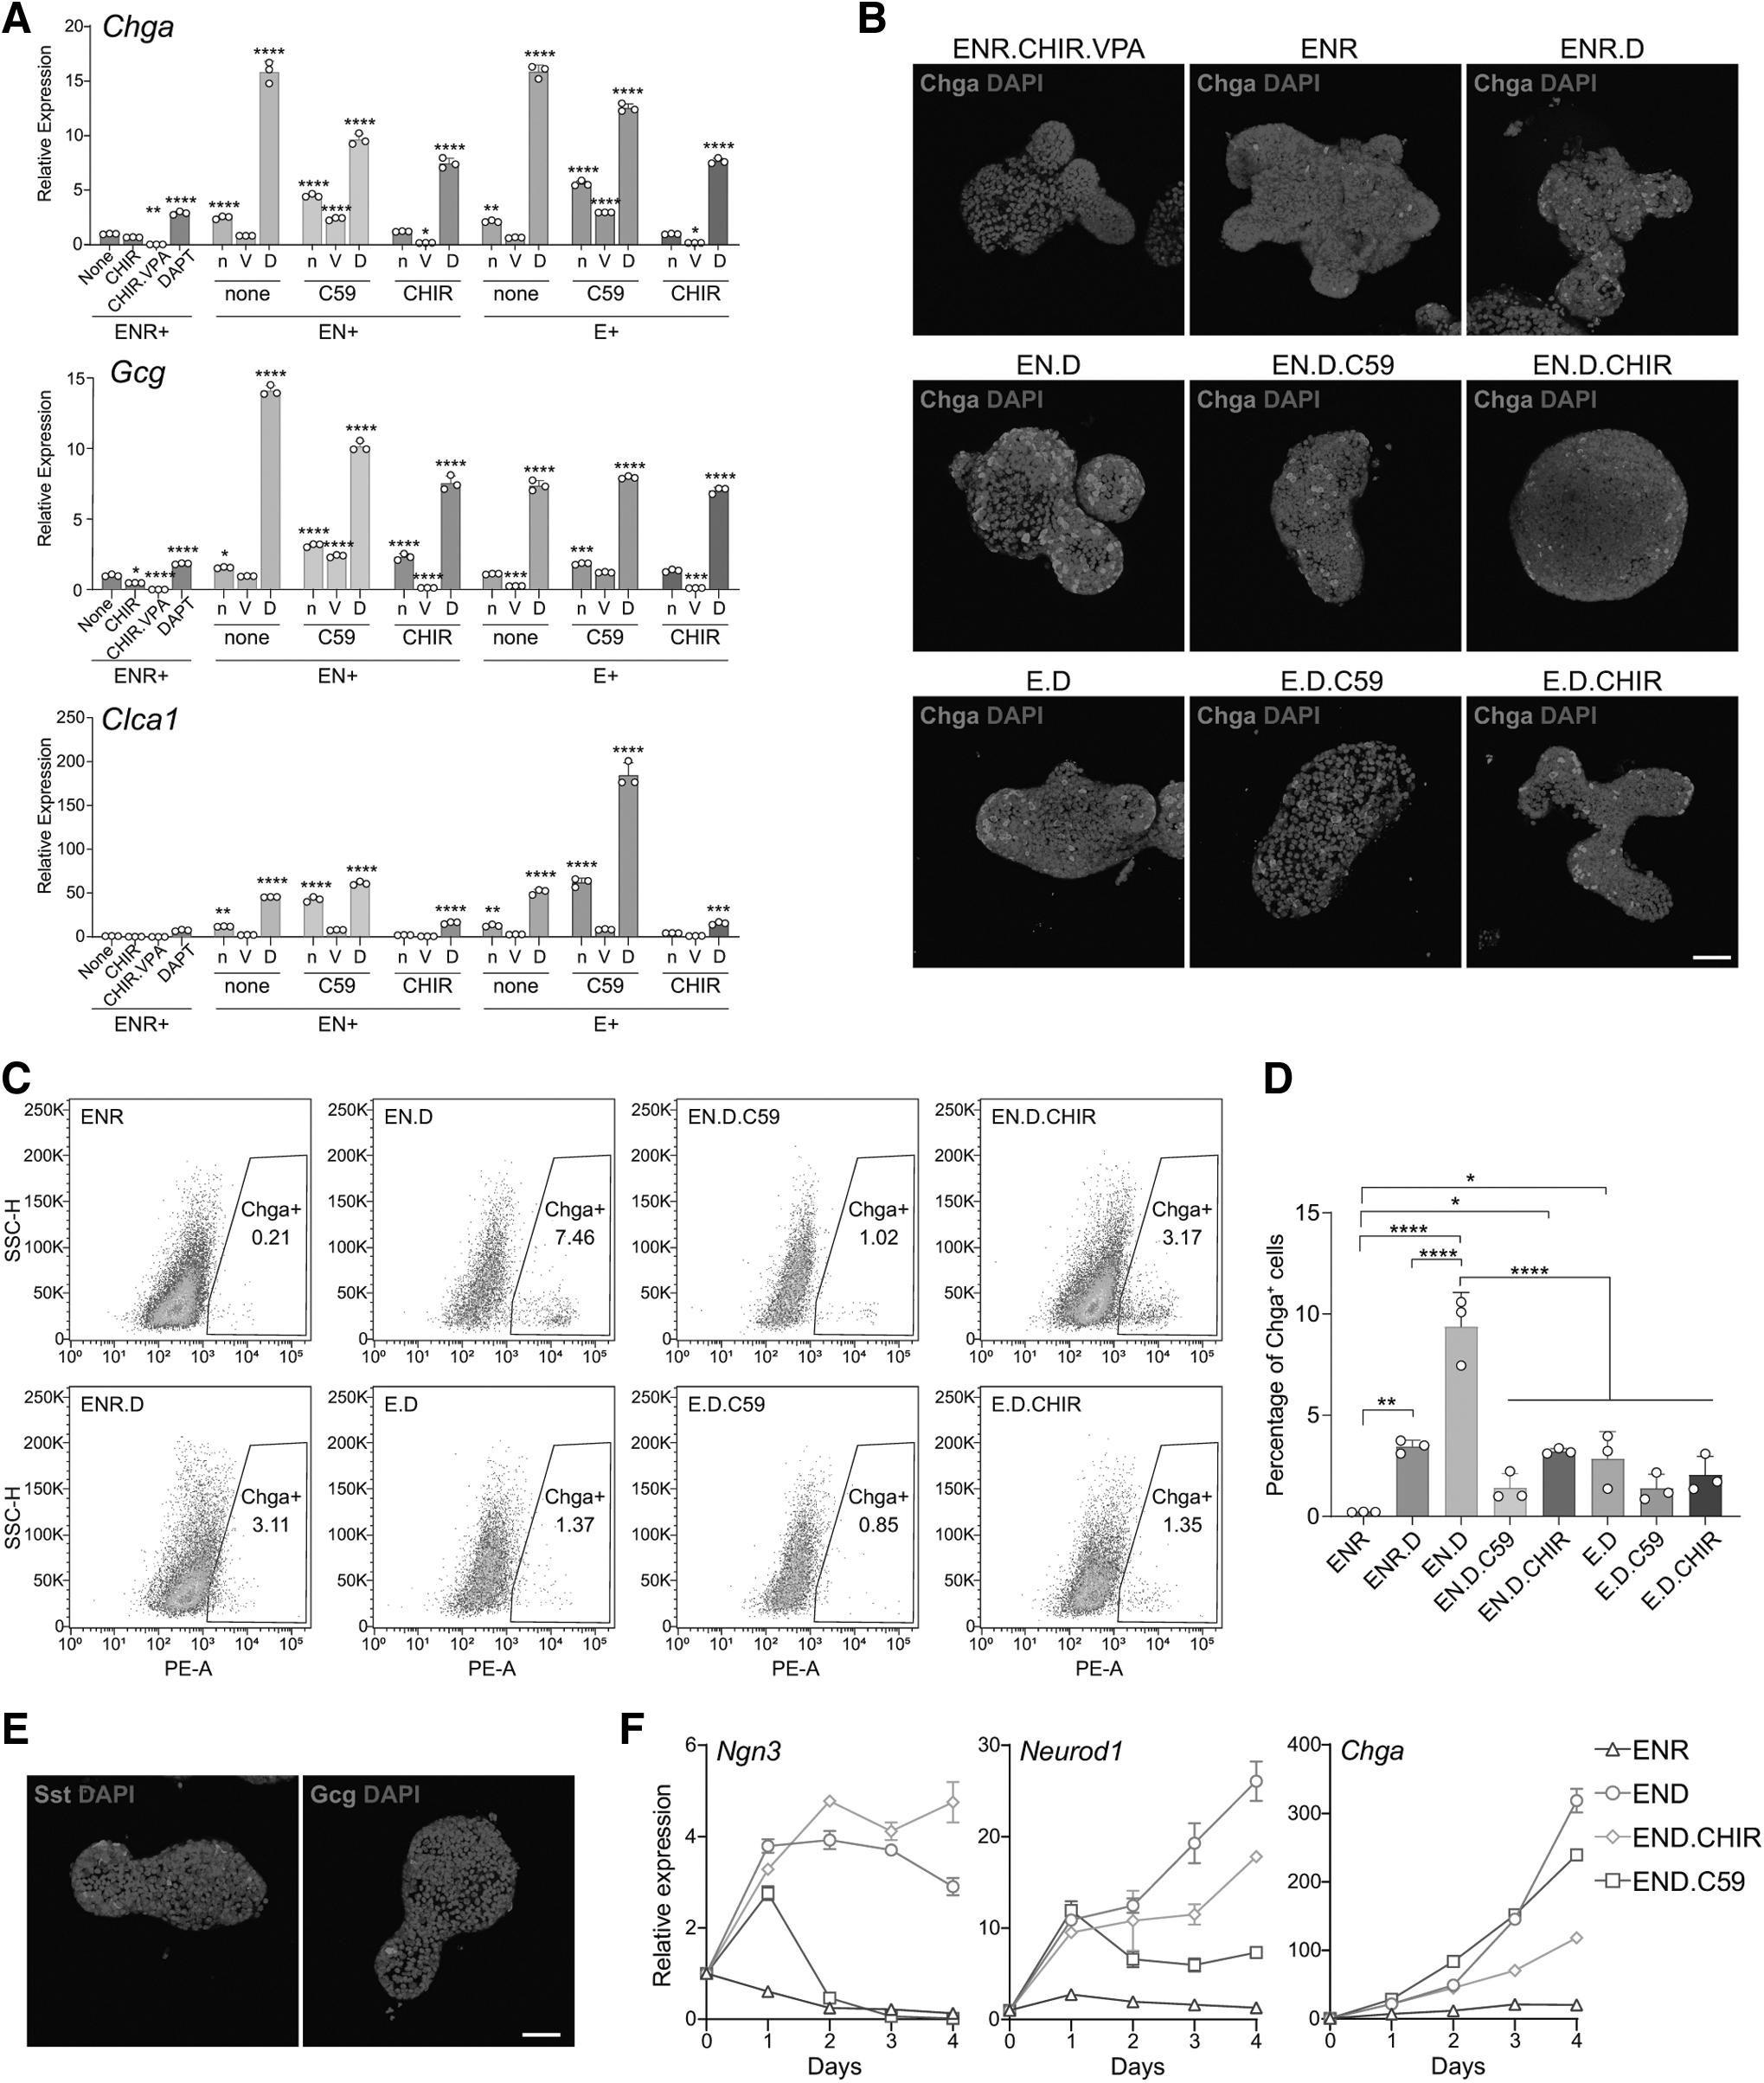
Combinations of small molecules promote secretory lineage differentiation.
We also identified Sst- or Gcg-positive EEC subtypes, although at a lower frequency (Fig. 1E). Tracking the expression of EEC transcription factors Ngn3 and Neurod1 over time showed that the condition without Wnt modulator (EN.D) exhibited elevated Chga after day 4 (Fig. 1F) but lower Ngn3 than the condition with Wnt activator (EN.D.CHIR, Fig. 1F), while C59 rapidly downregulated Ngn3 after day 1 (Fig. 1F). Conversely, the EN.D condition induced a higher expression of transcription factors important for goblet cell differentiation, such as Atoh1, Gfi1, and Spdef compared with the EN.D.C59 condition. However, the EN.D condition did not induce the higher expression of goblet cell differentiation markers (Clca1 and Muc2) than the condition with Wnt inhibitor (EN.D.C59) (Supplementary Fig. S1C). This discrepancy suggests potential temporal regulation by the Wnt signal.
Temporal Wnt signal influences secretory cell fate determination
In the intestinal crypt, cells originating from ISCs continuously migrate along the crypt–villus axis, simultaneously altering cell fate. We propose that cell fate is not only influenced by combinations of static niche signals but also by dynamic niche signals that vary spatiotemporally within the crypt. Among these niche signals, the Wnt signal is crucial in modulating secretory cell fate specification. To assess this, we further explored the temporal influence of Wnt on secretory cell specification following Notch inhibition. This was done by modulating the duration of Wnt activation after DAPT addition (Fig. 2A).
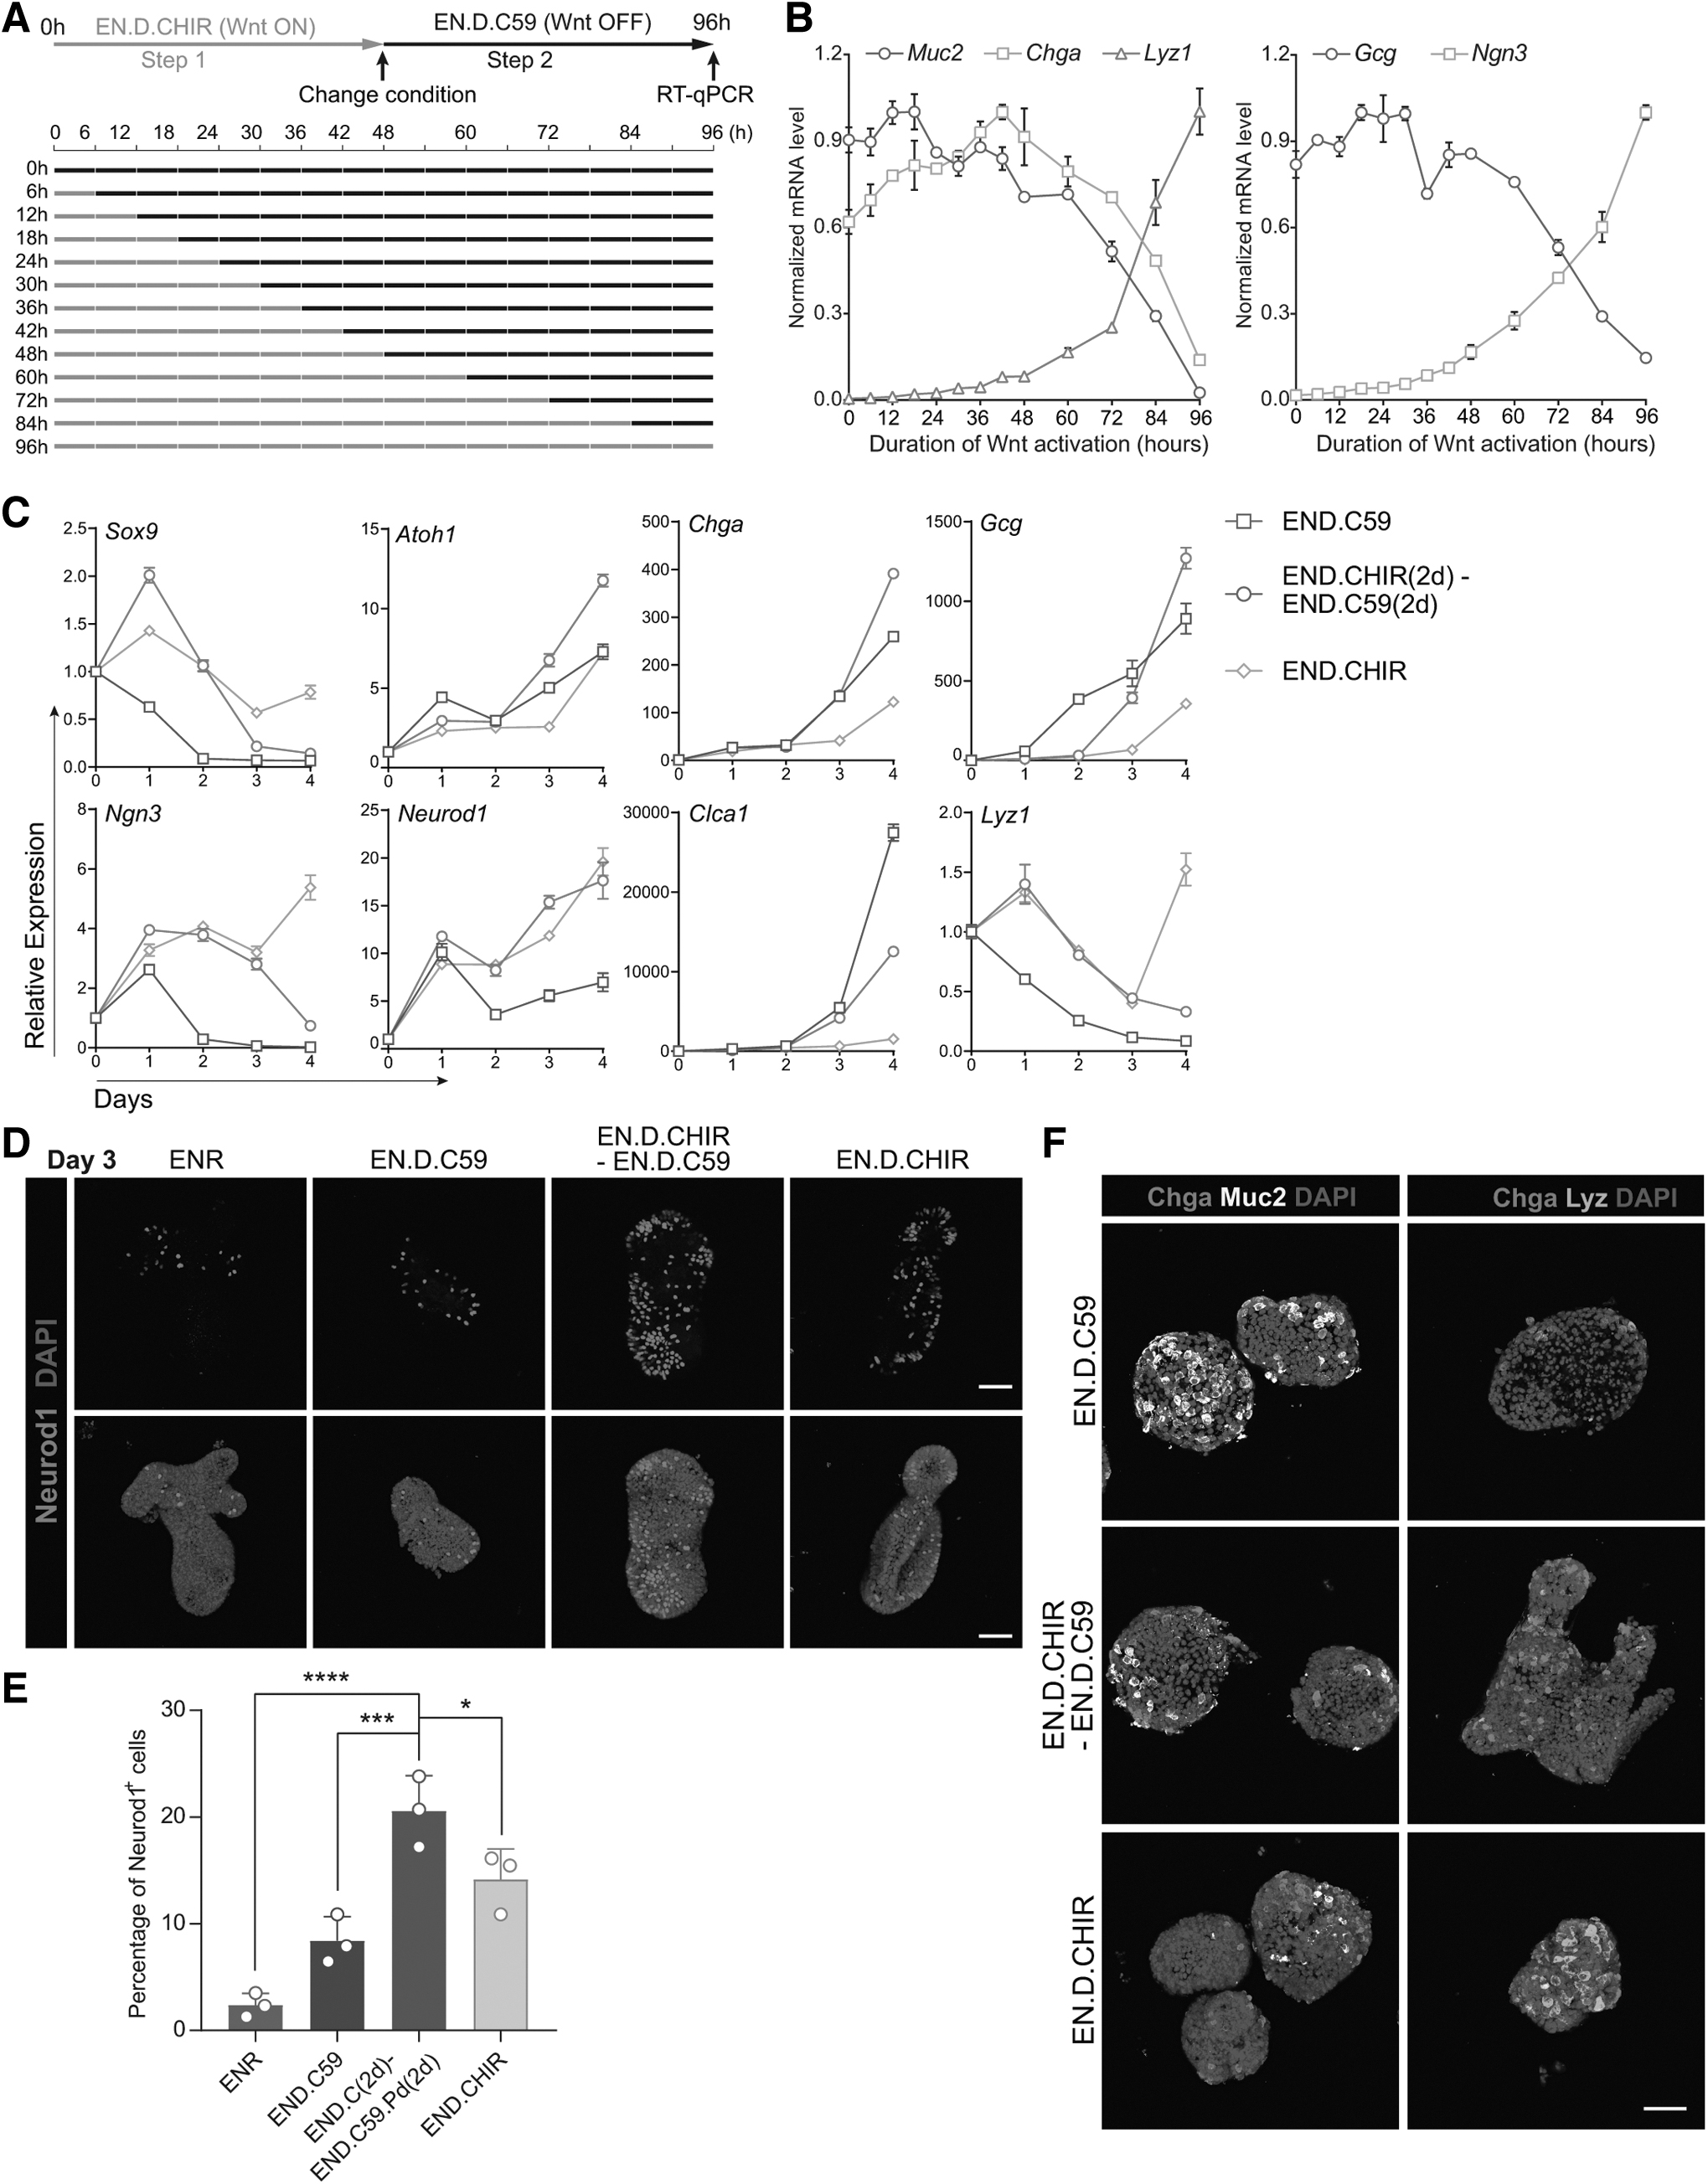
The effect of temporal Wnt signal on secretory cell fate determination.
We found that prolonged high Wnt (96 h condition) increased the expression of Paneth cell marker Lyz1 but diminished goblet and EEC markers Muc2 and Chga postdifferentiation (Fig. 2B). In contrast, continuous Wnt inhibition (0 h condition) showed higher Muc2 expression, moderate Chga, and negligible Lyz1 (Fig. 2B). Meanwhile, transitional Wnt (48 h, for instance) increased Chga but reduced Muc2 and Lyz1 expression (Fig. 2B). Of note, Muc2 expression peaked at 12–18-h Wnt exposure rather than 0 h, suggesting that brief Wnt activation following Notch inhibition enhances goblet cell differentiation (Fig. 2B).
Concurrently, Chga expression peaked at 42–48 h, which showed slightly different kinetics from Gcg, which peaked at 18–30 h. The Paneth cell marker Lyz1 reached a maximum at the 96-h condition (Fig. 2B). Interestingly, Ngn3 showed a continuous increase in expression with longer Wnt exposure, suggesting Wnt plays a role in regulating Ngn3 expression (Fig. 2B).
We also monitored the expression of key transcription factors during intestinal cell differentiation, including Sox9, Atoh1, Ngn3, and Neurod1. Continuously subjected to high Wnt signals (EN.D.CHIR), cells showed elevated Ngn3 and eventually expressed high Lyz1 by day 4. In persistent Wnt inactivation (END.C59 condition), cells expressed reduced Sox9, Ngn3, and Neurod1 and eventually expressed high levels of goblet cell marker Clca1. Under conditions with transitional Wnt state (EN.D.CHIR-EN.D.C59 condition), cells initially upregulated Sox9 and Ngn3 and then downregulated their expression after Wnt inhibition, while upregulating EEC markers Neurod1, Chga, and Gcg (Fig. 2C). This suggests that the downregulation of Ngn3 after switching to Wnt inhibition (EN.D.CHIR-EN.D.C59 condition) may be essential for the maturation of differentiated EECs (Fig. 2C). Furthermore, the quantification of Neurod1-positive cells on day 3 across various conditions revealed a pattern consistent with their gene expression levels.
Specifically, the two-step differentiation protocol yielded the highest number of Neurod1-positive cells (Fig. 2D, E). Immunostaining of goblet cell, EEC, and Paneth cell markers confirmed these findings (Fig. 2F). We also observed consistent morphology changes (Supplementary Fig. S2A) and the upregulation of most EEC subtype markers under these conditions (Supplementary Fig. S2B).
These results suggest that the timing and duration of Wnt activation following Notch inhibition influence the specific cell types that differentiate from ISCs. In particular, a short duration of Wnt activation promotes goblet cell differentiation, an intermediate duration promotes EEC differentiation, and a long duration promotes Paneth cell differentiation.
Combination of temporal Wnt and MAPK inhibition for EEC differentiation
Given that a transitional Wnt signal promoted EEC differentiation, we sought to further optimize the EEC differentiation condition (Fig. 3A). We started with the EN.D condition as a basal condition, with the highest EEC differentiation, as in Fig. 1A. The addition of MAPK inhibitor PD0325901 (Pd) further increased EEC differentiation (the EN.D.Pd condition in Fig. 3B, C) [24]. Moreover, adding an initial Wnt activation step further enhanced EEC differentiation (the EN.D.CHIR-EN.D.Pd condition in Fig. 3B, C), which showed a high percentage of EECs in the organoids (Fig. 3D).
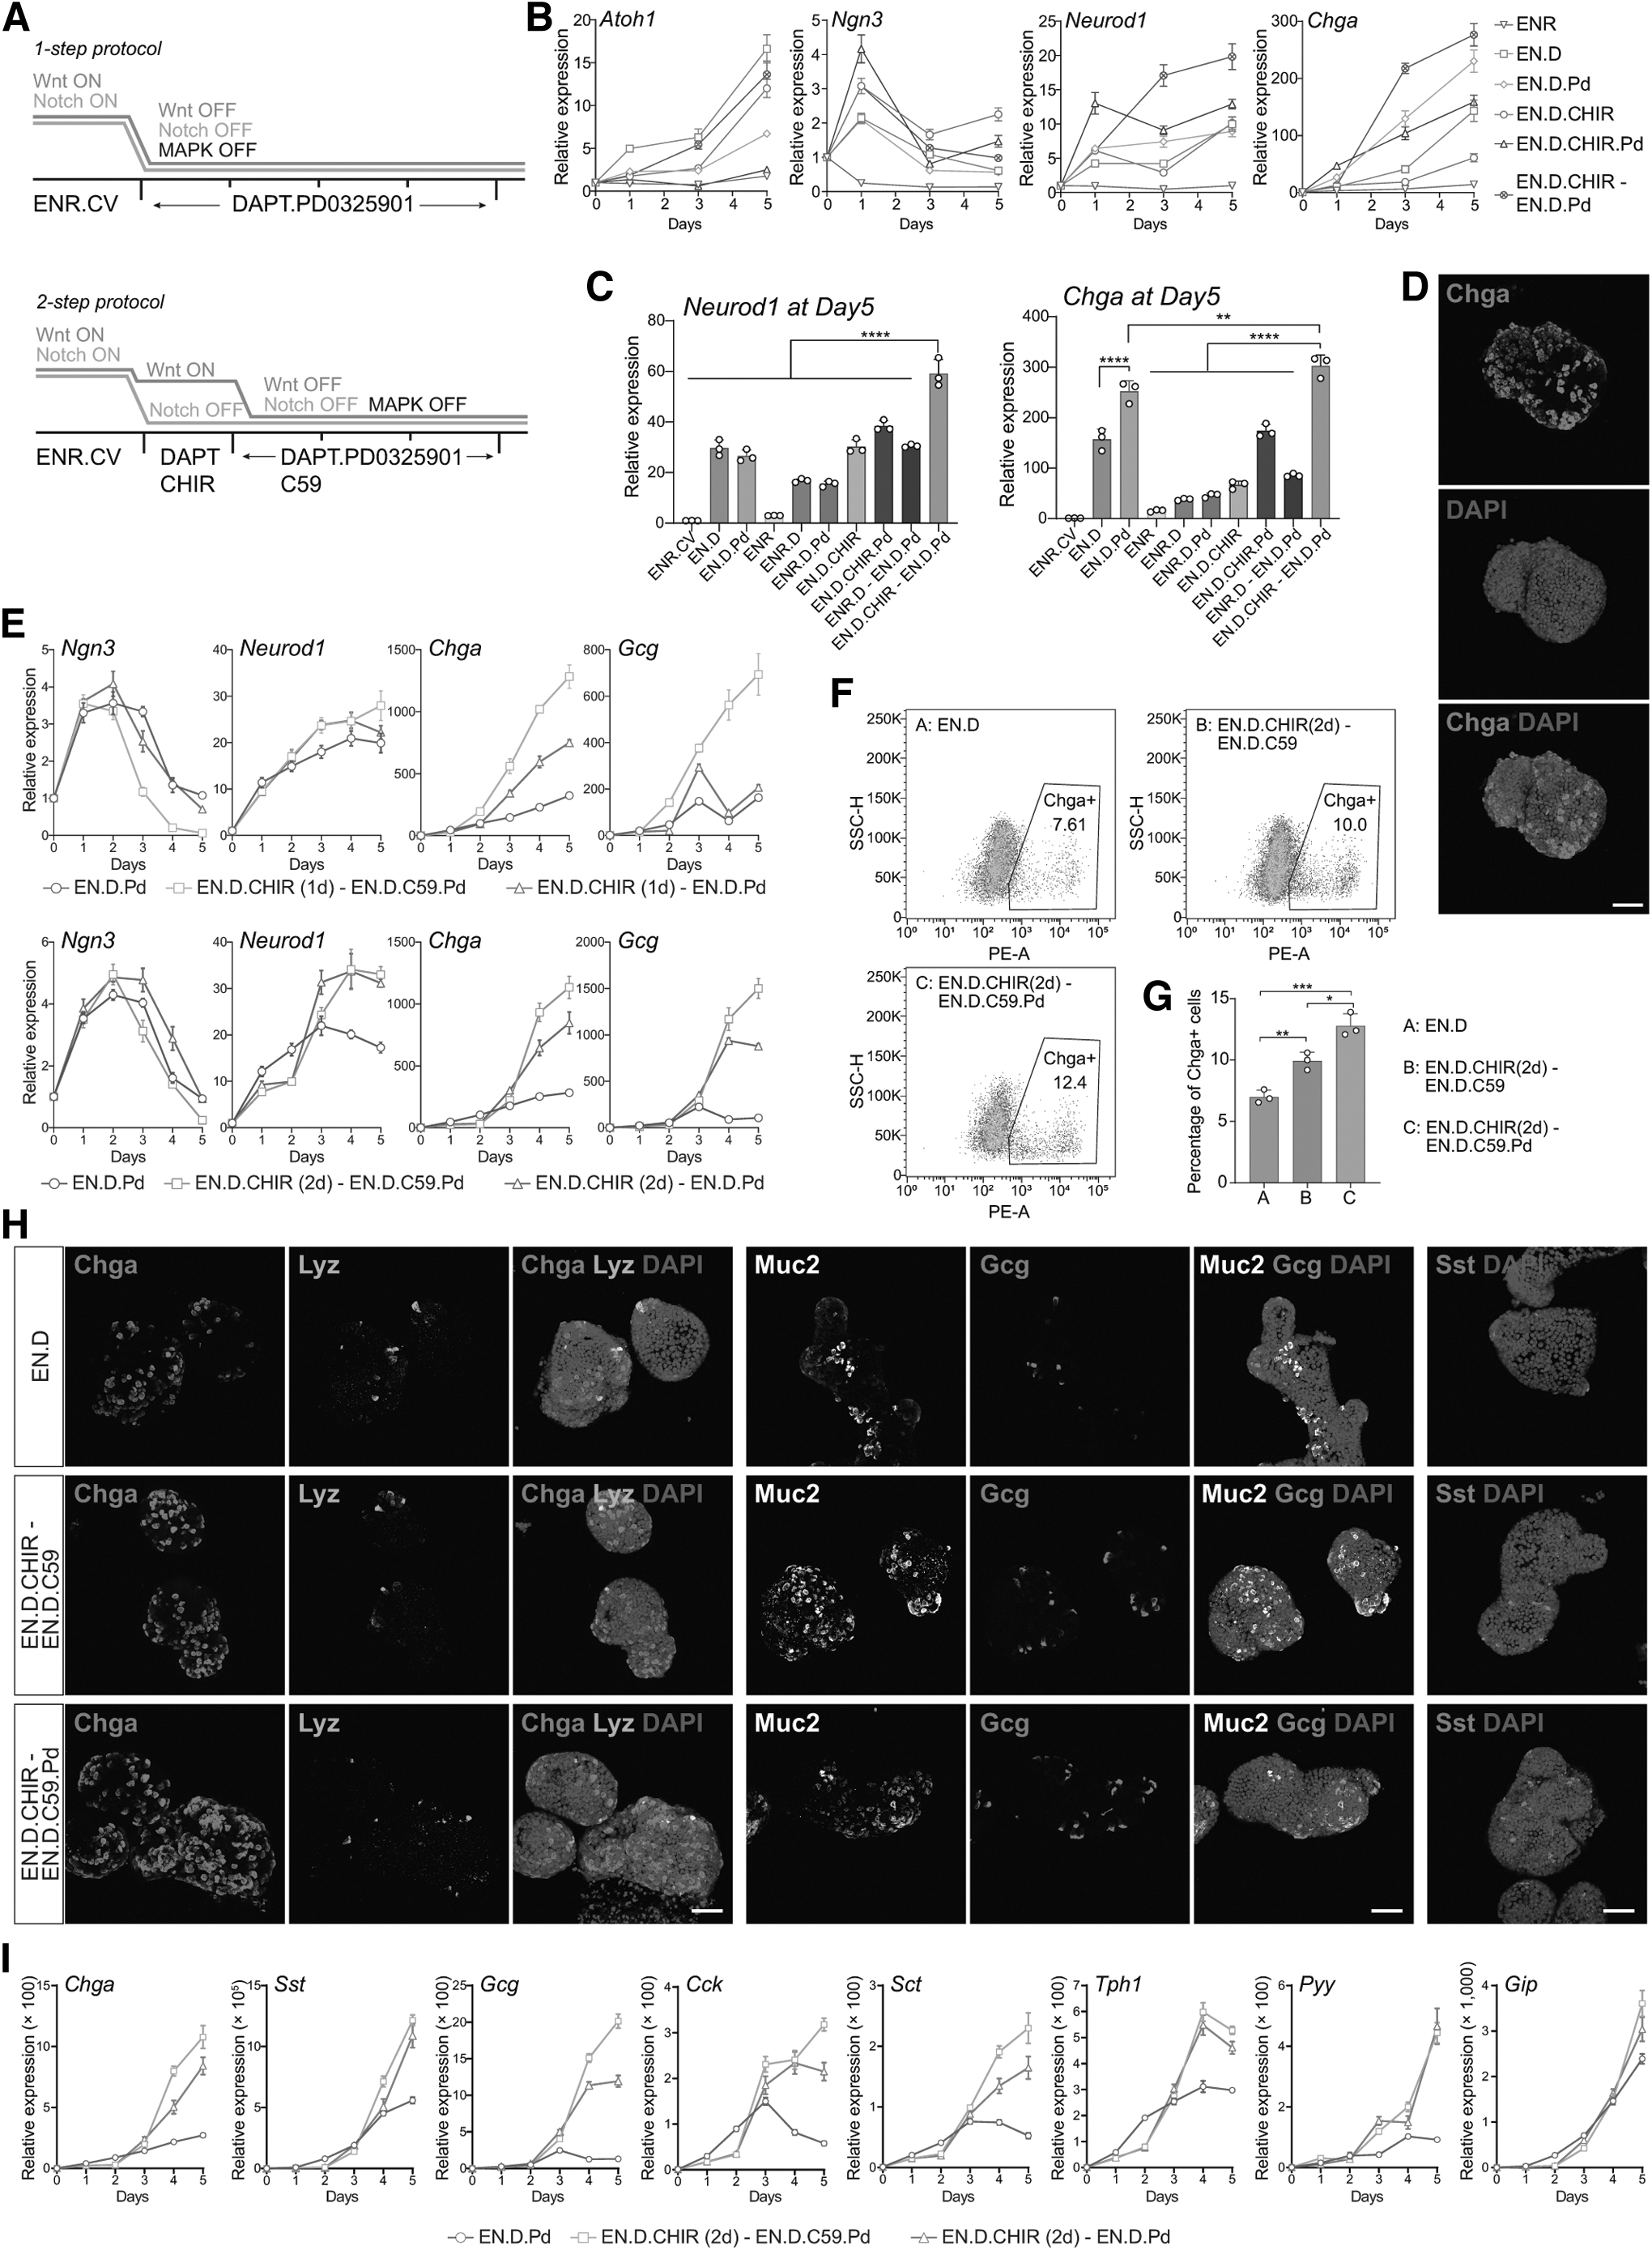
Optimize EEC differentiation by Wnt regulation.
In addition, adding Wnt-C59 (C59) in the second step to inhibit Wnt signaling further increased EEC differentiation (Fig. 3E, I). We also found that a 2-day Wnt activation step induced comparable Chga but higher Gcg compared with a 1-day Wnt activation step and was thus maintained in the optimized EEC differentiation protocol (Fig. 3E). Under this protocol, Chga+ EECs constituted 12.4% of the organoid cells (Fig. 3F, G), compared with 0.21% in the ENR condition (Fig. 1C). The optimized protocol generated enriched EECs, but low levels of goblet cells, Paneth cells, or enterocytes (Fig. 3H and Supplementary Fig. S3B). In addition, the EEC subtype markers also significantly increased (Fig. 3I and Supplementary Fig. S3A). Cells expressing the EEC subtype marker Gcg or Sst were also detected in the organoids (Fig. 3H).
The combination of EGFR, Wnt, and Notch inhibitors has been previously reported to efficiently induce EEC differentiation [24]. We conducted a comparative analysis through immunostaining and quantification of EEC marker Chga and also performed qPCR quantification for EEC-specific markers Chga and Neurod1. Our findings validate the superiority of the optimized protocol (EN.D.CHIR-EN.D.C59.Pd), demonstrating the highest EEC proportion and marker gene expression (Fig. 4A–C). Furthermore, it has been reported that the BMP signaling gradient along the crypt–villus axis modulates hormone expression [33]. We tested the effect of BMP modulation in our optimized protocol and observed a notable decrease in Gcg-expressing L cells and a modest reduction in SSt-expressing D cells upon BMP addition (Fig. 4D). Moreover, our optimized protocol led to a significant augmentation in GLP-1 secretion; a fivefold increase of GLP-1 secretion following glucose stimulation, suggesting these EECs were mature and functional (Fig. 4E).
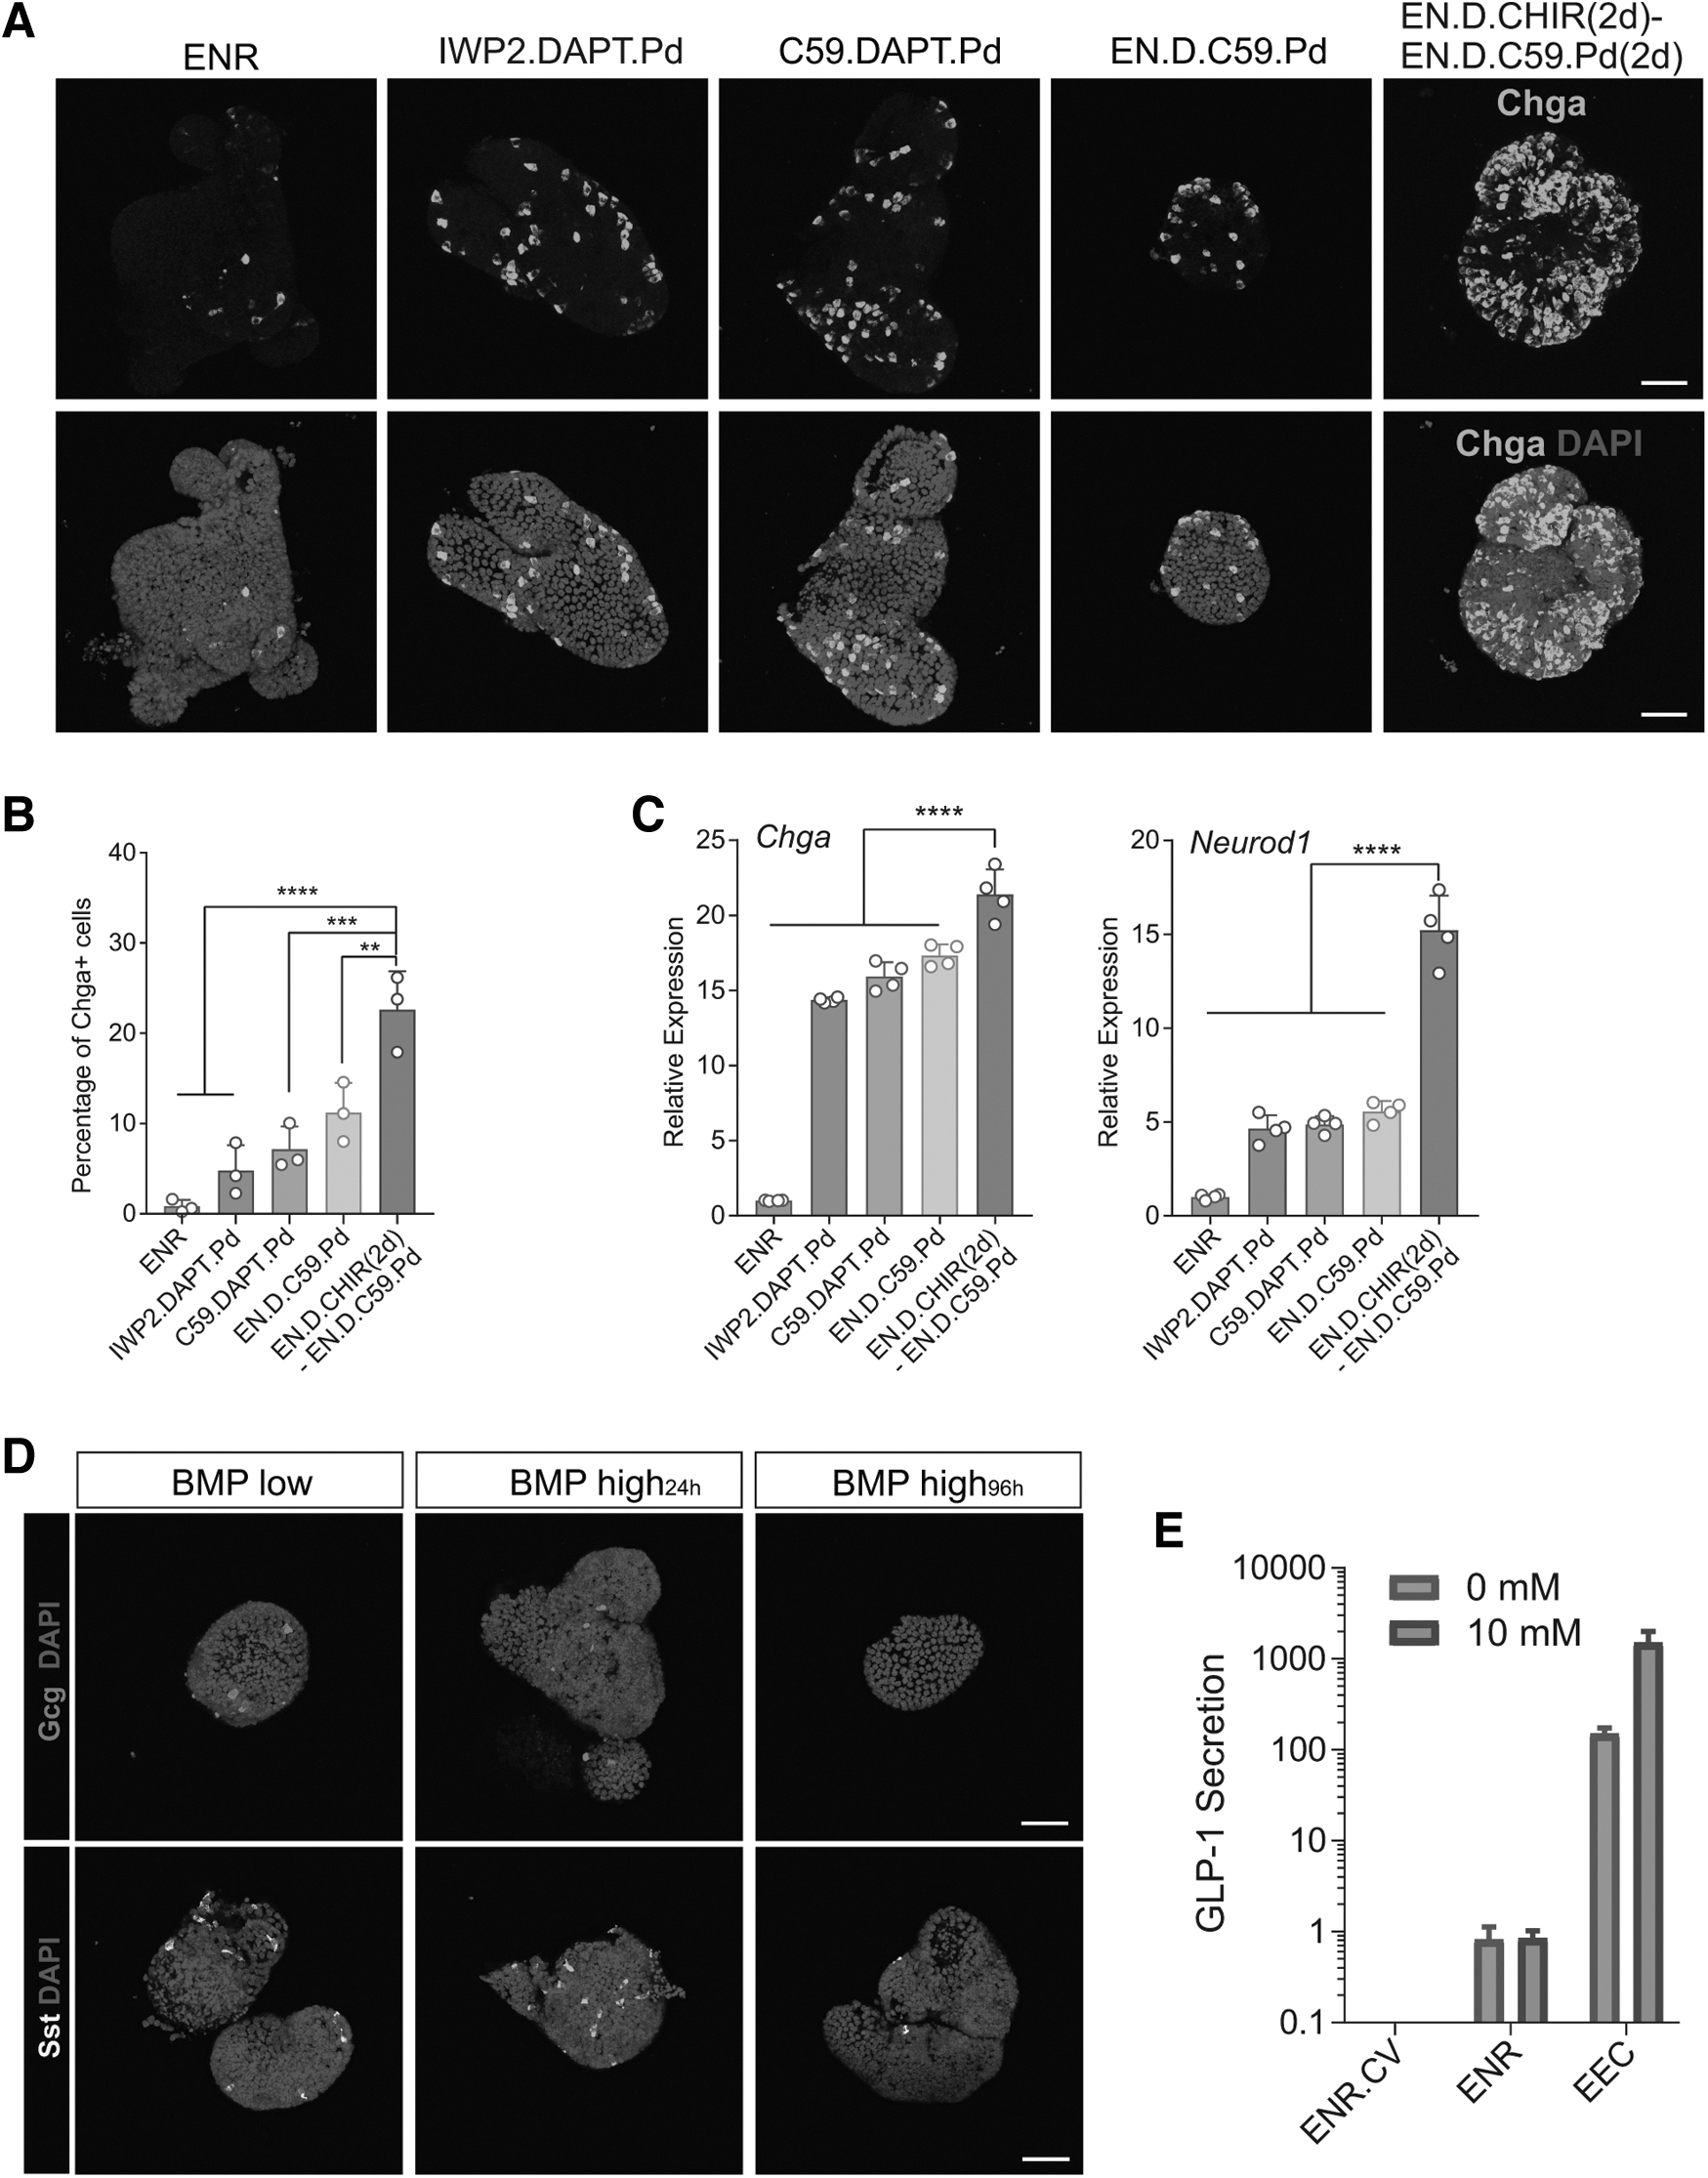
Optimized condition yields high-purity and mature EECs.
To elucidate the gene expression profile, we performed RNAseq analysis on EECs generated using our optimized protocol. EEC lineage-specific markers such as Mc4r, Nts, Isl1, Nkx2–2, and Chga, along with subtype-specific markers such as Cck, Sct, and Gcg, were significantly upregulated (Fig. 5A, B). Conversely, markers associated with ISCs or progenitor cells, including Olfm4, Lgr5, Ascl2, Tert, and Cdca7, were downregulated (Fig. 5A, B). GO enrichment analyses aligned with these findings, showing upregulation of processes such as peptide hormone secretion, hormone and fatty acid metabolism, and stimulus response (Fig. 5C), thereby corroborating the efficiency and specificity of EEC differentiation protocol.
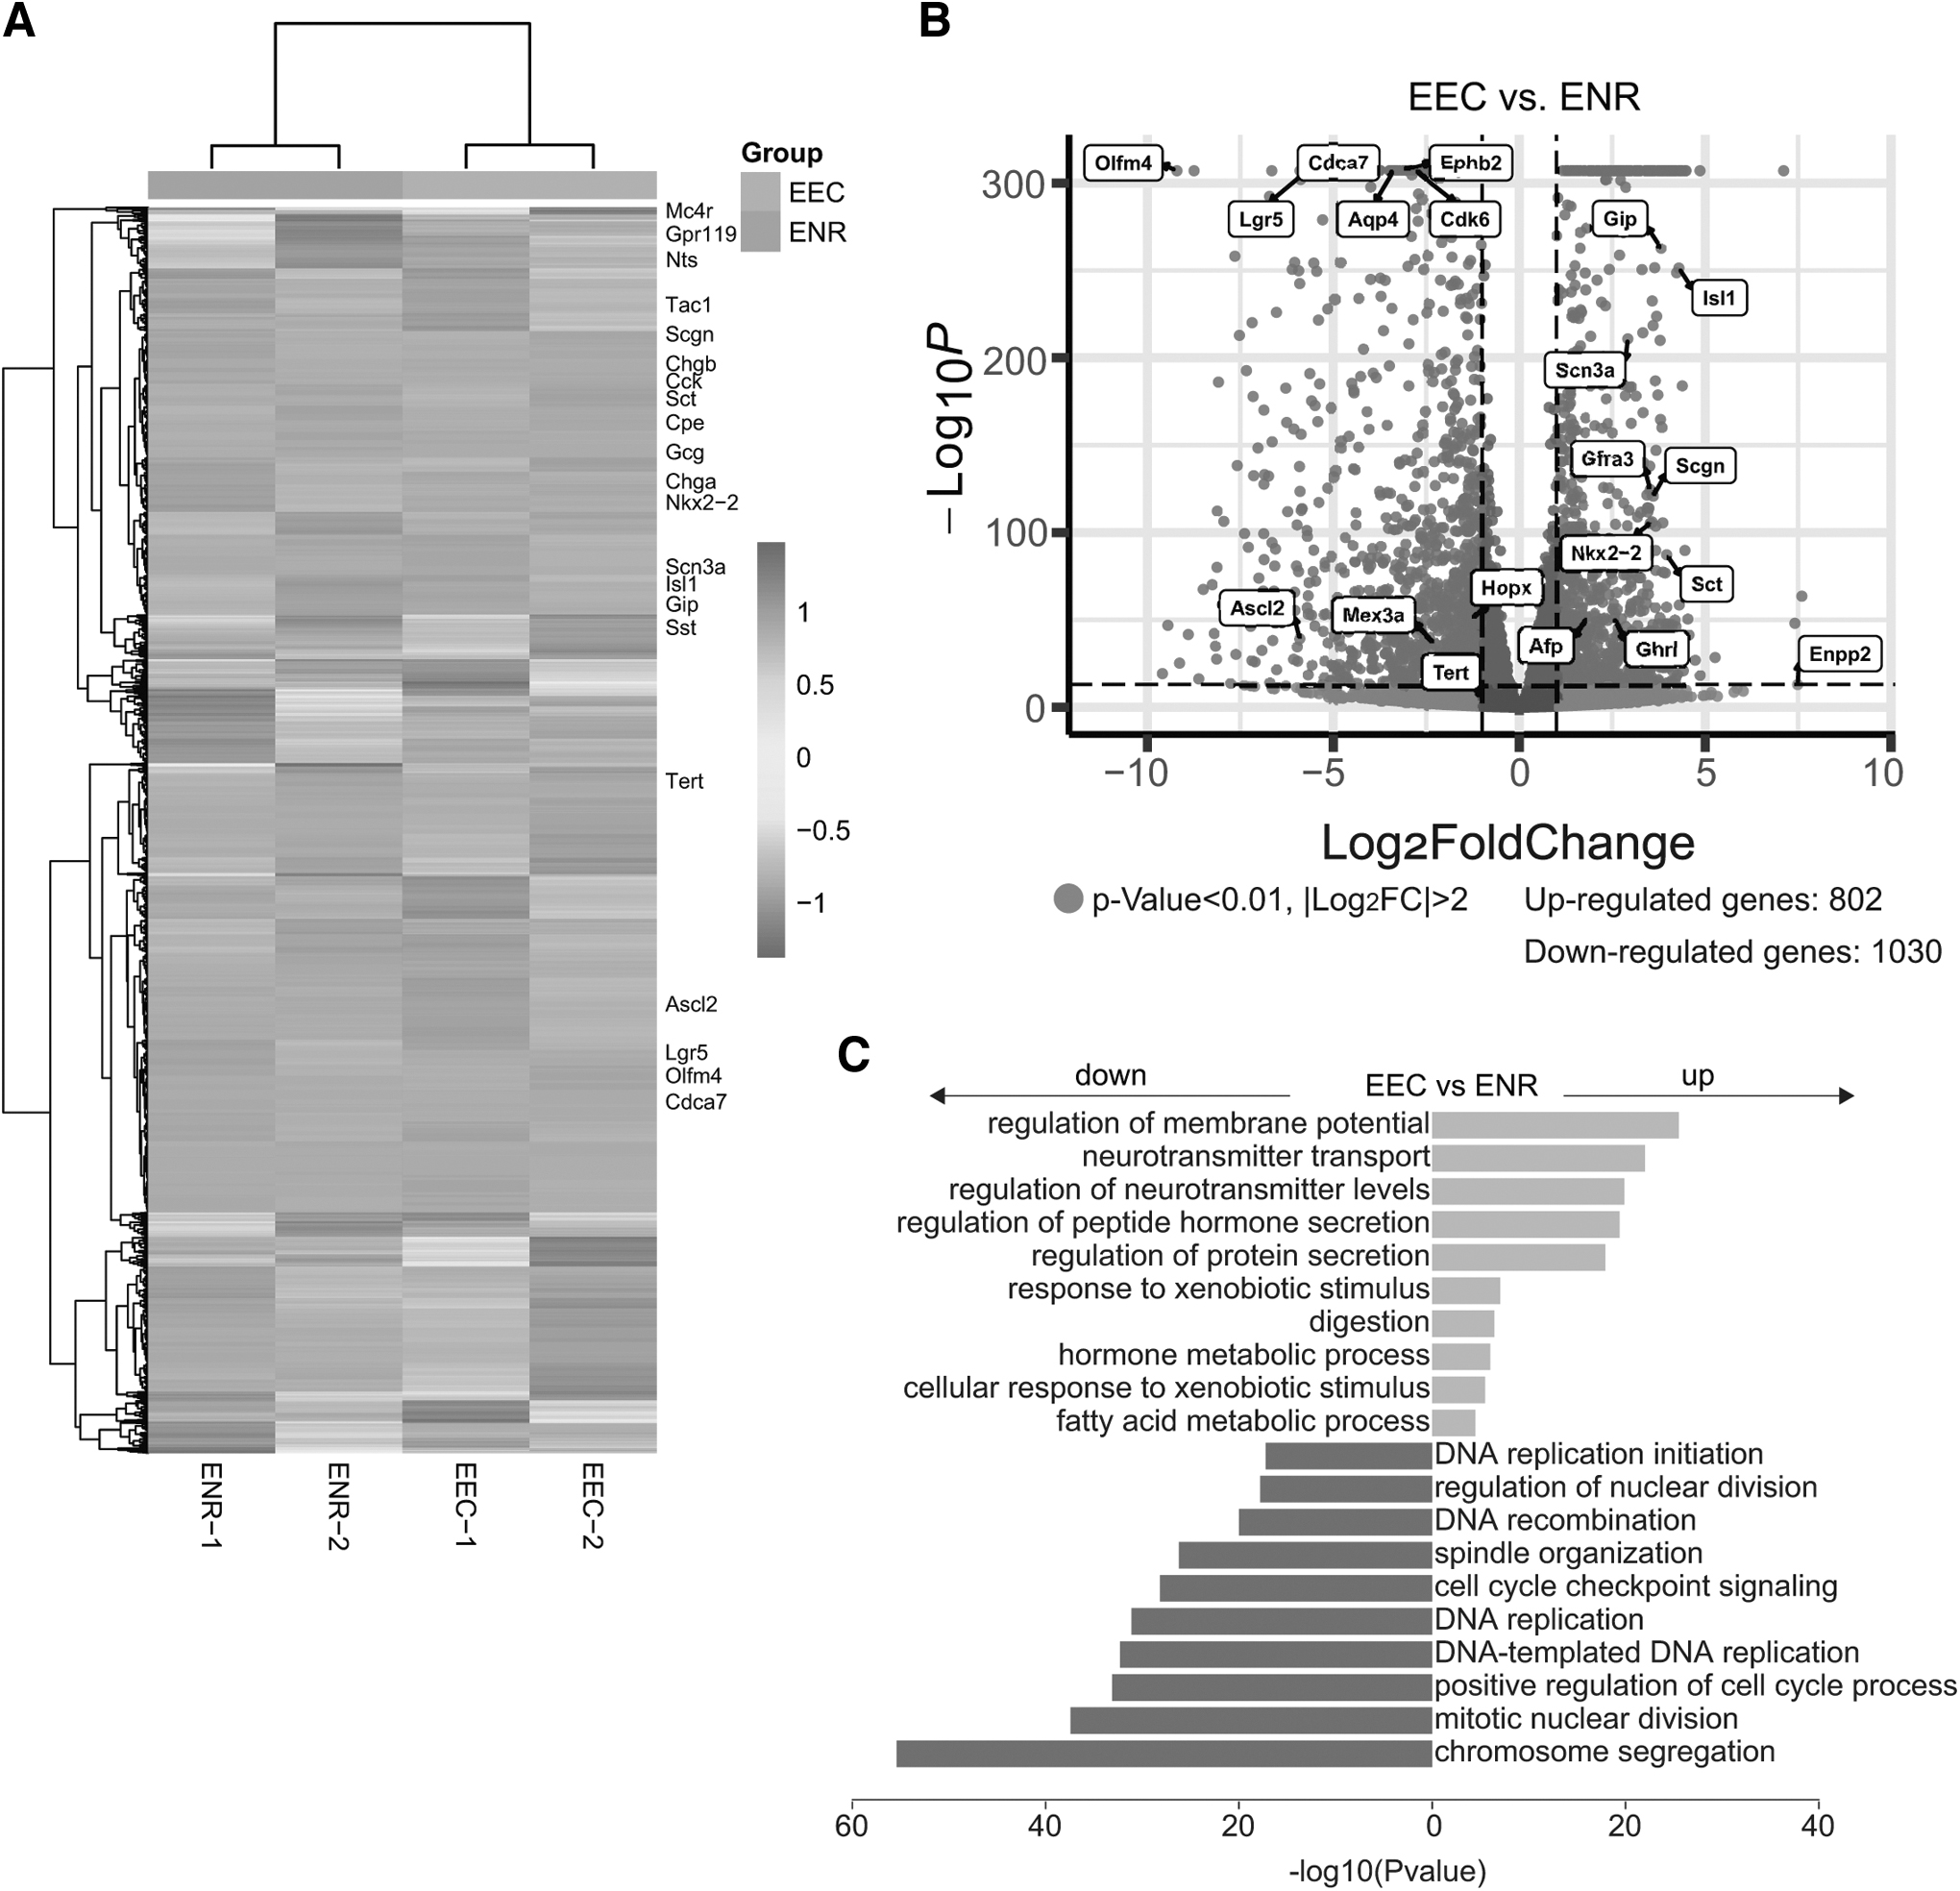
RNA sequencing uncovers EEC gene profile.
Combination of temporal Wnt and fibroblast growth factor receptor activation for goblet cell differentiation
We further optimized the goblet cell differentiation protocol from ISCs. Based on Notch and Wnt inhibition (D.C59 condition), we performed a combination screening of multiple conditions (Fig. 6A). Instead of directly transitioning to Wnt inhibition (D.C59) from CV, we tested conditions by treating the cells with a Wnt activator (D.CHIR) for 1 day before transitioning to Wnt inhibition (D.C59). We found that (1) replacing EGF with FGF2 in the presence of the BMP inhibitor (N) (F.N.D.C59 vs. E.N.D.C59) markedly increased goblet cell marker Muc2 and Clca1 expression. (2) Further switching to a two-step protocol consisting of a first Wnt activation step (D.CHIR) and a second Wnt inhibition step (D.C59) increased goblet cell differentiation [F.N.D.C59 vs. F.N.D.CHIR (1 day)–F.N.D.C59 (3 days) in Fig. 6A]. This optimized condition induced apparent morphological change in the organoid cells, resembling goblet cells (Fig. 6B), corroborated by Muc2 staining (Fig. 6C).
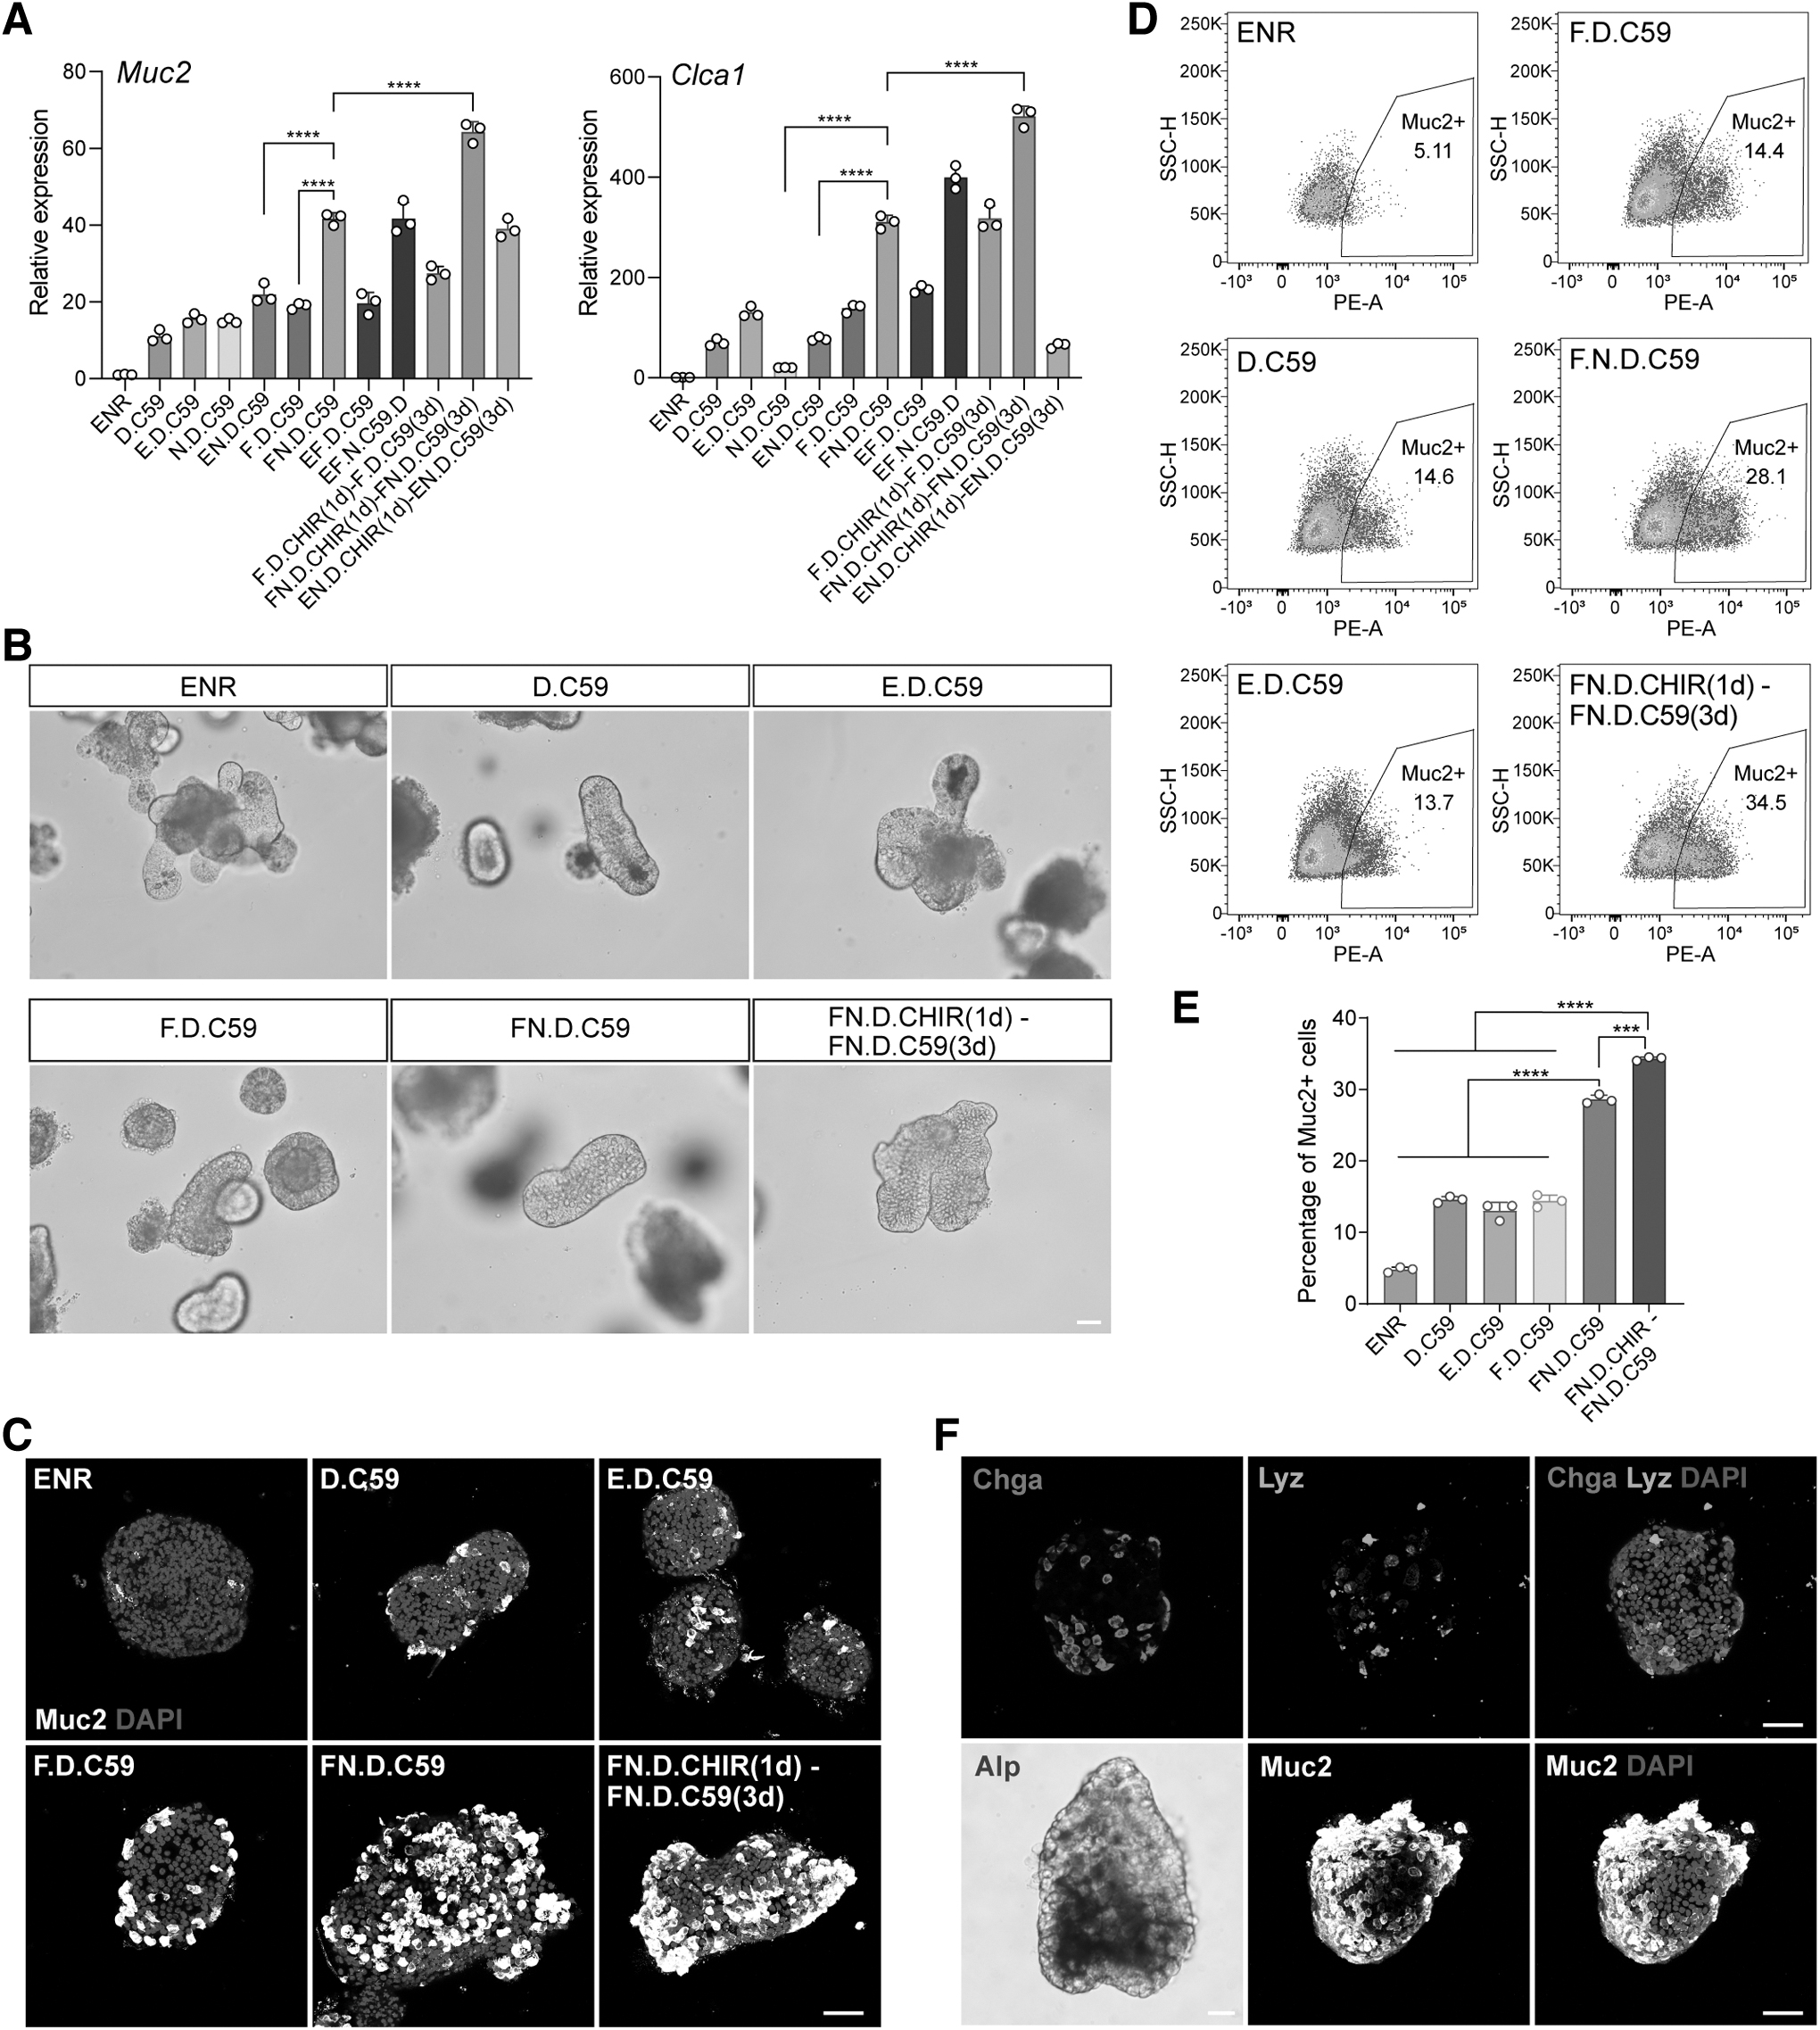
Optimized differentiation condition of goblet cell by regulating Wnt signaling.
The refined goblet cell differentiation protocol yielded 34.5% Muc2+ cells compared with 5.11% in the ENR condition (Fig. 6D, E). Furthermore, this condition led to low EEC, Paneth cell, or enterocyte differentiation (Fig. 6F), demonstrating its specificity. Mechanistically, combining FGF2 with a two-step Wnt induced a temporary upregulation of transcription factors that are important for the differentiation of goblet cells, such as Sox9, Gfi1, Atoh1, Klf4, and Spdef, compared with other conditions (Fig. 7A). Confirming this, our day 2 quantification showed that this two-step Wnt differentiation approach resulted in the most substantial elevation in the number of Klf4-positive cells (Fig. 7B, C). This increase in Klf4-positive cells was consonant with the gene expression data and strongly correlated with increased goblet cell differentiation (Fig. 7D).
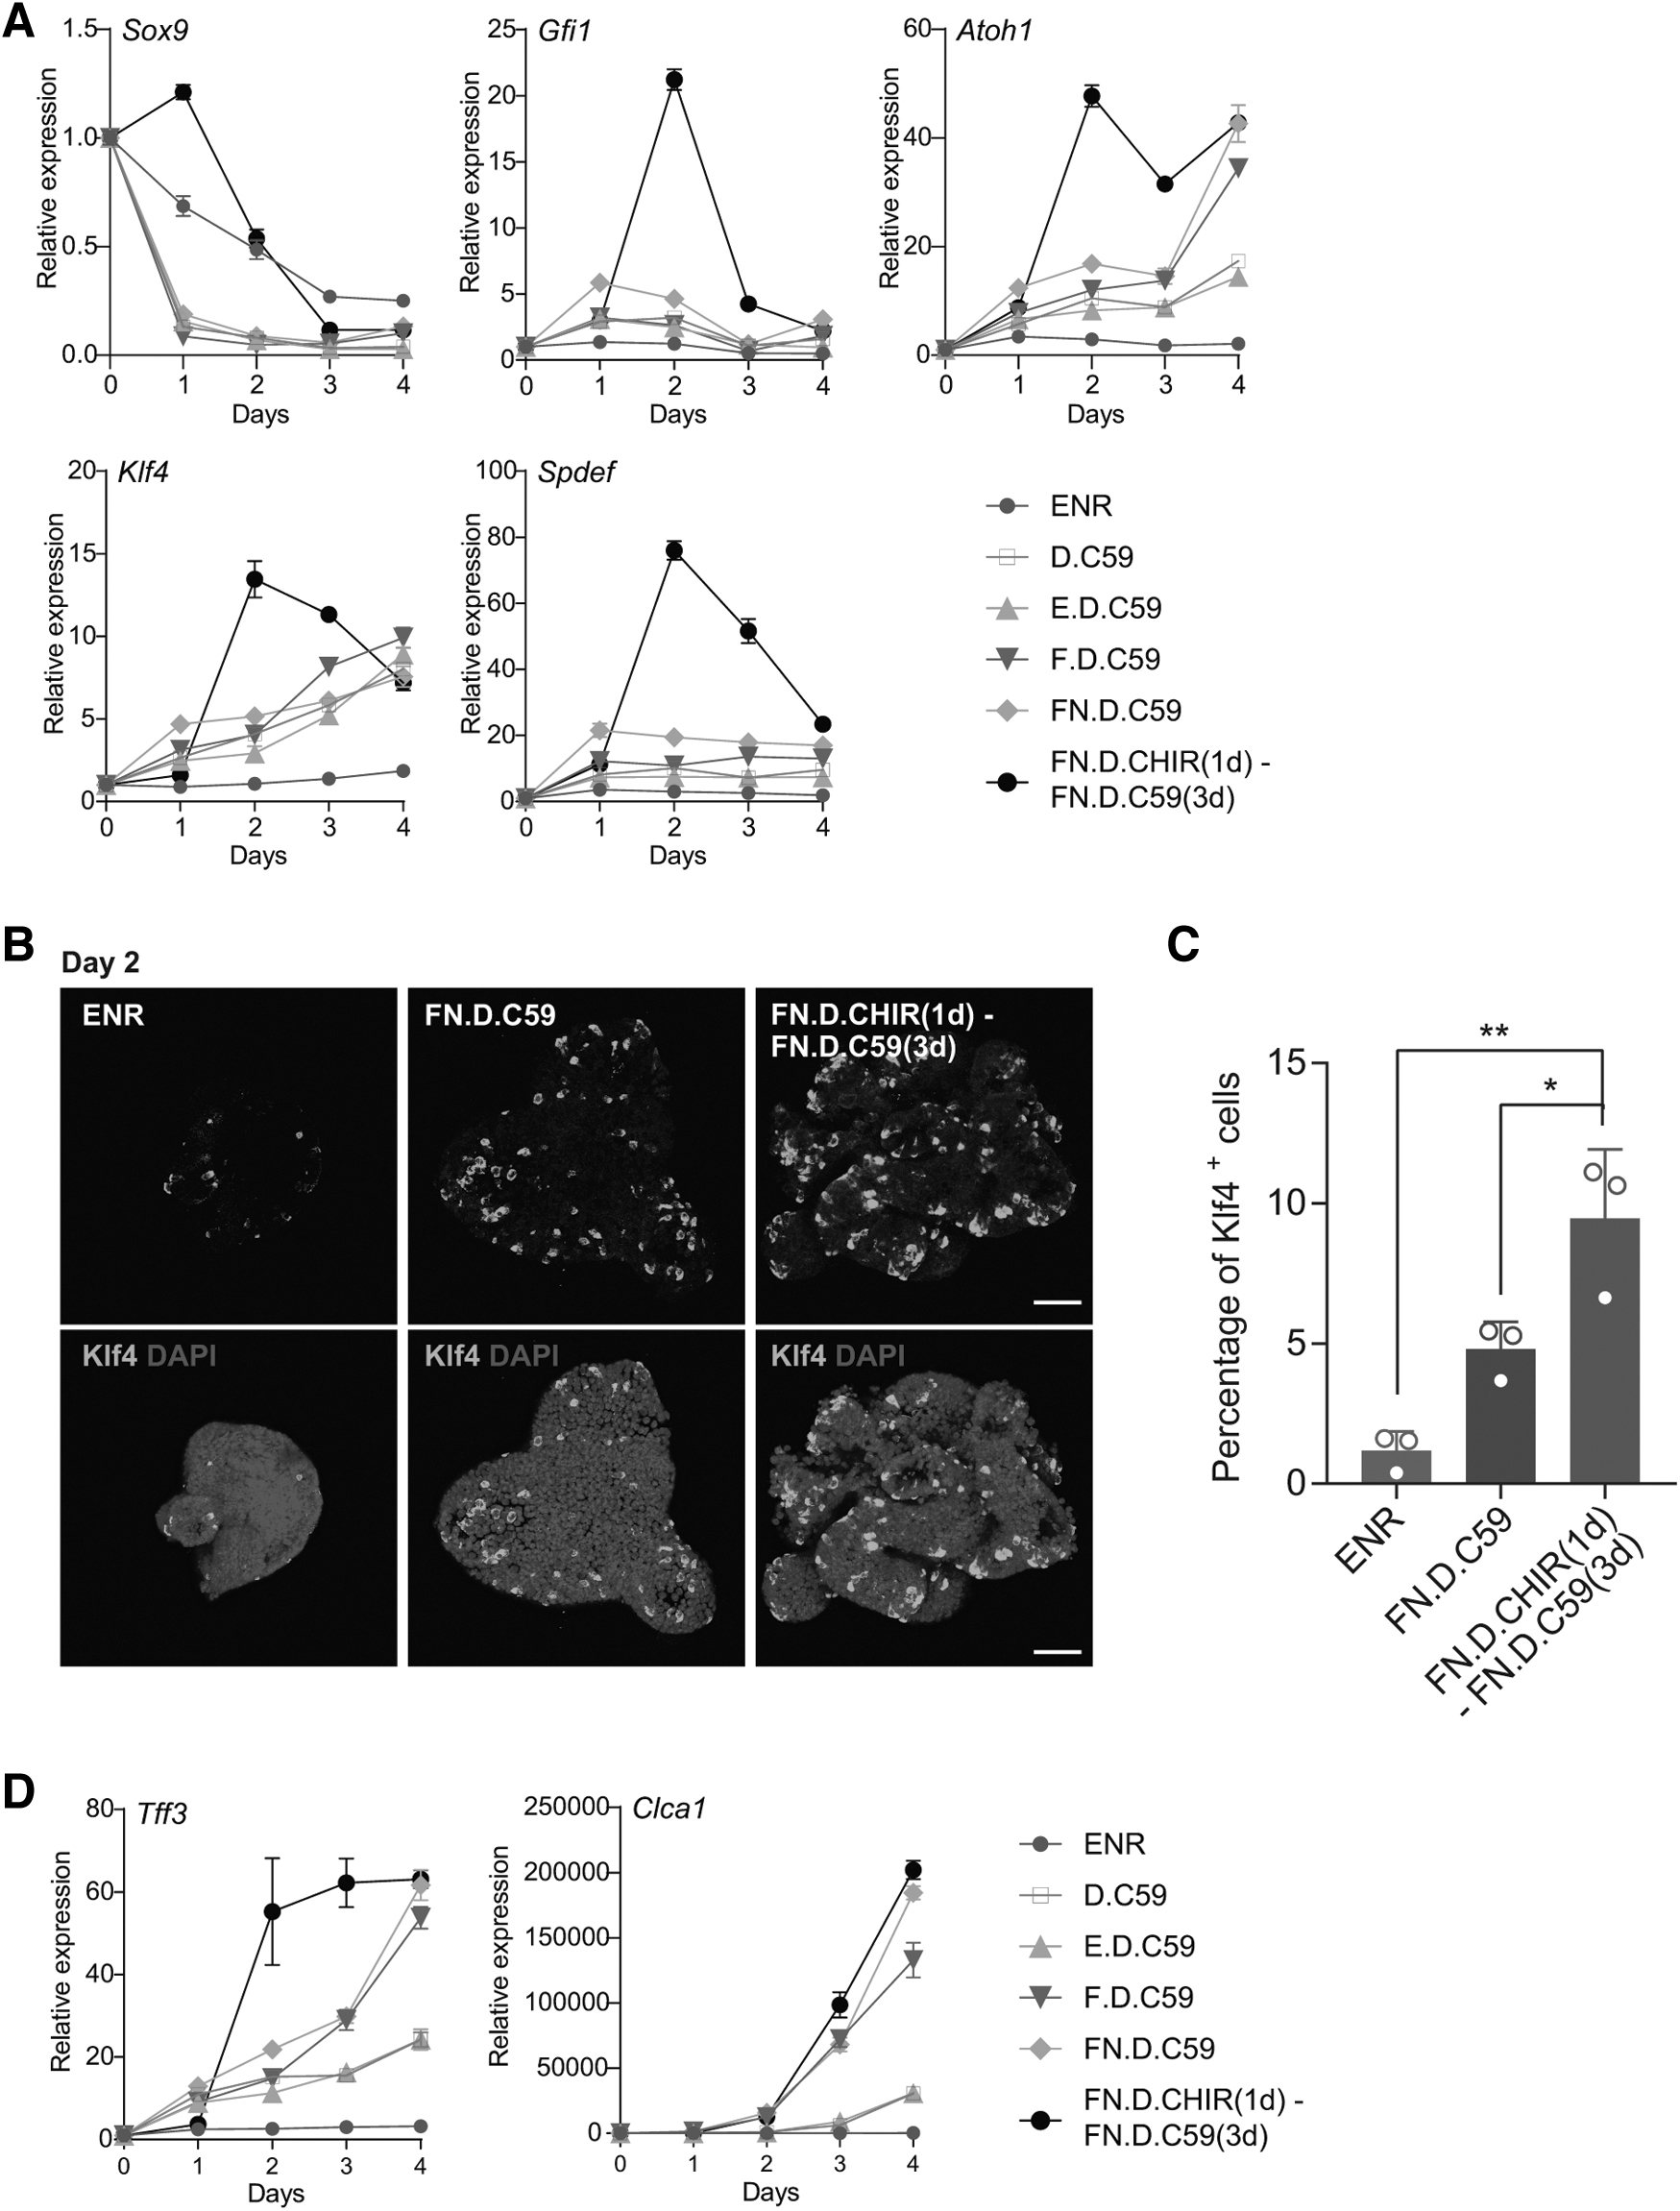
Wnt signaling regulates the expression of key transcript factors during goblet cell differentiation.
Further comparisons were made between our optimized goblet cell differentiation protocol and previously established methods [22]. Immunofluorescence images, cell quantification, and qPCR analyses collectively revealed a significant enhancement in goblet cell differentiation efficiency using our proposed protocol (Fig. 8A–C). RNAseq analysis on differentiated goblet cells demonstrated an upregulation of goblet cell-associated markers such as Spdef, Muc2, Muc3, Clca1, and Tff3, and a downregulation of stem cell-related genes, including Olfm4, Lgr5, Aqp4, and Cdk6 (Fig. 8D, E). GO enrichment analysis showed an upregulation of processes such as peptide secretion and membrane potential (Fig. 8F), affirming the functional maturity of the goblet cells generated. Lastly, we demonstrated that the Wnt3a protein could achieve comparable results with CHIR99021, not only in inducing differentiation but also in upregulating Wnt-relative genes (Supplementary Fig. S4A–E).
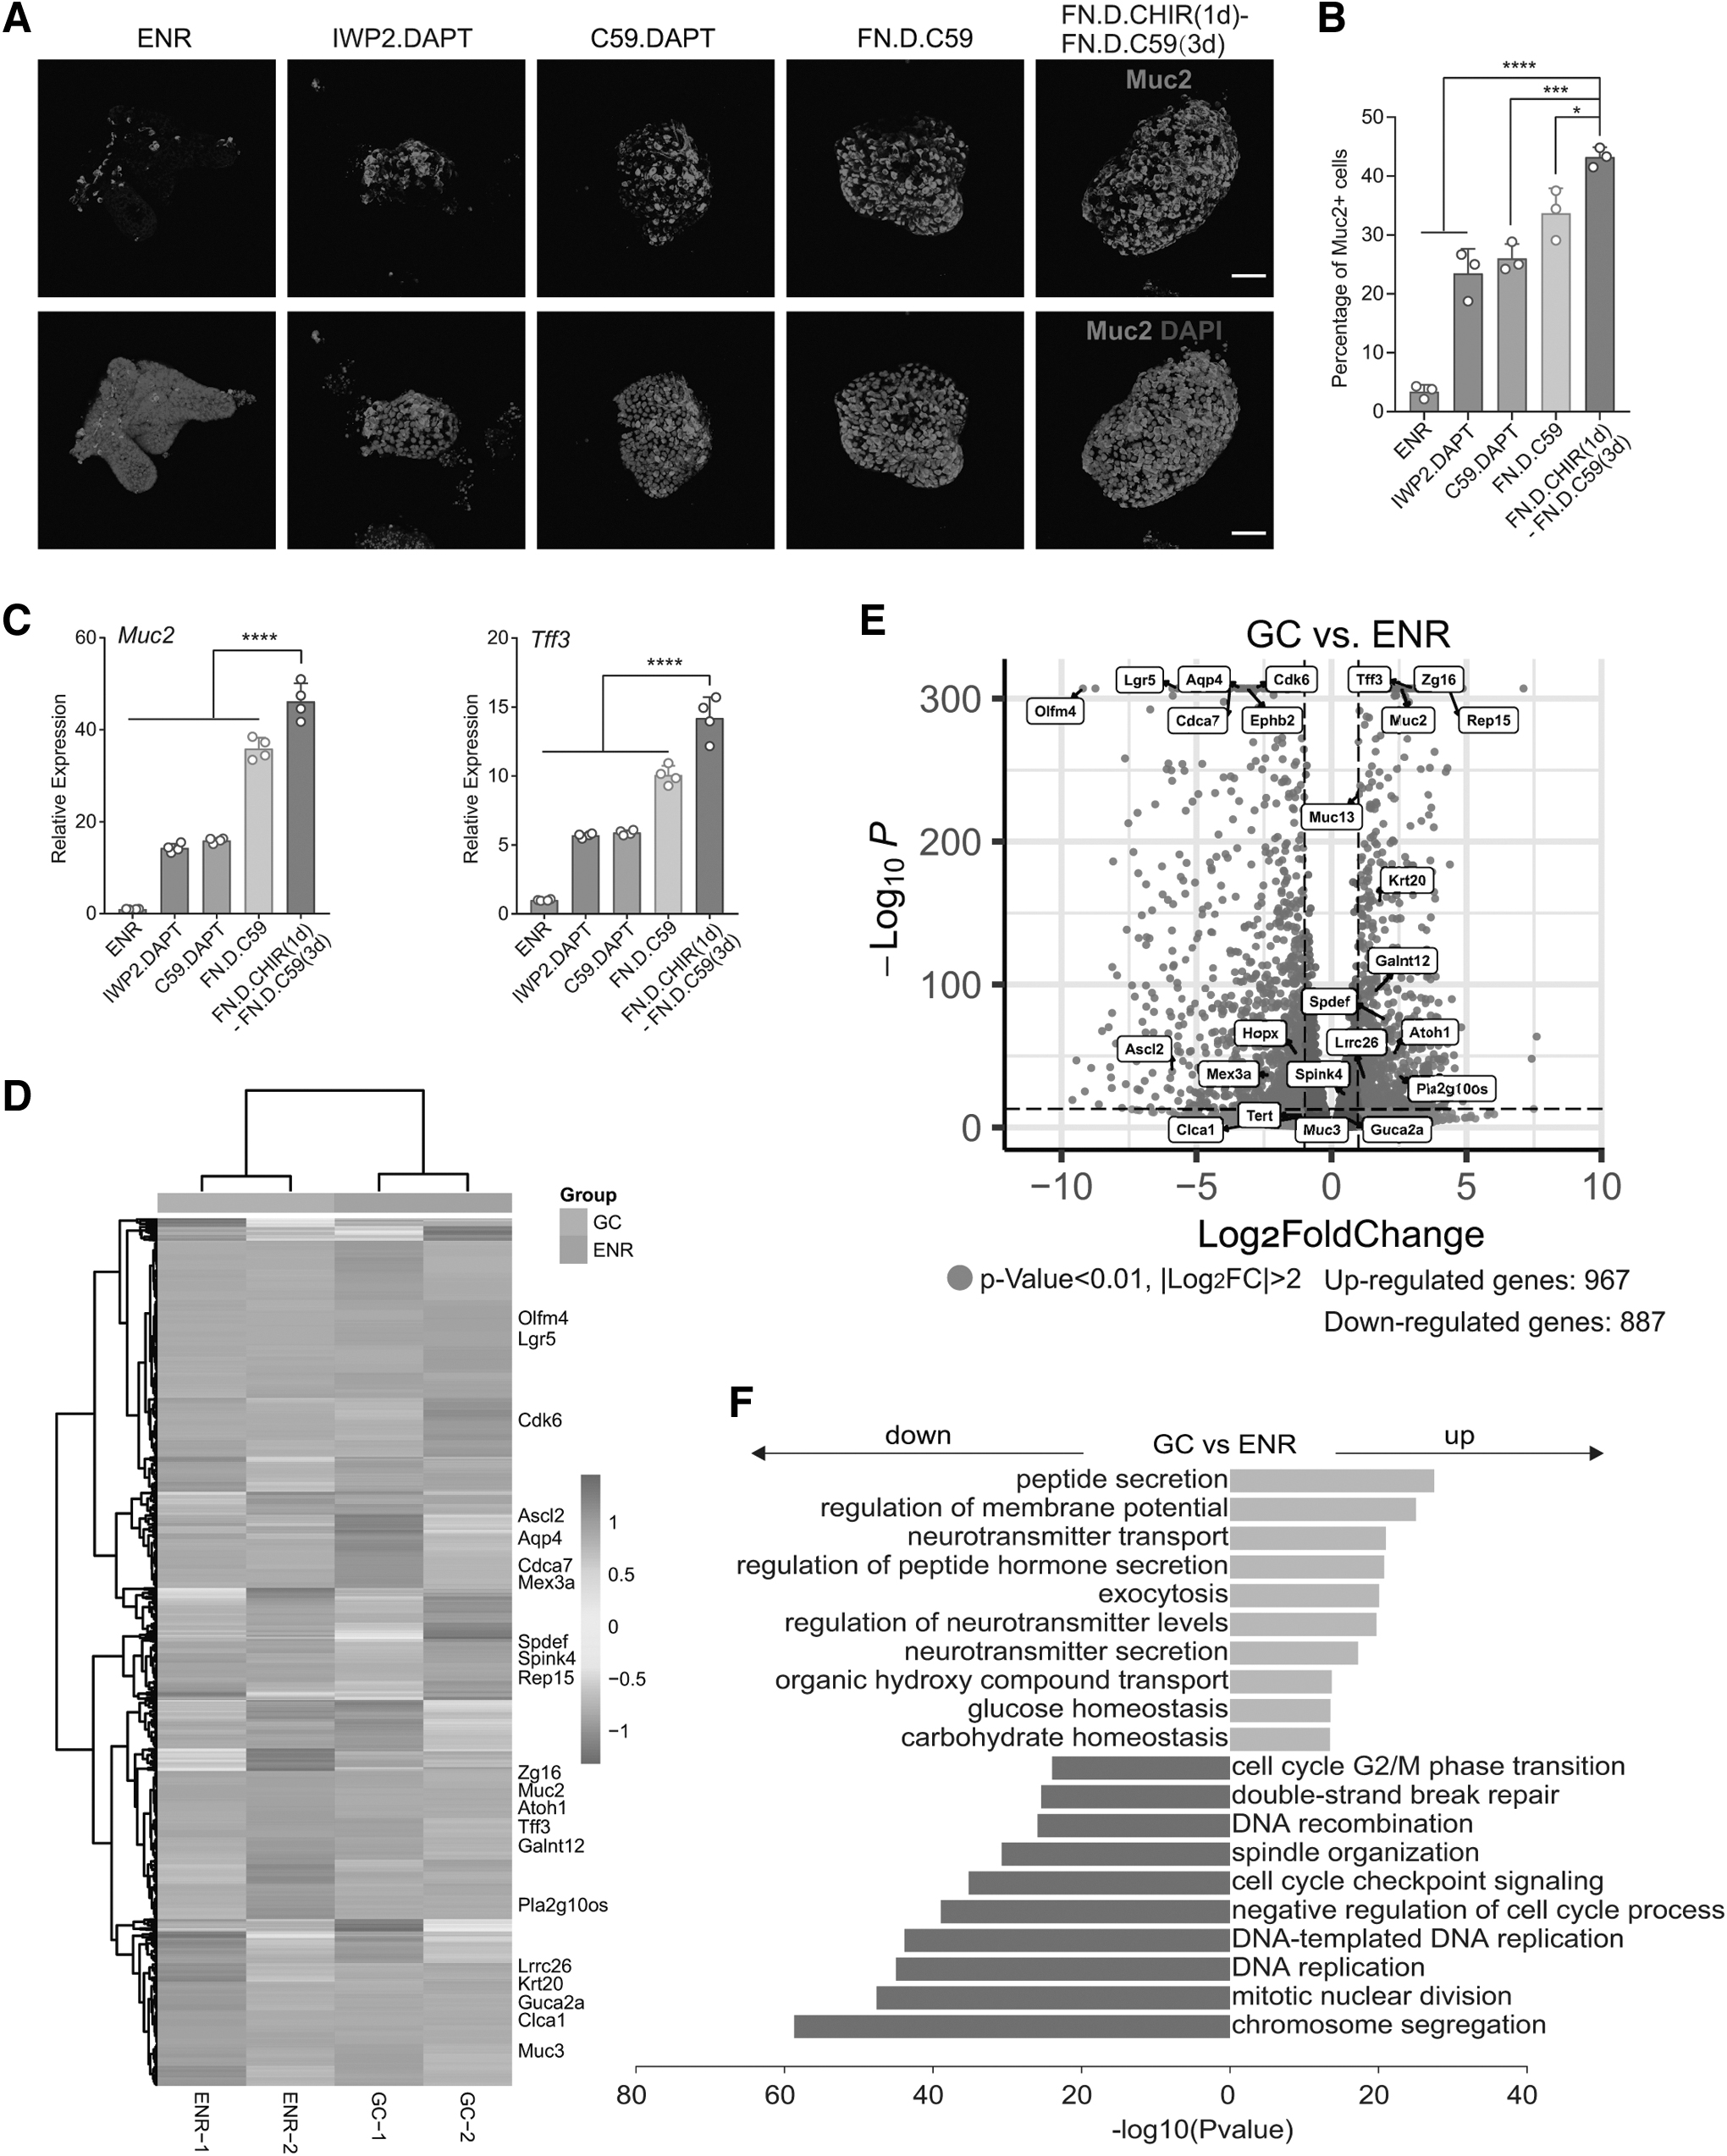
Optimized conditions enhance goblet cell differentiation and gene expression.
Discussion
In the present study, we have elucidated a new facet of Wnt signaling within the scope of ISC differentiation. Our results underscore the temporal dynamics of Wnt signaling, specifically post-Notch inactivation, as a crucial determinant in shaping the cell fate of intestinal secretory cell types. This introduces an additional layer of complexity to the regulatory signals governing the cell fate and behavior of ISCs and their progeny. It implies that cell fate determination extends beyond simply amalgamating static niche signals, incorporating a dynamic and temporal component instead.
Indeed, the differentiation process of ISCs along the crypt–villus axis in vivo is highly dynamic [4,5,21]. We propose a model in which cell fate specification transpires concurrently with the migration of differentiating cells, governed by the duration and intensity of Wnt signal exposure. In this model, cells migrating downward and immersed in a high Wnt environment differentiate into Paneth cells, whereas those migrating upward evolve into goblet cells or EECs, with their fate contingent upon the length of high Wnt exposure near the crypt base.
Insights into temporal Wnt signaling dynamics have capacitated us to optimize protocols for the efficient generation of goblet cells and EECs in vitro. Given the significant roles these cells fulfill in maintaining intestinal integrity and physiologic processes such as mucus secretion, nutrient sensing, and hormonal regulation [7,9,10], this carries substantial therapeutic interest.
We used the intestinal organoid model to probe signaling requirements for intestinal epithelial cell fate determination. This model faithfully replicates the cellular constitution and structural organization of the epithelium, thereby facilitating the investigation of dynamic self-renewal and differentiation processes in vitro [30]. Utilizing this model, we were able to identify the combinations of signals that are essential and sufficient for generating various intestinal cell types. Notwithstanding its robustness, we acknowledge that the organoid model may not fully emulate the complexity of the in vivo environment, potentially neglecting pivotal systemic and local influences such as immune cells, vascular cells, and microbiota that could affect the differentiation and maturation of functional intestinal epithelial cells [37].
Future research could benefit from integrating small-molecule screening or more physiologically relevant in vitro models incorporating additional intestinal constituents. Alternatively, in vivo models could provide a more comprehensive understanding of the extrinsic signals involved in modulating cell fate determination of intestinal epithelial cells. Importantly, recent studies have shown that cells along the crypt–villus axis are zonated and undergo transcriptomic changes, and EECs switch hormone expression profiles [19,33,38]. Incorporating this perspective into our protocols could enhance their utility by enabling the identification of distinct EEC and goblet cell subtypes present in the cultures.
Moreover, our differentiation platform paves the way for further exploration of transcription factor dynamics during the differentiation of intestinal epithelial cells. This promising avenue for future research holds potential implications for therapeutic development.
Footnotes
Acknowledgments
The authors thank Chunying Li, Yongfei Hou, and Tianzeng Sun for R-Spondin1-conditioned medium production.
Author Disclosure Statement
No competing financial interests exist.
Funding Information
This work was supported by the National Key R&D Program of China (2019YFA0110003, 2020YFA0112500), the National Natural Science Foundation of China (31970820), the Key Project of the Science and Technology of Shanghai Municipality (19JC1415300), and the Fundamental Research Funds for the Central Universities (22120230292).
Supplementary Data
Supplementary Figure S1
Supplementary Figure S2
Supplementary Figure S3
Supplementary Figure S4