
Abstract
Rat primitive extraembryonic endoderm (pXEN) stem cell lines indefinitely preserve the characteristic features of the early extraembryonic endoderm (ExEn) in vitro, but require unknown serum factors and exhibit a hybrid (mesenchymal-epithelial) phenotype. We report two chemically defined conditions that differ by the addition of the cytokine leukemia inhibitory factor (Lif) and the β-catenin-stabilizing drug Chir99021, and enable permanent self-renewal as mesenchymal and epithelial morphotypes, respectively. The morphotypes are interconvertible and equipotent, as shown by the formation of well-differentiated organoids. Surprisingly, the proliferation of both morphotypes requires Lif-type Gp130/Stat3 signaling (autocrine in the absence of added Lif) and noncanonical Wnt signaling (autocrine). In addition, the epithelial version requires β-catenin for proliferation and morphology. Interestingly, the mesenchymal cells also express key epithelial markers, but those are improperly structured and/or not functional, indicating a primed state. These results provide an improved platform for studying the proliferation and plasticity of the early ExEn, which occurs in mesenchymal and epithelial forms in vivo.
Introduction
The stem cells of the extraembryonic endoderm (ExEn) are of interest for studying mammalian development [1,2] and cellular reprogramming [3,4], for creating in vitro models of the yolk sac [5,6] and whole embryos [7], and ultimately for prenatal medicine [8,9]. Accordingly, attempts have been made to isolate and culture cell lines with the appropriate differentiation potential, that is, the ability to form the parietal endoderm or visceral endoderm. These efforts have been most successful in mouse [10], rat [11], and pig [12], as evidenced by the ability to contribute to parietal and visceral endoderm in vivo.
The early ExEn assumes mesenchymal and epithelial morphologies in a stage-wise manner [2]; the known ExEn stem cell lines are also mesenchymal or epithelial. Noteworthy mesenchymal cell lines are mouse extraembryonic endoderm stem (XEN) [13] and rat primitive extraembryonic endoderm stem (pXEN) [11,14] cells; both contribute to parietal endoderm, but the latter exhibit a less mature gene expression signature and a better contribution to visceral endoderm. This is probably not a species difference, since mouse pXEN cells have also been isolated, although not tested in vivo [15].
The most notable epithelial—and best performing—ExEn stem cells are the mouse primitive endoderm stem cells (PrESCs), which share nascent primitive endoderm (PrE) markers with the pXEN cells and contribute well to parietal and visceral endoderm [10]. Also, epithelial PrE-like cell lines named naive extraembryonic endoderm (nEND) cells have been created from mouse embryonic stem cells (ESCs) [16], but, to our knowledge, not been tested in vivo.
The above literature indicates that the in vitro morphotype of ExEn stem cells does not rigidly define the in vivo potentials, suggesting some plasticity. However, it is unclear whether the same ExEn stem cell line can exist as alternative (mesenchymal vs. epithelial) self-renewable morphotypes. We previously observed that the mesenchymal appearing rat pXEN cells are “hybrid” as they are prestructured for epithelialization [5], possibly by unknown serum components. Generally, studies of ExEn stem cells have been hampered by the lack of fully defined culture conditions. In this study, we identified chemically defined conditions to maintain the pXEN cells as alternative morphotypes, which allowed us to explore their features and relationship.
Materials and Methods
Cell culture
Key cell culture components and additives are listed in Supplementary Table S1; an overview of various culture conditions is given in Table 1, and further details are provided in Supplementary Table S2. The pXEN cell line RX1 [11], which is derived from a rat blastocyst (strain WKY), was used if not otherwise indicated. In some experiments, a pXEN-like cell line was used, which was derived from an E9.5 yolk sac (rat strain SD), as described [5]. In the traditional (T) culture condition [14], the cells were kept on fibronectin (100 ng/mL)-coated plates (denoted as FNlo) in DMEM/MCDB medium supplemented with 1 × (v/v) linoleic acid-bovine serum albumin (LA-BSA), 1 × (v/v) insulin-transferrin-selenium (ITS), 0.1 nM L-ascorbic acid, 55 μM β-mercaptoethanol, 2% (v/v) fetal bovine serum (FBS), 0.5 μM dexamethasone, 10 ng/mL platelet-derived growth factor (Pdgf), 10 ng/mL epidermal growth factor (Egf), and 10 ng/mL leukemia inhibitory factor (Lif).
Overview of Culture Conditions
For details, see Materials and Methods section and Supplementary Table S2. If not indicated otherwise, cells in medium T or in the serum-free media series were grown on dishes coated with 100 ng/mL fibronectin or 10 μg/mL collagen I, respectively. If necessary, the substrate is explicitly named, for example, as CPE/FNlo (CPE medium, dish coated with low concentration of fibronectin).
Bmp4, bone morphogenetic protein 4; CPE, Chir, Pdgf, Egf; Egf, epidermal growth factor; FBS, fetal bovine serum; Fgf10, fibroblast growth factor 10; Lif, leukemia inhibitory factor; LPE, Lif, Pdgf, Egf; Pdgf, platelet-derived growth factor.
For the serum-free cultures, the plates were coated with 10 μg/mL collagen 1 (Col1), if not stated otherwise, and the cells were kept in DMEM/F12 supplemented with Neurobasal, N2 supplement, B27 supplement, and β-mercaptoethanol, plus the various growth factors or drugs, as indicated by the abbreviations L (Lif, 10 ng/mL), C (Chir99021, 1 μM), P (Pdgf, 10 ng/mL), and E (Egf, 10 ng/mL). The abbreviation N denotes the absence of growth factor or drug additions. In the T condition, the pXEN/pXEN-like cell lines were passaged at relatively low density (400 cells/cm2) every 2 days. After transfer into the various serum-free conditions, the cells were maintained for over 20 passages without a sign of crisis, but the frequency of passaging was adjusted for each culture version to accommodate the different speeds of growth. Absence of mycoplasma contamination was verified by using DAPI staining and confocal microscopy.
Genetically labeled pXEN cells
Cells maintained in LPE (Lif, Pdgf, Egf) and CPE (Chir, Pdgf, Egf) medium were transfected with plasmids expressing Green Fluorescent Protein (GFP) and DsRed-Monomer fluorescent protein, respectively. One microgram of plasmid in 50 μL of 150 mM NaCl and 5 μL of 1 mg/mL polyethylenimine in 150 mM NaCl were mixed, incubated for 10 min at room temperature, and added to 35 mm culture dishes with cells. After 24 h, the adherent cells were washed three times with phosphate-buffered saline (PBS) and then kept for 3–4 days in medium containing 1 μg/mL puromycin. For the experiments, the GFP- and DsRed-labeled cells were mixed as described in the figure legends, and the final composition of the population was assessed by flow cytometry using a Becton Dickinson FACSCalibur device.
Organoid cultures
For the creation of yolk sac organoids, the pXEN or pXEN-like cells were transferred into differentiation medium containing DMEM/F12, N2, B27, N-acetylcysteine, 50 ng/mL Egf, 500 nM A83-01, 25 ng/mL fibroblast growth factor 10 (Fgf10), and 50 ng/mL bone morphogenetic protein 4 (Bmp4). The organoids were created as free-floating [5] and matrix-embedded versions. For the free-floating organoids, 2,500 cells, if maintained in the T condition, or 10,000 cells, if maintained under serum-free conditions, were seeded into low attachment 24-well plates with differentiation medium and cultured for 14 days. The embedded organoids were produced in two stages. The first stage (aggregation) was a free-floating culture for 3 days. In stage 2, 200 μL of Matrigel were mixed with the content (∼15 μL) of each aggregate-containing well using a glass Pasteur pipette, and single 80 μL drops were seeded into the center of wells (four-well plate). The plates were incubated at 37°C for 2 min, and then inverted for another 8 min to locate the aggregates to the center of the droplet. The aggregates were then incubated in the differentiation medium for 11 days. Regardless of culture version, the media were initially changed every 2 days, but later daily if the color started changing.
Experimental treatments
Vacuolization studies
Four-well plates were coated with different extracellular matrix (ECM) solutions (300 μL/well) as follows: One hundred times diluted Matrigel (in DMEM/F12) was added for 1 h at 37°C; supernatant was removed carefully. Col1 (10 μg/mL in 0.02 N HCl) was added for 1 h at room temperature and the plates were washed with PBS 2–3 times. Gelatin (0.1%) or fibronectin (“FNlo,” 0.1 μg/mL in PBS; or “FNhi,” 10 μg/mL) was added for 20 min at room temperature. Poly-
Studies with forskolin
Cells were seeded (day 1) into FNlo- or Col1-coated 24-well plates in LPE or CPE medium at medium density (1,000–2,500 cells/cm2), and Forskolin (Fsk; 25 μM) was added on the same day. On day 3, live cells were counted by Trypan Blue staining, and messenger RNA (mRNA) samples were collected. For immunostaining and assessment of Collagen 4 (Col4) production, cells were seeded onto FNlo- or Col1-coated plastic coverslips at medium density, and 25 μM Fsk was added. The Col4-covered areas were quantified with ImageJ software, using five randomly chosen areas from each confocal image.
Medium shifts
The cells were trypsinized and washed three times with PBS by centrifugation to remove residual growth factors. They were then plated at 500 cells/cm2 into their new medium to obtain growth curves, or maintained over several passages for long-term assessment of growth rates and phenotype.
Drug treatments
Tested drugs included Xav939 (6 μM), Iwp2 (1 or 5 μM), Stattic (0.1 or 1 μM), SC144 (0.01 or 1 μM), AG1478 (5 μM), imatinib (5 μM), and AG490 (5 or 25 μM). Vehicle (DMSO) was used as control and did not exceed 0.1% (v/v). Further details are specified in the figure legends.
Lif- or Chir-depleted conditioned media and cells
To obtain Chir-depleted conditioned medium [(C)PE CM] from the CPE-maintained cells, a 100-mm dish (∼90% confluent) was trypsinized with TrypLE, and the cells were washed three times by centrifugation with PBS and transferred into a new 100-mm dish containing 8 mL of PE medium. After 1 day, the conditioned medium (CM) was centrifuged (1,000 g, 5 min), the supernatant filtered (0.22 μm), and stored at 4°C until use (within 24 h). To produce Lif-depleted cells [(L)PE cells], the LPE-maintained cells were washed by centrifugation with PBS three times and directly used for plating assays. (L)PE CM and (C)PE cells were produced analogously. To verify the removal of Lif and Chir, the (L)PE and (C)PE cells were tested in plating assays with Lif (0, 1, 10, 100, and 1,000 ng/mL) and Chir (0, 0.001, 0.01, 0.1, 1, and 5 μM).
Subtraction assays
pXEN and pXEN-like cells were trypsinized and washed with PBS by centrifugation two to three times to eliminate the residual growth factors, and then assessed in low-density colony formation assays with media in which N2, B27, Pdgf, Egf, Lif, or Chir was individually omitted.
Analytical methods
Cell growth assays
For low-density colony-forming assays, cells were seeded at 50 cells/cm2 into 4-well or 24-well plates, and after 7 days, they were stained with Crystal Violet and photographed. To determine effects on cell numbers, the cells were seeded at 1,000–2,500 cells/cm2 and counted 3 days later. To assess doubling times, the cells were plated at 500 cells/cm2 in a 24-well plate and trypsinized and counted every 6 (T conditions) or 24 (serum-free conditions) h. To obtain growth curves after medium shifts, the cells were plated into the new medium at 500 cells/cm2 and counted every 24 h. To assess the growth rate of medium-shifted cells over several passages, they were seeded each time into 24-well plates at 2,500 cells/cm2 and counted 3 days later.
Quantitative reverse transcription polymerase chain reaction
Total RNA was extracted with the Hybrid-R kit (305-101; GeneAll) and AccuPrep Universal RNA extraction kit (K-3140; Bioneer). A reverse transcriptase kit (DR22-R10k; Solgent) was used to convert RNA into complementary DNA (cDNA). PCR was performed with the QuantStudio3 system (A28572; Thermo Fisher Scientific) in combination with SYBR green (RT500M; Enzynomics). Relative mRNA levels were determined with the 2−ΔΔCt method, using β-actin mRNA for normalization. Primers for PCR are listed in Supplementary Table S3.
Immunocytochemistry
To stain adherent cells, they were seeded onto four-well plate coverslips (20012; SPL) at medium density. After 3 days, the cells were fixed with 4% paraformaldehyde (pH 7.4) and permeabilized with 0.1% Triton X-100 in PBS for 15 min each, rinsed with PBS three times, and incubated for 30 min in blocking solution (1% BSA in PBS). The cells were then incubated with primary antibody (1:100 in blocking solution) at 4°C overnight, rinsed three times with PBS, and incubated for 1 h with the secondary antibody (1:100 in blocking solution). Cells then were stained with DAPI for 10 min, washed with PBS three times, and mounted in Vectashield (H-1000; Vector Laboratories). To stain organoids, they were transferred between solutions by a glass Pasteur pipette. All procedures were performed at room temperature, except for the incubation with primary antibody. A list of antibodies is given in Supplementary Table S5.
Bulk RNA sequencing and bioinformatics
Bulk RNA sequencing (RNA-seq) was performed as previously described [17]. Total RNA was extracted by Trizol (9190; TAKARA) and QIAGEN RNeasy Mini Kit (74104; QIAGEN). The RiboMinus Eukaryote kit (A1083708; Thermo Fisher Scientific) was used to deplete ribosomal RNA (rRNA). The RNA library was created with the NEBNext UltraTM directional RNA library preparation kit for Illumina (E7420S; New England BioLabs). After cDNA synthesis, cDNA fragmentation and adaptor ligation, purification with AMPure XP beads (Beckman Coulter), and amplification by 15 cycles of PCR, the final cDNA library was generated and then sequenced by the Illumina HiSeq2500 (Illumina). Transcriptome sequencing was performed on samples from pXEN cells maintained in T, LPE, and CPE medium, respectively.
Samples were collected from three independent experiments, performed on different days and passage numbers. FastQC v0.11.5 (Babraham Bioinformatics) and Trimmomatic v0.36 [18] were performed to deal with quality check and control of raw data. These FASTQ files were aligned by STAR (version 2.7.1) aligner software [19] with the UCSC rn6 reference genome. Differentially expressed genes (DEGs) were analyzed using DESeq2 with default parameters [20]. DEGs identified by RNA-seq with the log2-fold change larger than 1.5 or smaller than −1.5 (log2-fold change ≥1.5 and log2-fold change ≤ −1.5, P adjusted <0.05) were selected as DEGs in T, LPE, or CPE cells. Principal component analysis (PCA) as visualized in Galaxy (
Heat maps were created in Rstudio v1.4 (RStudio) with the Pheatmap package. Venn plots were created by Venny 2.1 (
Western blotting
After reaching the required cell density, the cell culture dishes were put on ice and washed with ice-cold PBS two times, trypsinized, washed with PBS by centrifugation, resuspended in ice-cold RIPA lysis buffer containing 1 × (v/v) protease and phosphatase inhibitors (P3300-001; GenDEPOT; 10 μL; 1 mL per 107 cells/100 mm dish), and pipetted several times. The samples were then centrifuged in a microfuge at 12,000 g for 20 min at 4°C, the supernatant was transferred into a new tube, and the protein content was measured with the Pierce BCA Protein Assay Kit (23225; Thermo Fisher Scientific). Fifty micrograms of samples were resolved by 7.5% sodium dodecyl sulfate-polyacrylamide gel electrophoresis (SDS-PAGE) and transferred by electroblotting onto PDVF membranes (1620176; Bio-Rad). The membranes were blocked by 5% skim milk (Seoul Milk) for 1 h and then incubated with primary antibody at 4°C overnight, rinsed three times with TBST (T8053-101; GenDEPOT), and incubated for 1 h with the secondary antibody, and then again washed three times with TBST. Signal was visualized by ECL Western blotting substrate (32109; Thermo Fisher Scientific) and quantified by ImageJ software [23]. A list of antibodies is given in Supplementary Table S5.
Microscopy
Phase contrast images were obtained by an inverted DMIL LED/DFC295 fluorescence microscope (Hi Plan 4 × /0.10, Hi Plan 10 × /0.25 PH1, N Plan L 20 × /0.35 PH1 or N Plan L 40 × /0.55 CORR PH 2) with Leica application suite (v4.3.0; Leica). For fluorescence images of immunostained cells, a Zeiss LSM 800 confocal microscope (Plan-Apochromat 20 × /0.8 M27, C Plan-Apochromat 40 × /1.30, or C Plan-Apochromat 63 × /1.40) was used with ZEN software (v2.3; Zeiss). Photoshop 2021 was used to improve images in accordance with journal guidelines.
Statistical analysis
All quantitative experiments were independently performed for the number of times specified in the figure legends (n represents the number of independent experiments). Prism 9 (GraphPad Software) was used for statistical analyses, with the calculation of mean ± standard error of the mean (for error bars) and P-values using the two-tailed Student's test (for two groups) and analysis of variance (for more than two groups). Statistically significant differences are indicated as 4P < 0.05, 3P < 0.01, 2P < 0.001, or 1P < 0.0001.
Results
The pXEN cells have previously been cultured in a DMEM/MCDB basal medium with supplements (notably ITS and LA-BSA), growth factors (Lif, Pdgf, Egf), and 2% FBS, in dishes that were precoated with a diluted fibronectin solution (FNlo) [14]. In this study, we call it the traditional culture (T). Lif, Pdgf, and FBS are essential, while roles for Egf and FNlo were not convincingly demonstrated [14]. To find defined conditions and potentially disentangle the hybrid phenotype, we reasoned: (1) by inducing vacuoles, FBS exerts also an antiproliferative effect, and vacuolization could be suppressed by coating the dishes with sufficiently concentrated solutions of Col1 or FNhi [5]. We therefore hypothesized that such substrata may facilitate serum-free self-renewal. (2) pXEN cells become epithelialized upon the overexpression of β-catenin or addition of the β-catenin stabilizing drug Chir [24]. We therefore asked whether Chir may support serum-free epithelial self-renewal of pXEN cells. (3) Lif opposes the epithelial differentiation of mouse XEN cells [25], which are pXEN related [15] and similar to the parietal (mesenchymal) endoderm [13]. We therefore hypothesized that Lif can support serum-free mesenchymal growth. (4) Because of the broad success of the Neurobasal/N2B27 basal medium in stem cell biology, we decided to try this medium for the pXEN culture.
Various media enable the defined culture of pXEN cells
We transferred the cells from condition T into serum-free, N2B27-based candidate media LPE and CPE on Col1 (conditions LPE/Col1 and CPE/Col1) at low density (Table 1 and Fig. 1). To see the effect of collagen, we compared it with traditional FNlo coating; we also omitted Egf alone or together with Pdgf to assess these growth factors. The result showed a much better growth-supportive effect of Col1 than FNlo, especially with Chir (Fig. 1A). A massive reduction of colonies occurred upon the omission of Pdgf, Lif, or Chir, and none of these factors alone effectively induced colony formation. In case of Egf, the effect was clearer in the presence of Lif than Chir. We then tested the long-term effect of these media and observed that on Col1, the cells could be grown at medium densities over multiple passages in all combinations, even in the absence of added growth factors (Fig. 1B).

Chemically defined conditions enable the indefinite culture of pXEN cells. (
However, the best growth rates (shortest doubling times) were achieved with Pdgf+Egf+(Lif or Chir) (Fig. 1C), similar to the growth behavior immediately after the switch (comp. with Fig. 1A), and hence indicating that the original mode of growth control was maintained long term. In low-density plating assays (on Col1), a similar result as with the bulk cultures was obtained (Fig. 1D). Next, we used the sublines that were maintained with only Lif or only Chir or without any added growth factor to re-assess the significance of Pdgf and Egf. We now found a clearer effect of Egf in the Lif- versus Chir-containing medium (Fig. 1E), suggesting that the serum in the T condition had obscured the Egf effect and that Chir can partly substitute for Egf.
Finally, we performed a parallel growth factor subtraction analysis of long-term LPE-cultured and CPE-cultured blastocyst-derived pXEN and yolk sac-derived pXEN-like cells (which were isolated from a different rat strain) and found no difference in their requirements for Pdgf, Lif, and Chir (Supplementary Fig. S1). The same experiment revealed that B27, rather than the N2 supplement, was critical for the culture of both cell isolates. Thus, the above-described growth requirements are not unique for a single cell line or rat strain and apply to both preimplantation- and postimplantation-stage yolk sac endoderm stem cells. Based on these results, we made LPE and CPE our standard serum-free culture media.
Several ECM proteins facilitate vacuole-free, serum-free growth and attachment
Next, we looked closer at the substrate requirements by comparing Matrigel, Col1, FN (hi and lo), gelatin, and P-
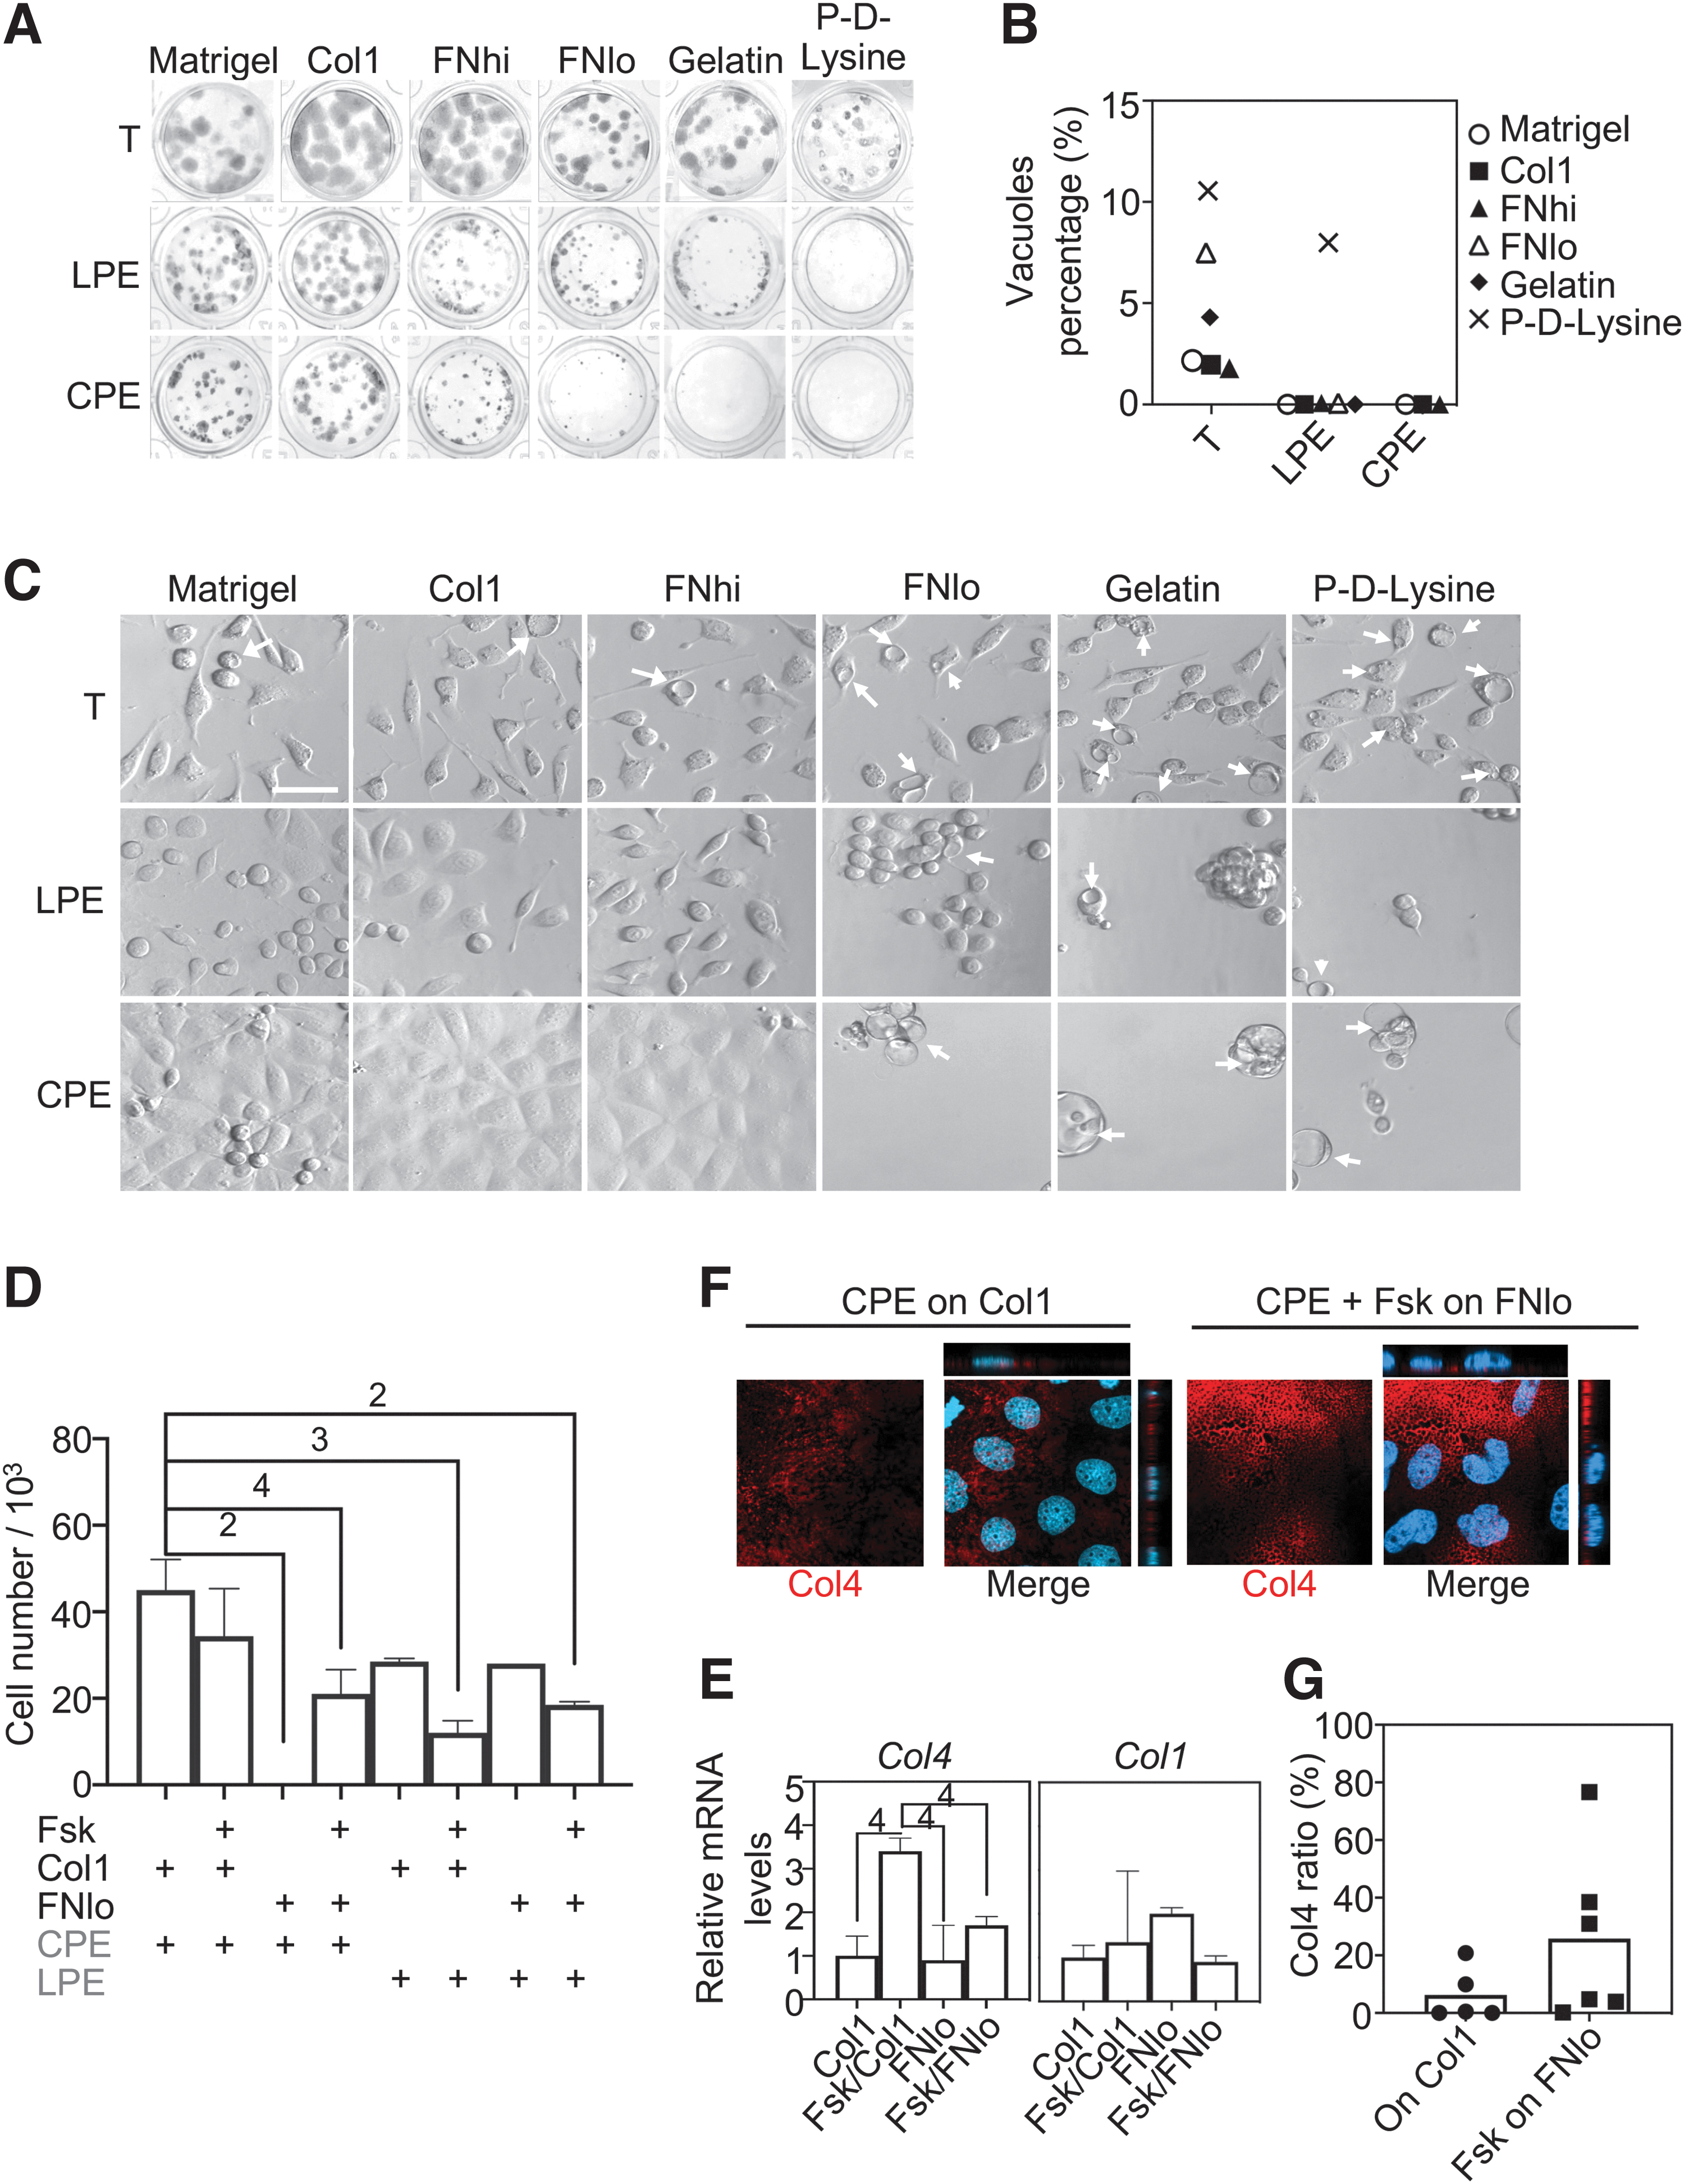
Matrix proteins suppress vacuolization and support serum-free attachment and growth. (
We then plated the cells at medium density to more easily assess vacuolization and attachment. The percentage of vacuole-containing cells (Fig. 2B, C) was roughly in agreement with the extent of colony growth (comp. with Fig. 2A), in line with the fact that vacuoles inhibit pXEN cell growth [5]. Also, in the serum-free conditions, cell attachment was unsatisfactory on gelatin and P-
We suspected that the reason why LPE-cultured cells, but not CPE-cultured cells attached and grew well even on FNlo was that the former secreted (more) collagen. Indeed, when we added Fsk, which promotes the mesenchymal/parietal endoderm phenotype [24], the attachment and proliferation of CPE cells (Fig. 2D) and their production of Col4 (Fig. 2E–G) were significantly improved. However, Fsk was toxic in continued culture (not shown) and upregulated parietal endoderm markers (Supplementary Fig. S2). Based on these results, we made the coating with a high Col1 concentration a standard condition. Henceforth, “LPE” and “CPE” culture mean the same as LPE/Col1 and CPE/Col1, unless stated otherwise.
Alternative phenotypes exhibit distinct morphologies and are modulated by cell density
Regardless of cell density, the LPE-cultured cells were mesenchymal (spindle-to-oval shaped and disconnected) (Figs. 1B and 3A), even without the addition of a growth factor (Fig. 1B). In contrast, the CPE cultures formed epithelial islands that at lower densities were interspersed with single cells and coalesced at high density (Fig. 3A); Chir was sufficient to impose this appearance (Fig. 1B). Thus, the LPE and CPE cells maintained a mesenchymal and epithelial appearance, respectively, at all densities, with the mesenchymal appearance being the default. In contrast, the T/FNlo-cultured cells were LPE like at low density, but displayed a morphology intermediate between those of the LPE and CPE conditions at high density (Fig. 3A).
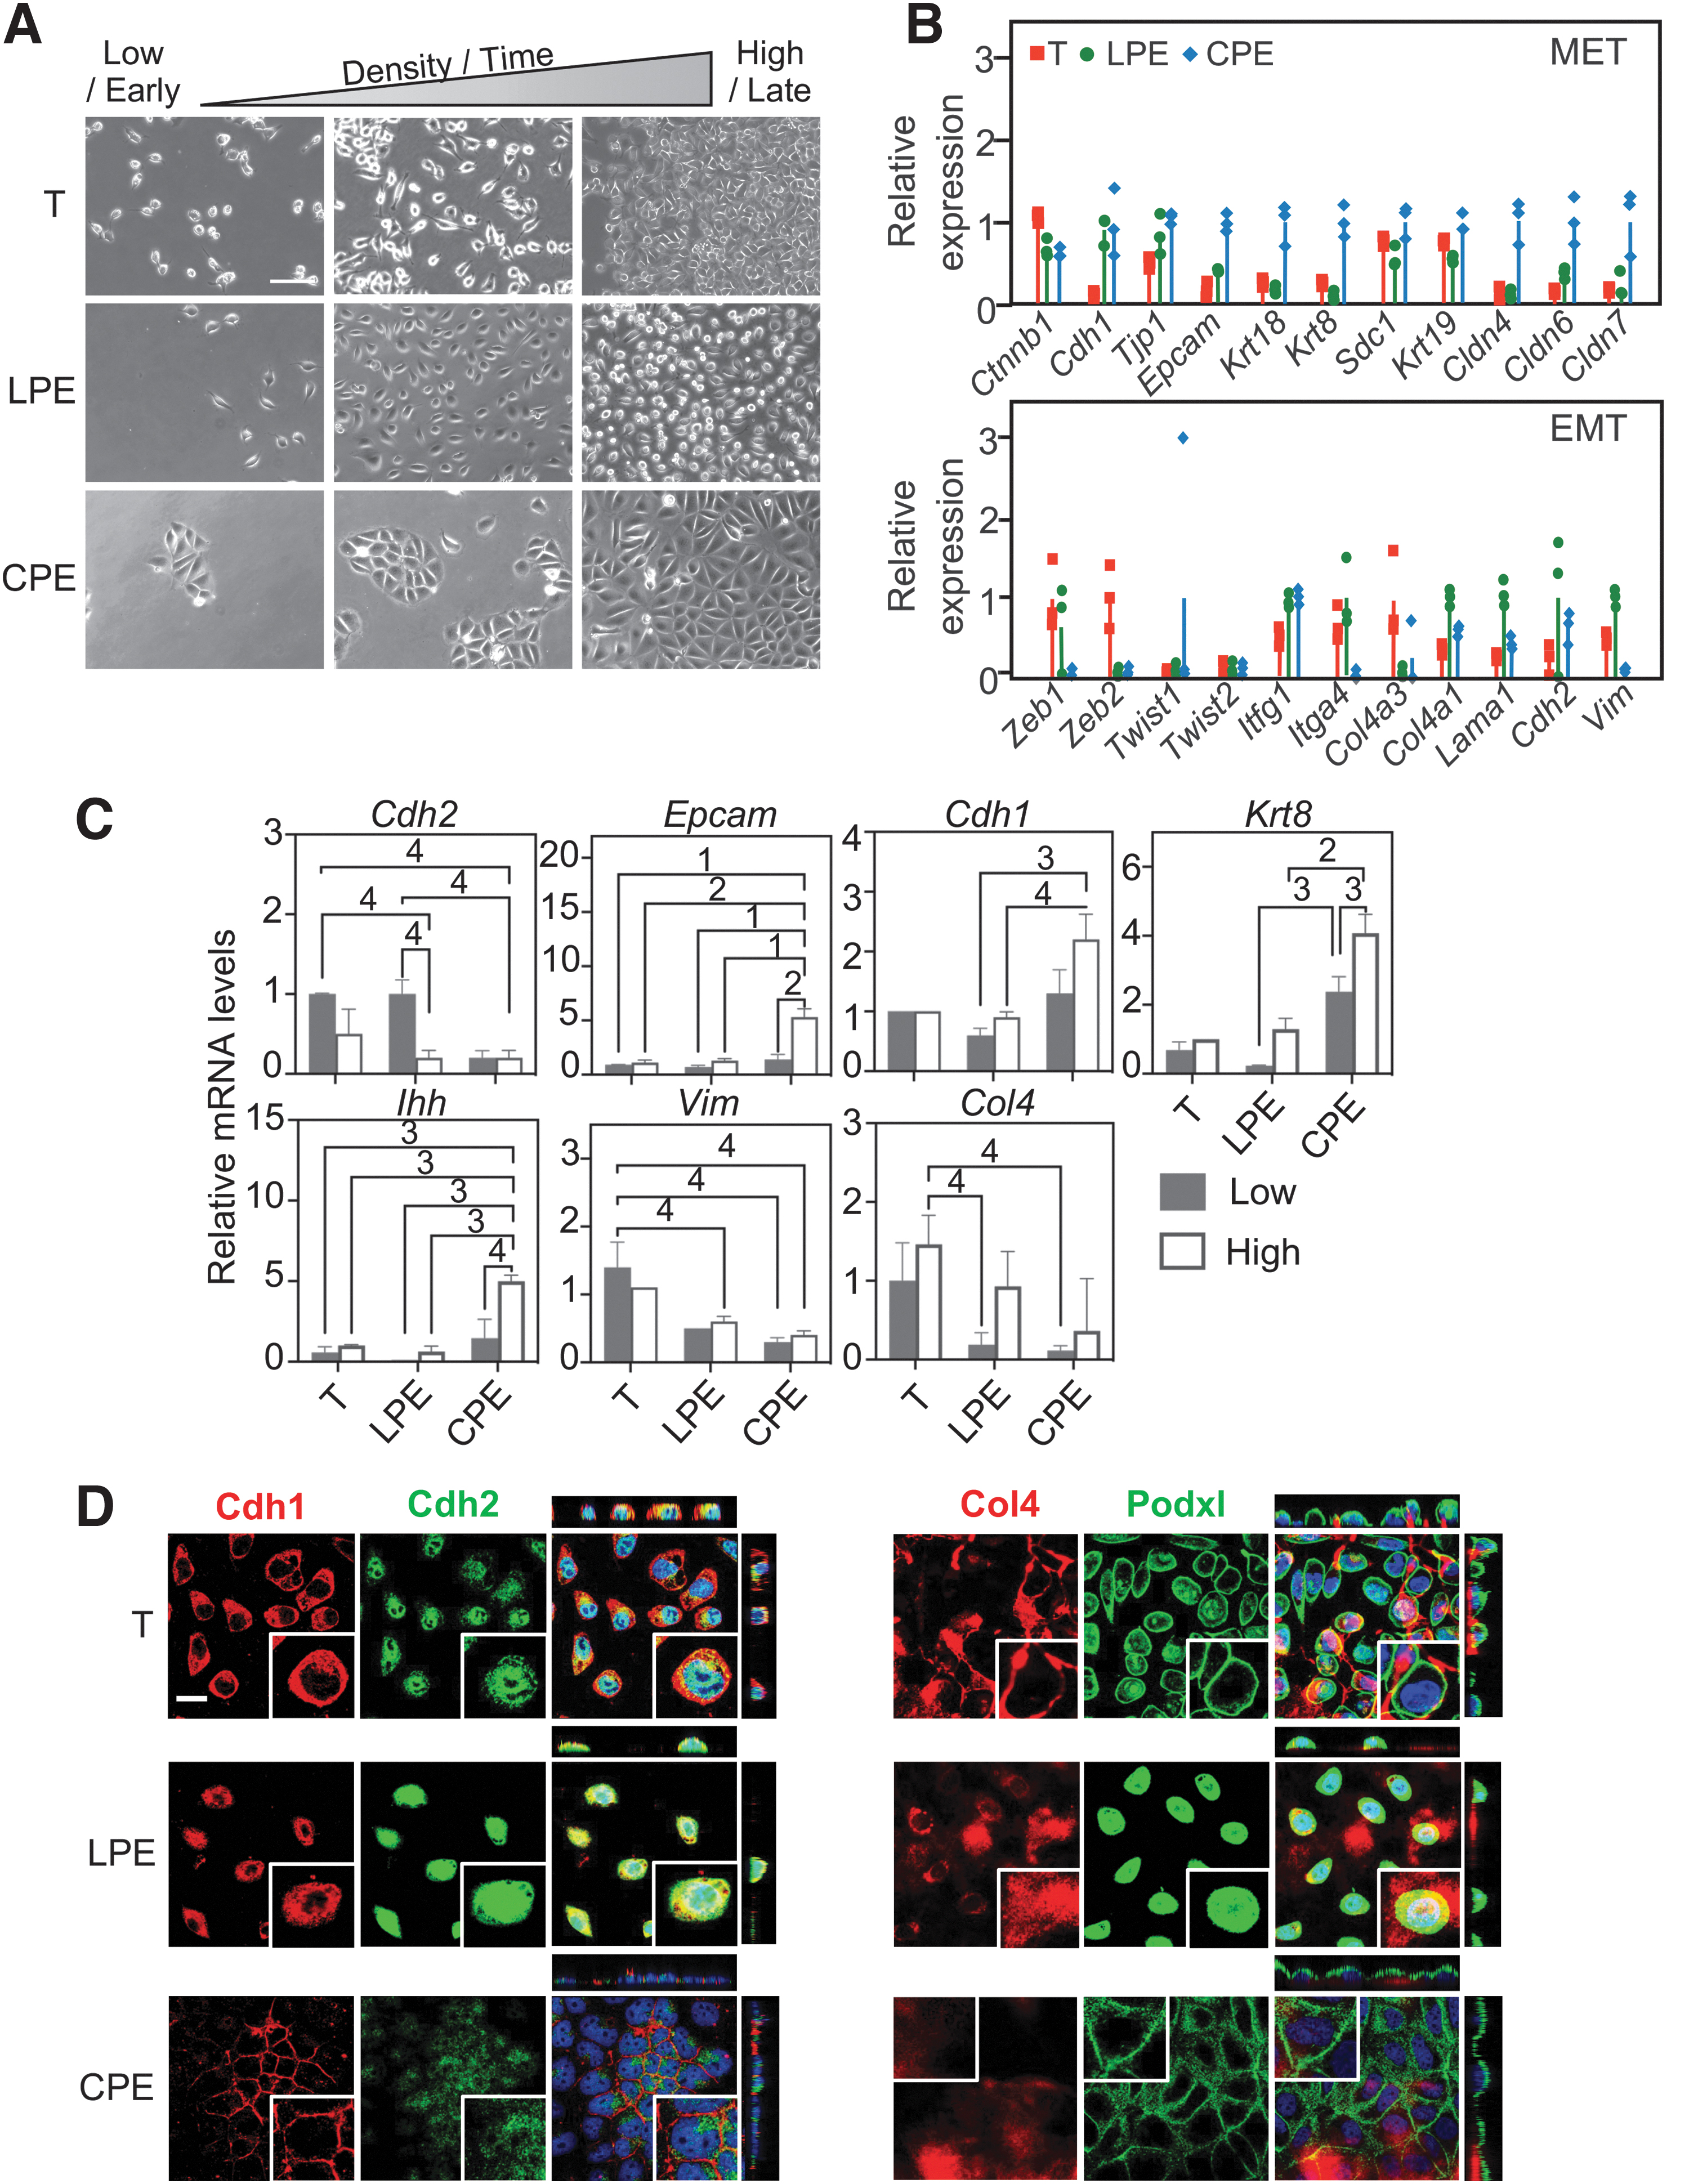
The defined culture conditions resolve the hybrid morphology of the serum-cultured cells. (
RNA-seq analysis (performed at intermediate densities) showed that all culture versions expressed both mesenchymal and epithelial markers to some degree (Fig. 3B); however, the highest levels of mRNAs encoding claudins, keratins, and epithelial cell adhesion molecule (Epcam) were seen in the CPE cells, while the vimentin (Vim) and collagen type 4 alpha 1 (Col4a1) mRNAs were highest in the LPE condition. Of note, the level of β-catenin (Ctnnb1) mRNA was not significantly different between the versions.
Since the density affected morphology in the T condition, we performed, for all three versions, reverse transcription polymerase chain reaction (RT-PCR) at low and high densities for selected mesenchymal [Cadherin 2 (Cdh2), Vim] and epithelial [Epcam, Cadherin 1 (Cdh1) and Keratin 8 (Krt8)] markers; for Indian Hedgehog (Ihh), a lineage marker of the (epithelial) visceral endoderm; and for Col4, a protein of the basement membrane known to be more highly expressed in the parietal endoderm (Fig. 3C). In contrast to the outward appearance, we now saw density-dependent changes also in the LPE and CPE conditions. The Cdh2 mRNA decreased at high density in the T and LPE conditions, but was always low in the CPE condition, while the Vim mRNA was not much affected by density, but was highest in the T and lowest in the CPE cells. The Epcam mRNA was always low in T and LPE conditions, but increased at high density in the CPE condition. The Krt8 mRNA was highest in the CPE condition and generally showed a tendency to be increased at high density. Furthermore, there were no significant density effects on the levels of the Cdh1 mRNA, although a tendency to increased expression was seen in the CPE condition. Strangely, we noticed that in both LPE and CPE cultures, the Cdh1 mRNA levels went through a transient (time/density dependent) increase, which was paralleled by the octamer-binding transcription factor 4 (Oct4) mRNA (Supplementary Fig. S3A). The significance of this kinetics is unclear. The situation was less puzzling when we looked at lineage markers. The mRNAs encoding follistatin (Fst) and parathyroid hormone-related protein (PTHrP), which are considered parietal endoderm markers, decreased dramatically at higher density in both conditions, but were always much lower in the CPE versus LPE condition (Supplementary Fig. S3B). Ihh, which is considered a visceral endoderm marker, was low in all conditions, but clearly induced in CPE cells at high density (Fig. 3C). Finally, the Col4 mRNA level was highest in the T condition (consistent with the better attachment/growth in poorly ECM-coated dishes; Fig. 2) and tended to be increased by higher density.
We performed immunostainings to localize important mesenchymal–epithelial transition (MET) and polarity markers (Fig. 3D). In the T and LPE cultures, where cells did not contact each other, Cdh1 was distributed through the cytoplasm, but it was surface localized in the CPE cells, which easily formed contacts. Cdh2, however, was never surface located; it was predominantly nuclear in T cells, nuclear and cytoplasmic (zone surrounding nucleus) in LPE cells, and diffusely cytoplasmic in CPE cells. Most interestingly, the apical marker podocalyxin-like protein 1 (Podxl) was predominantly, but not only, located on the cell surface of T-cultured cells and found throughout the cell in the LPE condition and exclusively on the surface in CPE cells. Thus, of the two structural features of an epithelium, Cdh1 surface staining and Podxl surface staining, CPE-cultured cells displayed both, T-cultured cells one, and LPE cells none.
Wnt/Stat3 and noncanonical Wnt control the proliferation of CPE and LPE cells; β-catenin controls morphology and proliferation only in CPE cells
Next, we used drugs to get an idea of the signaling pathways that control pXEN cell proliferation and morphology (Fig. 4). Since Pdgf and Egf are present in both LPE and CPE, we first tested inhibitors of their receptors [imatinib for platelet-derived growth factor receptor (PdgfR), and AG490 and AG1478 for epidermal growth factor receptor (EgfR)]. These drugs blocked proliferation as expected, but a higher AG490 concentration was required in CPE (Supplementary Fig. S4A), the medium where Egf had been less effective (Fig. 1E). We then turned to Lif and Chir, which distinguish the cocktails.
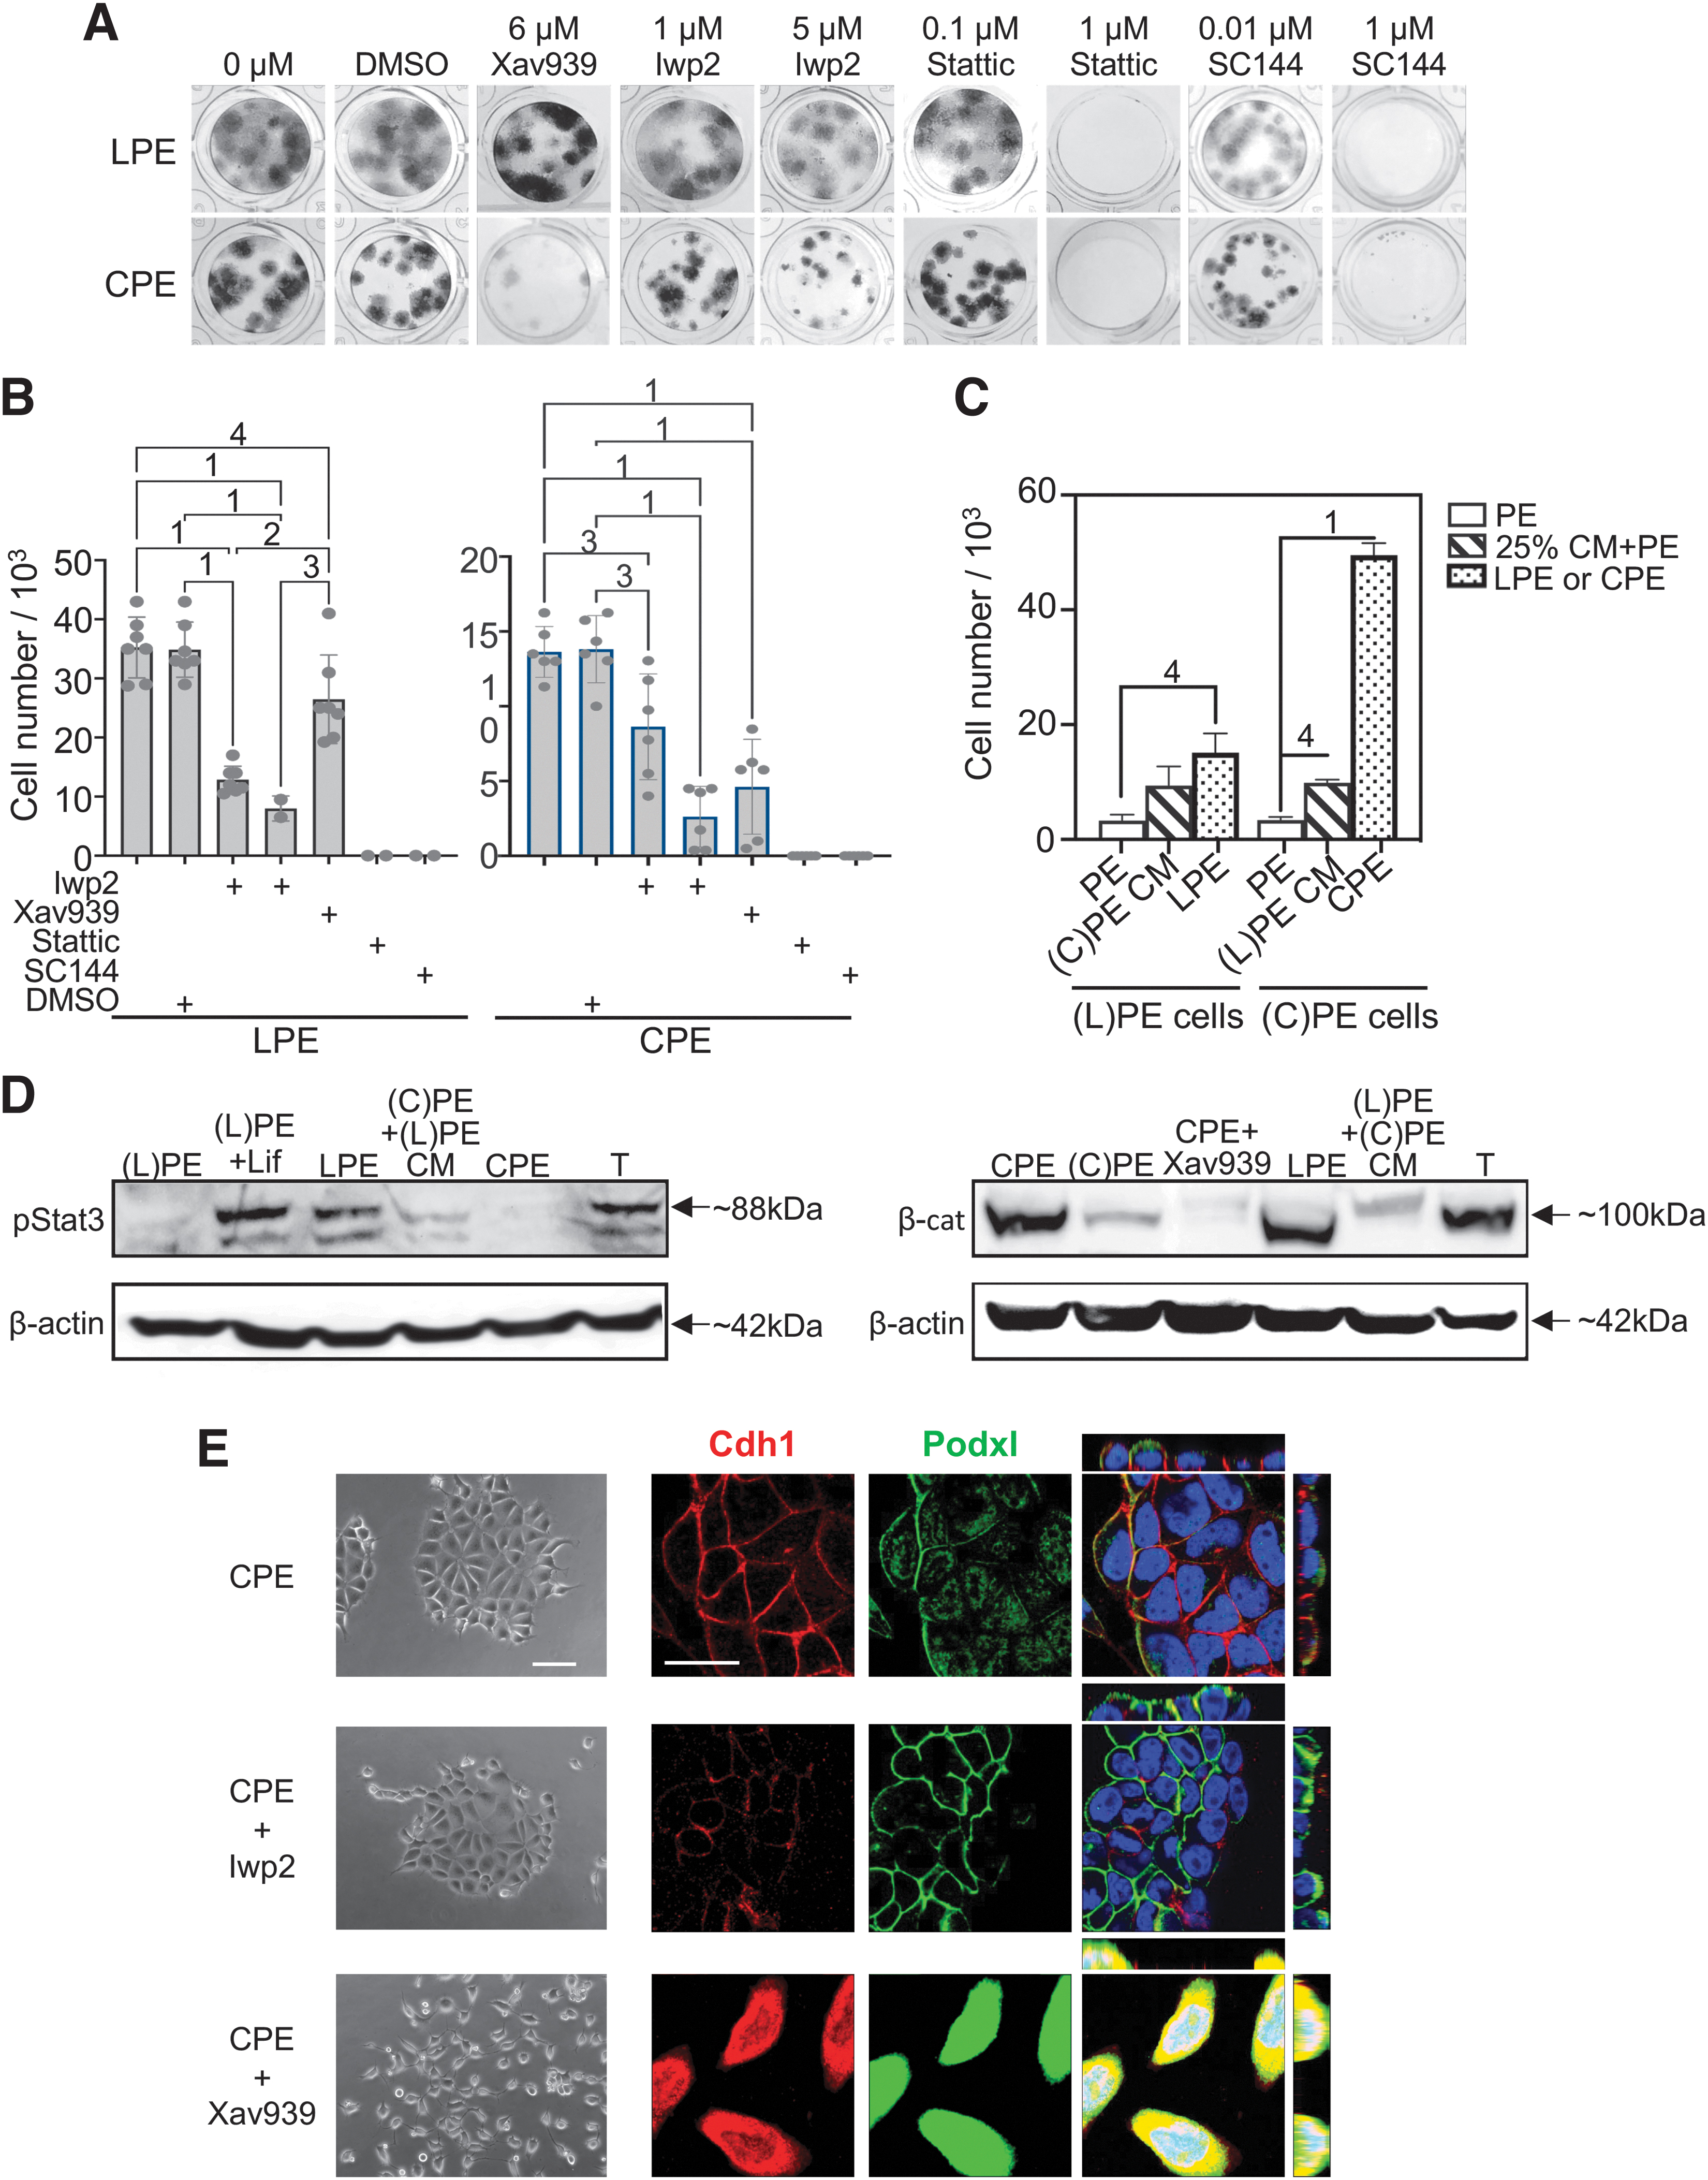
Effects of Wnt/β-catenin and Gp130/Stat3 inhibitors. (
Lif signals through Gp130/Stat3 in the pXEN-related embryonic stem (ES) cells [26], and mouse pXEN cells require both Lif and Stat3 signaling [15]. It was therefore not surprising that in the LPE condition, SC144 (a Gp130 inhibitor) and Stattic (a Stat3 inhibitor) blocked colony formation (Fig. 4A) and cell proliferation (Fig. 4B left), and that Lif was required to maintain a high degree of Stat3 phosphorylation (Fig. 4D left and Supplementary Fig. S4D left). Unexpectedly, however, the same anticolony/antiproliferation effects of Stattic and SC144 were observed with the CPE-cultured cells (Fig. 4A, B right), even though these cells exhibited a very low degree of Stat3 phosphorylation (Fig. 4D left and Supplementary Fig. S4D left).
Chir epithelializes pXEN cells through β-catenin [24], a component of cell-cell junctions and canonical Wnt signaling [27]. As expected, CPE-cultured cells contained a substantial amount of β-catenin, which declined after removal of Chir (stabilizer of β-catenin) or addition of Xav939 (destabilizer of β-catenin) (Fig. 4D right and Supplementary Fig. S4D right). Furthermore, Xav939 significantly reduced pXEN cell colony formation (Fig. 4A) and (by 62%) proliferation (Fig. 4B right), but a similar effect (inhibition by 81%) occurred with Iwp2, an inhibitor of Wnt secretion (Fig. 4A, B right).
Thus, efficient colony formation/proliferation in CPE appears to require both β-catenin (deduced from the Xav939 effect) and β-catenin-independent Wnt signaling (as Iwp2 was effective in the presence of Chir). Turning to LPE, we observed a similar level of β-catenin (Fig. 4D right and Supplementary Fig. S4D right, E), but no (Fig. 4A) or little (21%) (Fig. 4B) effect of Xav939. Thus, in LPE, β-catenin appeared to be inert with respect to proliferation and morphology. In contrast, there was a large anticolony/antiproliferative (77% inhibition) effect of Iwp2 in LPE, similar to that in CPE (Fig. 4B).
The above observations suggest that the CPE condition requires autocrine Lif-type signaling (which would be masked in the LPE condition) (see also Supplementary Fig. S4B) and that autocrine noncanonically acting Wnt makes an important contribution to the stimulation of proliferation in both LPE and CPE conditions. Regarding canonical (β-catenin mediated) Wnt signaling, it can only make a minor contribution in the LPE condition (where the effect of Xav939 was small; Fig. 4B), while such effect would be masked in the CPE condition (where Chir stabilized the β-catenin).
We tested the CM of Lif- or Chir-depleted cells (Supplementary Fig. S4C) reciprocally on Chir- or Lif-depleted cells, and observed growth-stimulatory effects as expected (Fig. 4C). However, unexpectedly, the growth-stimulatory effect of the CM of Chir-depleted CPE cells on Lif-depleted LPE cells, as well as their basal proliferation, was inhibited not only by Stattic but also by Xav939 (Supplementary Fig. S4F). This suggests that the reduction of Lif, while apparently still satisfying a minimal requirement for Lif signaling (after removal of Lif, its effect may linger), relieves an inhibitory effect on canonical Wnt signaling (recall that, despite the presence of β-catenin, Xav939 was nearly ineffective in LPE cells).
On the other hand, when using the CM of Lif-depleted LPE cells on Chir-depleted CPE cells, the growth-stimulatory CM effect (as well as the basal growth) was inhibited by Stattic, but not Xav939 (Supplementary Fig. S4F)—probably due to the reduction of catenin upon removal of Chir and absence of a sufficient level of Lif. Taken together, a possible explanation for these results is that Lif (at sufficient concentration) not only stabilizes but also “silences” β-catenin. While other explanations may be possible, it seems clear that both LPE and CPE cells produce autocrine noncanonically acting Wnt (potentially Wnt7b or Wnt11; Supplementary Table S6) and at least the CPE cells also an autocrine Lif-like factor at very low but essential level (candidates; Supplementary Table S6).
Next, we observed the effects of Xav939 and Iwp2 on cell morphology. The drugs did not affect the mesenchymal morphology of LPE cells (not shown). However, in CPE cells, Xav939 converted the epithelial morphology into a mesenchyme, and both Cdh1 and Podxl were no longer associated with the cell surface (Fig. 4E), while Iwp2 changed neither the epithelial appearance nor the localization of Cdh1 and Podxl. Since the epithelializing effect of Chir/β-catenin has been shown before [24], this “reverse” result indicates that the morphology of pXEN cells is entirely under the control of β-catenin and is reversible in both directions. We therefore asked whether we can interconvert pXEN cells that were long-term cultured in either LPE or CPE conditions by swapping their media.
The alternative morphotypes are interconvertible
When the media were swapped, the cells assumed the reciprocal morphology within one passage (Fig. 5A), but growth adaptation was less straightforward. When plated at very low density, the CPE-shifted LPE cells maintained their growth rate, but the LPE-shifted CPE cells now grew more slowly (Fig. 5B) (Supplementary Fig. S5A, B), and both LPE and CPE cells slowed down when shifted to T conditions (Supplementary Fig. S5B, C). However, when seeded at maintenance density, the CPE-shifted LPE cells also grew more slowly initially (Fig. 5C). While this pattern is puzzling, both medium-shifted versions reached the “medium-appropriate” growth rates after a few passages (Fig. 5C).
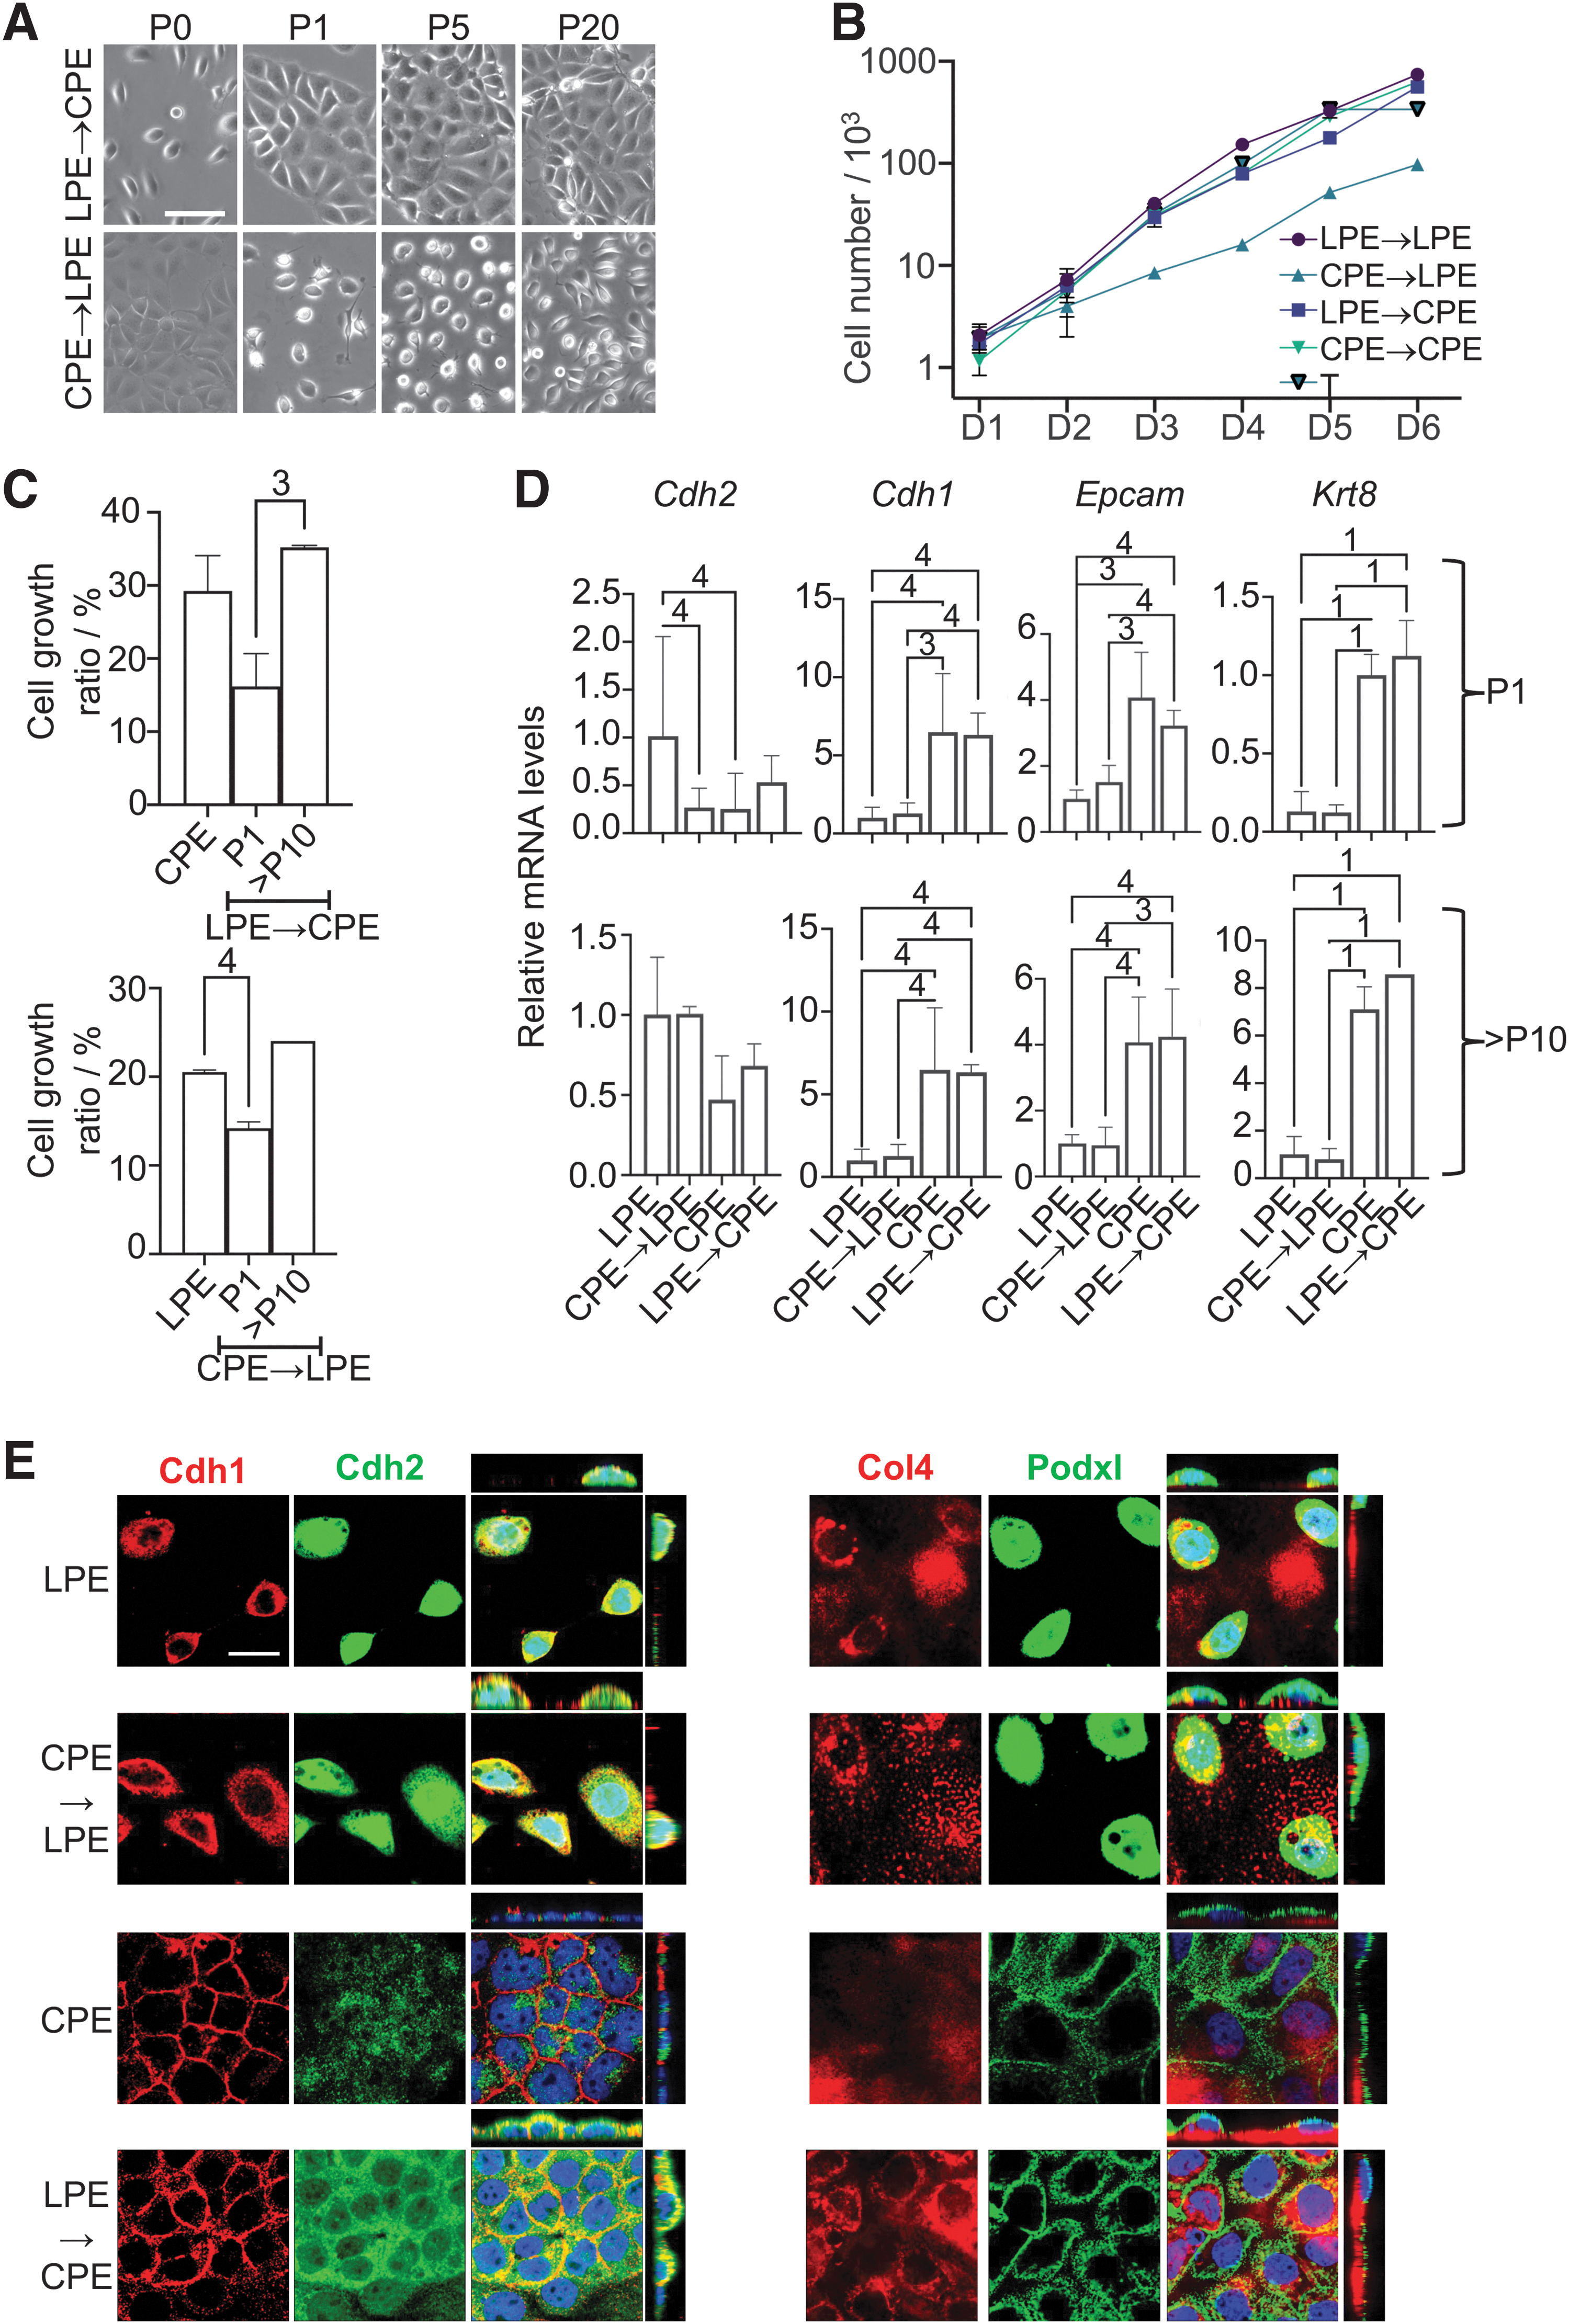
The two morphotypes are interconvertible. (
We assessed the expression of selected genes. RT-PCR revealed a rapid decrease (CPE to LPE shift) and increase (LPE to CPE) of mRNAs encoding the epithelial markers Cdh1, Epcam, and Krt8, while the mesenchymal marker Cdh2 was slow to rise (CPE to LPE) and even slower to fall (LPE to CPE) (Fig. 5D). Immunostaining revealed that the patterns of Podxl, Cdh2, and Cdh1 each changed in reciprocal manners when comparing the LPE to CPE with the CPE to LPE shift (Fig. 5E; compare with Fig. 3D).
Next, we labeled the LPE and CPE cells genetically with different fluorescent proteins and maintained them in the reciprocally shifted conditions for up to 15 passages. At P1, P10, and P15, we mixed them in a 1:1 ratio and observed their growth. In the mix, the LPE-shifted CPE cells (red) tended to grow somewhat faster than the “always-LPE” cells, regardless of passage, and the CPE-shifted LPE cells (green) tended to grow at the same or slightly faster than the “always-CPE” cells (Supplementary Fig. S5D), suggesting some residual memory of the original condition. We also made organoids from the mixed labeled cells (directly mixed, no shift involved) and observed the formation of “chimeric” organoids (Supplementary Fig. S5E).
LPE versus CPE culture conditions impose distinct gene expression profiles with parietal versus visceral endoderm bias
A bulk-level RNA-seq comparison showed that the LPE and CPE conditions imposed distinct gene expression profiles, with the LPE profile remaining somewhat more similar to the original T profile (Fig. 6A and Supplementary Fig. S6A). Pathways that distinguished the LPE and CPE patterns included cell adhesion/migration and cell shape regulation, respectively (Supplementary Fig. S6E). Immunostaining showed that the carbohydrate antigen stage-specific embryonic antigen-1 (Ssea1), thought to be a characteristic feature of pXEN cells [11,14], was highly expressed only in the T condition, weakly expressed in LPE, and not in CPE (Fig. 6B). However, the key stem cell markers, the transcription factors Oct4, Gata4, and Gata6, were equally present in all versions (Fig. 6B, C). Furthermore, all cells in LPE and T expressed leucine-rich repeat-containing G-protein-coupled receptor 5 (Lgr5, highest in LPE), but only ∼1/4 of CPE cells (Fig. 6B), indicating an unexpected heterogeneity.
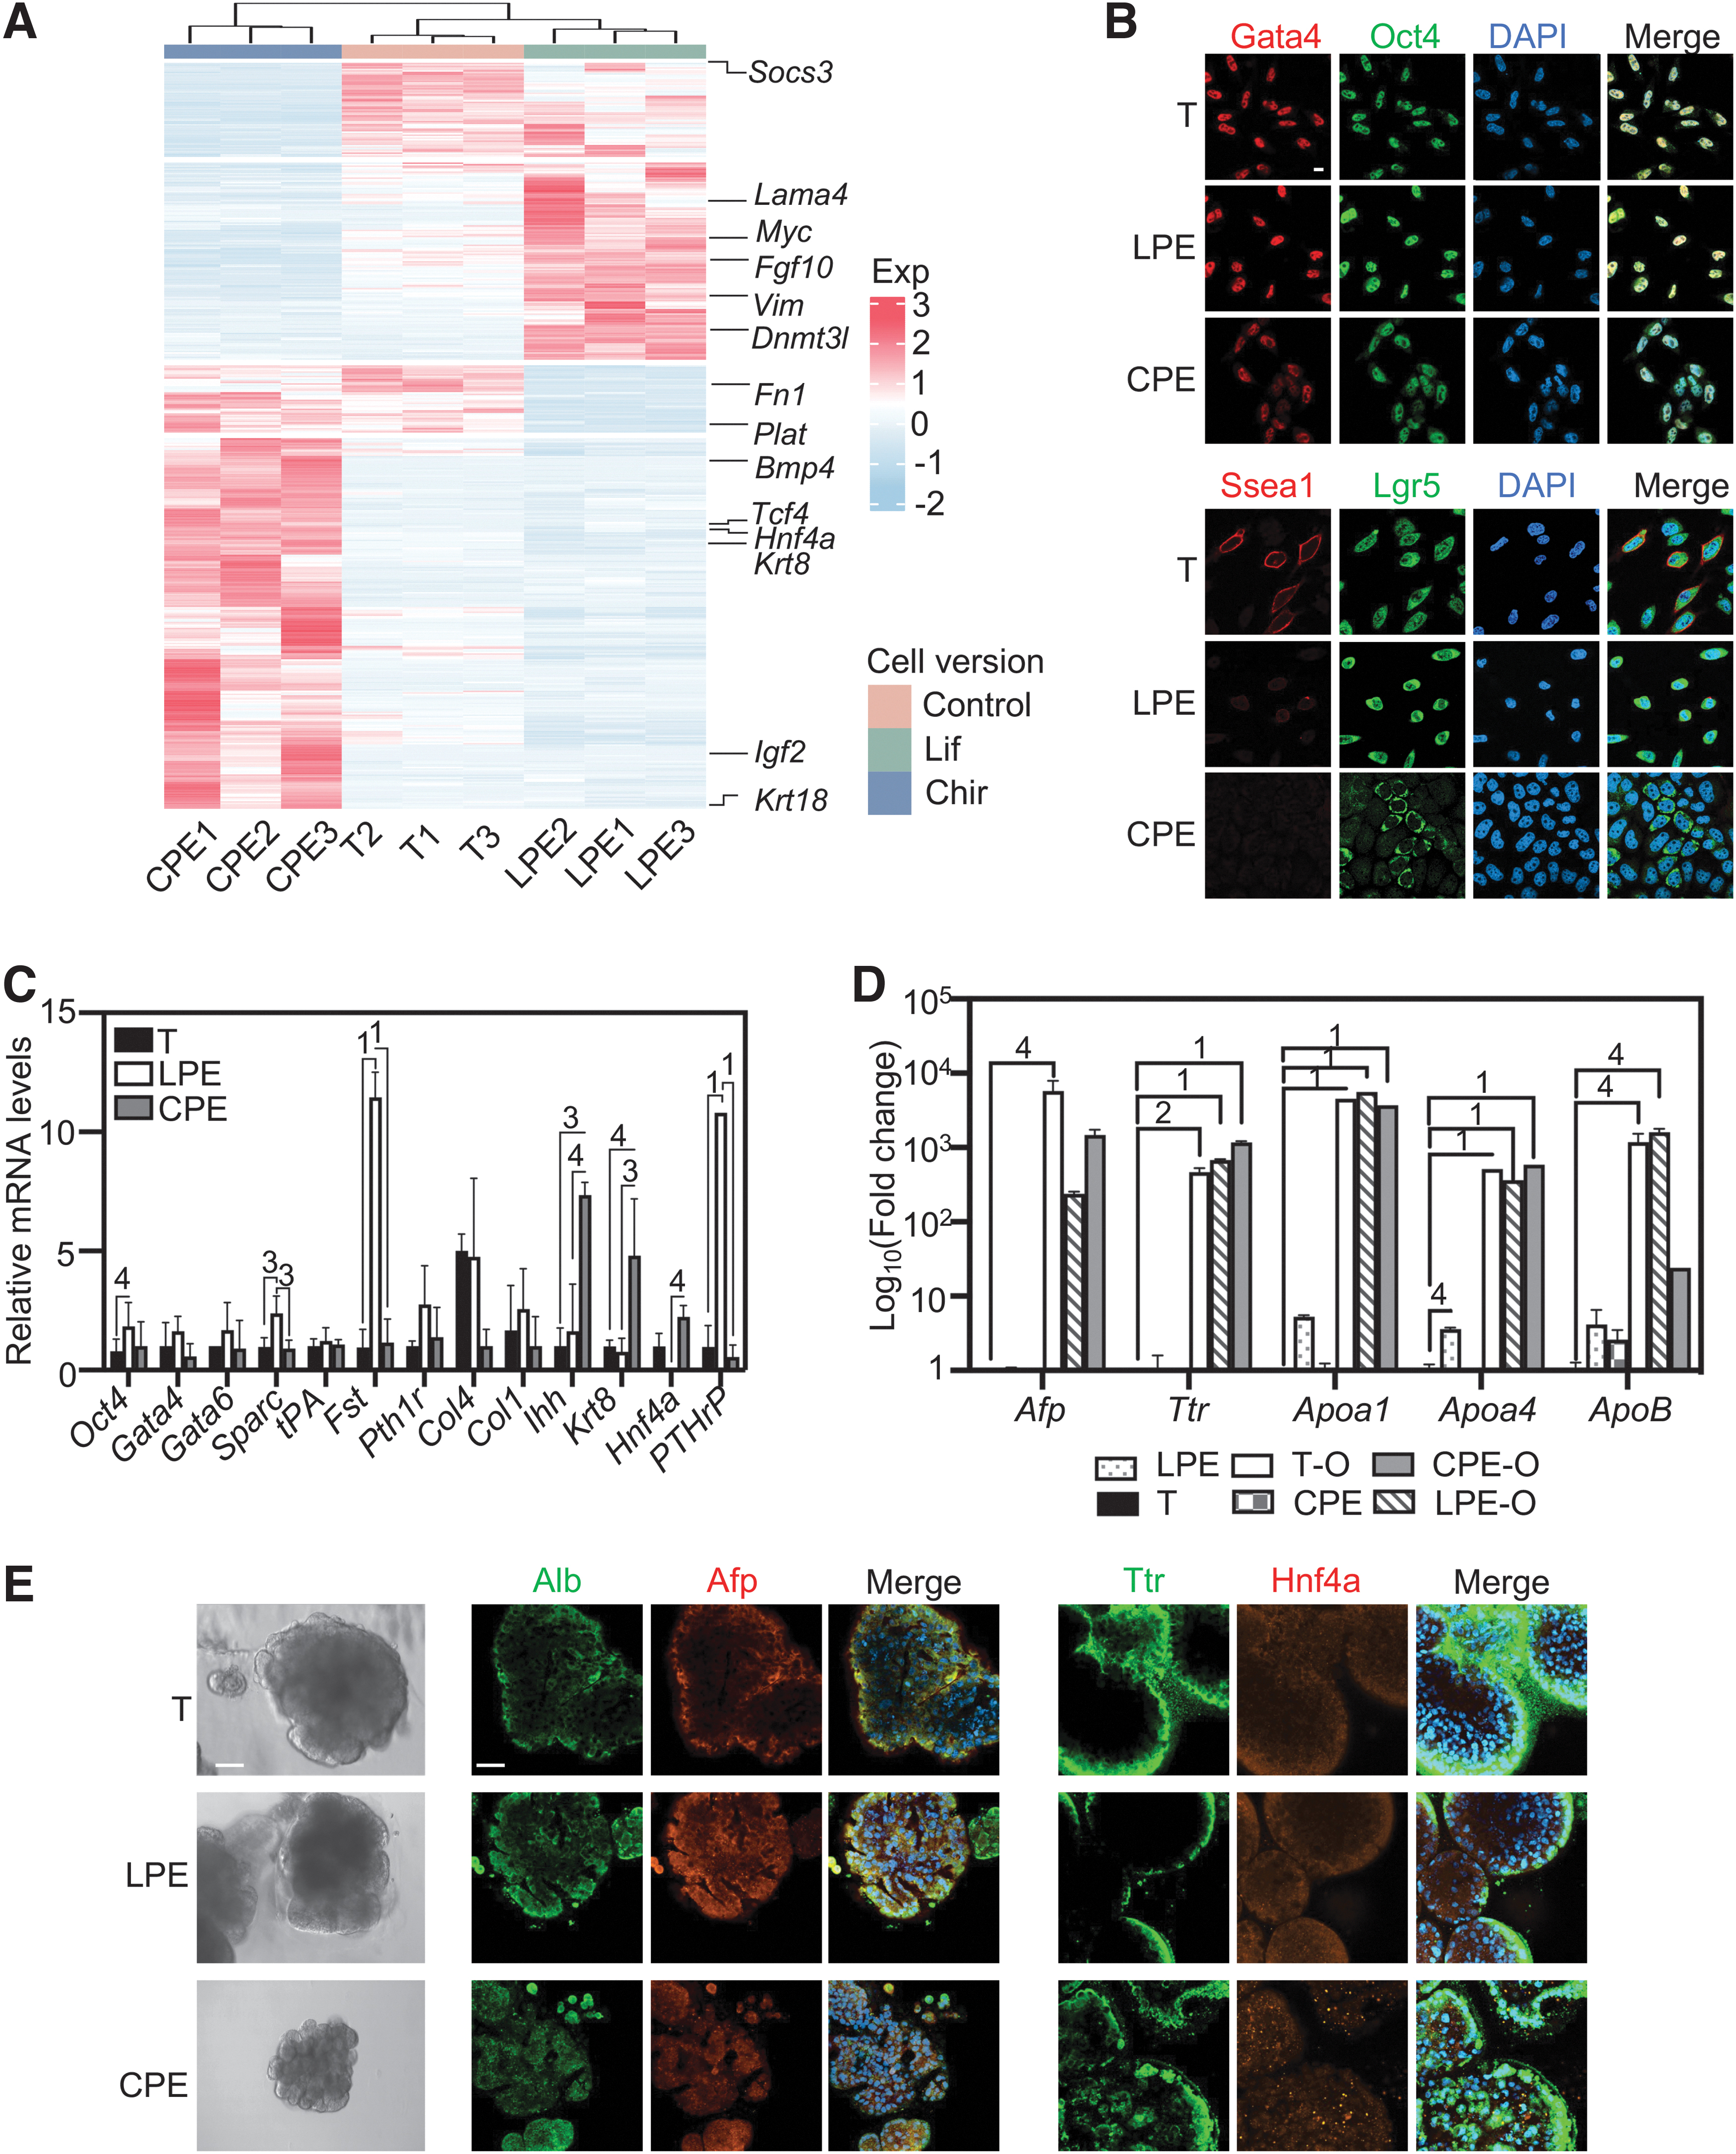
The two morphotypes are parietal endoderm- or visceral endoderm-biased versions of the same cell type. (
Using RT-PCR, we assessed selected parietal and visceral endoderm markers (Fig. 6C). In LPE cells, the parietal endoderm markers, secreted protein acidic and cysteine-rich (Sparc), Fst, PTHrP, and Col4 mRNAs, were more highly expressed than in CPE cells, while the visceral endoderm markers, Ihh and hepatocyte nuclear factor 4 alpha (Hnf4a) mRNAs, were more highly expressed in the CPE version; however, the mRNA expression of alpha-fetoprotein (Afp) and transthyretin (Ttr)—functional markers of the well-differentiated visceral endoderm—was absent (Fig. 6D). Thus, there was a tendency for CPE and LPE cells to exhibit visceral and parietal endoderm features, respectively, but the overall differentiation marker expression was low (see also Supplementary Fig. S6B and the related normalized RNA-seq dataset [see “Availability of Data and Material”]).
The two morphotypes exhibit identical differentiation and morphogenetic potentials
We created organoids from the LPE-, CPE-, and T-cultured pXEN cells (and from the yolk sac-derived pXEN-like cells) in two ways: First, by immersing the stem cells in Matrigel, and second, with a method that generates freely floating visceral endoderm vesicles (Fig. 6) [5]. We analyzed the organoids in comparison with the stem cells for the expression of known markers of the well-differentiated visceral endoderm. The stem cells did not significantly express the mRNA of Afp, Ttr, and apolipoproteins (Apoa1, Apoa4, and ApoB), except for very low levels of Apoa1/4 in LPE cells. In both organoid versions, however, all 5 markers were dramatically increased (Fig. 6D and Supplementary Fig. S7A).
Furthermore, all stem cell versions produced monolayered epithelial vesicles, best visible in the floating version (Fig. 6E and Supplementary Fig. S7B), confirming the morphogenetic potential. We noticed, however, that the efficiency of vesiculation was lower with CPE compared to LPE cells, apparently because they were more resistant to trypsinization. Finally, immunostainings for Afp, Ttr, and additionally albumin (Alb) and Hnf4a further confirmed the identical morphogenetic and differentiation potential of differently cultured pXEN cells (Fig. 6E and Supplementary Fig. S7B).
Discussion
LPE/Col1 supports a self-renewable, mesenchymal phenotype that is primed for epithelialization
In the traditional, serum-containing culture condition (T) for pXEN cells, robust growth-promoting roles for Lif and Pdgf were demonstrated, while roles for Egf and the FN coating were not convincingly shown [14]. In this study, we kept the growth factors, but removed the serum, employed a richer basal medium, and coated the dishes with Col1. This fully defined condition (LPE/Col1) enabled long-term culture at an acceptable growth rate and clarified the growth factor contributions as Lif > Pdgf > Egf.
Similar to the T-cultured cells, the LPE cells expressed not only mesenchymal but also epithelial markers, despite the mesenchymal morphology. Of note, in both conditions, β-catenin was well expressed, but apparently not functional, since its destruction (by Xav939) had no or little effect on morphology and proliferation. Likewise, Cdh1, although well expressed, was not surface associated. In contrast to the T condition, however, Podxl was not surface associated in LPE cells. Thus, LPE-cultured pXEN cells remain “primed” for epithelialization, but in a less structured way than the T-cultured cells, which are apically polarized on their surface. We attribute this lack of structure, at least in part, to the collagen-induced loss of vacuoles, which play a key role in the polarization [5]. It remains open whether a pXEN cell culture without any epithelial feature is possible, in fact, whether a fully mesenchymal “ground state” of the ExEn exists [2].
CPE/Col1 supports a self-renewable, epithelial phenotype
In the presence of serum and Lif, pXEN cells epithelialize upon addition of the β-catenin-stabilizing drug Chir, which can be neutralized by Fsk [24]. We therefore tested Chir, but without serum/Lif. As hoped, this CPE/Col1 condition not only imposed an epithelial morphology but also drove permanent self-renewal, with Egf now showing little effect. The epithelial appearance of CPE-cultured pXEN cells was supported by gene expression analysis, revealing lower levels of mesenchymal and higher levels of epithelial markers than in T and LPE cells, but most importantly, stronger features of structural epithelialization (cells growing in islands and expressing Cdh1 and Podxl on their surface). Also of note, Fsk improved the Col4 production under low-attachment conditions (CPE/FNlo), and consequently attachment and short-term proliferation; this effect was not seen with LPE/FNlo cells, in line with their higher production of Col4.
Shared roles for Stat3 and Wnt signaling in LPE and CPE; additional roles for β-catenin in CPE
Mouse pXEN cells, grown in the T condition, require Lif/Stat3 signaling and appear mesenchymal [15], while mouse PrESCs [10] and mouse nEND cells [16] are maintained with Chir or Wnt and appear epithelial. We were therefore not surprised that Stat3/Gp130 inhibitors and the Chir-antagonizing drug Xav939 blocked proliferation of LPE- and CPE-cultured rat pXEN cells, respectively. Less obviously, the Stat3/Gp130 inhibitors blocked also the growth of CPE-cultured cells. Moreover, the Wnt secretion inhibitor Iwp2 inhibited growth in both media, implying a β-catenin-independent role of Wnt signaling in both LPE (where Iwp2 had a much larger effect than Xav939) and CPE (where Iwp2 was effective despite the presence of Chir). Thus, both conditions required Lif-type signaling (exogenously stimulated in LPE, autocrine in CPE) and noncanonical Wnt signaling (autocrine), in addition to their shared requirement for (exogenously provided) Pdgf. The main differences are the intensity of the required Lif signaling (high in LPE and low in CPE) and the requirement for β-catenin in CPE, but not LPE cells.
In this study, the drug Chir supported proliferation and epithelialization, but the latter can also be induced by Bmp4 [24,25,28], which therefore might play this role in vivo. Alternatively, Chir substituted for a canonical Wnt signal. Future work should address how Chir and BMP signaling and how Gp130/Stat3 and Wnt signaling relate to each other. With respect to the latter, we note that in the closely related ES cells, β-catenin alone cannot maintain proliferation, but effectively synergizes even with low levels of Lif [29].
Two morphologies: one cell type
We posit that the LPE/Col1 and CPE/Col1 culture conditions maintain the same cell type. (1) Both pXEN versions expressed the same early ExEn lineage markers, notably Gata4 and Oct4, and gave rise to the same well-differentiated organoids. (2) The morphotypes were interconvertible and remained self-renewable thereafter, although nuanced differences persisted for at least a few passages, suggesting some epigenetic traces of the culture past. (3) Low versus high cell density favored more mesenchymal/parietal endoderm-like versus epithelial/visceral endoderm-like features in both media. (4) Although the RNA-seq analysis suggested a slightly more pronounced gene expression pattern related to Wnt versus Stat3 signaling in CPE versus LPE, neither the signaling- nor the MET-related gene expressions were drastically different. It appears that nuanced quantitative differences in signaling, such as the ratio of Stat3 versus β-catenin signaling, rather than expression levels, lead to different structural arrangements that diversify the morphological appearances.
Conclusion
Using rat pXEN cells, we cultured for the first time ExEn stem cells permanently as alternative mesenchymal and epithelial versions and in chemically defined conditions (Fig. 7). The mesenchymal version is primed for epithelialization by gene expression, but not structurally. Structural epithelialization is superimposed through β-catenin, which also contributes to epithelial proliferation. In addition, both morphotypes require (to different degrees) Gp130/Stat3 and noncanonical Wnt signals for proliferation, as well as Pdgf. Furthermore, both morphotypes show the same potential for differentiation and morphogenesis, which was also demonstrated under chemically defined conditions. The results provide an improved platform for studying the proliferation, plasticity, morphogenesis, and differentiation of the early ExEn lineage, which occurs in mesenchymal and epithelial forms in vivo [2].
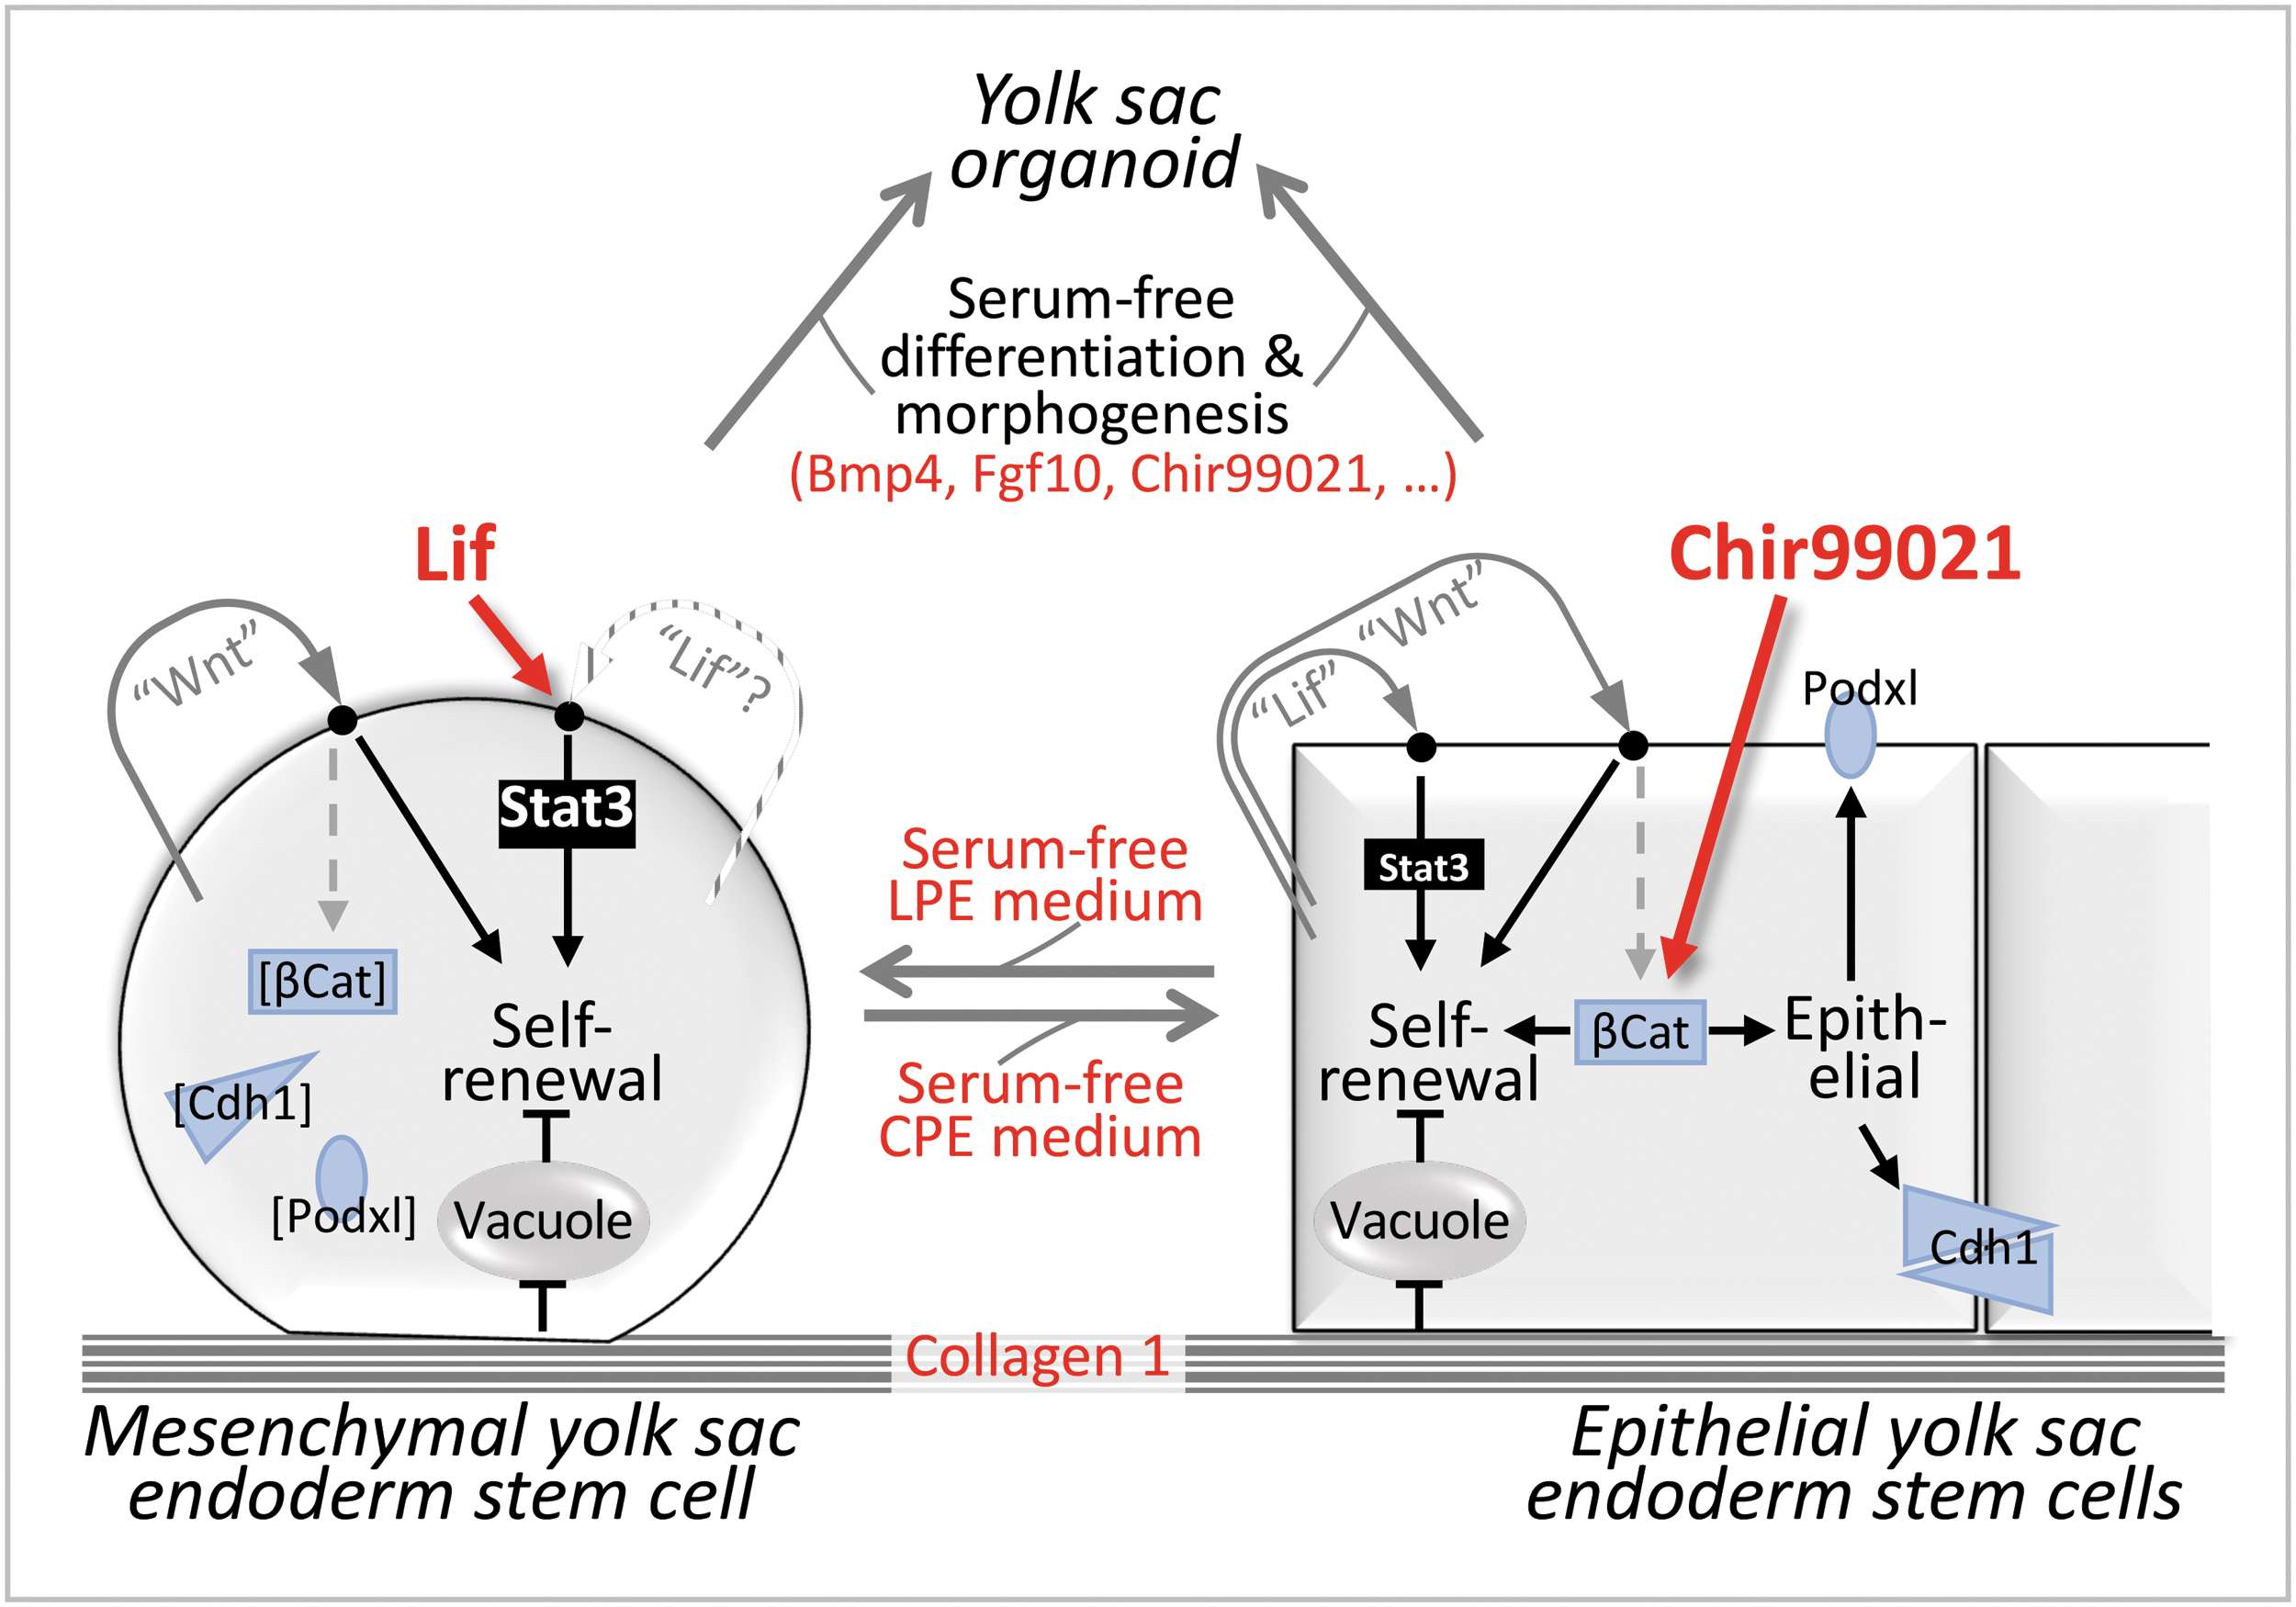
Schematic summarizing key findings of the study. We identified a set of additives (in red) that enables the unlimited self-renewal and the differentiation/morphogenesis of rat pXEN cells in chemically defined conditions. We showed that pXEN cells can self-renew in both a mesenchymal, Lif-supported mesenchymal state that is “epithelially primed” [expresses epithelial markers (blue), but does not seem to use them] and a β-catenin-dependent epithelial state that is driven by the drug Chir99021. The two states are interconvertible, share requirements for Pdgf and as yet undefined autocrine Lif-type (acting through Gp130/Stat3) and Wnt-type (acting noncanonically) factors, and have the same potential for differentiation and morphogenesis, as shown by the formation of well-differentiated organoids.
Ethics Approval
Not applicable.
Consent to Participate
Not applicable.
Consent for Publications
Not applicable.
Availability of Data and Material
RNA-seq data have been deposited in the Gene Expression Omnibus (GEO) under accession number GSE232755. To review GEO accession GSE232755, go to
Footnotes
Author Disclosure Statement
The authors declare no competing interests.
Funding Information
This work was supported by the National Research Foundation of Korea 2020R1F1A1063217.
Supplementary Material
Supplementary Table S1
Supplementary Table S2
Supplementary Table S3
Supplementary Table S4
Supplementary Table S5
Supplementary Table S6
Supplementary Figure S1
Supplementary Figure S2
Supplementary Figure S3
Supplementary Figure S4
Supplementary Figure S5
Supplementary Figure S6
Supplementary Figure S7