
Abstract
Nonalcoholic fatty liver disease (NAFLD) is a serious disease. There are no specific drugs for it, in part because of the lack of effective models to aid drug development. However, it has been shown that three-dimensional organoid culture systems can reproduce the organ structure and maintain the gene expression profile of the original tissue. Therefore, we aimed to construct NAFLD models from liver organoids for pharmacological and mechanism studies. We successfully observed morphological changes in normal liver tissue in mouse liver organoids with positive albumin (ALB) expression and potential for differentiation toward hepatocyte-like cells. The mRNA expression of the hepatocyte markers ALB and hepatocyte nuclear factor 4 alpha increased after liver organoid differentiation. We observed free fatty acid (FFA)-induced lipid accumulation in organoids with significant increases in alanine aminotransferase, aspartate aminotransferase, total bilirubin, and triglyceride levels. Moreover, FFA-induced inflammatory cytokines (interleukin-6, tumor necrosis factor-α, and nitric oxide) and fibrosis indicators (collagen type I α1 and laminin α1) were also increased. In addition, RNA sequencing results showed that the expression of key genes [nucleotide oligomerization domain-like receptor (NLR) family apoptosis inhibitory protein, interferon regulatory factor (IRF) 3, and IRF7] involved in NAFLD metabolic abnormalities and insulin resistance in the NLR signaling pathway was altered after FFA induction of the liver organoids. Finally, we found that JC2-11 and lanifibranor limited the FFA-induced increase in oil-red lipid droplets, liver damage, inflammation, and liver fibrosis. In conclusion, tissue structure, gene expression, and the response of mouse liver organoids to drugs can partially mimic in vivo liver tissue. Liver organoids can successfully construct NAFLD models for drug discovery research.
Introduction
Nonalcoholic fatty liver disease (NAFLD) is the most prevalent chronic liver disease worldwide. 1 Similar to metabolic risk factors, the incidence of NAFLD has been increasing yearly. 2 NAFLD includes nonalcoholic fatty liver (NAFL) and nonalcoholic steatohepatitis (NASH), the liver manifestations of obesity and metabolic syndrome, respectively. They can lead to hepatocellular degeneration and inflammation that ultimately leads to cirrhosis and hepatocellular carcinoma. 3 –5 However, the specific mechanisms underlying the progression of the disease remain unknown, and no effective treatment has been approved for the treatment of NASH. 6
Researchers have used cell culture in vitro fatty liver models and in vivo mouse models to study the molecular mechanisms of NAFLD. 7,8 However, these models do not represent the complexity of human organ tissues. 9,10 The organoid, defined as an artificially grown block of cells resembling a miniature organ, is a more complex three-dimensional (3D) in vitro model that grows from its original tissue and can reproduce the features of its primary source. 11 –13 This promises new avenues for research and disease modeling. 11
Liver organoids are better able to represent the heterogeneity of living tissue for their content of differentiated hepatocytes and stem cells that can differentiate into hepatocytes. 14 Kruitwagen et al. 15 successfully cultured feline liver organoids and demonstrated lipid accumulation after free fatty acid (FFA) induction, which can be used for disease modeling of hepatic steatosis. Ouchi et al. 16 codifferentiated epithelial and stromal lineages from human pluripotent stem cells. FFA treatment of this multicellular human liver model demonstrated steatohepatitis-like pathology. Pingitore et al. 17 developed an in vitro model of NAFLD consisting of a multilineage 3D spheroid of hepatocytes (HepG2) and hepatic stellate cells (LX-2) that accumulated intracellular fat and collagen deposits upon exposure to FFA. More important, Elbadawy et al. 18 generated NASH liver organoids from mice with different stages of NASH disease for the first time, demonstrating that liver organoids show similar characteristics to liver tissue in NASH disease. All these findings suggest the possibility of liver organoids mimicking NAFLD in vitro. In this study, we used normal mouse liver tissue to construct liver organoids and NAFLD models in vitro. Furthermore, we analyzed the changes in gene expression profiles in the NAFLD model organoids by RNA sequencing (RNA-seq).
This study was approved by the Ethics Committee of the Eighth Affiliated Hospital of Sun Yat-sen University, and this article is based on the ARRIVE Guidelines reporting checklist.
Materials and Methods
Animals
C57BL/6J mice (8 weeks old, male, weighing 35–40 g, Guangzhou Forevergen Biosciences, ACUC-AEWC-F2207022) were raised in a pathogen-free environment, at 24°C ± 2°C, 50%–60% humidity, with a 12-h light/12-h dark cycle and artificially fed chow and water. This study was approved by the Ethics Committee of the Eighth Affiliated Hospital of Sun Yat-sen University.
Liver organoids culture
Three mice were sacrificed by cervical dislocation, and the liver tissue was collected and cut into 1-mm3 pieces under aseptic conditions. The tissue was dispersed in saline, centrifuged, and the supernatant removed. Type II collagenase, type II dispase, and DNase I (Gibco, USA) were added to the cell suspension. The cells were then digested by shaking at 37°C for 30 min, after which digestion was terminated. The cell pellet was collected, passed through a 40-μm cell strainer, and the residue was resuspended with 100 μL of Dulbecco's Modified Eagle Medium/Nutrient Mixture F-12 Ham;(DMEM/F12) medium (Gibco). Finally, the cell suspension was thoroughly mixed with 120 μL of Matrigel (BD Biosciences, USA), inoculated into 6-cm culture dishes, left for 2 min, and inverted in the incubator. After the gel was fully solidified, liver organoid primary extraction medium 19 was added and incubated in a 5% CO2 incubator at 37°C for 5 days, with medium changes every 3 days. Organoids were passaged every 7–14 days at 1:2–4 split, 18 followed by the addition of expansion medium and differentiation medium. The expansion medium (Biorgen, China) was composed of Advanced DMEM/F12 containing 1% (v/v) penicillin–streptomycin, 2 mM 4-(2-hydroxyethyl)–1-piperazineëthanesulfonic acid (HEPES; ThermoFisher, USA), 1% GlutaMax, 1% B27 supplement (Invitrogen, USA), 50 ng/mL epidermal growth factor (EGF; Invitrogen), 50 ng/mL hepatocyte growth factor (HGF; Peprotech, USA), 100 ng/mL fibroblast growth factor (FGF)-10, 15 nM Gastrin (Tocris Bioscience, Bristol, UK), 1.5 mM N-acetylcysteine (Sigma-Aldrich, USA), 100 ng/mL R-spondin-1 (Absin, Shanghai, China), and 15 mM nicotinamide (Sigma-Aldrich). EGF, HGF, FGF10, and the other cytokines promote cell proliferation.
Preparation of paraffin sections
The organoids were immersed in 4% paraformaldehyde (Sigma) overnight, dehydrated with gradient ethanol (5 min each time), and transparent with xylene (5 min each time). The samples were transferred to an embedded bottom mold with paraffin and placed in an oven at 65°C for 10 min. After cooling, the sample was sliced into 4-μm sections.
Hematoxylin and eosin staining
After dewaxing with xylene and dehydrating using gradient ethanol, the sections were stained with hematoxylin, differentiated with 0.7% hydrochloric acid alcohol, and dyed with eosin for 3 min. After dehydration, transparency, and sealing, light microscopy (Olympus) was performed.
Immunofluorescence assay
The tissue sections were incubated with 4% bovine serum albumin (BSA, Sigma-Aldrich) in phosphate-buffered saline (PBS) for 1 h. Primary antibody albumin (ALB, Proteintech, Rosemont, IL, USA) was diluted in 4% BSA dissolved in PBS and incubated with the sections for 1 h. Subsequently, the sections were washed with PBS and incubated with a fluorescent secondary antibody (Proteintech) for 1 h, in the dark. The nuclei were stained with 4′,6-diamidino-2-phenylindole (DAPI) for 10 min. Finally, the fluorescence intensity of ALB was observed under a fluorescence microscope (Nikon A1R-A1, Japan).
Liver organoids differentiation
The liver organoids were cultured in the expansion medium for 7 days and then transferred to a differentiation medium (Biorgen, China). The differentiation medium was composed of Advanced DMEM/F12 containing 1% (v/v) penicillin–streptomycin, 2 mM HEPES, 1% GlutaMax, 1% B27 supplement, 50 ng/mL EGF, 100 ng/mL FGF10, 50 nM A83-01, 3 µM dexamethasone, and 10 µM N-[N-(3,5-difluorophenacetyl)-
Establishment of the NAFL model in liver organoids
The organoids were divided into two groups, the control group (the liver organoids were treated with an oleate acid and palmitate acid mixture) and the FFA group, induced by FFA (oleate acid: palmitate acid = 245 μM:122.5 μM) 20 (Sigma). After induction for 2 days, the organoid and culture fluid were collected for the subsequent experiments. After treatment with 50-μM nucleotide oligomerization domain (NOD) pathway inhibitor JC2-11 (HY-152670) MedChemExpress (MCE) 21 and the 10-μM peroxisome proliferator-activated receptor (PPAR) agonist lanifibranor (HY-104049, MCE), 22 the liver organoids were treated with FFA for 24 h to induce NAFLD. The groups were Control, FFA, FFA + JC2-11, and FFA + lanifibranor.
Quantitative real-time polymerase chain reaction
TriQuick Reagent total RNA extraction reagent (R1100; SoLarbio, Beijing, China) was used to extract total RNA. A 5×RT SuperMix for qPCR (K1074; APEXbio, Houston, USA) was used to reverse-transcribe the extracted RNA into complementary DNA. The cDNA was used to perform a quantitative real-time polymerase chain reaction (qRT-PCR) assay with 2×SYBR Green qPCR Master Mix (K1070; APEXbio). Glyceraldehyde-3-phosphate dehydrogenase (GAPDH) acted as an internal reference to the gene. The primers used were as follows: M-ALB-F: GCTACACCCAGAAAGCACCT, M-ALB-R: AACATGCTCACTCACTGGGG; M-hepatocyte nuclear factor 4 alpha (HNF-4α)-F: GAGACTCCACAGCCATCACC, M-HNF-4α-R: TATGAGCCAGCAGAACCCCT; M-interleukin (IL)-6-F: AGTTGCCTTCTTGGGACTGA, M-IL-6-R: TCCACGATTTCCCAGAGAAC; M-tumor necrosis factor (TNF)-α-F: ACAGAAAGCATGATCCGCGA, M-TNF-α-R: GAGGCTGAGACATAGGCACC, M-collagen type I alpha 1 (COL1A1)-F: GGGGCAAGACAGTCATCGAA, M-COL1A1-R: GTCCGAATTCCTGGTCTGGG; M-GAPDH-F: AGGTCGGTGTGAACGGATTTG, M-GAPDH-R: TGTAGACCATGTAGTTGAGGTCA; M-LAMA1-F: CACATCAGCGCCAATGCTAC, M-LAMA1-R: GCAACTTGAAAGACCTGCCG; M-β-Actin-F: GGCTGTATTCCCCTCCATCG, M-β-Actin-R: CCAGTTGGTAACAATGCATGT.
Oil Red O staining
The sections were stained with Oil Red O stain (Sigma-Aldrich) for 10 min at 37°C and then fractionated with 60% isopropanol until the background was colorless. The PBS was washed three times, followed by hematoxylin restaining for 1 min, and then washed three times, followed by neutral resin fixation to seal the film before microscopy.
Nile red staining
Lipid accumulation was examined using a Nile red staining kit (Yeasen, China; Cat. No. 60530ES03). The organoid samples were fixed over 24 h, and frozen sections were prepared. Nile red stain was added to the sections which were kept in the dark for 10 min. After washing with PBS, the sections were stained with DAPI solution for 8 min. After cleaning, the tablets were sealed with an anti-fluorescence quench sealant. The stained sections were examined by fluorescence microscope (Nikon A1R-A1, Japan).
Periodic acid–Schiff staining
Glycogen levels were assessed using a periodic acid–Schiff (PAS) staining kit (Servicebio, China; Cat. No. G1008). After deparaffinization, the paraffin sections were washed and treated with periodic acid for 10 min. After washing, the sections were stained with Schiff’s reagent for 10–15 min. The sections were cleaned and stained with hematoxylin for 3 min. They were then washed, routinely dehydrated, transparent, and sealed. The sections were examined under a microscope (Olympus).
Nitric oxide detection
Nitric oxide (NO) levels were measured using a NO colorimetric assay kit (Elabscience; Cat. No. E-BC-K035-M) according to the kit instructions.
Biochemical testing
The supernatants were diluted into different concentrations, and the alanine aminotransferase (ALT), aspartate aminotransferase (AST), and total bilirubin (TBIL) levels were measured using the corresponding biochemical kits (Sigma).
Triglyceride measurement
Triglyceride (TG) levels in the liver organoids were determined using a triglyceride kit (YaJi Biological, Shanghai, China).
RNA-seq and differentially expressed gene screening
The RNA was first isolated and purified with Trizol (Invitrogen), and the amount and purity of the total RNA were measured using a NanoDrop ND-1000 spectrophotometer (NanoDrop Technologies, USA). The integrity of the RNA was tested with a BioAnalyzer 2100. After reverse transcription of total RNA into cDNA, double-stranded DNA was synthesized. The DNA samples were fragmented with the UDG enzyme (New England Biolabs, USA). The library was constructed and sequenced according to the Illumina Novaseq™ 6000 kit instructions. The fastp (https://github.com/OpenGene/fastp) was used to control the quality of raw reads. To screen for the differentially expressed genes (DEGs), the Limma package of R software 23 was used. DEGs were screened with the false discovery rate corrected for P < 0.05 and |log fold-change >1. The heat map and volcano map were plotted using the R package ggplot2.
Gene ontology and kyoto encyclopedia of genes and genomes analysis
We applied gene ontology (GO) classification, 24 including GO-BP (biological process), GO-MF (molecular function), and GO-CC (cellular component), to reveal the functions of the DEGs. The R package (Version 4.0) “ClusterProfiler” was used to analyze the GO function annotation of the DEGs and Kyoto Encyclopedia of Genes and Genomes (KEGG) pathway enrichment analysis. 25 P < 0.05 was considered statistically significant.
Statistical analysis
All experiments were independently repeated at least three times. All statistical analyses were performed using SPSS (version 20.0; IBM Corporation, Armonk, NY, USA). Data are expressed as mean ± standard deviation. Student’s t-test analysis was used for comparisons between the two groups. Multiple groups were compared using a one-way analysis of variance. P < 0.05 was considered statistically significant.
Results
Establishment and characteristics of mouse liver organoid culture
First, after 1, 3, 5, 7, and 9 days of liver organoid incubation, round or vesicular structures appeared under the microscope (Fig. 1A). The diameter of the organoids increased with incubation time (Fig. 1B). Figure 1C shows a picture of liver organoids after 10 generations. With hematoxylin and eosin staining, the organoids were found to have a dense structure consisting of a single layer of cuboidal epithelial cells like normal liver tissue (Fig. 1D).
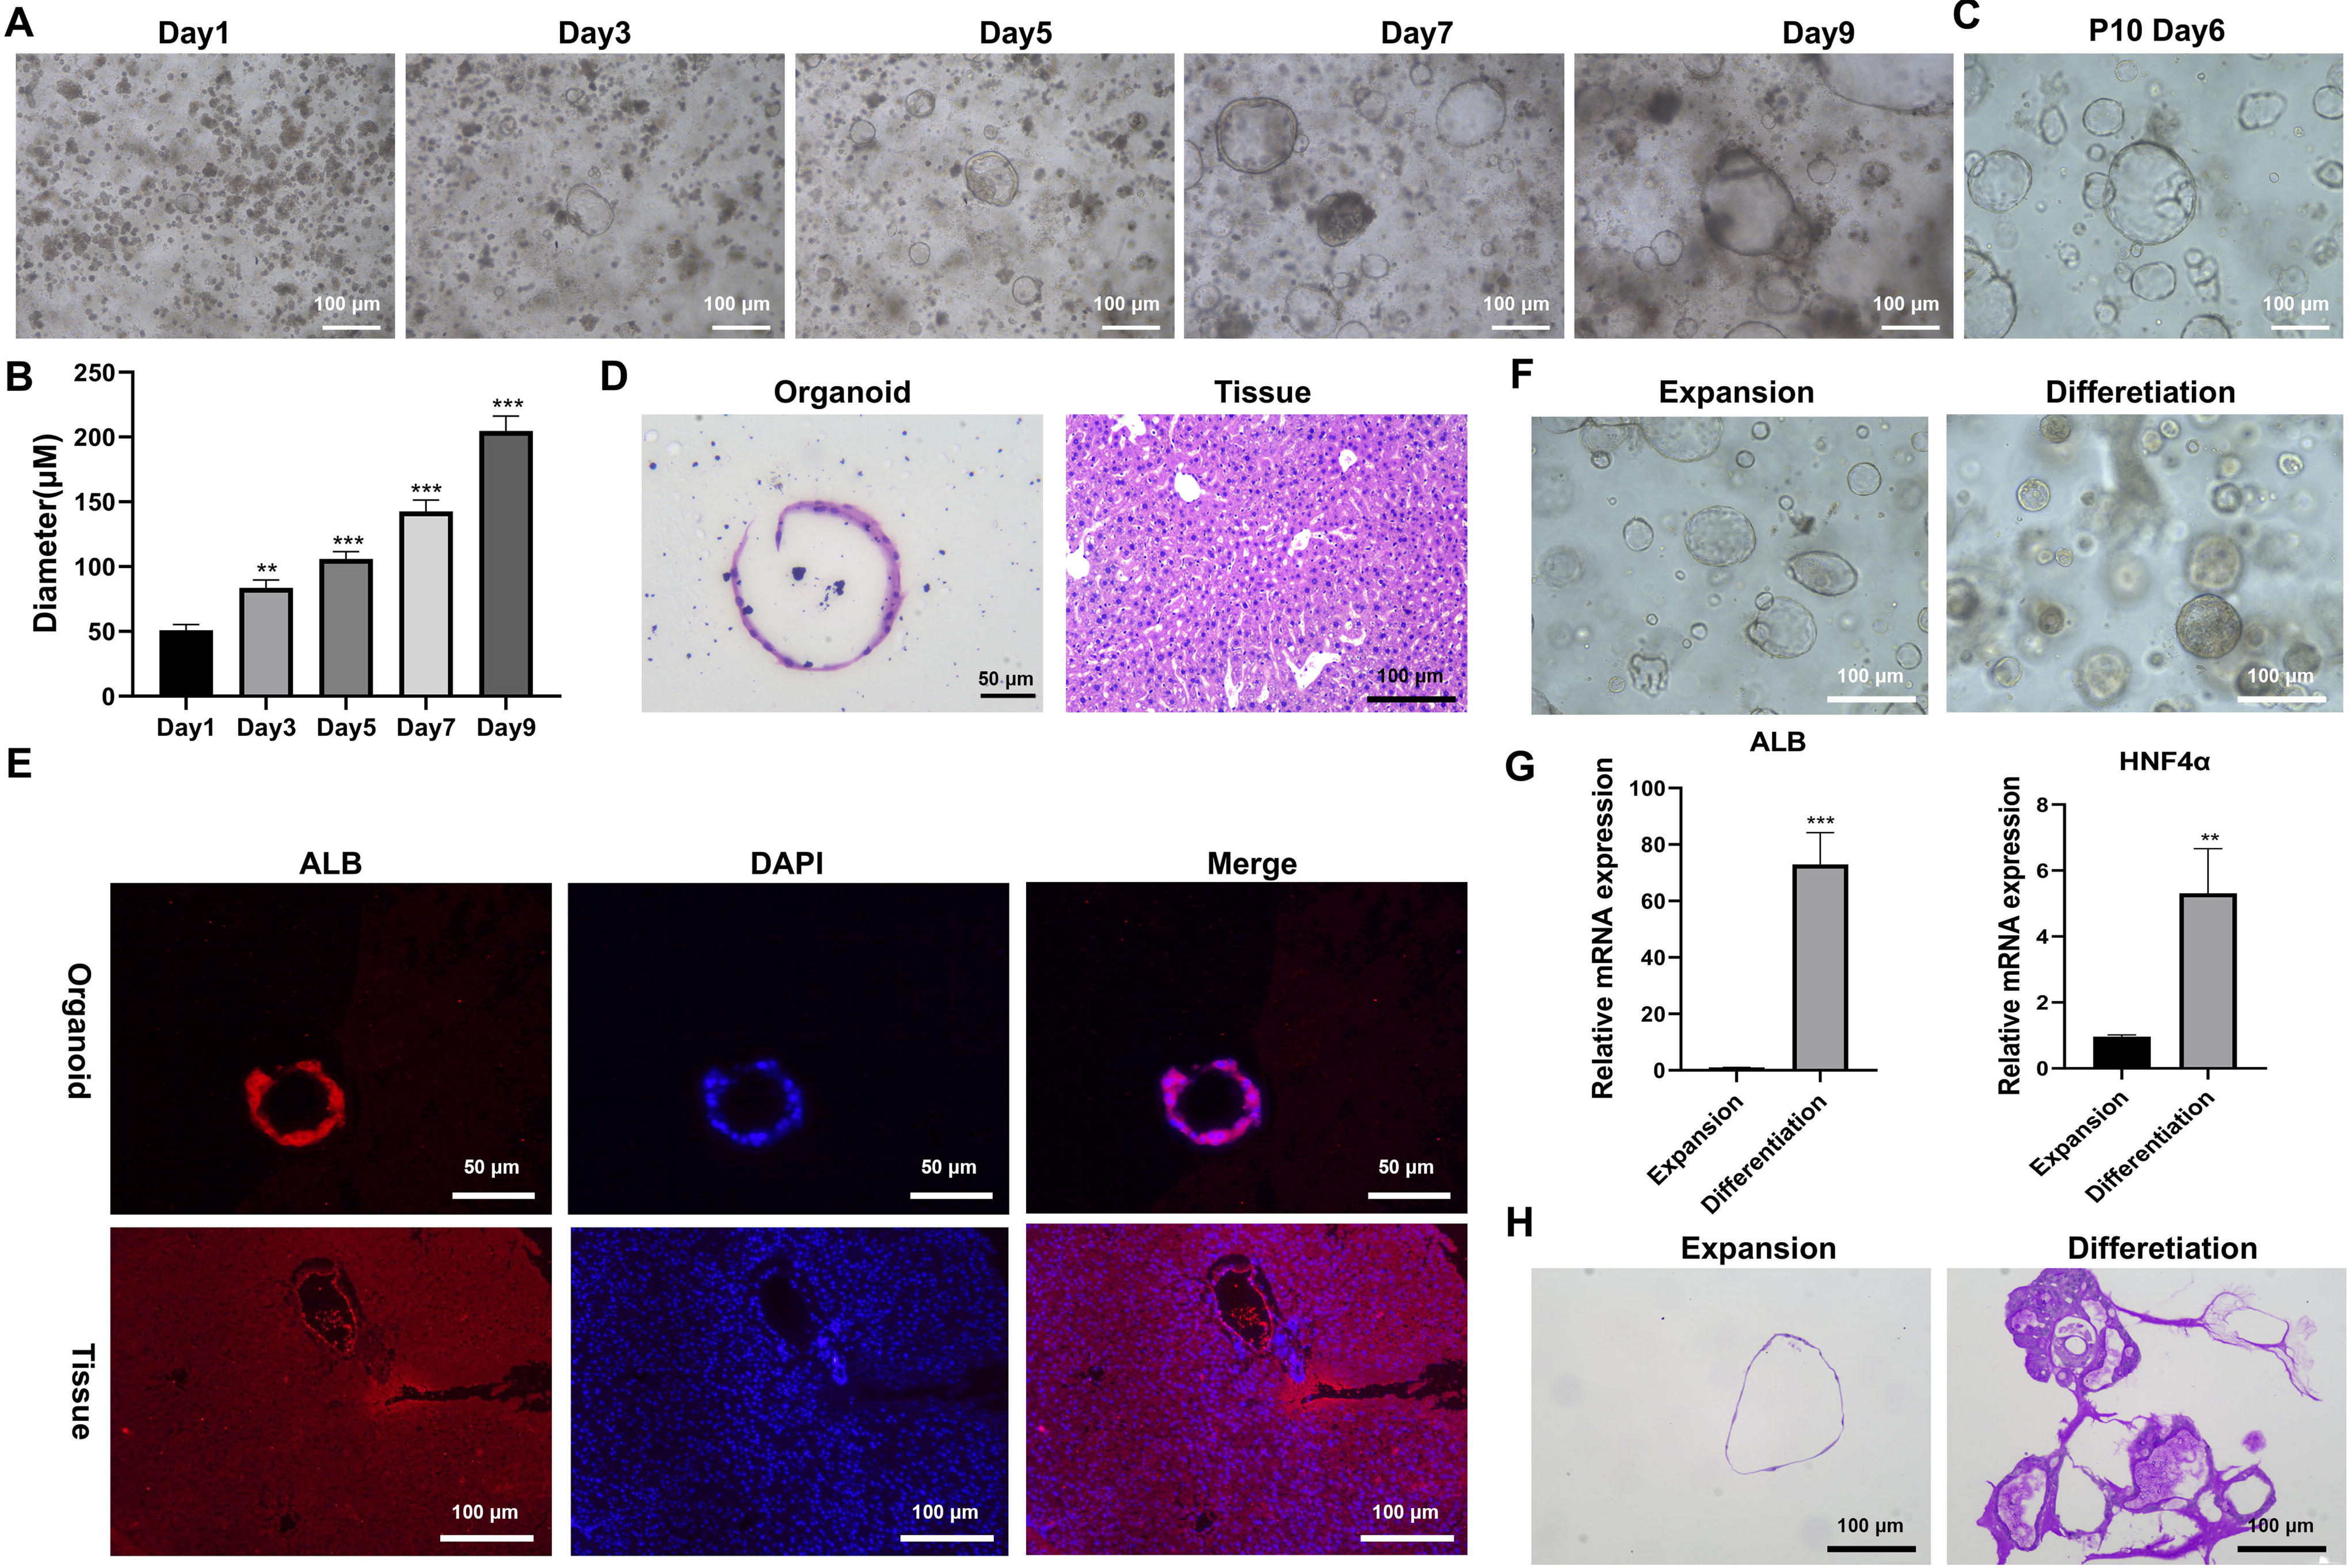
Culture and characteristics of mouse liver organoids.
The immunofluorescence results showed that the organoids expressed the hepatocyte-specific marker, ALB protein, as in normal liver tissue (Fig. 1E). Furthermore, we found that the spatial morphology of the hepatocytes was more complex under differentiation medium than expansion medium conditions (Fig. 1F). In addition, using qRT-PCR, we detected the expression of hepatocyte markers ALB and HNF-4α after liver organoid differentiation. Figure 1G shows that mRNA expressions of ALB and HNF-4α in the differentiation group were greater than those in the expansion group. Moreover, PAS staining data showed that the level of glycogen storage was markedly higher in the differentiation group (Fig. 1H).
Establishment of fatty liver model in mouse liver organoids
Oil Red O staining and Nile red staining data demonstrated that the quantity of lipid droplets was markedly greater in FFA-induced liver organoids than in those in the control group (Fig. 2A). Nile red staining results further revealed that FFA could enhance the lipid accumulation of organoids as it decreased 48 h after FFA cessation (Fig. 2B). In addition, ALT, AST, and TBIL levels were significantly higher in the culture medium of the FFA group than in that of the control group (Fig. 2C). FFA-induced organoid tissue cells produced higher levels of TG than the control group cells did. TGs are the main components of lipids accumulated in the liver (Fig. 2D). Furthermore, we found increased expression of inflammatory cytokines IL-6 and TNF-α in the FFA group than in the control group, suggesting increased inflammation (Fig. 2E). At the same time, compared with the control group, the expression of COL1A1 and LAMA1 was higher in the FFA group, suggesting increased liver fibrosis (Fig. 2F). Meanwhile, the level of NO was higher in the FFA group, suggesting increased inflammation in the liver organoids (Fig. 2G).

Establishment of fatty liver model in mouse liver organoids.
Screening for DEGs in mouse organoid fatty liver
In total, we screened for 185 DEGs, of which 53 were upregulated and 132 were downregulated. The heat map of clustering analysis and volcano plot represent the DEGs in the fatty liver organoids after FFA induction (Fig. 3A, B). Figure 3C shows the top 50 differentially expressed up- and downregulated genes. The genes fructose bisphosphatase 2 (FBP2), pyruvate dehydrogenase kinase 4 (PDK4), and ubiquitin specific peptidase 18 (USP18) have been reported to be associated with lipogenesis or NAFLD.
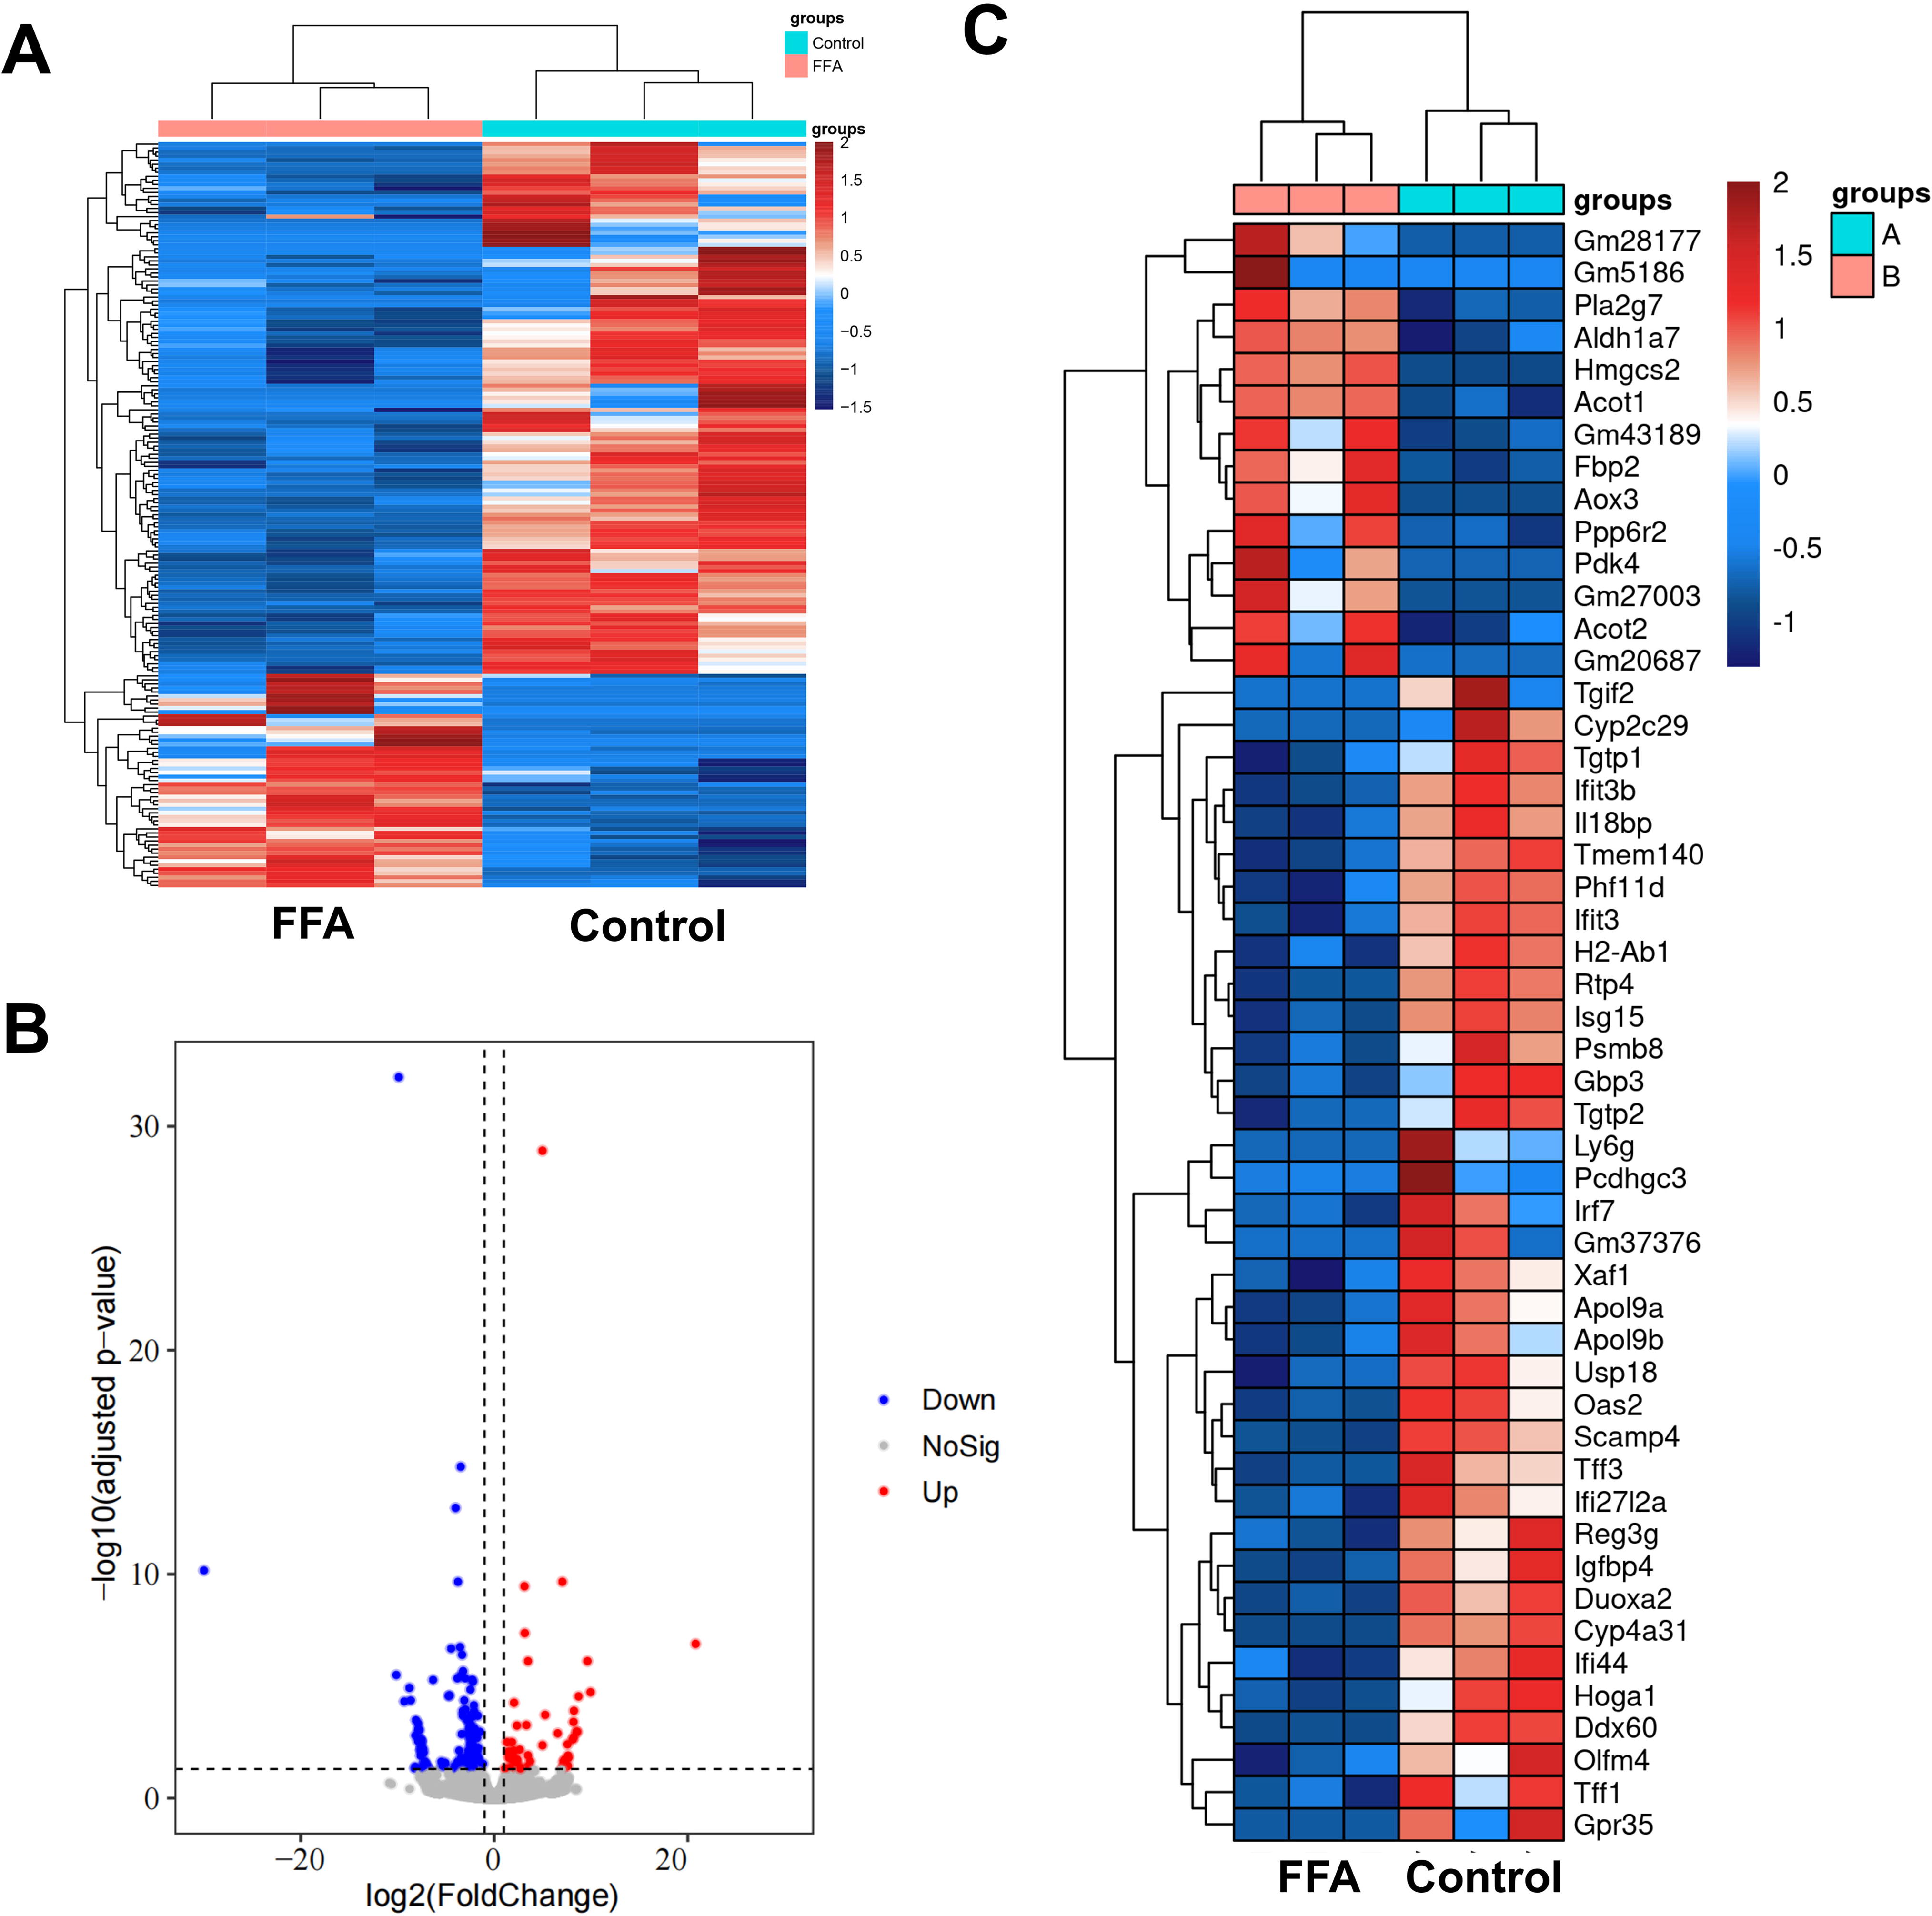
Differentially expressed genes (DEGs) in liver organoids after FFA induction.
Functional analysis of GO and KEGG of DEGs
The GO results showed that, in terms of biological processes, the DEGs were mainly focused on cellular processes, response to stimulus, and biological regulation. The molecular functions were related to binding, catalytic activity, and molecular function regulation. The cellular components were mainly composed of cellular anatomical entities, intracellular and protein-containing complexes, and so on (Fig. 4A). KEGG results showed that the first 20 DEGs were mainly enriched in signaling pathways such as Herpes simplex virus 1 and Epstein–Barr virus infection, NOD-like receptors (NLRs) signaling pathway, and influenza A (Fig. 4B). Furthermore, in line with the literature, 26 we found that the NLR signaling pathway is involved in the regulation of NAFLD. Among them, NLR family apoptosis inhibitory protein (NAIP), interferon regulatory factor (IRF) 3, and IRF7 were the DEGs differentially expressed on this pathway (Fig. 4C).
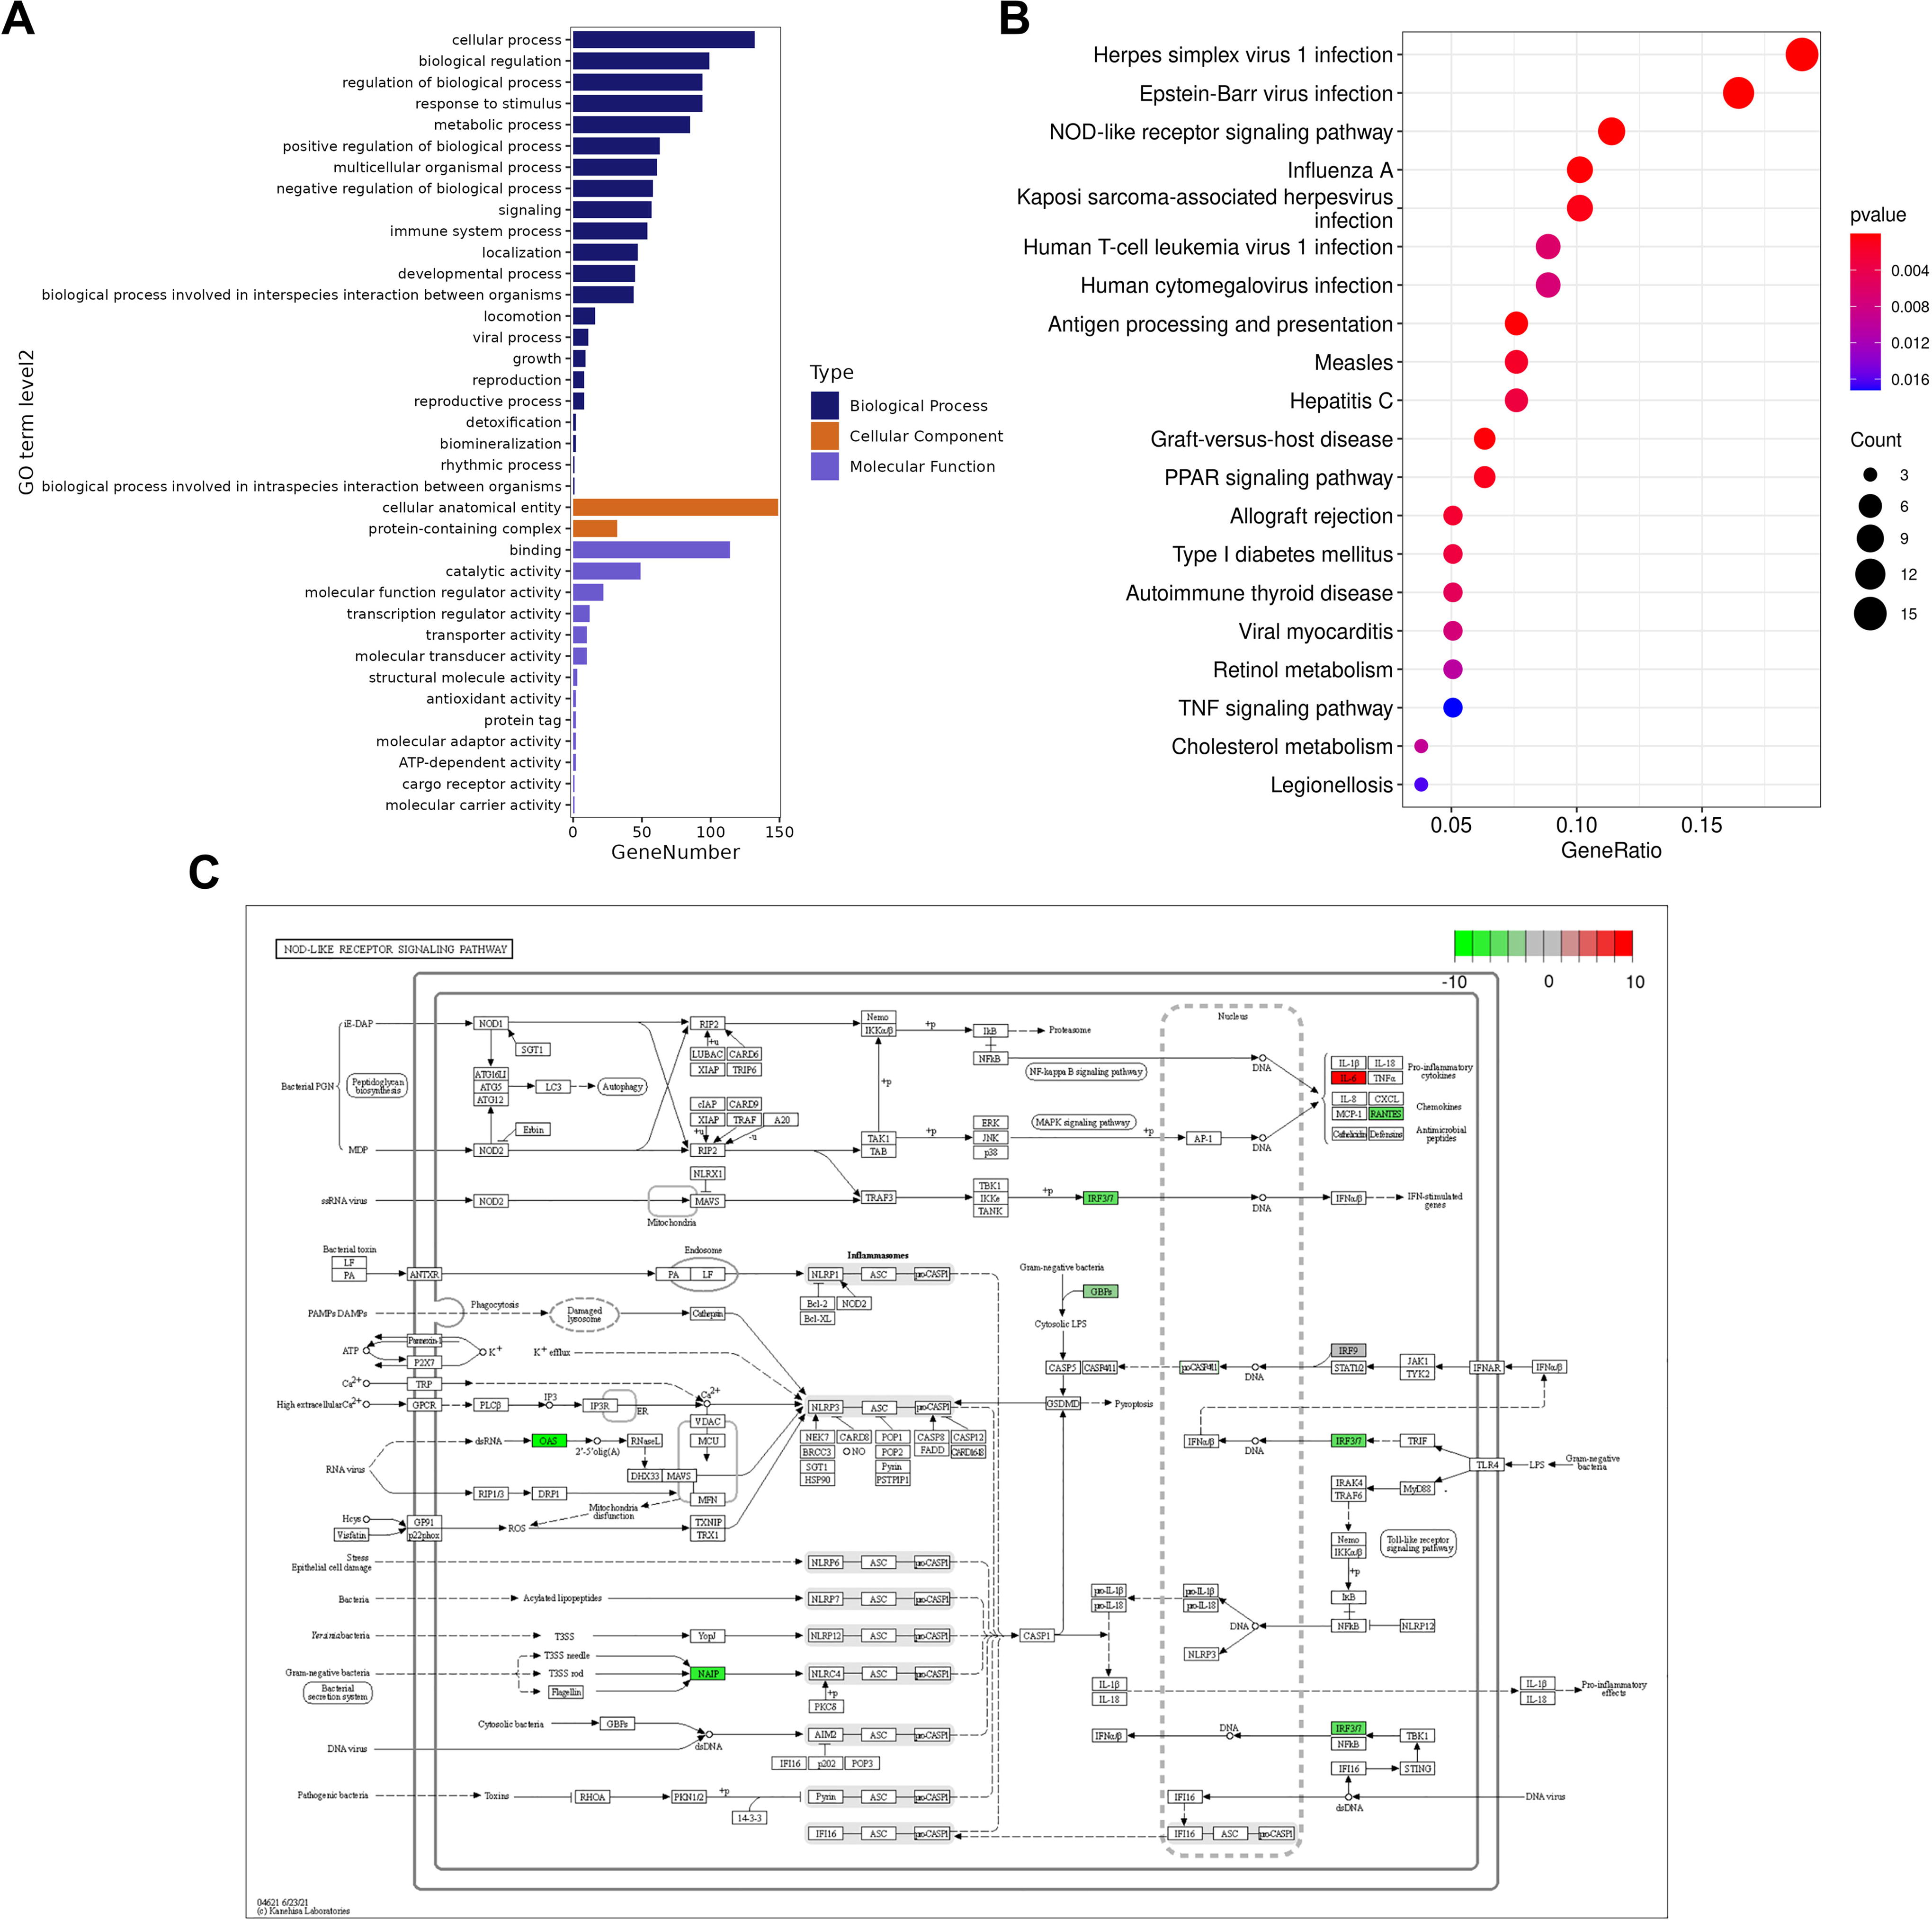
GO and KEGG enrichment pathway analyses of the top 20 DEGs.
NLR signaling pathway and PPAR pathway are involved in the NAFLD process based on the NAFLD organoids model
After treatment with 50-μM NOD pathway inhibitor JC2-11 and 10 μM PPAR agonist lanifibranor, we treated the liver organoids with FFA for 24 h to induce the NAFLD model. We found that JC2-11 and lanifibranor moderated the FFA-induced increase in lipid droplets (Fig. 5A). The detection of liver function indicators showed that JC2-11 and lanifibranor alleviated FFA-induced liver injury, with lower ALT, AST, and TBIL levels in the FFA+JC2-11 and FFA+lanifibranor groups than in the FFA group (Fig. 5B). Biochemical detection showed that JC2-11 and lanifibranor mitigated FFA-induced increases in TG levels (Fig. 5C). In addition, the levels of inflammatory cytokines IL-6 and TNF-α were lower in the FFA+JC2-11 and FFA+lanifibranor groups than in the FFA group, suggesting that JC2-11 and lanifibranor reduced FFA-induced inflammation (Fig. 5D). Furthermore, COL1A1 and LAMA1 expression was lower in the FFA+JC2-11 and FFA+lanifibranor groups than in the FFA group, suggesting that JC2-11 and lanifibranor alleviated FFA-induced liver fibrosis (Fig. 5E). The increase in NO could also be reduced by lanifibranor or JC2-11 in FFA-induced liver fibrosis (Fig. 5F).
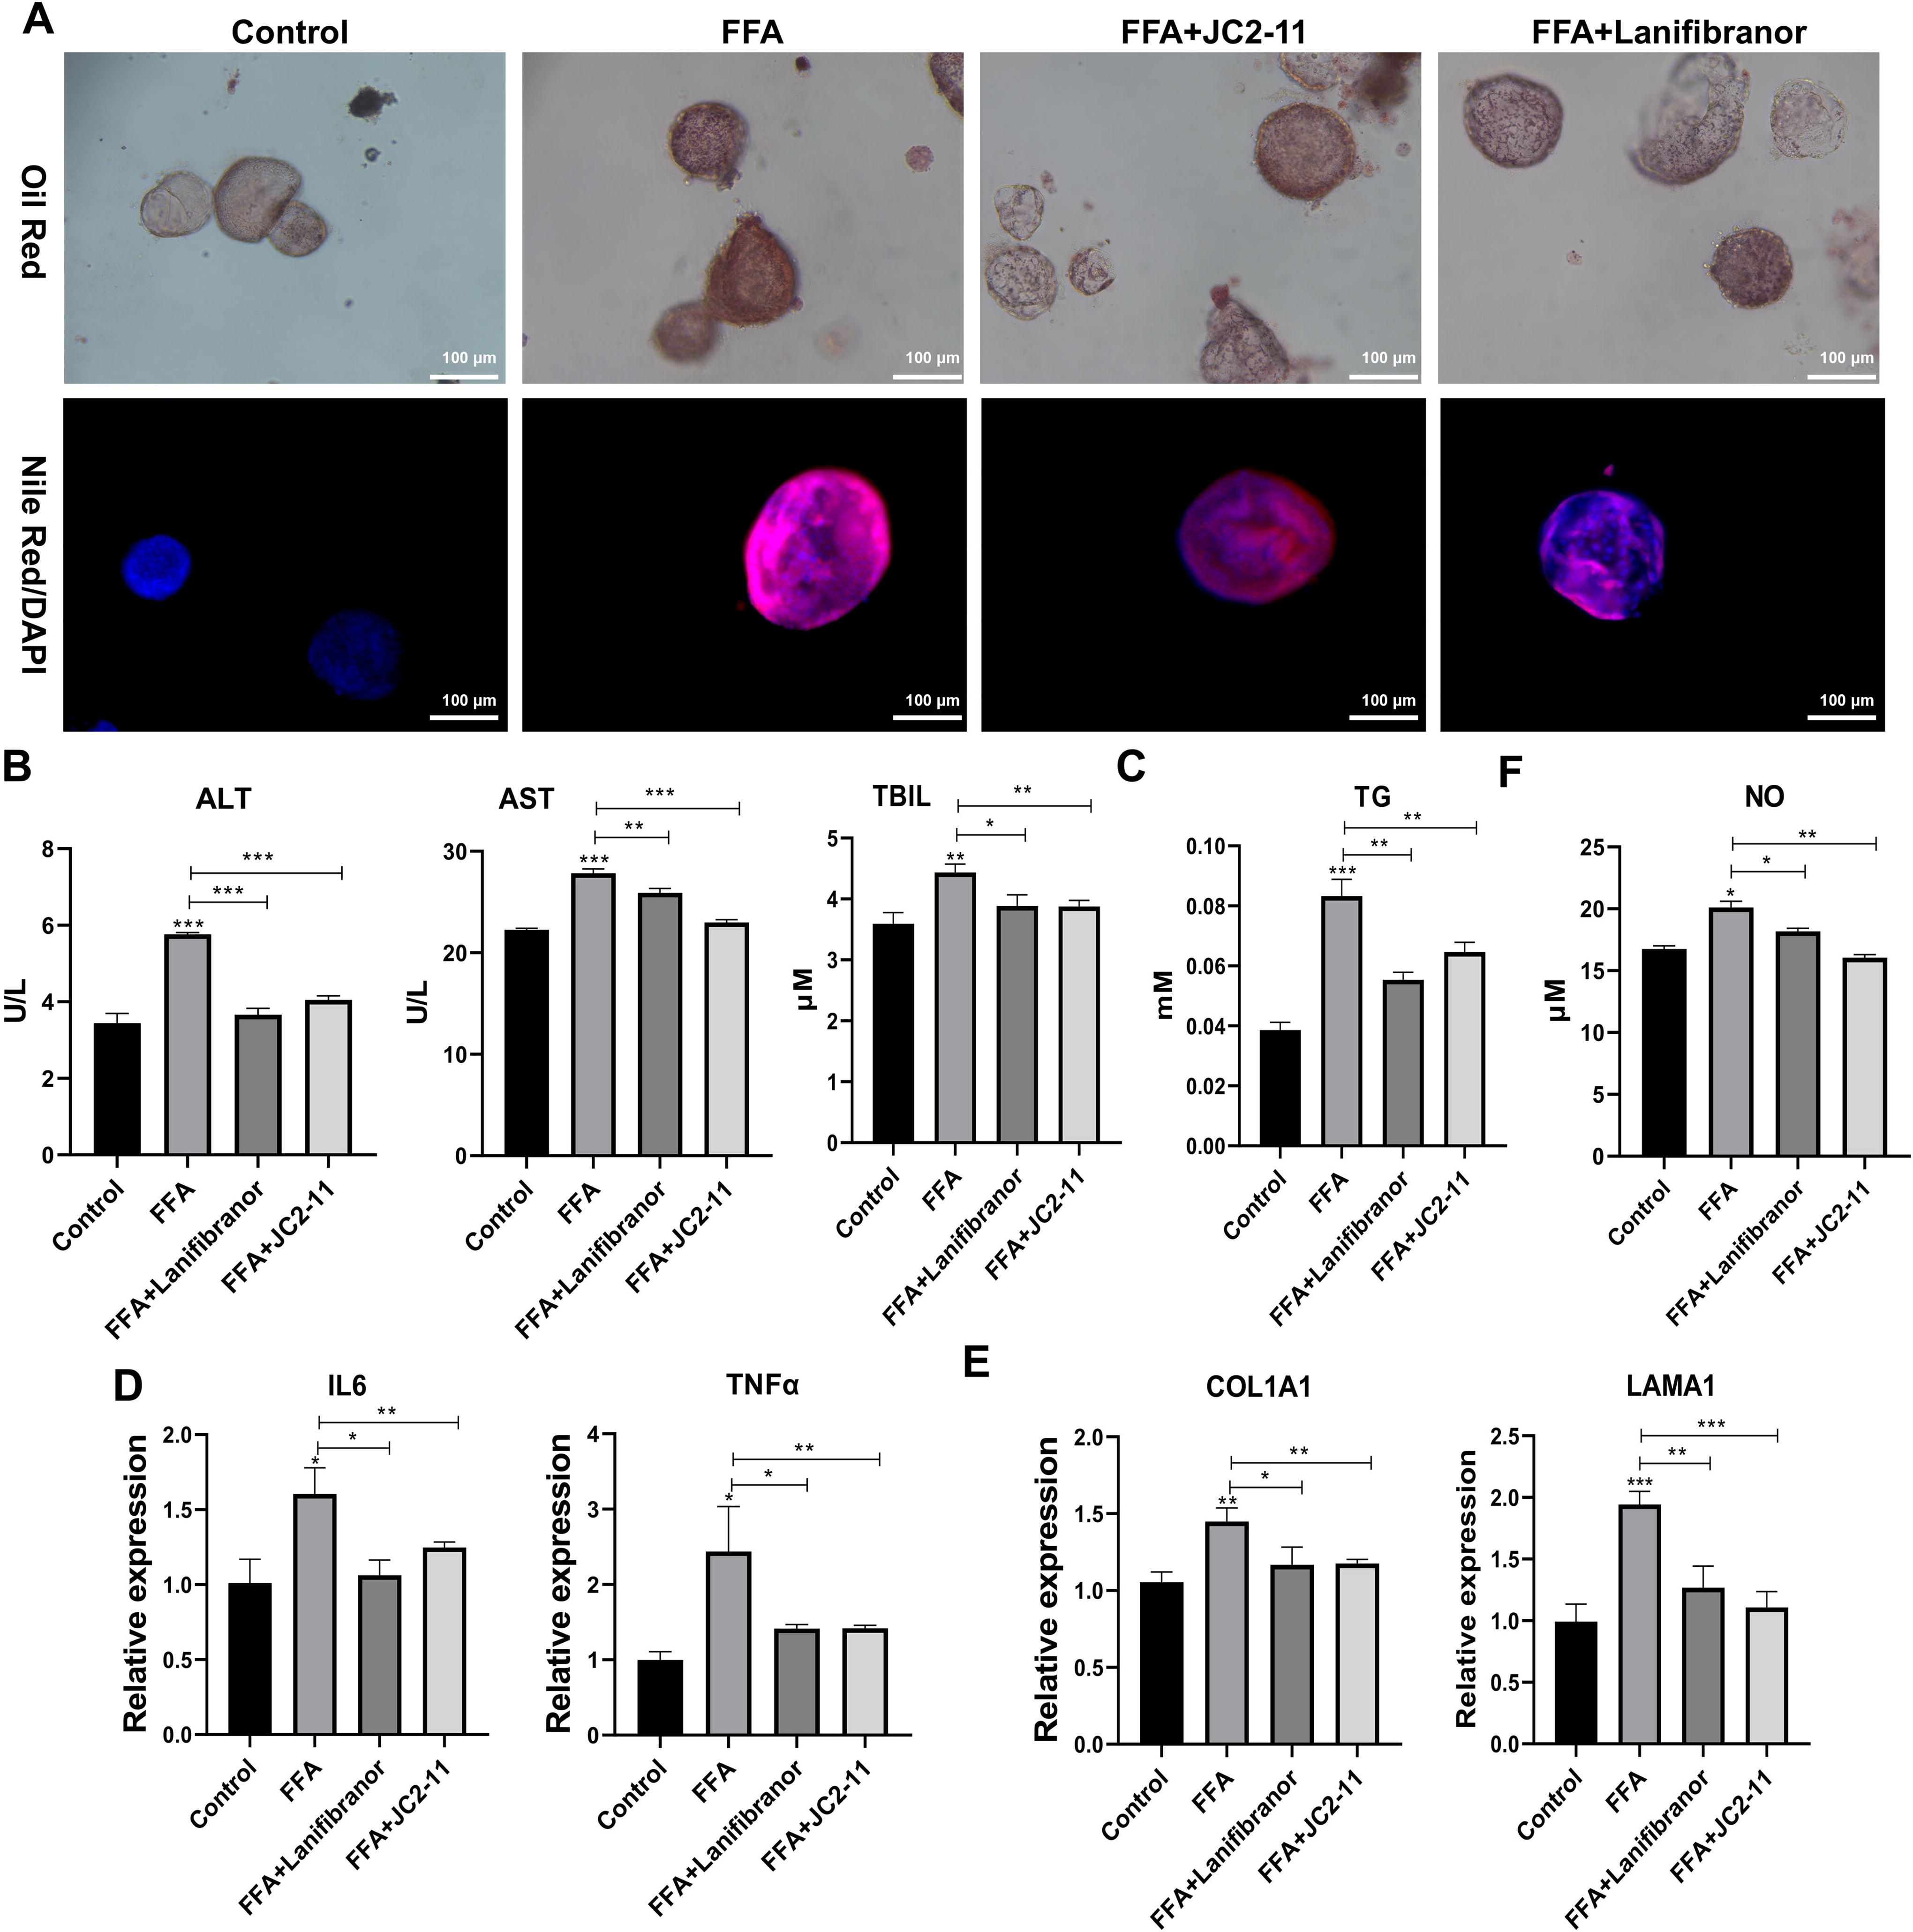
nucleotide oligomerization domain-like receptor (NLR) signaling pathway and peroxisome proliferator-activated receptor (PPAR) pathway were involved in the nonalcoholic fatty liver disease (NAFLD) process based on the NAFLD organoids model. After treatment with 50-μM nucleotide oligomerization domain (NOD) pathway inhibitor JC2-11 and 10 μM peroxisome PPAR agonist lanifibranor, liver organoids were treated with free fatty acid (FFA) for 24 h to induce the NAFLD model.
Discussion
In this study, we cultured liver organoids directly from normal mouse liver tissue and successfully induced lipid accumulation and secretion of proinflammatory factors using FFA. Furthermore, we screened the FFA-induced organoids for DEGs (IRF3, IRF7) associated with NAFLD pathogenesis 27 and unreported NAIP genes. Compared with the induction of induced pluripotent stem cells differentiation from multicellular liver organoids, 28 this method is simple and significantly improves the potential of using liver organoids as a model for studies of fatty liver and other liver diseases.
NAFLD affects the health of most adults in many countries, 29 and researchers have developed several in vivo and in vitro models to study it. 5,30 3D culture systems more closely resemble physiological cell composition and behavior, and possess a more stable genome than conventional 2D culture models. 31 The most commonly used 3D culture models are spheroids or 3D cell aggregates. 32,33 It is difficult to maintain a uniform spheroid size with liver spheroids and uneven nutrient and oxygen uptake can occur, eventually leading to cell death. 34 Organoids are new research tools that better mimic natural physiological components. 35 Kruitwagen et al. 15 and Elbadawy et al. 18 successfully cultured liver organoids from feline and NAFLD mouse liver tissues respectively, which exhibited similar characteristics to liver tissue. We successfully cultured liver organoids from normal mouse liver tissue.
Organoids provide an accurate model of human development and disease. 35 A raised FFA level in the liver leads to lipid accumulation in hepatocytes and increased TG accumulation. 36,37 Hepatic lipid accumulation causes morphological and functional disorders of liver structure and function. 38,39 ALT and AST are significantly elevated in the serum of NASH model mice 40 and serum TBIL levels are negatively correlated with the prevalence of NAFLD. 41 Furthermore, Wang et al. 20 showed that after FFA induction of human-induced pluripotent stem cell-derived liver-like organelles, lipid droplets and TG accumulation were observed in liver-like organs. As one of the largest intrinsic immune organs in the body, the liver plays a crucial role in the innate immune system. 42 It has several mechanisms for recognizing and removing pathogens and dealing with inflammatory responses. 43 In NAFLD, cytokines and chemical mediators, such as TNF-α, IL-1β, and IL-6, are involved in the inflammation. 44 These factors can activate the inflammatory response leading to hepatocellular damage and infiltration of inflammatory cells. 44 A study proved that increased IL-6 and TNF-α concentrations are associated with an increased NAFLD risk. 44 In the liver, TNF-α induces many biological responses, such as hepatocyte apoptosis and necrosis. 45 Ceccarelli et al. reported the proinflammatory and profibrotic mode of NAFLD mediated by lipopolysaccharide-induced TNF-α. 46 NO is a nitrogen-containing gas produced by endothelial cells that have anti-inflammatory effects. 47 NO synthesis and signaling may be disturbed in NAFLD. 48 Studies have shown that patients with NAFLD have reduced intrahepatic NO levels, 49,50 which may be associated with the development of hepatic inflammation and fibrosis. Therefore, IL-6, TNF-α, and NO are important inflammatory indicators in the progression of NAFLD. Prolonged inflammation can cause hepatic fibrosis, which is an accumulation of scar tissue in the liver that may lead to cirrhosis. 51 Hepatic fibrosis is an important process of chronic liver disease and is associated with a poor prognosis. 52 COL1A1 and LAMA1 are key molecules involved in the process. 53 COL1A1 is the most abundant protein in the liver extracellular matrix (ECM) and its excessive deposition is one of the main features of liver fibrosis. 54 LAMA1, an ECM protein, is primarily a constituent of the extracellular basement membrane. 55
Dysfunction of metabolic pathways is an important pathogenic factor. 56,57 Transcriptome analysis of liver organoids is comparable to that of primary hepatocytes and tissues. 58 In this study, we performed transcriptome sequencing of mouse liver organoids before and after FFA induction. KEGG pathway analysis revealed that DEGs are mainly enriched during virus infection and NLRs signaling pathways. Injuries activate innate immunity, induce chronic inflammation in the liver, and promote steatosis and NAFLD progression to NASH. 26 FFA activates NLR family pyrin domain containing 3 (NLRP3) inflammatory vesicles, accompanied by increased levels of the proinflammatory factors IL-1β and IL-18. 59 Furthermore, our study found that NAIP, IRF3, and IRF7 in the NLR signaling pathway were differentially expressed. IRF3 and IRF7 increase significantly in high-fat, high-fructose diet-induced NAFLD mice. 27 Qiao et al. 60 found that knockdown of IRF3 significantly reduced FFA-induced liver inflammation and apoptosis and alleviated lipid accumulation. Similarly, Wang et al. found that knockdown of IRF7 improved glucose and lipid homeostasis, insulin sensitivity, and hepatic steatosis. 61 Furthermore, although there are no studies in the literature on the NAIP gene in NAFLD, its downstream factor, NLRC4 inflammatory vesicles, was involved in NAFLD hepatocyte injury and inflammation. 62,63 This also suggests that we have not only identified IRF3 and IRF7 genes in FFA-induced organoids consistent with previous reports but also identified unstudied NAIP genes.
Furthermore, JC2-11 and lanifibranor reduced FFA-induced increase in oil-red lipid droplets, liver damage, inflammation, and liver fibrosis. JC2-11 is an antioxidant activity enhancer based on chalcone, which inhibits IL-1β and lactate dehydrogenase secretion. 21 Three subtypes of PPARs control the expression of genes responsible for energy metabolism, cell development, inflammation, and differentiation. 64 Lanifibranor is a leading candidate for NAFLD treatment. 65 Boyer-Diaz et al. reported that lanifibranor could improve portal hypertension and liver fibrosis in experimental advanced chronic liver disease. 66 In this study, our results demonstrated that the NLR signaling pathway and the PPAR pathway are involved in the NAFLD process based on the NAFLD organoids model.
The current study has some limitations. For example, the specific mechanisms of NLR and PPAR pathways in the NAFLD organoid model are not well understood. Furthermore, this study only successfully constructed NAFLD organoids in mice, and further verification is required to determine whether this method will work in other animal models.
Conclusion
We successfully cultured mouse liver organoids with a tissue structure that partially mimics in vivo liver tissue. In addition, liver organoids can be successfully induced to create NAFLD models and can express key genes related to abnormal lipid metabolism and insulin resistance. These NAFLD models can be used for research into clinical liver diseases. Given the complexity of protein pathways, the protein expression and secretion profiles of organoids before and after FFA treatment will need to be further explored in similar studies in the future.
Footnotes
Data Availability Statement
All data generated in the article are shown in the article.
Ethical Statement
This study was approved by the Ethics Committee of the Guangzhou Forevergen Biosciences (ACUC-AEWC-F2207022) and performed according to ARRIVE guidelines.
Author Disclosure Statement
The authors have no conflict of interest to declare.
Funding Information
This work was funded by the Guangdong Medical Science and Technology Research Fund (A2023370) and the Shenzhen Science and Technology Plan Project (JCYJ20230807110911025).