
Abstract
The quality of organoid models can be assessed by single-cell-RNA-sequencing (scRNA-seq) but often only bulk transcriptome data is available. Here we present a pipeline for the analysis of scRNA-seq data and subsequent “deconvolution,” which is a method for estimating cell type fractions in bulk transcriptome data based on expression profiles and cell types found in scRNA-seq data derived from biopsies. We applied this pipeline on bulk iPSC-derived kidney and brain organoid transcriptome data to identify cell types employing two scRNA-seq kidney datasets and one brain dataset. Relevant cells present in kidney (e.g., proximal tubules, distal convoluted tubules, and podocytes) and brain (e.g., neurons, astrocytes, oligodendrocytes, and microglia) with obligatory endothelial and immune-related cells were identified. We anticipate that this pipeline will also enable estimation of cell type fractions in organoids of other tissues.
Introduction
Organoids are three-dimensional (3D) tissue cultures resembling organs. They contain multiple cell types with the ultimate goal to mimic all cell types in the same fractions and organization of the real organ. A plethora of already existing and envisioned applications range from developmental and disease models to regenerative medicine and transplantable organs. An important step needed for assessing the quality of iPSC-derived organoids is to determine the fractions of cell types present. Single-cell RNA-seq (scRNA-seq) techniques can be employed to calculate these cell type fractions in high accuracy. However, as scRNA-seq techniques are very expensive not every lab can afford to use this approach. An accurate estimation of cell type proportions in organoids from bulk transcriptome data therefore would be of great benefit to enable cell type estimations from existing bulk trancriptome data or for projects without the necessary funding for scRNA-seq experiments.
The so-called “deconvolution” methods are based on the idea that in the bulk transcriptome, gene expression profiles are merged, “convolved” by a function which can be determined and reverted with the abundant scRNA-seq information. By application of the reverse- the “deconvolution” function, one can dissect bulk transcriptome data into expression profiles and proportions of the contained cell types. Several “deconvolution” tools have been introduced including CIBERSORTx, 1 MuSiC, 2 BisqueRNA, 3 BayesPrism, 4 and InstaPrism. 5 While in terms of accuracy BayesPrism, 4 out-performs the other approaches, InstaPrism, 5 re-implements BayesPrism in a more memory- and runtime-efficient fashion. For the analysis of scRNA-seq data the R package Seurat, 6 provides a sophisticated workflow with implementations of all required methods. Seurat can identify clusters of similar cells in scRNA-seq data and identify markers characteristic of these cell clusters. Cell types can be associated with clusters via these markers. While clusters can be annotated manually with cell-types based on a priori known canonical markers, the R package scMayoMap, 7 offers a semi-automated approach for cell-type-cluster association based on a huge database of cell-type-specific expression profiles.
Deconvolution tools have been applied for the estimation of cell types in tumors, 4,8 or in tissue biopsies, 9 or other biological samples. 10 However, studies investigating cell type deconvolution in organoids are scarce. To the best of our knowledge, there is a study using deconvolution via CIBERSORTx in colon cancer organoids, 11 and the tool VoxHunt using deconvolution for prediction of organoid brain regions based on the Allen Brain Atlas which although very useful is restricted to these brain datasets. 12
Here, we introduce a pipeline using scRNA-seq datasets of various tissues for deconvolution of bulk organoid transcriptome, working for both microarray and bulk RNA-seq data. We demonstrate its performance with use cases of bulk transcriptome data from kidney, 13 and brain organoids, 14,15 employing publicly available (NCBI GEO) scRNA-seq kidney datasets GSE241302 and GSE202109 associated with studies by Shi et al. 16 and McEvoy et al. 17 and brain datasets GSE104276 associated with the study by Zhong et al. 18
Materials and Methods
Sample collection of kidney and brain scRNA-seq and bulk iPSC-derived kidney and brain organoid transcriptome data
Kidney and brain scRNA-seq datasets used in this study are listed in Supplementary Table S1. For details see Supplementary Data S1.
Cluster analysis of kidney and brain-biopsy scRNA-seq data
Kidney and brain scRNA-seq datasets listed in Supplementary Table S1were processed in the R/Bioconductor environment with the packages Seurat and scMayoMap and the webtool EnrichR. Source code and a working example performed on a modern core-i7 computer with 16GB main memory are provided in the GitHub repository https://github.com/wwruck/scBulk. For details see Supplementary Data S1.
Deconvolution analysis of iPSC-derived kidney and brain organoid bulk RNA-seq data based on scRNA-seq data as reference
Deconvolution was performed in the R/Bioconductor environment with the package InstaPrism. For details see Supplementary Data S1.
Results
A pipeline for the prediction of cell type proportions in bulk transcriptome data via scRNA-seq data
Figure 1 shows the pipeline for the deconvolution of bulk transcriptome data to single cell types using scRNA-seq data. ScRNA-seq data are analyzed via the R package Seurat. 6 Clusters of distinct cell types are found by the Seurat routine FindClusters requiring appropriate adjustment of the resolution parameter to detect all required cell types. Marker genes are identified by the routine FindAllMarkers. Cell types are assigned to the single-cell clusters using the predictions from the scMayoMap package. 7 Predictions are checked and curated manually, e.g., for missing cell type annotations employing the cell type enrichment analysis from the EnrichR webtool. 19 Bulk transcriptome data and scRNA-seq data are merged using a reduced geneset of several thousand markers found via Seurat which can further be optimized via ANOVA. Besides RNA-seq data, the workflow also allows microarray data as input. scRNA-seq and microarray data are brought to the same level with the ComBat batch effect removal method from the R package sva. 20 Resulting data are normalized with quantile normalization, 21 for RNA-seq data the ComBat and quantile normalization steps are not necessary. The resulting data are used as input to the R package InstaPrism to predict proportions of cell types prevalent in the bulk data. InstaPrism is a fast implementation of BayesPrism which employs a Bayesian approach to estimate gene expression in single cell types based on the sc- and bulk-RNA-seq data.
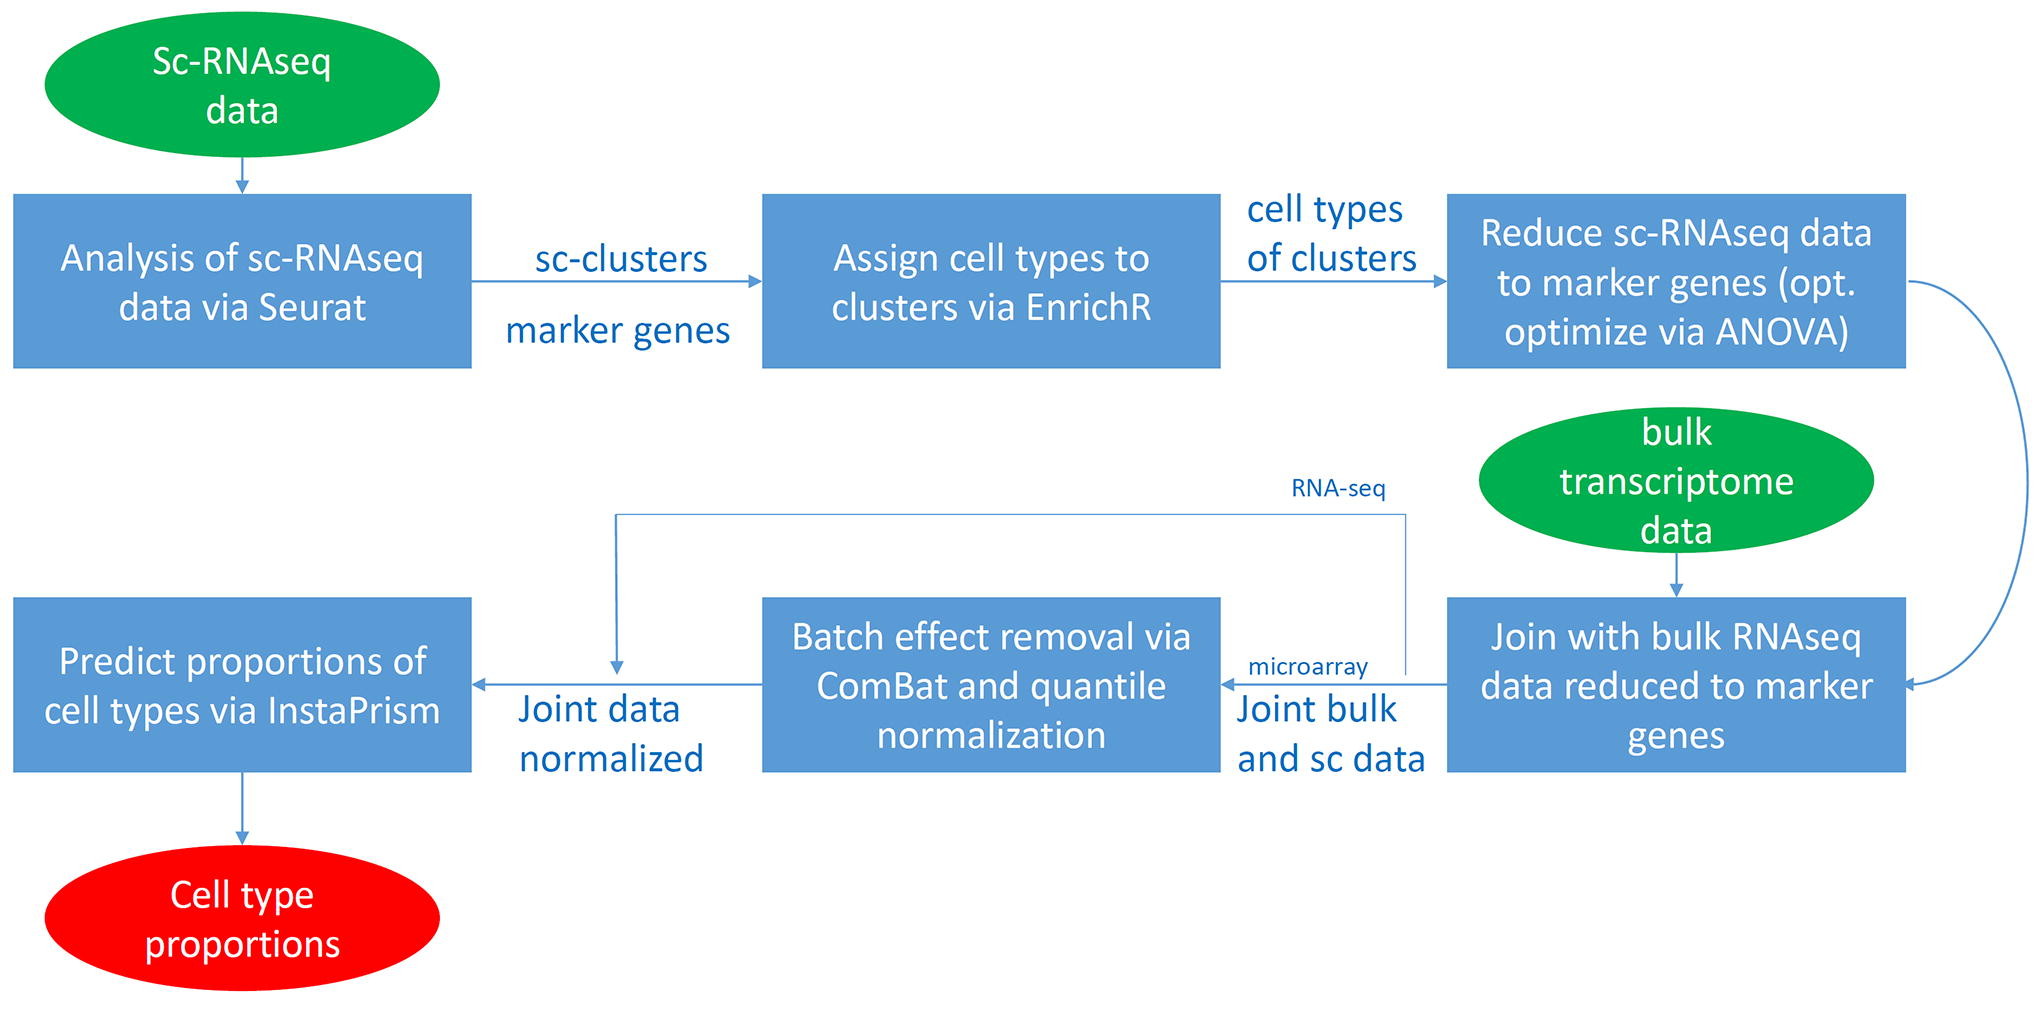
Bulk transcriptome data can be deconvoluted to single cell types using single-cell sequencing data as reference. ScRNA-seq data are analyzed via the R package Seurat to identify single-cell clusters and marker genes. Cell types are assigned to the single-cell clusters by cell type enrichment analysis with the scMayoMap package, 7 and the EnrichR, 19 webtool. The scRNA-seq data is reduced to the several thousand marker genes found by Seurat. Bulk transcriptome data from RNA-seq or microarray experiments are joined with the scRNA-seq data. Batch effects are removed with the ComBat method from the R package sva and data are normalized with quantile normalization. Proportions of cell types prevalent in the bulk data are predicted via the R package InstaPrism which is a fast implementation of BayesPrism. The R package uses a Bayesian approach to estimate gene expression in single cell types based on the sc- and bulk-RNA-seq data. ScRNA-seq, single-cell-RNA-sequencing.
Cluster analysis of scRNA-seq data and cell-type assignment
The granularity of clusters resulting from the scRNA-seq analysis depends on fine-tuning of parameters such as the resolution in the Seurat software. If the resolution is too small, cell types with lower abundance such as podocytes may not be identified. We set the resolution to 0.8 to find the clusters displayed in Figure 2A including podocytes. A disadvantage of a too high resolution is that cell types may be spread over several clusters-such as the proximal tubules (PT) in this case-which on the other hand may reflect subtypes. However, podocytes are detected only with a high resolution. Cell types are assigned to the clusters found by Seurat using a comprehensive collection of scRNA-seq and RNA-seq datasets provided by the R package scMayoBase. This revealed distinct kidney cell types including podocytes, PTs, DCTs, and also immune-system-related cells (Fig. 2B). Clusters 13 and 24 yielded no result in scMayoBase and were annotated via the EnrichR webtool (using ARCHS4 tissues datasets) as dendritic cells (Supplementary Table S2, EnrichR annotations). Fractions are calculated by summing up cell types associated with single cells (Table 1). PT is the most abundant cell type with 42%, followed by loop of henle (LOH) thin descending limb (LOH_thin) 13%, intercalated cells 9%, LOH thick ascending limb (LOH_TAL) 8%, endothelial cells 5%, B-cells 4%, T-cells, dendritic cells, and fibroblasts each 3%, principal cells and macrophages each 2%, natural killer (NK) cells 1.5%, distal convoluted tubule (DCT) cells 1.3%, neutrophils 1.2%, erythroid precursor cells 0.8%, and podocytes 0.2%.
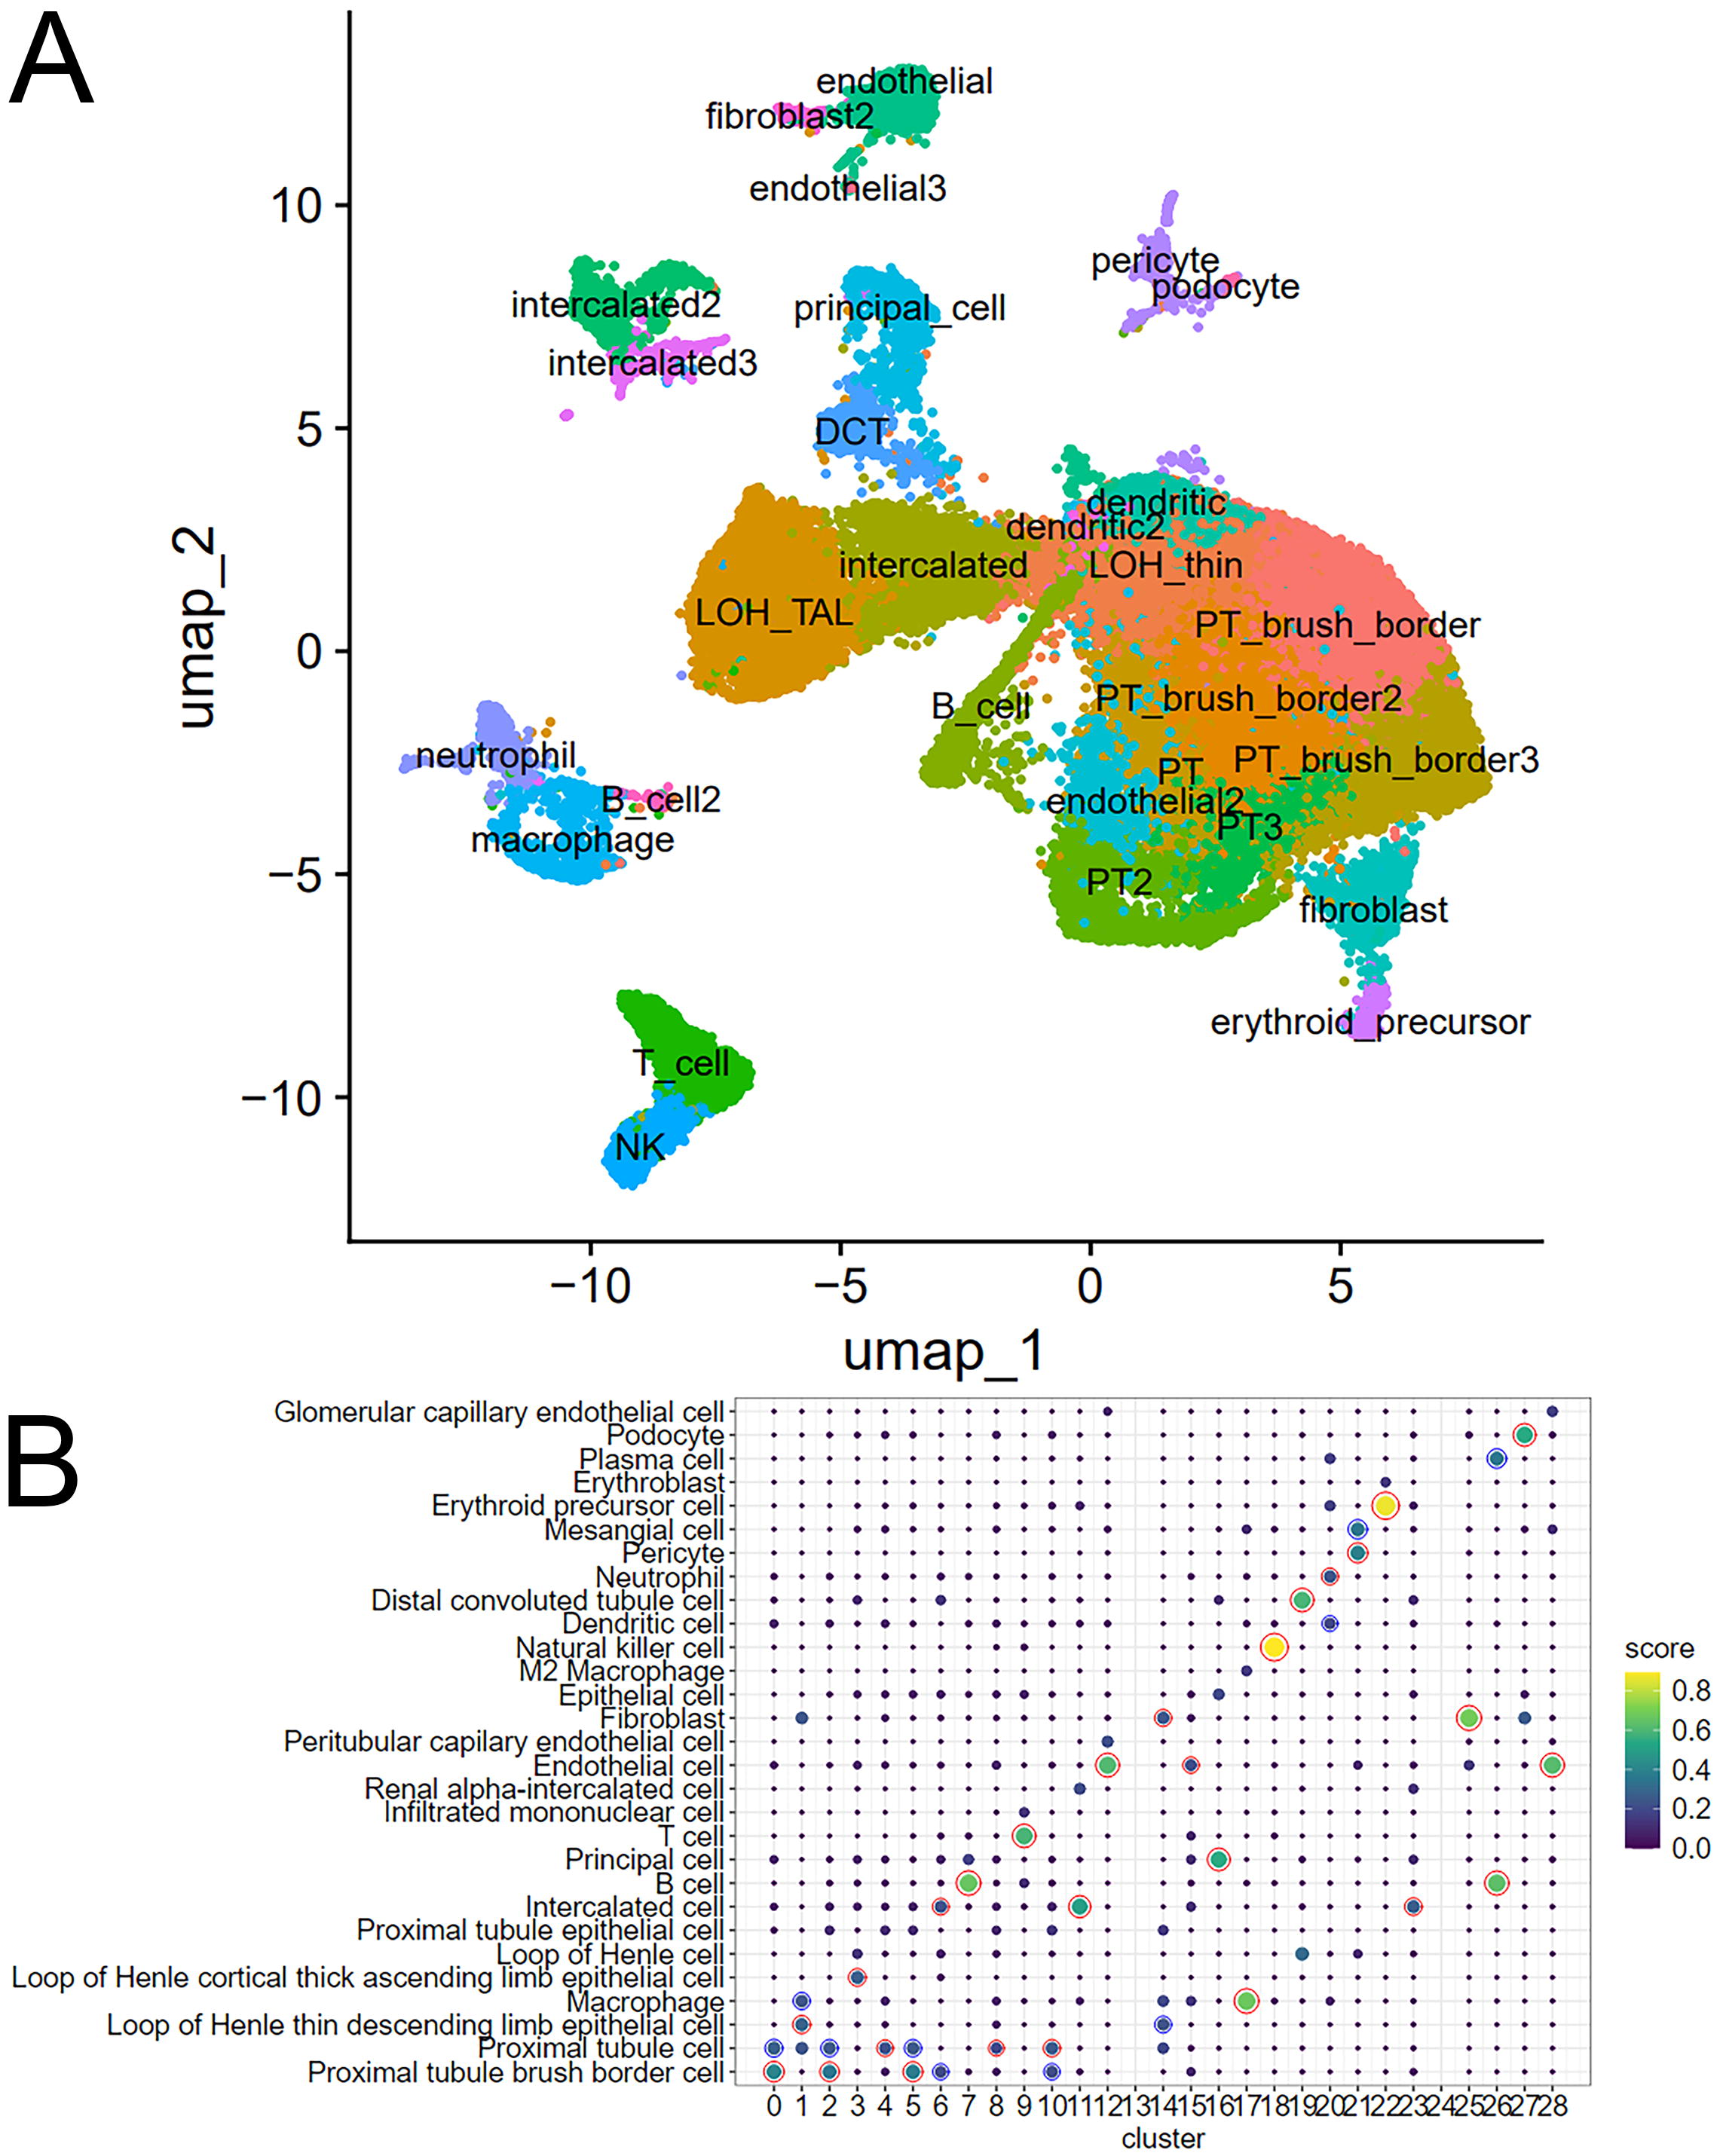
Distinct kidney and immune cell types are identified via cluster analysis and assignment via scMayoMap.
Fractions of Celltypes in scRNA-Seq Kidney Dataset GSE241302
PT, proximal tubule; DCT, distal convoluted tubule; LOH, loop of henle; NK, natural-killer-cells; ScRNA-seq, single-cell-RNA-sequencing.
Markers of distinct kidney and immune cell types are expressed in iPSC-derived kidney organoids
A result of the Seurat analysis is a table of markers of the identified clusters (Supplementary Table S3). We used the 50 most significant markers (by Seurat P value) for relevant kidney and immune-related cell types to assess their expression in the kidney organoids from our previous publication- Nguyen et al. 13 The expression of the marker genes in kidney organoids with and without PAN treatment is shown in proximal tubule cells including marker genes CUBN and LRP2 (Fig. 3A), (Fig. 3B) LOH cells including marker gene UMOD, (Fig. 3C) DCT cells including marker gene SLC12A3, (Fig. 3D) podocytes including marker genes NPHS2 and PODXL, (Fig. 3E) T-cells including marker gene CD3D, (Fig. 3F) endothelial cells including marker genes PECAM1 (CD31), EMCN, and FLT1, (Fig. 3G) macrophages including marker genes CD68 and CCL3, (Fig. 3H) pericytes including marker gene PDGFRB.
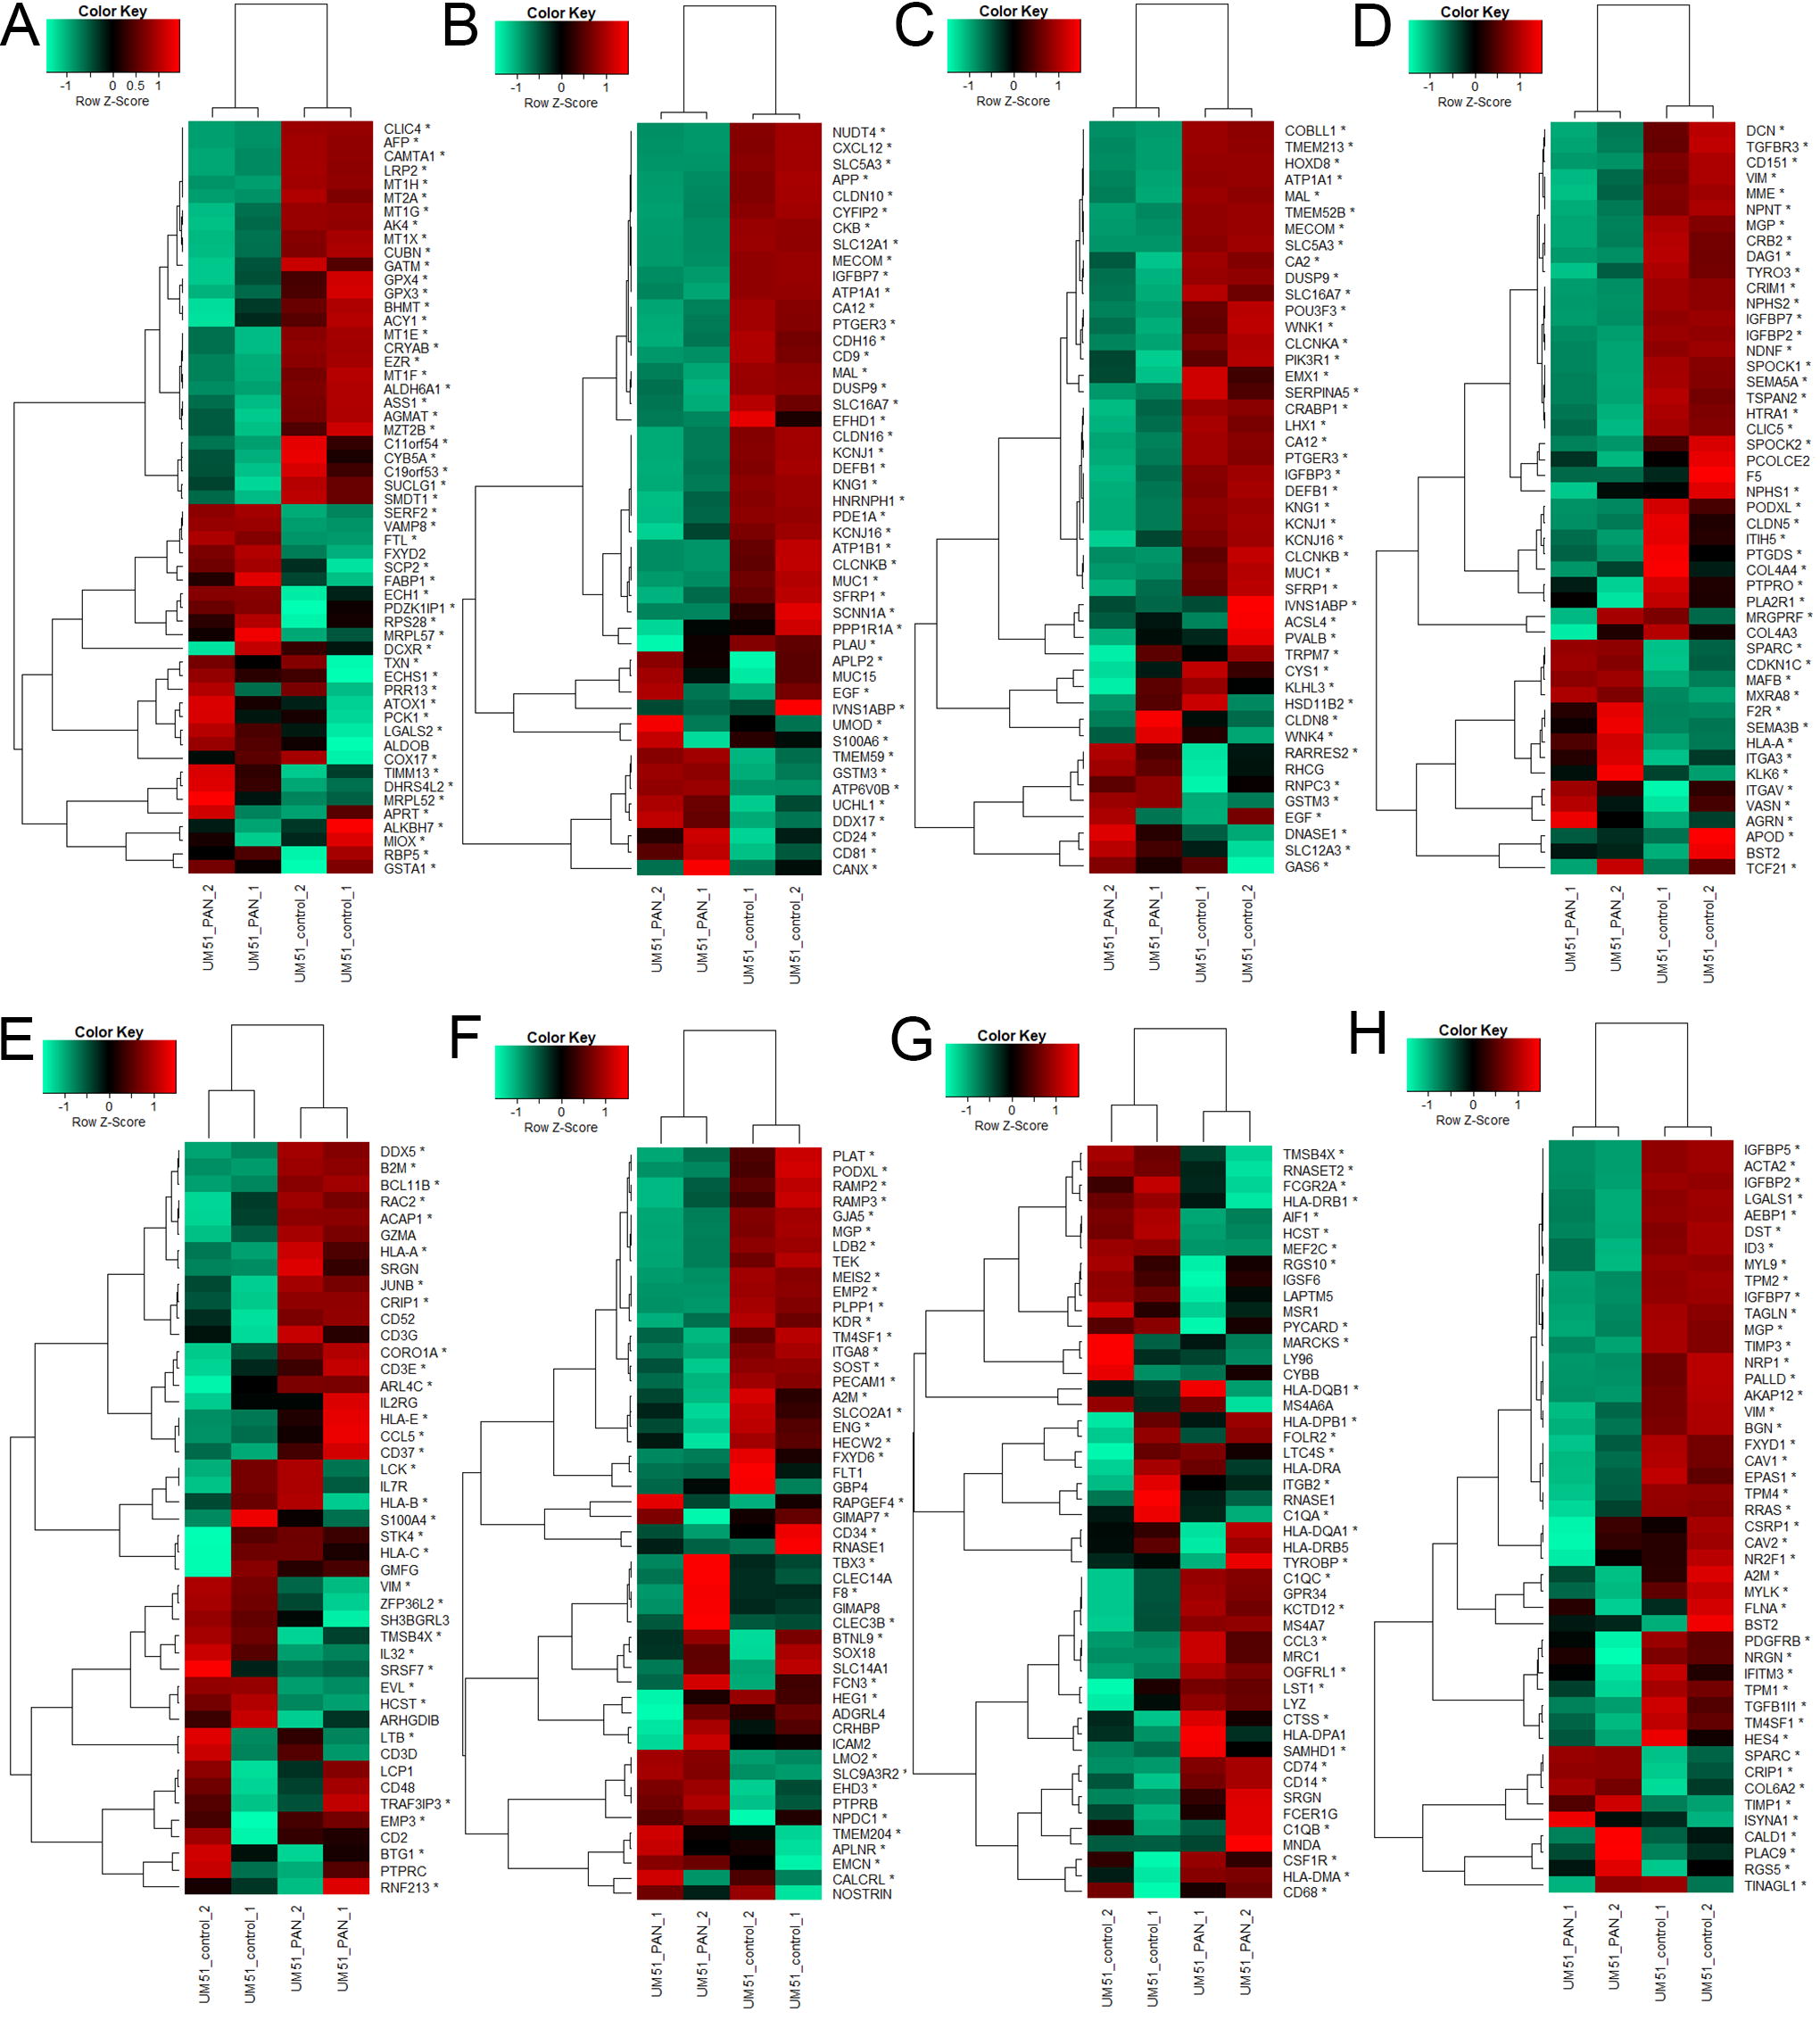
Markers of distinct kidney, endothelial, pericyte, and immune cell types are expressed in iPSC-derived kidney organoids. The heatmaps show the expression in kidney organoids (with and without PAN treatment and iPSCs cultured as spheroids) of the 50 most significant (by Seurat marker P value) marker genes for each cell type.
Deconvolution of bulk kidney organoid RNA-seq data
We set out to investigate cell types in bulk microarray transcriptome of kidney organoids from our previous publication- Nguyen et al. 13 using the results of the scRNA-seq kidney data analysis. As illustrated in the pipeline scheme in Figure 1, we applied the InstaPrism deconvolution to the bulk kidney organoid transcriptome data normalized together with the scRNA-seq kidney data from GSE241302. The pie chart in Figure 4A depicts the proportions of cell types identified in the untreated kidney organoids. Most abundant are proximal tubule cells (PT, PT_brush_border, 35%), followed by intercalated cells (11%), dendritic cells (10%), endothelial cells (7%), fibroblasts (6%), Loop of henle thin descending limb (LOH_thin, 5%), loop of henle thick ascending limb (LOH_TAL, 4%), DCT cells (DCT, 4%), erythroid precursor cells (4%), B-cells (3%), pericytes (2%), principal cells (2%), macrophages (1.9%), podocytes (1.7%), T-cells (1.4%) natural killer cells (NK, 1.0%), and neutrophils (1.0%). The most abundant cell types are distributed over multiple sub-clusters potentially reflecting sub-cell-types. In addition, Figure 4B shows the summarized proportions of kidney organoids treated with the nephrotoxin-PAN and the highest difference in proximal tubule cells, possibly reflecting tubular damage by PAN treatment as reported in our previous publication-Nguyen et al.
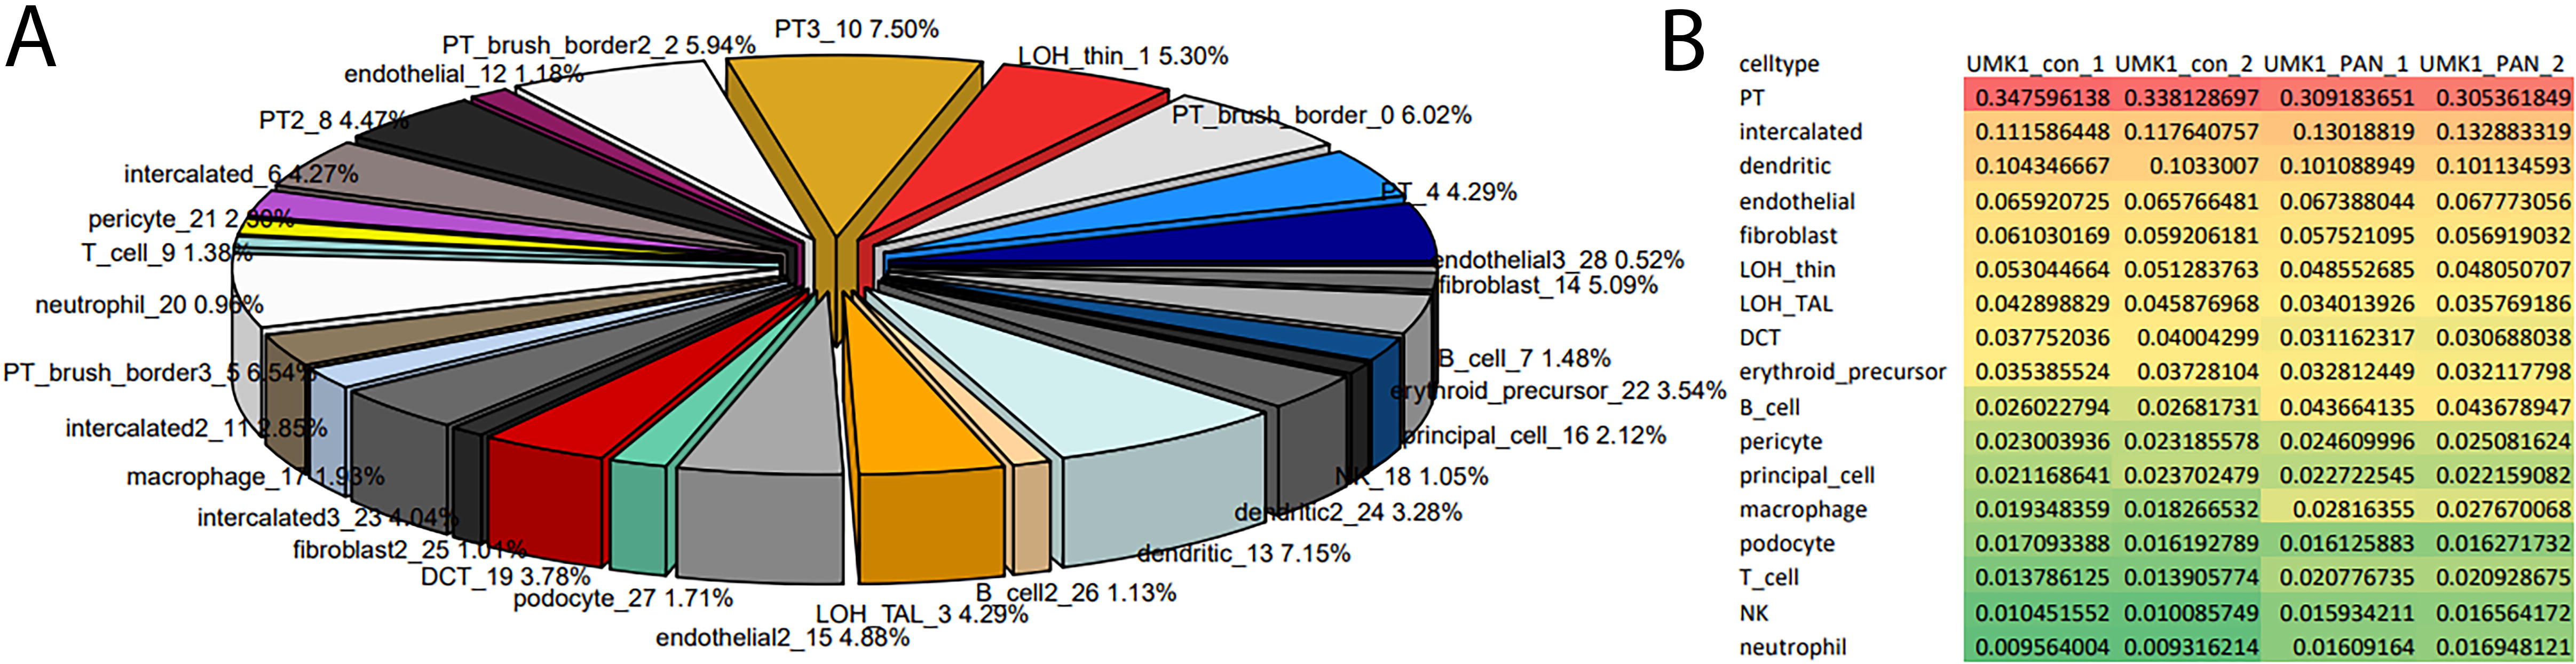
Cell type predictions via InstaPrism using the single-cell dataset GSE241302 for iPSC-derived kidney organoids.
Deconvolution with another scRNA-seq dataset (GSE202109)
We now wanted to investigate the reproducibility of the predicted cell types in bulk microarray transcriptome of our kidney organoids using the scRNA-seq kidney dataset GSE202109. First, we analyzed the scRNA-seq data with Seurat and annotated clusters with scMayoMap. The UMAP (Uniform Manifold Approximation and Projection) plot in Figure 5A and the dot plot in Figure 5B show that essentially all relevant kidney cell types were identified. However, Table 2 shows that there was a very high abundance of 84% proximal tubule cells (PT, PT_brush_broder) while all other cell types were below 5%. This is propagated to the deconvolution and reflected in the pie chart in Figure 5C depicting the proportions of cell types found via InstaPrism deconvolution in our untreated kidney organoids. Most abundant are proximal tubule cells (PT, PT_brush_border, between 66%–67%), and among the other cell-types intercalated 8%, mesangial and DCT each 4%, dendritic 3%, LOH_TAL 2.5%, principal cells 2%, NK cells 1.9%, podocytes 1.8%, pericytes 1.6%, endothelial cells 1.2%, and fibroblasts 1.1%.

Distinct kidney and immune cell types are also found via scRNA-seq dataset GSE202109.
Fractions of Cell types in scRNA-Seq Kidney Dataset GSE202109
PT, proximal tubule; DCT, distal convoluted tubule; LOH, loop of henle; TAL, thick ascending limb; NK, natural-killer-cell; ScRNA-seq, single-cell-RNA-sequencing.
We wanted to check PAN treatment as a confounding factor and calculated the percentage change between two linear models of the cell type predictions vs. the fractions in the single-cell data with and without inclusion of PAN-treatment as factor. The result of zero change between both models indicated that confounding by PAN-treatment is negligible (Supplementary Table S4, chapter “confounding-factors” in working example online at https://github.com/wwruck/scBulk).
Benchmarking with scRNA-seq dataset GSE202109
In order to benchmark the workflow we picked 6000 random samples of the scRNA-seq dataset GSE202109 itself as training set and 3000 random samples as test set for which the cell type was predicted and compared to the Seurat/scMayoMap classification. The accuracy for cell states and cell types in optimization steps from 100 to 1000 most significant markers by ANOVA P value reaches a maximum of 0.96 for cell types and is depicted in Supplementary Figure S1 and Supplementary Table S5 and broken down to cell types in Supplementary Figure S2.
In addition, a RNA-seq dataset of a kidney biopsy was deconvolved with the scRNA-seq dataset GSE202109 and a typical mixture of kidney cell types was found (Supplementary Table S6).
Deconvolution with a development kidney scRNA-seq dataset (GSE102596)
With the goal to explore similarities of the organoids to developmental kidney we deconvolved with the developmental kidney dataset GSE102596 from Lindstroem and colleagues, 22 and found similarities to developmental kidney cell types (Supplementary Fig. S3 and Supplementary Table S7).
Deconvolution of bulk brain organoid data with the developmental PFC scRNA-seq dataset GSE104276
Moreover, we wanted to investigate the prediction of cell types in bulk microarray transcriptome of brain organoids using the scRNA-seq PFC dataset GSE104276. We analyzed the scRNA-seq data with Seurat and annotated clusters with scMayoMap. The UMAP plot in Figure 6A and the dot plot in Figure 6B show the results and detected relevant brain cell types such as neurons, astrocytes, oligodendrocytes, microglia, interneurons, and precursor cells of neurons and oligodendrocytes. We annotated cluster one with interneurons having the highest score and GABAergic neurons the second highest as “GABAergic neurons” to be more specific and also include inhibitory neuron types as other author have found a distribution of 55% excitatory, 35% non-neuron, and 11% inhibitory neurons in mouse PFC. 23 Supplementary Table S8 shows that neurons of distinct types have the highest abundances in our human data while there are also considerable proportions of 5%–6% astrocytes and oligodendrocytes each and 3% microglia. In addition, precursor cells such as oligodendrocyte precursor cells (3%) and neural stem cells (11%) were detected in the scRNA-seq data. The results from InstaPrism-based deconvolution of bulk organoid transcriptome data from our previous publication-Pranty et al. 15 is presented as a pie chart in Figure 6C and depicts the proportions of cell types found in untreated brain organoids, the most abundant are interneurons (15.2%). In another earlier study from our group, we developed a brain organoid model to study the molecular mechanisms associated with Nijmegen-Breakage Syndrome (NBS). 14 Results of the cell type predictions via InstaPrism for the NBS brain organoid model based on the same scRNA-seq dataset GSE104276 are shown in Figure 6E and F. The overall distribution of cell types in both brain organoid models is similar. Most prominent is the difference in microglia which are more abundant in the control UJ samples in the model by Pranty et al. (Fig. 6C, 5.65%) than in the one by Martins et al. (Fig. 6E, 0.51%). However, in the second control (A4) in the brain organoid model by Martins et al. microglia have a similar abundance (Fig. 6F, 6%) as in the model by Pranty et al. pointing at individual differences between organoids derived from distinct iPSC lines.
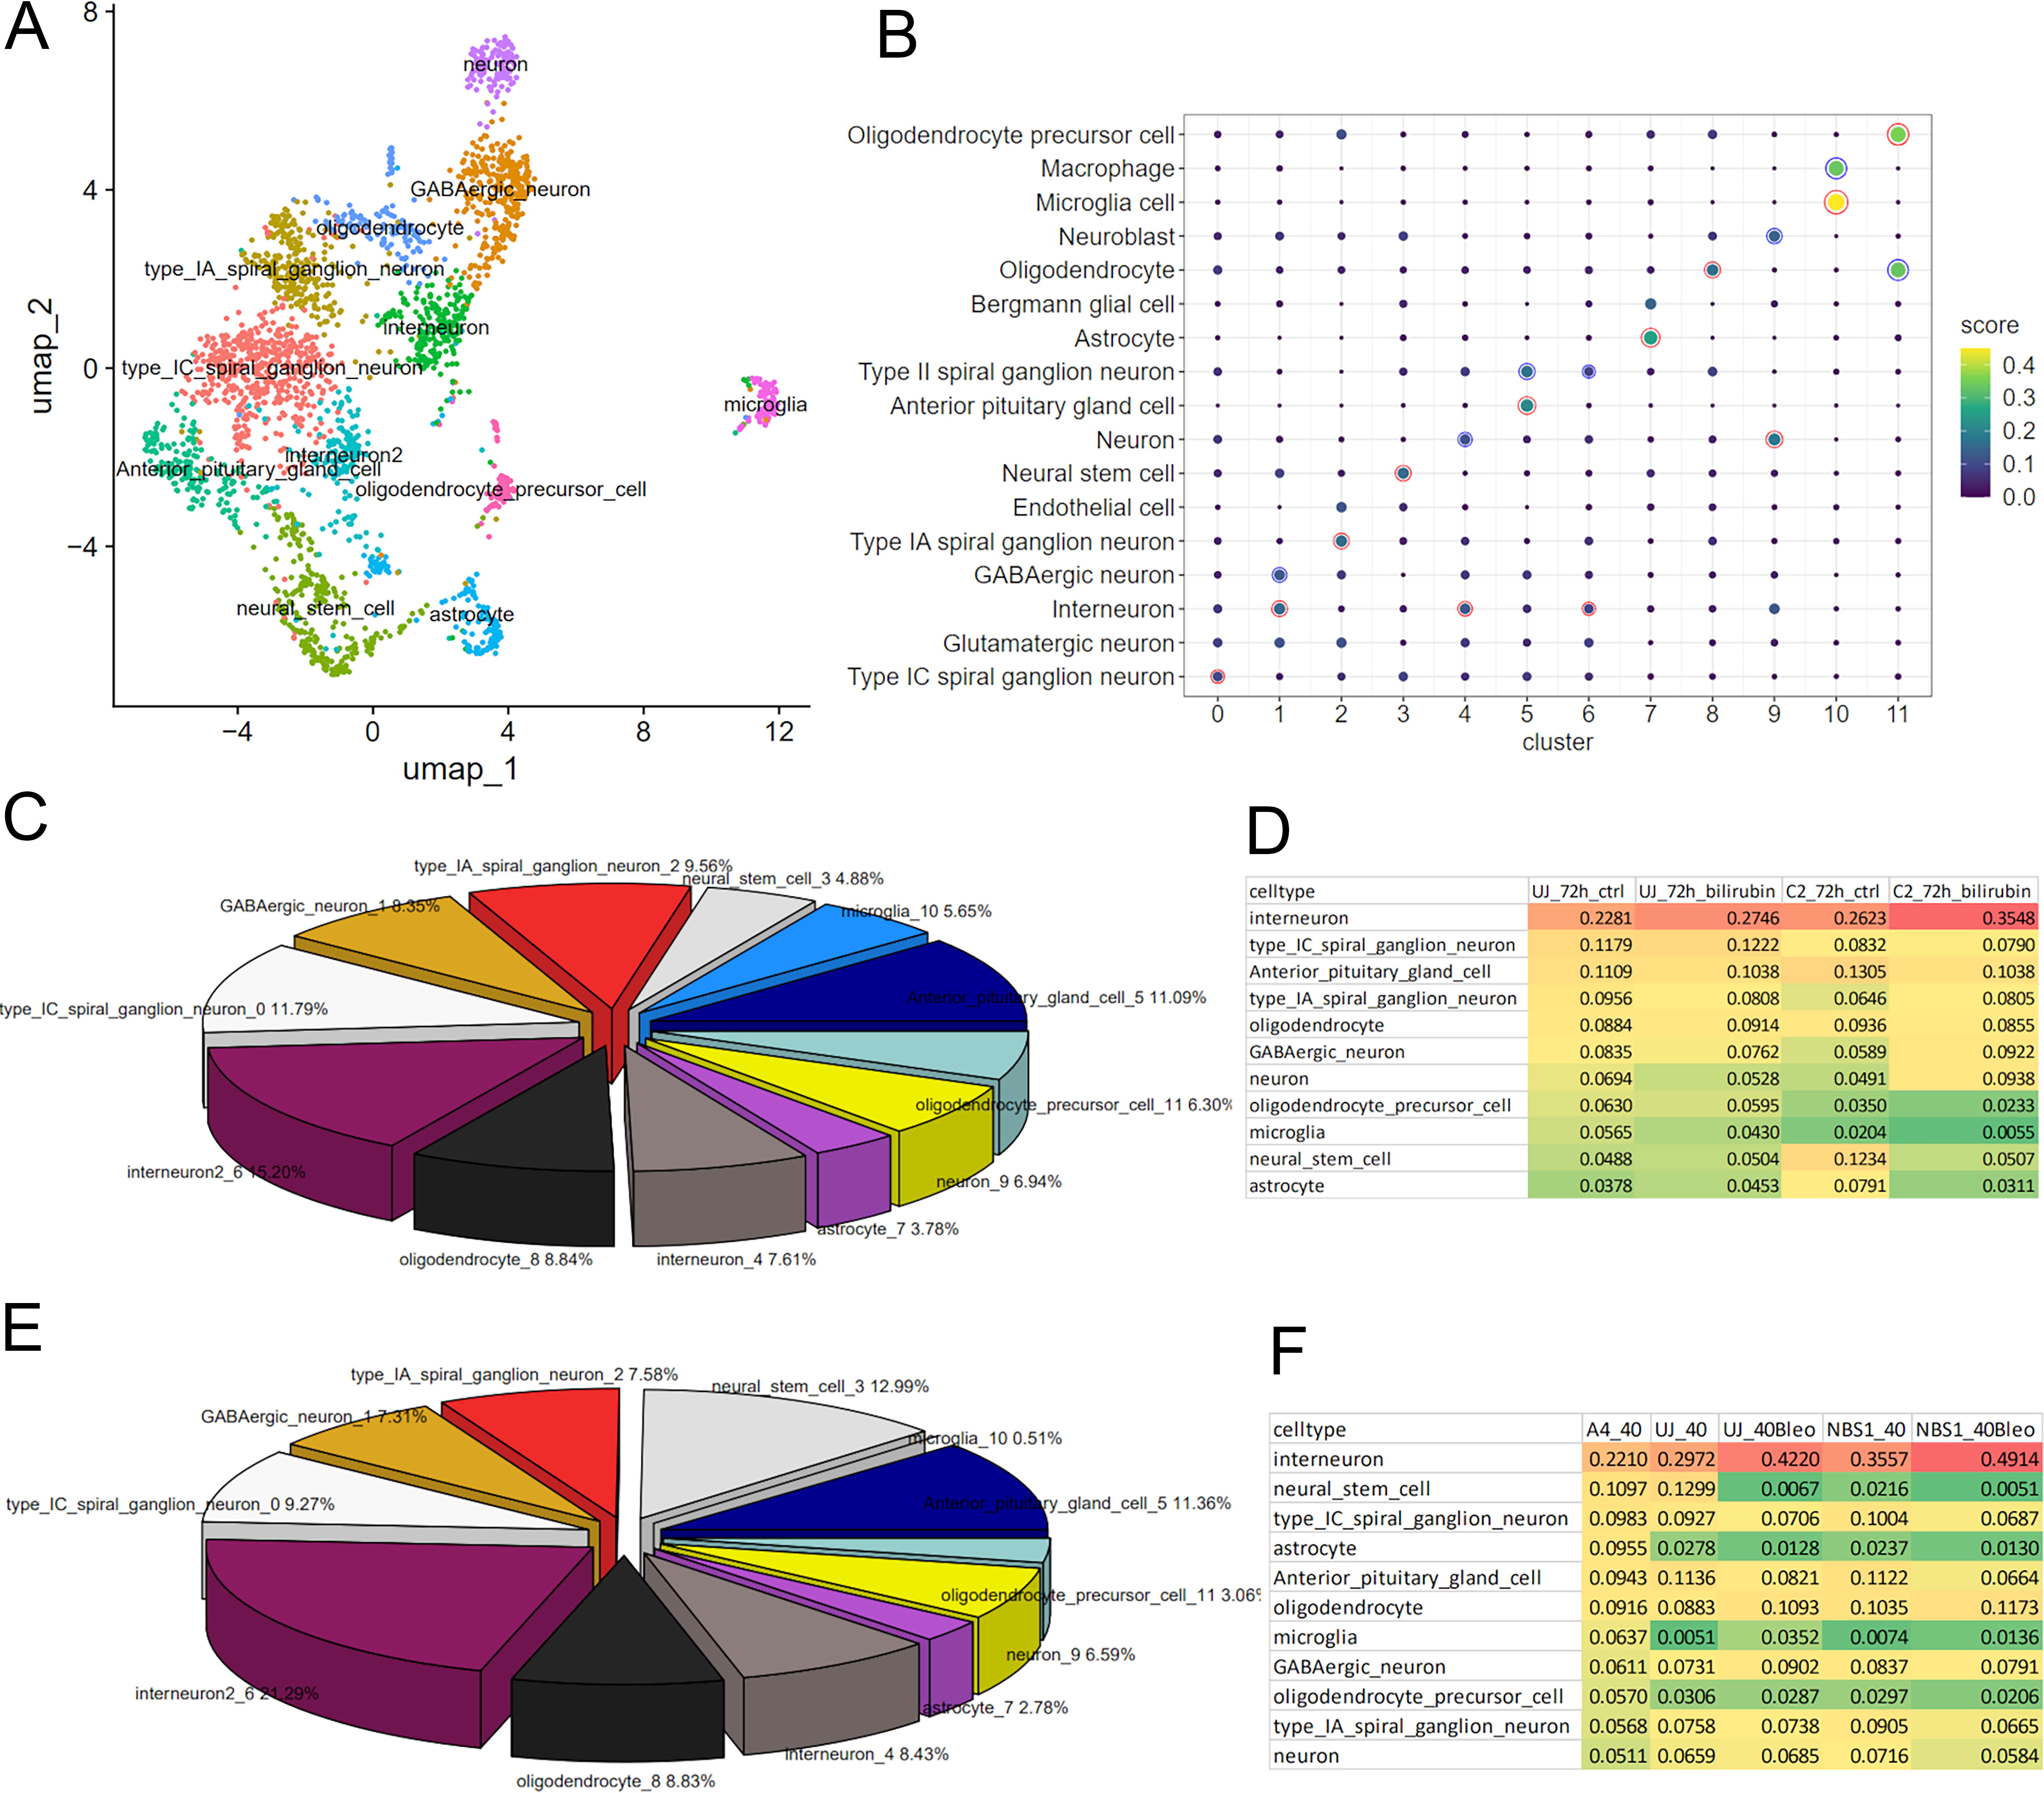
Distinct brain cell types are found in bulk brain organoids via the developmental prefrontal cortex (PFC) scRNA-seq dataset GSE104276.
Discussion
The aim of this study was to analyze the distribution of cell types in bulk transcriptome data of iPSC-derived kidney and brain organoids using the cell-type-specific gene expression profiles provided by biopsy-based kidney and brain scRNA-seq data. For this task we assembled a pipeline including the main processes of cluster analysis of single-cell data, cluster annotation with cell types based on the comprehensive databases of scMayoBase and deconvolution of bulk data via the R package InstaPrism to estimate the cell type distributions. We tested our pipeline with scRNA-seq data from kidney biopsies and developmental brain and bulk transcriptome datasets of kidney and brain organoids. The results of the cluster analysis and annotation of the two kidney single-cell datasets showed that all relevant kidney cell types were identified. However, there were differences in the details and in the distribution of cell types. Most prominent was the difference between about 42% PT (proximal tubule) cells in dataset GSE241302 and about 84% PT cells in dataset GSE202109. This may be due to differences in the sample collection which were biopsies of the idiopathic membranous nephropathy patients and excision of paracancerous tissue (2 cm away from the tumor) of the control patient for dataset GSE241302, 16 and pre-implantation biopsies from living donor kidneys for dataset GSE202109. 17 Furthermore, there were differences in the extraction protocols as described in the associated publications by Shi et al. 16 and McEvoy et al. 17 Another single-cell transcriptomics study by Hinze and colleagues, 24 also identified PT as the most abundant cell type in kidneys of healthy controls and AKI (acute kidney injury) patients but on a level more similar to the 42% PT we found in GSE241302. Thus, we suggest that the proportions of dataset GSE241302 are more representative for an average kidney. A representative dataset for a standard average human kidney will be influenced by several factors such as cortex/medulla, male/female, age, and disease but is of crucial relevance for the estimation of cell types in the bulk organoids. Another source of variation is the annotation which often is performed using one or two known marker genes. However, these are prone to bias and thus we decided to annotate via the scMayoBase tool. The authors of scMayoBase have demonstrated the superior accuracy and performance of their tool compared to other existing annotation methods. 7 By the advancement of the single-cell technologies existing cell type definitions may be extended, new cell types may be identified which often are sub-types of existing cell types. Concerning this, the fine-tuning of the single cell clustering analysis is crucial: a low resolution will deliver few well-defined clusters but may miss important cell types while a high resolution will deliver also rare cell types and many sub-types of large cell populations which may reflect new sub-cell-types but will not always be reproducible. We used the default resolution of 0.8 for kidney which enabled detection of low abundant population of podocytes on the one hand and on the other found several sub-clusters of PT cells which might be merged or further explored for sub-types. For brain, a resolution of 0.5 was sufficient for identifying all relevant cell types in only 11 clusters while in kidney in both datasets there were more than 20 clusters. We propose a strategy to start with the default resolution of 0.8 and-if the rarest existent cell type was found-to keep this setting or even decrease the resolution and otherwise increase the resolution until the rarest cell type is found. Clusters of the same cell type may be merged in Seurat or by assigning multiple clusters/cell states to one celltype in InstaPrism.
Besides all the obvious advantages of scRNA-seq there should be awareness of the disadvantages: a systemic problem is the lower amount of biological material from the single cells which can be further subjected to stress by the isolation procedure and in consequence there are only a few thousand unique transcripts from a single cell, far less than the one or multiple ten thousands of transcripts from bulk material. 25 Thus, in comparison to bulk RNA-seq, scRNA-seq display a higher level of noise and more technical and biological variation. 26 The lower amount of RNA leads to false negatives, 27 —genes expressed but not detected. Another issue, which can falsify results, are dead and low-quality cells. These may computationally be filtered by quality criteria such as thresholds for total numbers of expressed genes per cell or percentages of mitochondrial genes which are supposed to be high in broken cells. However, the proportion of mitochondrial genes is also high in parenchymal kidney cell types such as PT, 17 so that a well-balanced threshold should be chosen. While we used 50%, Mc Evoy et al. used a threshold of 40% mitochondrial genes and review that others retained cells with a maximum of 25%–80% mitochondrial reads. 17 Single-cell techniques obviously offer a plethora of novel applications but taking into account the drawbacks listed and also the high variation between cell type distributions in datasets of the same organ we found the question emerges if for conventional gene expression analyses the bulk approach might be superior.
Results derived from deconvolution obviously depend on the scRNA-seq dataset used, in particular as a Bayesian method will integrate the underlying a priori distribution of cell types. Thus, while it is clear that at least the scRNA-seq data should be from the same organ as the bulk data, e.g., both datasets from kidney, further restrictions for organ sub-regions, sex or other factors may additionally improve the results.
Conclusions
We conclude, that our study on deconvolution of bulk transcriptome data using scRNA-seq data revealed that most relevant organ-specific and immune cell types could be detected in bulk iPSC-derived kidney and brain organoid transcriptome data. The results depend on the scRNA-seq datasets chosen and on their analysis with appropriate cluster resolution and annotation for which we applied the tools Seurat and scMayoBase integrating a comprehensive set of tissue-specific datasets. The deconvolution via InstaPrism could qualitatively identify the cell types contained in the bulk transcriptome data, also low abundant populations such as podocytes in kidney and microglia in brain. However, the proportions of cell types vary among the scRNA-seq datasets employed and we hypothesize will be most exact when the scRNA-seq dataset most closely resembles the bulk data.
Footnotes
Acknowledgment
J.A. acknowledges support from the Medical faculty of Heinrich-Heine University, Duesseldorf.
Author Disclosure Statement
The authors declare no competing interests.
Funding Information
J.A. acknowledges funding support from the Medical faculty of the Heinrich-Heine University, Duesseldorf.
Supplementary Material
Supplementary Data S1
Supplementary Figure S1
Supplementary Figure S2
Supplementary Figure S3
Supplementary Table S1
Supplementary Table S2
Supplementary Table S3
Supplementary Table S4
Supplementary Table S5
Supplementary Table S6
Supplementary Table S7
Supplementary Table S8