




Abstract
Muscle driving is a critical actuation mode of soft or flexible robots and plays a key role in the motion of most animals. Although the system development of soft robots has been extensively investigated, the general kinematic modeling of soft bodies and the design methods used for muscle-driven soft robots (MDSRs) are inadequate. With a focus on homogeneous MDSRs, this article presents a framework for kinematic modeling and computational design. Based on continuum mechanics theory, the mechanical characteristics of soft bodies were first described using a deformation gradient tensor and energy density function. The discretized deformation was then depicted using a triangular meshing tool according to the piecewise linear hypothesis. Deformation models of MDSRs caused by external driving points or internal muscle units were established by the constitutive modeling of hyperelastic materials. The computational design of the MDSR was then addressed based on kinematic models and deformation analysis. Algorithms were proposed to infer the design parameters from the target deformation and to determine the optimal muscles. Several MDSRs were developed, and experiments were conducted to verify the effectiveness of the presented models and design algorithms. The computational and experimental results were compared and evaluated using a quantitative index. The presented framework of deformation modeling and computational design of MDSRs can facilitate the design of soft robots with complex deformations, such as humanoid faces.
Introduction
Robots used in traditional industrial, agricultural, medical, service, and other applications are typically composed of rigid components. However, rigid robots exhibit poor adaptability to working environments, which makes it difficult for them to be compatible with natural environments. In addition, rigid bodies can readily harm collaborative operators and organisms in working environments. To overcome these shortcomings, soft robots are in significant demand and are attracting increasing research and industrial attention, as they are composed of soft materials, are more safe, and exhibit better environmental adaptability.1–3
Among soft robots, there is a class of muscle types that mimics the contraction and relaxation of muscles to generate motion or force.4–6 In muscle-type soft robots, wires and smart material muscles (such as shape memory alloy [SMA]) are generally used as the “muscle.” Given that “muscle units” are generally small and thin, muscle-type soft robots demonstrate the advantages of light weight, relatively large load, and smooth movement. In addition to the design, fabrication, and feasibility verification of robots, modeling and analysis are critical issues with respect to muscle-type soft robots.
Several modeling studies were therefore conducted. The simplest and most widely used method is pure geometric modeling, which is based on the geometric characteristics of a soft body. For example, the SMA coil-driven inchworm-type robot Omegabot7,8 was modeled by a simple trigonometric function between the angle of two flexible circuit boards and the length of the SMA coil. 9 The model of Meshworm 10 was based on the geometric relationship between the nodes of a fiber network. 11 To determine the relationship between the length of the driving unit and the radius of the bending arc, the modeling of other flexible actuators with spatial or planar bending can be simplified to be a simple arc curvature problem.12,13 To model a continuum robot, the modified DH (Denavit–Hartenberg) parameter method was applied, where the continuum body was segmented and each deformation in the plane was considered as being composed of a translation and two rotations.14–16 The general structural pattern and shape reproduction of soft continuum robots were addressed and modeled using the cyclic coordinate descent algorithm. 17
Soft robots are generally modeled based on their specific structures, which are typically not generalizable. Therefore, theoretical tools such as large deformation theory and computer graphics have been used for the generalized modeling of soft robots. A method to control the active deformation of three-dimensional (3D) graphics was proposed by the Disney Research Center in Zurich, where an internal muscle-driven model to achieve the deformation of an elastic body was established and a graphic simulation of deformation was realized. 18 A method for deformable body simulation based on an actual physical model was presented in Tan et al. 19 When the muscles contracted, the deformation of the elastic body was calculated using a built-in convex quadratic programming solver with complementary constraints to simulate walking and jumping motions. This type of modeling method is focused on the deformation of the general elastic body and is not restricted to the specific structure of soft robots. Hence, it is more general and provides a theoretical and technical basis for the computational design of soft robots.
“Computational design” is a type of “reverse” design process, which is based on the expected design of the user based on pre-established models, to obtain the design parameters that can meet the objective. This is achieved through iterations and optimization. A method for inverse-shape design using elastic materials was developed in Chen et al. 20 The shape of the elastic material was designed by progressive numerical computation based on a specific nonlinear material model, such that the expected deforming effect could be produced after applying a predetermined force on the manufactured object. Similarly, a method for calculating and designing the shape of a soft material based on a flexible bat grid was developed in Perez et al. 21 The computational design of the plush toys was conducted in Bern et al and Bern et al,22,23 where the plush toys were driven by embedded ropes and winches to achieve the desired action.
The Disney Research Center in Zurich developed a face “cloning” method with a computational design algorithm to optimize the thickness of the material, such that an elastomer could produce the desired deformation of its outer surface under an applied external force. 24 Based on the distribution of material thickness, the balloon shape was designed by the Federal Institute of Technology in Zurich. 25 This type of method can be used to control the entire deformation and produce a more precise local deformation effect, thereby providing guidance for the computational design of soft robots. A computational approach 26 was proposed for routing thin artificial muscle actuators using hyperelastic soft robots, to achieve the desired deformation behavior. A geometry-based framework for computing the deformation of soft robots within the range of linear material elasticity was presented with respect to efficiency and forward and inverse kinematics for soft manipulators. 27 For the further consideration of motion control, a virtual work-based static model was established to describe the deformation and mechanics of continuum robots by considering the geometric constraints of the drive rods. 28
The lack of effective and general models and methods limits the design, manufacturing, and control of soft robots. The aim of this study was to establish a general kinematic model and propose a computational design framework for the design, analysis, and control of muscle-driven soft robots (MDSRs) based on the large deformation theory of elasticity. This framework integrates the kinematic analysis with the modeling and computational design (such as the kinematic synthesis of conventional robots) of MDSRs, thus providing a systematic theory and method for the design, analysis, and control of MDSRs. With reference to the literature, this is the first study to establish a framework as a guide and reference for MDSR design, analysis, detection, and motion control.
The main contribution of this study is to propose a method for computational design, as shown in Figure 1, where the computational design includes the path search and optimization of muscle units with respect to the driving quantity. The remainder of this article is organized as follows. In Deformation and Actuation Models section, the external and internal driving problems are stated and analyzed using a high-performance constitutive model of elasticity. The computational design method is described in Computational Design Method section. In Simulation and Performance Analysis section, the analysis of several simulated deformation effects is discussed, and the performance of the computational design is evaluated. Experiments were conducted to verify the results, as presented in Simulations and Experiments section. In addition, motion simulations and muscle designs of several typical animals are presented to demonstrate the superior complexity and generality of applications using this method. Finally, Conclusion section presents the conclusions of the article.

The scheme of the computational design method.
Deformation and Actuation Models
Deformation
A soft robot is generally composed of a hyperelastic material and can generate large-scale deformation for motion. The kinematic models of traditional rigid robots are not suitable for soft robots; thus, the development of new methods and models is required. Hence, the deformation of a soft body should be described based on elastic mechanics, as described in Bern et al. 23 In this study, deformation discretization was conducted, and the related data structure was built to simplify subsequent programming. The Neo-Hookean elastic model was selected as the constitutive model for the hyperelastic material.
Modeling and analysis of the external driving problem
The deformation of an elastic matrix originates from external geometric constraints and the driving force. The objective of the modeling and simulation of elastic matrix deformation is to investigate the influence of node movement in one region on another region of nodes in a two-dimensional (2D) deformation mesh.
This problem is referred to as the “external driving” problem of an elastic matrix, as shown in Figure 2a. The elastic matrix is fixed in 2D space by a group of “anchor points.” These nodes do not move and act as a soft body base. The set of m anchor points in the deformable mesh can be expressed as follows:

Two driving methods defined for the design of a target deformation and reproduction of the target deformation.
The external driving problem should be solved using the strain energy. The mesh undergoes no actual elastic deformation; therefore, the total strain energy of the deformed mesh is
Thus, the external driving problem is transformed into a multidimensional unconstrained minimum optimization problem with the coordinates of each node in the free point set Nf as the optimization variable and the objective function as the total strain energy Ee of the Grid M.
Based on the constitutive model of a hyperelastic body, the energy model of the elastic matrix of an MDSR can be established, and the total strain energy corresponding to its deformation motion can be calculated by combining it with the formula of the triangular element strain energy formula as follows:

where ne is the number of triangular elements in the mesh. For each triangular element Ti in the mesh, the corresponding
Analysis and modeling of the internal driving problem
This subsection presents the motion modeling of an elastic matrix actuated by embedded muscle units and a discussion on the elastic matrix deformation with the contraction of the muscle units. In contrast to the external driving problem, this problem is referred to as the “internal driving” problem of the MDSR.
In the internal driving problem, there are no anchor points or driving points in the elastic matrix. As shown in Figure 2b, all n nodes recorded in the set Nf in the 2D deformation mesh are “free points.” It is assumed that the muscle units are all oriented along the line segments between the nodes in the two positions of the deformable mesh, and a muscle unit can be uniquely determined by the line segment si of p deformable meshes, denoted as
The internal driving problem may be transformed into a potential energy minimization problem.
where Ee is the strain energy produced by the deformation of the elastic matrix driven by the muscle units. If the elastic matrix mesh in the initial state is deformed, there is a portion of energy Ed driving these “free points” to move. To solve the internal driving problem, the functional relationship between Ed and the muscle unit contraction should be established. The functional relationship can be calculated using a “dummy spring” model, as described in Appendix A.
Computational Design Method
The aim of this study was to interactively develop a design method and corresponding algorithm for an MDSR from the computational design based on the information of the initial shape of the robot and the parameters of the elastic matrix materials provided by the user, as shown in Figure 1. The design parameters of the algorithm are the layout of the muscle units and the corresponding muscle contraction of the MDSR, which are automatically deduced by a computer program through computational design. The “external driving” and “internal driving” motion models of the MDSR can be, respectively, expressed as follows:
where M and
Path search of the muscle units
(1) The generation of the target deformation mesh: The input information is interactive, and the target deformation of the soft robot may be set through the man–machine interface provided by the computational design software. The process can be completed by setting “anchor points” to fix the initial elastic matrix mesh and key dragging points. These key points are the external driving of the elastic matrix, and the remainder are “free points.” Based on the external driving model of the elastic matrix, an appropriate and feasible deformation mesh can be obtained, which can be used as input information to the second stage of the calculation and design.
(2) Generation and preprocessing of the contraction graph: As shown in Figure 3a and b, the initial mesh input is transformed into the target deformation mesh according to the mechanical properties of the material. In this process, the positions of the nodes in the grid and the lengths of the line segments between the nodes change. For a group of corresponding line segments s and
For each group of grid segments in the initial mesh and the target deformation mesh, a value can be calculated; thus, a weighted undirected graph can be constructed for the weights, as shown in Figure 3c. The colors of the edges darken as the weight increases. This type of weighted undirected graph is referred to as a “contraction graph.” The computational design involves identifying the mesh segments that can produce the approximate target deformation mesh to form the muscle units through the screening of the contraction graph. In particular, it is a weighted undirected graph-search problem.
In the contraction graph shown in Figure 3c, the dark-colored indicate the contraction and elongation of line segments, respectively. As can be seen from the figure, with an increase in the distortion of the mesh, the weights of the edges increase. This indicates that the weight distribution of the contraction graph reflects the degree of deformation of the mesh. If the muscle units are arranged along these mesh segments, a deformation similar to the target mesh is more probable. Actually, there is a theoretically irreconcilable problem here: the contraction of each part of the same muscle should be equal; however, there is no “muscle path” in the contraction graph. Hence, in this study, a tradeoff was established by selecting the edges of the triangular unit with a contraction greater than a certain threshold, and then optimally connecting them, as shown in Figure 3d. Based on the requirements, 5–10 edges with the highest weights are selected as the “seeds” of the driver search. In the subsequent muscle-unit search process, the muscle-unit path of the target can “grow” from these high-weight edges.
(3) Search and integration of the muscle unit path: As shown in Figure 4a, a portion of the initially screened edges may be connected, and a group of interconnected edges form a muscle unit c. In computer graph theory, a set of interconnected edges is referred to as the “connected component” of a graph. Hence, we can construct the connected component set
To form a group of feasible muscle units, the search algorithm is required to maximally connect the unconnected parts, to reduce the number of isolated muscle units, as shown in Figure 4b. A heuristic search algorithm is adopted similar to the
As shown in Figure 4c and d, except for the vertex that belongs to the connected component, the other adjacent vertex can be the subsequent vertex added to it, which is referred to as the “feasible point set.” The segments between the vertices and endpoints are added to the muscle unit, which is referred to as the “feasible edge set.” In the process of selecting an edge from the feasible edge set and adding it to the existing muscle unit, a corresponding cost is incurred. The cost of extending the nodes in the feasible-point set is then evaluated with respect to the following two aspects.
Nonuniformity cost ga
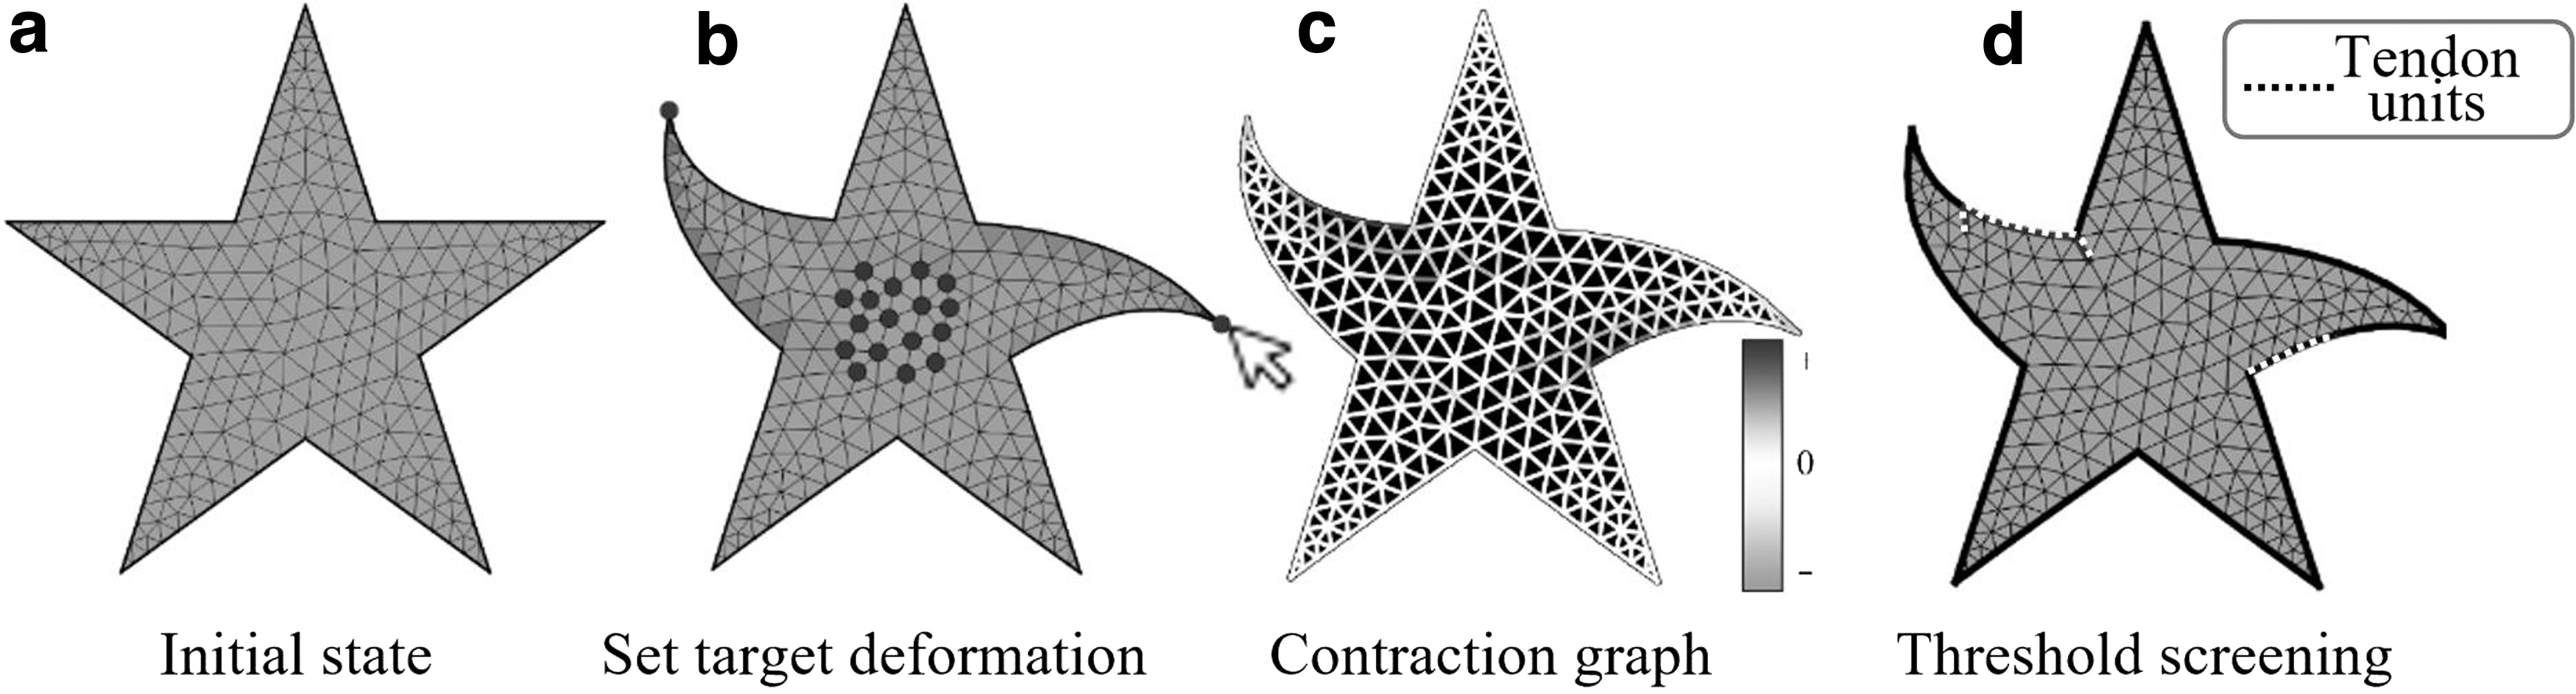
Generation and preliminary screening of the contraction graph.

Route search of muscle units and the feasible edge cost of the endpoint.
As shown in Figure 4c, when the muscle unit shrinks, the contraction of each line segment in the driving unit should be uniform. As reflected in Contraction graph G, the difference between the weights w of the segments in a muscle unit should be minimal, which can be reflected in the variance. If a new feasible edge is added, the variance increases significantly, thus indicating that the feasible edge is not compatible with the muscle unit. Therefore, the nonuniformity of the muscle unit can be defined as the variance of the weights of all segments in the muscle unit in the contraction graph. A large nonuniformity indicates that there are several segments in the muscle unit that do not readily produce contraction motion, which is similar to other segments. If the average weight of all segments in the current muscle unit c is Avg(c) and the variance is Var(c), the average weight and variance of the segments in the new muscle unit
Tortuosity cost gb
If there is an excessive number of twists and turns in the placement path of a muscle unit, the resistance is relatively large during contraction, thus causing difficulty in actuation with the muscle unit. To ensure that the path of the muscle unit is maximally smooth, it is necessary to evaluate the angle between the newly added segment and current muscle unit when adding a new segment to c. In the search process, for the feasible edge of the current point, the edge with a small angle to the extension direction of the current muscle should be selected first to ensure the smoothness of the muscle unit. As shown in Figure 4d, the angle between the line segment vector
In summary, in the process of searching and growing muscle units, for each endpoint of a muscle unit, we can measure the cost of adding the adjacent edge of the endpoint to the muscle unit and moving to the corresponding new node with respect to nonuniformity and tortuosity. The total cost function of the linear combination of the two indices above can be expressed as follows:
Estimated distance h
As shown in Figure 4b, given that the expansion objective is to connect the maximum number of independent muscle units, when a new edge is added to the muscle unit, the new endpoint tends to merge with other muscle units. The distance from the endpoint N to the endpoint of the nearest muscle unit can be computed as the Manhattan distance. Based on the microscopic morphology of the muscle, it is folded along the border of the triangular lattice, which has a length closer to the Manhattan distance than to the European distance.
The pseudocode of the algorithm for searching the muscle unit paths can be expressed as follows:
Optimization of the driving quantity of the muscle unit
(1) Determination of the objective function: In addition to the path search of muscle unit C, the optimal driving quantity for each muscle unit should be calculated. When the muscle unit is arranged according to C in the MDSR, the optimal driving amount A is obtained. When the muscle unit contracts by this amount, the deformation effect closest to the given target can be produced. The objective function of the optimal driving quantity is defined as the difference index between the deformed mesh 
where Nc and Nt are the nodes in Mc and Mt, respectively, and ei is the contribution of the difference between each group of nodes to the total difference. In general, the value of ei is 1 for boundary nodes and [0.3, 0.7] for nonboundary nodes.

The difference between the two meshes is calculated using the corresponding node coordinates of each group in the two meshes. As shown in Figure 5a, the target mesh Mt is user-defined. In general, a fixed “anchor point” is defined, and the “external driving” model is used to solve the motion state of the mesh, which does not produce large displacements and rotations compared to the initial mesh. However, the deformation mesh Mc driven by the muscle unit may undergo a large displacement and rotation due to the lack of an “anchor point” constraint when using the “internal driving” model to solve the movement. At this point, the difference index calculated using the node coordinate value is nonsignificant. Therefore, to accurately reflect the difference between the two meshes, it is necessary to align them, as shown in Figure 5b. If there is a rotation matrix,

Alignment and degree of difference.
If the difference
To obtain the matrix
where
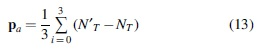
where NT and
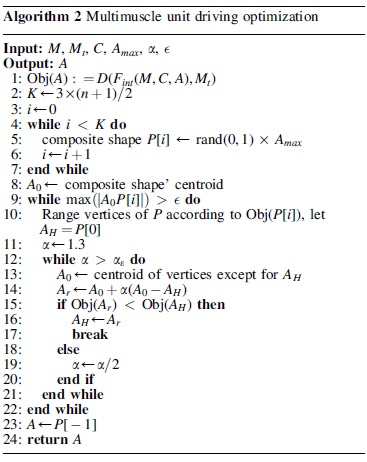
(2) Optimization of the driving quantity of multimuscle units: In the optimization problem of the driving quantity of multiple muscle units, the optimization variable is the contraction quantity
The pseudocode of the algorithm for driving the optimization of multiple muscle units can be expressed as follows:
Simulation and Performance Analysis
Analysis of the muscle unit search algorithm
In this study, five different deformations were tested using the three types of MDSRs. As shown in Figure 6a, Columns 1–5 list five examples of deformations with three MDSRs. Row A represents the meshes under external driving, where the dark-colored dots represent the anchor points. The darkness in the color of the triangular elements indicates the size distribution of their strain energies. Row B presents a contraction diagram corresponding to deformations. The dark-colored segments represent contraction and elongation sections, respectively. As the color darkened, the contraction or elongation increased. Rows C and D were obtained using the muscle unit search algorithm. The nonuniformity coefficients Ka in Row C were less than those in Row D, and the specific values were recorded. The deformation grids in Rows C and D were consistent with those in Rows A and B and were the target deformation grids after external driving, instead of the internal driving deformation grids after the muscle unit contraction.

Examples of muscle unit search and optimization. Columns 1–5 list five examples of deformations with three MDSRs.
The muscle unit search algorithm screened out the segments with large contractions in the contraction graph, combined them into multiple groups of muscle units, and yielded high smoothness. When the nonuniformity coefficient was small, the search algorithm connected the maximum number of muscle units (see
Optimization analysis of the muscle unit contraction
Based on the two muscle unit layout schemes in the first five examples, the contraction amounts of the muscle units were optimized, as shown in Figure 6b. Columns 1–5 correspond to the examples in Columns 1–5 in Figure 6a. Row A presents the target deformation meshes obtained by the external driving deformation, and the light-colored translucent meshes in Rows B and C represent the target deformation meshes, which were consistent with those in Row A. The dark-colored translucent meshes represent those internally driven by muscle units with optimal contraction. Row B corresponds to the muscle unit layout of Row C in Figure 6a. Row C corresponds to the muscle unit layout in Row D of Figure 6a. The results of contraction optimization are shown in Table 1. Contractions 1–4 correspond to the contractions of the l1, l2, l3, and l4 muscle units in Figure 6a, respectively. The optimal degree of difference and the number of iterations of the optimization process are shown in Figure 6c.
Optimization Results of Muscle Units' Contraction
As can be seen from Figure 6b and c, the layout scheme with more muscle units demonstrated an improved overall deformation reproduction ability. A typical example is presented in the third column, which had a higher driving degree of freedom; thus, it was simpler to fit the local deformation through the coordination of multiple muscle units with different contractions. However, the effect of using more muscle units was not always superior to that of using fewer muscle units, as demonstrated by the examples presented in the second and fifth columns. The performance of the optimization algorithm shown in Figure 6c indicates that the layout scheme with fewer muscle units generally demonstrated a higher convergence speed in the contraction quantity optimization process.
Simulations and Experiments
To verify the effectiveness of the proposed computational design methods and algorithms, we compared the calculated results with the actual results.
MDSR prototype and the experimental platform
The MDSR was designed as the third system (in a humanoid figure), as mentioned in the preceding section, according to the optimization result of the previous computational design. Its body was made of silicone molded to a shore hardness of 0°. The structure could be readily fabricated and has high deformability, thus ensuring its suitability for various verification experiments. A muscle unit is composed of a thin (diameter of 0.5 mm) tensile rope that can slide inside silicon. A modular muscle unit driver was designed to drive the muscle unit to produce controllable contraction. The driver consisted of a coded servo, rudder, wire, winding disc, and control circuit board. The design scheme and one of the MDSR prototypes are shown in Figure 7b, while the experimental setup is shown in Figure 7a. The MDSR was placed on a grid plate with grid dimensions of 10

Experimental method of a muscle-driven soft robot.
As a result, the MDSR prototype is able to be placed on the table without being mounted. A camera was mounted on a tripod holder and over the MDSR to capture images of the robot deformation during the experiments. A case in this study was selected to demonstrate the motion sequence, as shown in Figure 7c. The deformation contours of the MDSR in the images were extracted and analyzed for comparison with those of the previous computational design.
Effectiveness verification of the computational design
Before analyzing the deformation effect of the MDSR, it was necessary to first extract the deformation profile of the robot prototype and define an index to evaluate the degree of matching between the real and calculated deformation profiles. The procedure is presented below.
(1) Evaluation index of the deformation effect: For the prototype images in the experiments, we used the built-in functions, for example, “pointPolygonTest” provided by OpenCV, to extract the contour of the prototype. The contour extraction process for the 500
After the contour of the deformed MDSR was extracted, it was compared with that obtained from the algorithm to determine the degree of fitting between them. We adopted the calculation method for the Euclidean distance between the corresponding points on the contours, as shown in Figure 7d. It should be noted that, given that the calculated contour in the simulation was in the coordinate system of the CAD model and the measured contour in the experiment was in the pixel coordinate system of the image, the coordinates of the two contours were aligned and normalized before comparison. The procedure is presented below.
Rotational alignment: first the angle between the two segments
Zoom to one: both contours were scaled into a standard rectangle.
Contour contraction: using the “pointPolygonTest” function provided by OpenCV, the Euclidean distance between each thick node on the simulated contour (meshing) and that on the measured contour (non-meshing) was calculated. The fitting degree was evaluated quantitatively according to the average
(2) Simulation effect of external driving: Using the abovementioned method, the “external driving” effect of the MDSR was evaluated. A comparison between the simulated and experimental results is shown in Figure 8. As can be seen from the figure, Rows 1–5 correspond to the five “external driving” deformations of three different deformation meshes. In the same column, the images in the pairs represent a deformation action. The left image presents the simulation result using the integrated calculation and design software, and the right image presents the normalized result of the software output and the corresponding contour from the experiments conducted using the prototype. The meshing layer is the output of the software simulation, and the non-meshing layer corresponds to the prototype image. The deformations shown in Column B are similar to (and larger than) those in Column A.

Comparisons between the external-driving simulation and the experiments. Rows 1–5 correspond to the five “external driving” deformations of three different deformation meshes. In the same column, the images in the pairs represent a deformation action. The left image presents the simulation result using the integrated calculation and design software, and the right image presents the normalized result of the software output and the corresponding contour from the experiments conducted using the prototype. The deformations shown in Column
The evaluation indices of the fitting degree corresponding to Figure 8 are listed in Table 2, where the data represent the Euclidean distance. (in pixels) between the output contour of the algorithm and the contour of the experimental prototype, and the distance difference ratio
Average Distance Differences
(3) Simulation effect of internal driving: The results are presented in Figure 9, where Columns A, B, and C represent the experimental groups of three different deformable meshes driven by one, two, and four independent muscle units, respectively. The contractions of the muscle units corresponding to Rows 1–4 were 20%, 30%, 40%, and 50% of their original lengths, respectively. Similarly, the Euclidean distance d and the distance difference ratio

Comparisons of the internal-driving simulation and experimental results. Columns
Average Distance and Standard Deviation of the Contours
Verification and evaluation of the computational design
The results of the calculation and design algorithm of the MDSR were verified by experiments using the prototype. A comparison between the computational design and the experiments is shown in Figure 10. As can be seen from the figure, the target deformations in Rows 1–5 correspond to those in Columns 1–5 in Figure 6, and Columns A and B correspond to Rows C and D in Figure 6, respectively. After controlling the muscle-unit driver according to the optimal contraction shown in Table 1, the normalized results of the target mesh contour and experimental contour scale were obtained.

Comparison between the results from the design and the experiments. The target deformations in Rows 1–5 correspond to those in Columns 1–5 in Figure 6, and Columns
In terms of the evaluation indexes, the contour-fitting degrees of the 10 cases are listed in Table 4. The muscle-driven units were embedded into the elastic matrices of the prototypes according to the optimal layout output from the computational design software. Under optimal driving, the average Euclidean distances between the experimental deformations and the target deformations were less than seven pixels (the maximum value was 6.73), and the distance difference ratio
Average Distance and Standard Deviation of the Contours by the Computational Design
Deformation simulation and muscle designs of two animal-like soft robots
To further demonstrate the effectiveness and generality of the proposed computational design method, more practical and complex applications with deformation simulations and muscle designs are presented in this subsection with several soft robots mimicking two types of typical animals, namely, geckos and starfish.
As shown in Figure 11a, deformation was defined by dragging the body and feet of the gecko model through the external driving mode. The deformation distribution map then generated the corresponding muscle routes, which were optimized to obtain the final muscle system. According to the crawling gait of the gecko, two forms of deformation (bending to the left and right) were designed, and two corresponding muscle bundles were generated (as shown in [L1] and [R1] in Figure 11a). As the contraction of the muscles gradually increased, leftward and rightward bending were achieved, and the left-right bending alternation formed the locomotion gait of the gecko (refer to the Supplementary Video S1). The desired deformation definition, muscle generation/optimization, and motion simulation of a starfish-like soft robot were conducted in a similar manner using the same method, as shown in Figure 11b (also referred to as the Supplementary Video S1).

Simulations and muscle designs of a couple of animals.
The deformation predefinition, muscle generation and optimization, and motion simulation of gecko- and starfish-type soft robots revealed that muscle contraction can have a coupled deformation effect on other parts, and the synergistic contraction between multiple muscles can achieve a more general and complex deformation using this computational design method.
Conclusion
In this study, the motion modeling, deformation simulation, and computational design of MDSRs were investigated. The geometric description of the elastic matrix was used as the theoretical basis for the modeling and simulation of soft bodies. Combined with the constitutive model of hyperelastic materials, a numerical optimization method was presented to simulate the deformation of MDSRs under the actuation of external and internal driving. A computational design framework was proposed for the optimal layout design and contraction control of muscle driving units. Moreover, a muscle-splicing algorithm based on the minimization of tortuosity and maximization of uniformity was proposed to reduce the number of muscles while minimizing the damage to the target deformation. A quantitative index was defined to evaluate the degree of matching between the deformations obtained from the simulation and experimental measurements.
Within this framework, a prototype that could flexibly change the muscle unit layout was developed, and an experimental platform was developed. The effectiveness of the proposed computational design method and algorithm was verified by experiments conducted on an experimental platform. Therefore, the computational design method and algorithm within the proposed framework can be effectively applied to the description and evaluation of the complex deformation of soft bodies, in addition to the design, optimal layout, and contraction control of driving muscle units for MDSRs. Locomotion simulations of animals, geckos, and starfish were presented to demonstrate the superior complexity and generality of applications using this method.
Although considerable progress has been achieved, this study was limited to the 2D space. In particular, the proposed method and algorithm are applicable to planar deformations generated by 2D meshes. The framework can be extended to the 3D case, thus increasing the significance of this study, which will be considered within the scope of future research. In addition, using the distribution of different materials as the output of the computational design would produce more precise and complex target deformations. However, only the geometric deformation (with respect to kinematics) was addressed, and no dynamic factors were involved. Furthermore, the dynamic modeling of such a soft robot system considering the elastic, viscous, actuating, and frictional forces of a soft robot will be addressed within the scope of future research.
Footnotes
Acknowledgments
The authors acknowledge Prof. Ligang Liu at the University of Science and Technology of China and Dr. James Bern for research support.
Author Disclosure Statement
No competing financial interests exist.
Funding Information
This work is partially supported by the National Natural Science Foundation of China (grant no. 51975126), the China Postdoctoral Science Foundation (grant no. 2021M700882), and the Guangdong Yangfan Program for Innovative and Entrepreneurial Teams (grant no. 2017YT05G026).

Appendix
References
Supplementary Material
Please find the following supplemental material available below.
For Open Access articles published under a Creative Commons License, all supplemental material carries the same license as the article it is associated with.
For non-Open Access articles published, all supplemental material carries a non-exclusive license, and permission requests for re-use of supplemental material or any part of supplemental material shall be sent directly to the copyright owner as specified in the copyright notice associated with the article.
