
Abstract
Abstract
In this article, I propose a conceptual framework to assess the information content of some important national and global statistics on the space economy (SPE), widely used by public and private agencies and institutions, firms, researchers, and others. The framework is sketched in part 1 and is based on (1) a precise definition of the space sector as an aggregate of a sector producing space products (SPI, space industry) and a sector using them to produce nonspace products (SPE); (2) an explicit identification of the input–output relationships within the space sector; and (3) a special attention to the relationships between space capital goods and their services. In part 2 taking those statistics at their face value, I reclassify them and find results that are quite informative about the “specializations” of different national space sectors, although the figures should be taken as tentative in view of the inevitable approximations of our reclassifications. I also attempt a simultaneous reclassification of the two major global space statistics—those of the Satellite Industry Association and Space Foundation—although their totals are only broadly consistent, to obtain an evaluation in terms of revenues of our upstream SPI, the core the global space sector, on which those two sources give different and only partial information.
An Economic Framework for the Space Sector
Definitions and Terminology: The Space Products, the Space Industry, and the Space Economy
A general and reasonably precise definition of a space sector is not easy, apart from the difficulties of measuring it. So it is better to start with the less difficult notion of what we shall take as its core, namely the space industry (SPI) defined as the collection of productive activities run by space units, that is, units (internal or overlapping with firms, public institutions, universities, and others) supplying space products 1 either to final users or to other space units.
One should note, in this definition, that a final user could be a private consumer, a public institution, a firm, or anyone else engaged in the use but not in the production of space products. The final and intermediate space products can be called as those supplied respectively to final users and other space units. Among the latter, those nondurable will be called space capital goods or briefly space capitals (SCs). It is well known that these goods, once produced, contribute to the production of other goods through services dispensed along their life span. The production of new space capital goods is based on their anticipated contributions to the future productions, and their monetary value represents the space investment. Since the advent of research organized in the laboratories of firms and research institutions, the Research and Development (R&D) expenditure has become, especially in space as well as in other high-tech sectors, a strategic investment in new knowledge; and the accumulated knowledge, net of its obsolescence, the most valuable capital of a space unit.
The above definition of SPI is meaningful if one specifies what are its products. To this end, it helps to bear in mind the network of input–output (I–O) relationships among the intermediate products leading in the end to the final space products (FSPs) (Fig. 1). 2 More specifically, let us start with the definition of final space services (FISS) as the services supplied by all types of spacecraft in orbit (satellite in earth orbits, satellites and probes in the deep space, earth orbiting space structures, shuttles, etc.) or roving on extraterrestrial bodies. Specifically, FISS consist of (1) the acquisition/transmission of telecommunications (TLC) signals, Positioning, Navigation, and Timing (PNT) signals, and Universe Observation (UO) and Earth Observation (EO) imagery and data; (2) the “space housing” services supplied now by in-space structures as International Space Station (ISS) and in the future by Lunar or Martian space and ground structures; and (3) the space transport services (STS) of cargo and humans through space vehicles, such as the Shuttle, Soyuz, the automated transfer vehicles (ATVs), and others. 3 From this definition of FISS, it follows that the activities performed on space structures like the ISS, that is, microgravity, biomedical, and other types of experimental research are not to be viewed as space activities but simply as scientific activities characterized by their using of “space housing” services. 4
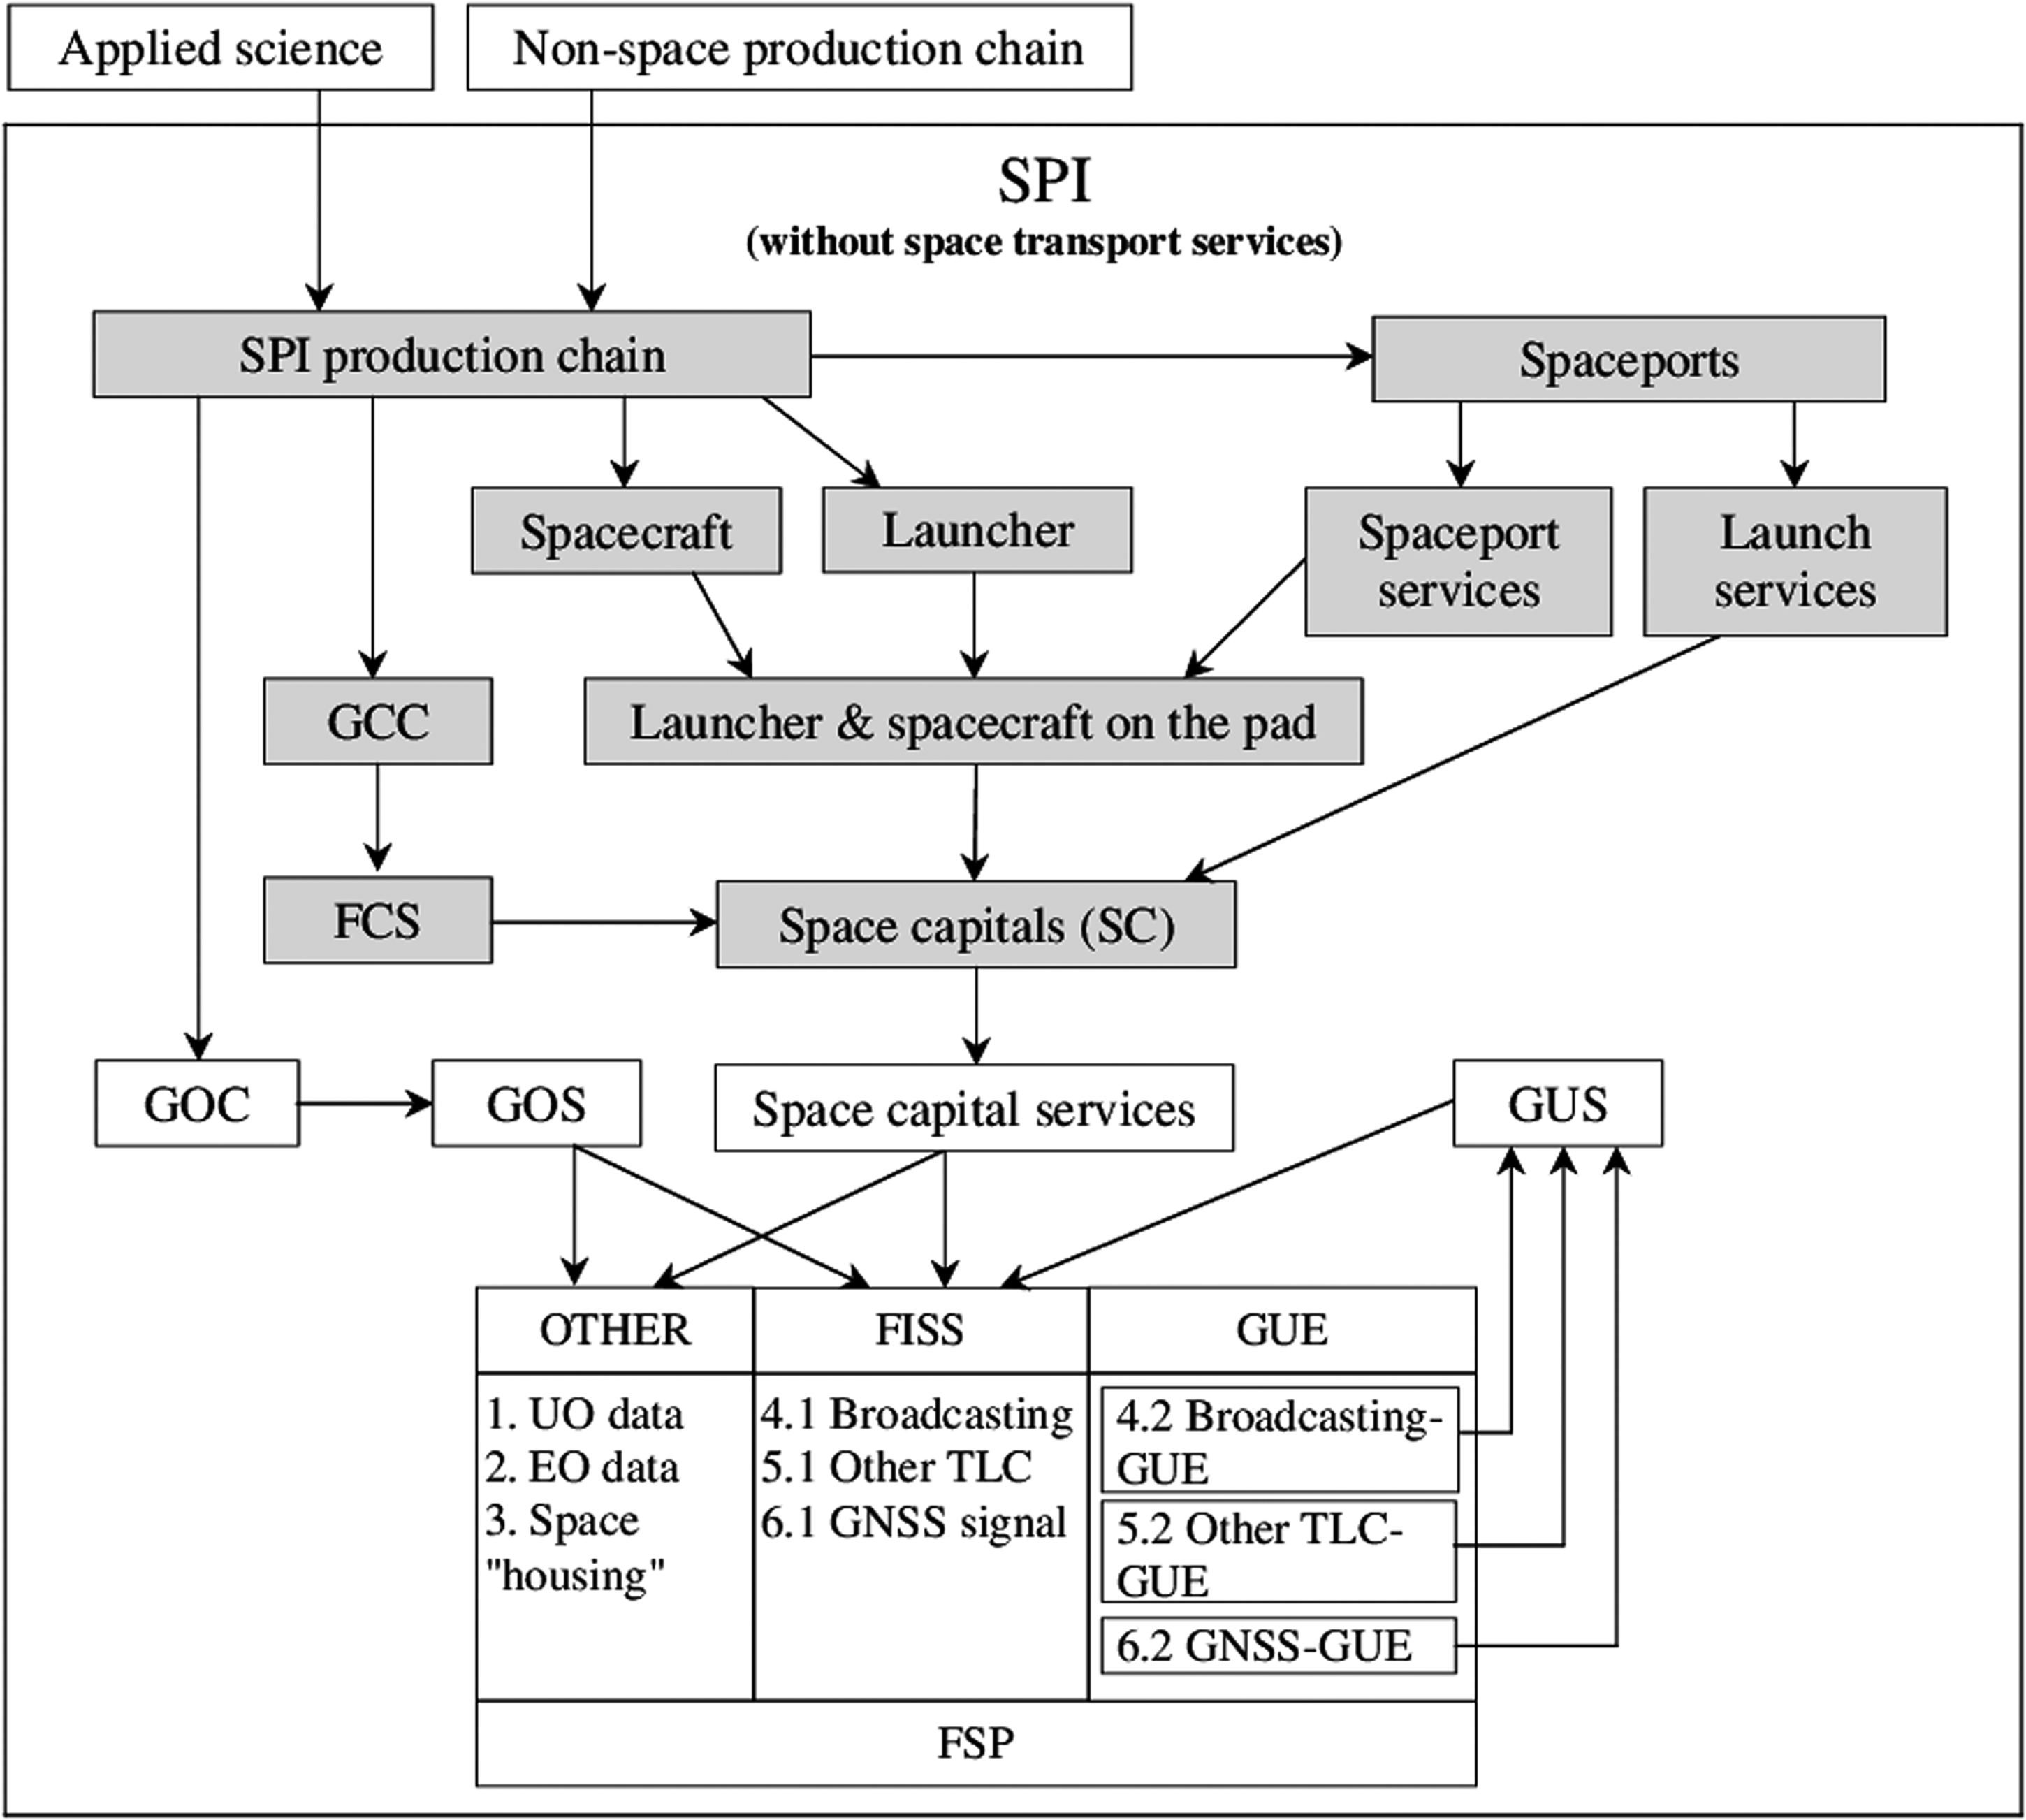
The I–O network of the SPI. The names in the boxes designate a sector or its products. The arrows represent not only I–O links between sectors of SPI but also the dependence of services on their capital goods. The I–O links in the figure do not abide by the simultaneity of a typical I–O table (e.g., FCS follow in time the launch services, whereas GOS and GUS are simultaneous to FISS). Shaded (blank) boxes are for sectors of upstream (downstream) SPI. Space capital services are electromagnetic waves (emitted/transmitted/received). GOC includes space missions' ground control centers; and network equipment (gateways, networks operations centers, VSATs, SNG equipment, and others). TLC-GUE includes personal equipment (TV dishes and IRD, etc.) and network equipment. GNSS-GUE includes stand-alone GNSS devices, GNSS chipsets supporting location-based service in smartphones; GNSS devices in cars, rail, aircraft avionics, traffic management systems, technologies, and so on. Spaceport and launch services correspond respectively to Payload and Vehicle Processing and Launch Operations of figure 3, p.16, in FAA. FCS, flight control services; FISS, final space services; FSP, final space product; EO, Earth Observation; GNSS, Global Navigation Satellite System; GOC, ground operation capital; GOS, ground operation services; GUE, ground user equipment; GUS, ground user services; I–O, input–output; IRD, integrated receiver/decoder; SC, space capital; SNG, satellite newsgathering; SPI, space industry; TLC, Telecommunications; UO, Universe Observation; VSATs, very small aperture terminals.
The services under (1) and (2) are supplied by spacecraft orbiting in space or roving on extraterrestrial bodies that constitute the stocks of capital goods in space or briefly the SCs. However, to be able to perform their functions, these SCs must be paired with the ground equipment (and the structures in which they are housed) supplying the TT&C services needed to keep SCs in their orbits and maintain them in operative conditions. The stocks of the ground control equipment can be called the ground control capitals (GCC) and the telemetry, tracking, and command (TT&C) services supplied by them, the flight control services (FCS). It is useful here to recall the obvious fact that an SC is a very different good from a spacecraft on the ground. 5 The latter is indeed an input in the production of the former, besides a launcher and a set of launch services (Fig. 1), which include processing of the launcher and payload, their integration and flight control, from the launch moment up to the end of the Launch and Early Orbit Phase (LEOP) operations. The spacecraft and the launch services are nondurable inputs by definition and also the launcher is a nondurable input as long as it will be expendable. The launch services, in turn, must be preceded by spaceport services provided by the complex network of structures and equipment, which constitute a spaceport.
The performance of space services (1)—the actual acquisition of an image or datum, or connection of the sender with the receiver of space signal—is enabled by a complex of satellite operations, which consist of the services of ground equipment and structures and of the labor of the people working on them. Those equipments and structures such as teleports, hubs in very small aperture terminal (VSAT) networks, and operation centers for space missions like those of Houston of the National Aeronautics and Space Administration (NASA) or Darmstadt of European Space Agency (ESA) can be called the ground operation capital (GOC) and their services, the ground operation services (GOS). 6 Similar considerations hold for the GOC and GOS complementing the in-house services needed to keep habitable spacecraft (Skylab, Mir, ISS, and others) in conditions suitable for astronauts to live and performing technological and scientific researches.
Moreover, the actual reception of space signal by final users requires the services of a variety of devices, such as TV dishes for households, VSATs for receivers/senders (firms, government agencies, etc.) in a TLC network, and navigation chipsets in the smartphones, whose stock will be called the ground user equipment (GUE); and the services themselves the ground user services (GUS). It should be noted that these devices are durable goods, but being acquired by households, they are treated as durable consumption goods rather than capital formation. Notice that the joint consumption of an FISS and the related GUE implies that the latter has the dual role of an input for an FISS and a final product, as shown by the arrows' loop in Figure 1.
Figure 1 exhibits the I–O network sustaining the production of FISS (1) and (2), but it is not fit to show that sustaining the STS, because the two technological structures are different in one significant aspect. As can be seen by comparing Figures 1 and 2, the core characteristic of the former lies in the fact that the output of FISS is supplied over many periods by an SC (an EO satellite keep providing imagery along its lifetime), whereas in the latter, the STS is an output of a process that either does not involve capital inputs, if the space vehicle is expendable (like an ATV), or does involve a capital input that returns on the Earth (like a Shuttle or a Soyuz carrying astronauts to and from the ISS) rather than staying in orbit.

The I–O network of the space transport services sector. See legend of Figure 1. ATV, automated transfer vehicle.
A FSP is then a product (UO or EO image or datum, fixed or mobile satellite TLC service, Global Navigation Satellite System [GNSS] signal, and space transportation) ready for a final user consisting of an FISS and the appropriate GUS. If we now define an intermediate space product as an intermediate product specific 7 to the production of an FSP or of another intermediate space product, we have a complete definition of a space product. It is useful here to recall that the need for considering intermediate as well as final products arises only for industries, like the SPI or the aircraft industry, whose products are very complex and technologically advanced systems; and for which a special attention is required to their specific inputs, going back from the first tier of major subsystems to the last one of specifically spatial components. 8
Having defined the SPI and its products, the space economy (SPE) can be defined as the set of activities for the production of nonspace products using FSPs as inputs. As shown in the “From the SPI to the SPE: Space as an Input in Nonspace Private Sectors” section, in the GNSS sector, some nonspace product (e.g., a GNSS car navigator) obtained from an FSP (a GNSS receiver) may go through further transformations (integration of the navigator into a car), while others (the GNSS functionality in a smartphone) may be value added through a variety of software applications. Our definition of SPE would leave these products outside the SPE perimeter, whereas GSA, the original source of global data on the GNSS sector, does include them along with the FSPs and the nonspace products obtained directly from them in one value chain. The choice of GSA is fully justified by the need for quantitative information on the activities, which transform SPE products into more complete or more performing products, and this suggests a broadening of the definition of SPE into another, which would also encompass those transformation activities. But the downside of such enlarged definition is a less precise perimeter of SPE.
Another set of problem arise in the opposite situation in which one includes in the SPE nonspace products whose space input is of small economic importance. The striking example here is that of satellite TV broadcasting (see the “From the SPI to the SPE: Space as an Input in Nonspace Private Sectors” section), which satisfies neatly the definition of SPE and is therefore included in SPE, although the cost of satellite leasing is definitely a minor element of the cost of a TV content. 9
The solution to these problems should come not so much from the quest for the ultimate correct definition of the space sector but, once given of it a definition of reasonable scope and precision, from the collection of data (e.g., revenues) on the borderline activities. So, in the examples above, it is important to know the value of GNSS systems integration for car companies with respect to the revenues of producers of navigation devices and GNSS receivers or the value of the revenues of satellite TV-broadcasting with respect to those of satellite services (Fig 4).
Definitions and Terminology: Sectors of the SPI
If we call sector a set of activities producing a certain good or group of goods, then SPI can be partitioned in various ways in space sectors. The activities included in a sector are not only those aimed directly at its final product but also those involved in the production of the intermediate products required for it. From an economic perspective, a natural partition of the SPI activities is the separation of both the FISS sectors and the sectors of the GOC and GUE, with their respective services, GOS and GUS, from the sectors of SCs together with those of GCC and its FCS. The former constitute the (SPI) downstream sector 10 and the latter the (SPI) upstream sectors. Note that this partition does not overlap with the partition into service sectors and capital goods sectors because the FCS are part of the upstream SPI sector, whereas the GOC and the GUE are part of the downstream one. The rationale of the dichotomy rests not only on the fact that the upstream and downstream sectors have different technological characteristics, especially the much higher research intensity of the former, but also on the related differences in organization and business strategies. Also, the complexity of launcher and satellites, the fact that they are really systems of subsystems (for a satellite, the payload subsystem is on one side and the bus subsystems—power, propulsion, attitude control, etc.—on the other) implies deeper production chains 11 of specifically spatial intermediate products in the upstream than in the downstream SPI.
From the SPI to the SPE: Space as an Input in Governments Activities
In this article, a simplified version of the institutional setting of the space production (SPI) is adopted, with a government or public sector made up of government's departments or ministries and national or international space agencies; and a private sector, which in terms of the revenues metrics is almost completely made up of firms, that is, for-profit or commercial producers, independent of their private or public ownership; and for the remaining part of no-profit institutions such as research centers and universities. Also for the demand of SPI, both final and intermediate, we shall simply distinguish between the public or governments' demand and the private or commercial demand of final consumers or private firms. National governments, directly or indirectly through such international institutions as ESA, Eumetsat, European Commission, and others, have been and still are the basic driving forces of the SPI activities. In this section, we shall see, first, how governments, besides their role in the formulation of space policies, affect SPI through their demand or direct participation in its activities; and second, how they use space products (FSP) as inputs for various purposes.
In the upstream SPI, one can observe that with few and economically minor exceptions (e.g., the production of Spirit and Opportunity at Jet Propulsion Laboratory [JPL]), governments are not directly engaged in the production of spacecrafts, launchers, and ground stations structures (GCC and GOC), of which they are instead major buyers. However, some national space agencies, for example, Deutsches Zentrum für Luft-und Raumfahrt in Germany and Centre National D'Etudes Spatiales in France, or the international ESA, alone or in partnership with commercial firms (e.g., through Public–Private Partnership), play an important role in carrying out the research required in the early development stages of new products, from basic research to technology developments. Notice also that the R&D in the space sectors builds on the available knowledge in various fields of applied science and engineering, such as electronics, material sciences, and ICT, external to the SPI (Fig. 3), on which too the government's policy has an important impact. Hence, governments besides being major buyers of spacecrafts, launchers, GCC, or SC are, in some cases, important suppliers in the research stages of the space production chain. The direct involvement of public institutions in the production of space research must not be confused with the government's funding of space R&D performed by commercial firms or nonprofit research institutions and universities.
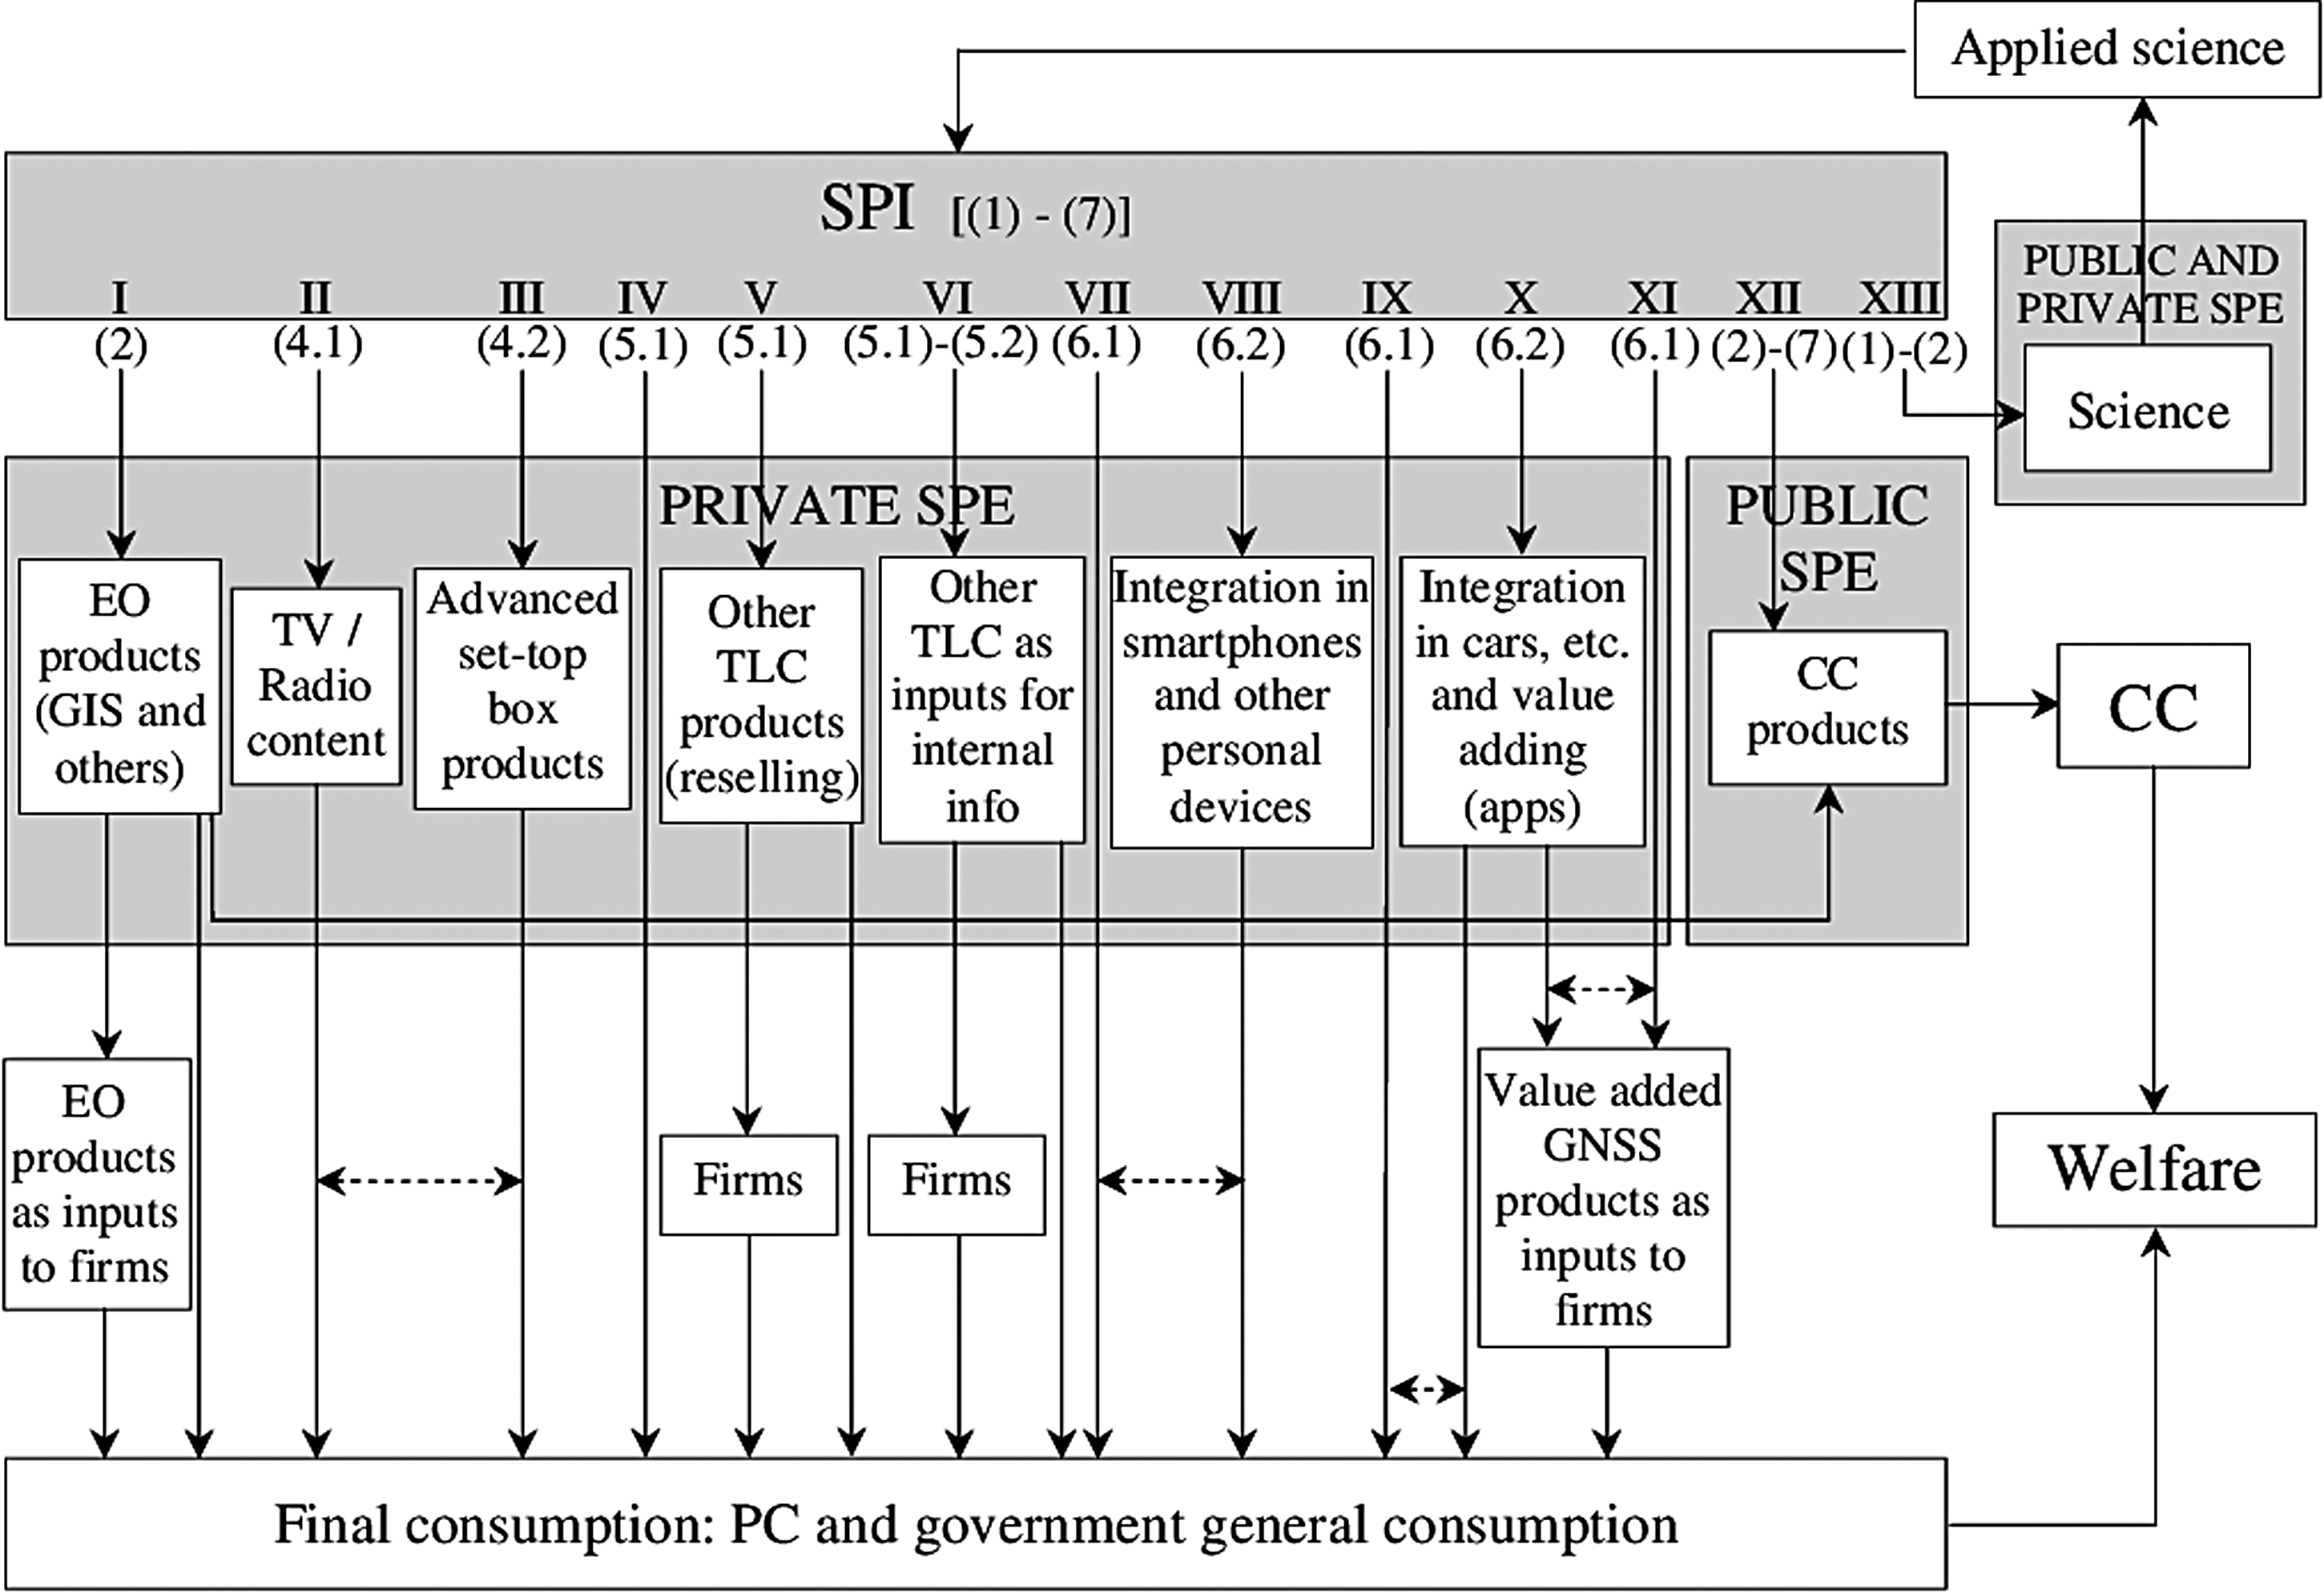
From SPI to SPE to the economy. The name in the boxes designate a sector or its products. The arrows represent I–O links in different production chain (roman numbers) and for different FSP (arabic numbers, which refer to the numbering of FSP in Fig. 1). Horizontal dashed arrows indicate complementarity in consumption or production. Intermediate inputs of SPE products are not shown. Also wholesale and retail trades are skipped. CC, collective consumption (defense, security, environment, meteorology, etc.); FSP, final space product; GIS, geospatial information services or products; PC, private consumption; SPE, space economy.
Second, a sector of the upstream SPI in which governments have played in the past a monopolistic role is that of spaceport services. At present, the spaceport services are still almost entirely supplied by governments, which own most of the spaceports, whereas launch services are predominantly supplied by commercial providers (Arianespace, ULA, China Aerospace Science and Technology Corporation, etc.), apart from the launches supplied by defense departments.
Third, the space transportation and space housing services required by human space exploration and utilization of space have been run directly by governments since the beginning of the space era (Vostok, Apollo program, etc.); and they continue to be run by them now, with the recent significant exceptions of the resupply services to the ISS, presently partly assigned to private U.S. firms (SpaceX and Orbital ATK), in the context of NASA commercial space transportation policy.
Finally, let us note that the governments of the major space-faring countries (United States, Russia, China, Japan, and India) and the European Union have set up or are setting up GNSS systems under their direct responsibility, although they have entrusted to commercial firms the construction of its space and ground segments. In the case of the European Galileo GNSS system, the European Union has delegated to commercial firms also the FCS and the GOS for maintaining the constellation and guaranteeing the PNT signal not only to defense and security institutions but also free of charge and worldwide to private producers and consumers.
Coming to the downstream SPI, government's departments and agencies are important buyers of FSP, from EO firms, Fixed Satellite Services (FSS) operators, and so on, to use them as inputs in the production of collective consumption (CC) products, 12 as shown by arrow XII in Figure 3. This happens when a Defense Department or an Intelligence Agency buy the EO data for national defense purposes; or the former buys TLC services or GNSS receivers for internally produced GNSS services, for the same purposes.
Given that CC products are nonspace products obtained using the FSP as inputs, the activities producing them can be treated as the section of SPE, which can be called the Public SPE.
Governments, however, are not only buyers but also producers of FSP to be used in the production of CC products. In this way, governments carry out production processes, which straddle the SPI and SPE. This happens, for example, when a Defense Department, after having bought GCC, GOC, and a satellite launched from the commercial sector, provides by itself the control and the operations on the satellite to get a TLC service, which will be used by that same department to get its planned defense readiness or to conduct war operations according to its plans.
A further example is given by the European intergovernmental organization EUMETSAT which states that its mission is “to supply weather and climate-related satellite data, images and products … to the National Meteorological Services of our Member and Cooperating States in Europe ….” Since EUMETSAT, after having bought the satellites from commercial companies, produces those data by running itself the worldwide network of its ground control and operation stations (GCC and GOC), and the National Meteorological Agencies, transform those EO data into weather forecasts for the public, one has here an interesting division of labor within the public sector, between the SPI activities of EUMETSAT and the SPE activities of the National Meteorological Services.
Finally, the space agencies of the major space-faring nations and of the intergovernmental ESA are essentially the sole institutions undertaking science missions whose output is given by a mass of UO and EO data, which are made freely available in various ways to the world scientific community, as shown by arrow XIII in Figure 3. The inclusion of scientific activities, using the UO or EO data as inputs in the SPE, holds only in principle because in practice it is very difficult to identify these activities and give a monetary evaluation of them, if only at cost.
From the SPI to the SPE: Space as an Input in Nonspace Private Sectors
In the previous section, we have seen how governments' demands for FSP and SCs result in various types of SPE activities, but the great majority of SPE activities arise in the private sector. The reason is that FSP become really attractive to firms as inputs in their production processes or to private consumers or governments, for their consumption, 13 only after having being transformed into different nonspace products. Let us call these activities Private SPE and see, with the help of Figure 3, how they arise from different types of FSP. Arrow I in that figure illustrates the case of the EO data supplied by satellite and/or ground station operators to SPE producers, which transform them into EO products (Geospatial Information Services [GIS] and others). These producers are both commercial firms and public agencies entrusted by political authorities to supply those products, typically free of charge, to various public and private users. Two outstanding examples of noncommercial provision of EO products are given by those based on Landsat data supplied by National Oceanic and Atmospheric Administration (NOAA) and the EO products extracted based on the Sentinel data, and combined with other space and in situ data, provided through the Copernicus Services (ultimately overseen and coordinated by the European Commission). The value of a nonspatial EO product exceeds that of an EO datum because the former is obtained from the latter by adapting it to the consumer's needs, by enriching it with other types of data, and by extracting from it, through elaborated software techniques, a continuous flow of information. In view of this, it has become common to speak of those producers as value-adding producers (as if value adding were a special characteristic of these producers rather than a general fact for any type of production under normal conditions!).
There are three types of users of EO products. First, as shown by the horizontal link from arrows I to XII, there are public agencies, which use EO products for supplying CC products (environment protection, catastrophe forecasting and mitigation, urban planning, etc.). The public procurement of EO products by these agencies, from commercial firms as well as from public suppliers, is only for civilian programs, unlike that of the defense and intelligence agencies that are largely buyers of EO data rather than products. 14
Second, as shown in arrow I, there are two other types of users, namely non-SPE firms operating in different sectors and for different purposes (e.g., interferometry in sectors such as construction, mining, and oil and gas) and final consumers, both private and public (e.g., digital maps for private or public education). It is interesting here, in passing, to note a point of general relevance for situations in which the end users of SPE products are firms rather than private consumers. Whereas personal consumption contributes directly to consumers' welfare, the consumption of EO products by non-SPE firms has, via its impact on product quality and/or production technology, a direct positive impact on their productivity. This in turn will result, depending on market conditions, either in lower prices or in higher profits and thus indirectly in higher consumption and welfare. 15
A fine figure at p.15 of EARSC presents an EO production chain more detailed than the one presented above. Notably, they divide the EO products sector into two sectors of Value adding and GIS, similar to what is done in NSR, in which there are three segments, “Data,” “Value-Added Services (Processing),” and “Information Products.”
The production of TLC services and the related GUEs in the downstream SPI is organized in a great number of ways, from large and entirely spatial firms supplying FSS (Intelsat, SES, Eutelsat, etc.) or Mobile Satellite Services (MSS) (Inmarsat, Thuraya, Iridium, etc.) to the satellite divisions of direct broadcast TV companies (Direct TV, now a division of ATT, etc.), to providers of broadband communications with their VSAT networks (Hughes, Gilat, etc.) down to the small businesses supplying and installing satellite TV dishes. To see how the products of these producers are used as inputs in the SPE, it is useful to divide them into a TV and radio broadcasting sector (arrows II and III) and a sector for data, voice, Internet, and other broadband communications (arrows IV–VI), called for brevity “Other TLC.”
In both cases, the pairing of the space signal with the appropriate GUE allows end users the actual reception of the signal but, in the case of TV/radio broadcasting, there are external (for pure media firms like Sky PLC or Dish network) or internal (for conglomerates of media and communications, like ATT with Direct TV, a division of its Entertainment Group Segment) providers of the content of the signal 16 ; and this calls for including TV/radio broadcasting in the Private SPE (arrow II in Fig. 3). Notice that downstream of the Downstream SPI sector producing TV/radio reception devices, there is also an SPE sector producing advanced digital set-top box products (TV Anywhere solutions, etc.) (arrow III).
Similarly, downstream of Other TLC sector, there are either the final consumers (arrow IV) or a Private SPE sector of TLC (arrow V). The final consumers' demand of the Other TLC services is met directly by the downstream SPI producers with a great variety of services and equipment, for which the traditional division in FSS, MSS, and broadband services is becoming looser. For its part, the demand of the Other TLC from firms comes from TLC operators, which customize the signal and resell the result to non-TLC firms and final consumers (arrow V).
Finally, there is a demand of those firms, which use the TLC signal in their internal communication networks (arrow VI). These are typically large firms (bank, manufacturing, mining, oil companies) or government institutions, but there are also small offices, aiming at the optimization of the circulation of their internal information, by buying internal communications network usually called the VSAT networks. The operation of a VSAT network by a firm or public institution can be seen as a space input whose output is a certain level of information (a nonspace product). This is, in turn, an important input in the production of the final output, although its cost is typically small or very small with respect to the total cost of the final output. One should note here the difference between this case of an SPE activity integrated in a firm and the case of an EO value-adding activity, which leads from a space input (EO datum) to an EO product through a market transaction.
By its very nature, the PNT signal reaches directly the end users or, in our I–O framework, the final consumers (arrows VII and IX) and nonspace firms (arrow XI). However, like with the TLC services, the reception of the satellite signal needs a basic receiver (antenna and computer to work out position and time), supplied by the downstream SPI producers (e.g., firms like Broadcom, Intel, MediaTek, Furuno). In Figure 3, the SPE activities in the GNSS sector are divided in two sections. In the first one (arrow VIII), device integrators (e.g., firms like Apple, Samsung, Garmin, Canon) combine the receiver with a smartphone or another handheld navigation device, which is subsequently value added by maps and location-based services (LBS) supplied by app developers. The second one (arrow X) covers a variety of activities from those that customize the receiver for car navigation (Bosch, Siemens, Valeo, etc.), to those that integrate it in a car (BMW, Daimler, Ford, etc.), to those that integrate a GNSS functionality in equipment for road toll operators, fleet operators, flight management, and so on.
Notice that integration of car navigation devices and LBS apps for smartphones and similar devices is really borderline activities, more external than internal to our SPE. The LBS apps in particular are “lateral” inputs in the GNSS value chain, and as such, they should be included only if they would be specific to GNSS functionality not simply “directly attributable to GNSS” as stated in the definition of the GNSS market by GSA (p.9), as a market which “comprises device revenues, revenues derived from GNSS augmentation services and other necessary software solutions and content (including digital maps); and added value services directly attributable to GNSS.”
However, we have chosen to include them in the SPE sector, especially because the space sector statistics of SIA and Space Report are based on GSA, which gives revenues data for a GNSS sector comprising those borderline activities. In effect, the first GNSS segment of SPE (arrow VIII) corresponds roughly to the LBS value chain in the GSA (2017) and the second segment (arrow X) to all the other value chains in that Report (Road, Aviation, Rail, etc.). The differences are due to the fact that GSA includes in a single “GNSS downstream market” also the production of GNSS devices and, at the other end, the trade activities of GNSS products, along with all the SPE productions in between.
A Possible Segmentation of SPI and SPE
The I–O framework described in the preceding sections and summarized in Figures 1, 2, and 3 suggests the following classification of the space activities:
Upstream SPI whose final outputs, SCs, are shown in Figures 1 and 2 Downstream SPI whose final outputs, FSPs, shown in the bottom boxes in Figures 1 and 2, can be distributed into four groups: 2.1. UO and EO data 2.2. Space “housing” and transportation 2.3 FISS 2.4. GUE Private SPE whose nonspace products (white boxes in Fig. 3) are grouped as follows: 3.1. EO products 3.2. TV/radio content 3.3. Advanced TV and TLC receivers 3.4. Internal information in firms and public institutions 3.5. Smartphones and other handheld devices with a PNT functionality and enriched by apps 3.6. PNT devices integrated in cars and other equipment and enriched by apps. Public SPE with its CC products, as shown in Figure 3.
In practice, the use of this classification for the collection of statistical data presents its own problems. A first problem arises in the practical implementation of the notion of a specific spatial intermediate product. We have already hinted at this problem by noting the difficulty of separating the SPI from the nonspace production chain (note 8) or of deciding whether a software/hardware input in an EO value-adding activity or an LBS application feeding the value of a smartphone (or car navigator or tractor guidance device, etc.) is specifically spatial or not. We can add here that this problem arises with many other intermediate SPE products. For example, jumping in a completely different context from the previous ones, one can ask whether to include, or not, in the downstream SPI the activities of the installation providers and retail partners in the satellite broadcasting and TLC sector. 17
Another set of intermediate inputs whose specificity for the SPI seems to be dubious are the set of services of consultancy, insurance and brokerage, financial and legal, and some kinds of R&D, which are qualified as “ancillary” or “specialized support.” 18 The doubt arises from the fact that the tailoring of these services to space operators is only an instance of the inherent tendency to the product diversification in the supply of those services. Just like one does not include “specialized support services” activities in the aircraft building or air transport industries or in any other industry, one could go on with not including them in the space sector. Of course, this point does not detract in any way to the usefulness of data on these activities.
At the opposite of the previous examples, there is a case in which applying the definition of SPE one could include in it the activities using FSPs as inputs, whose cost is a very small fraction of the total cost of that activity; and/or whose technology is not crucial in the production process. 19
Finally, as important as it is for many purposes to detect and possibly measure the nonmarket transactions or externalities, variously called spillovers, spin-offs, and so on, between SPI and the rest of the economy, it is problematic and in practice perhaps not so necessary to think about the impacts of the externalities from the SPI as they would give rise to a set of activities identifiable as a sector external to the SPI and SPE aggregate. 20
Comparison with Other Classifications
Let us now compare our classification with other adopted by various countries to help the reader to make up her mind about its limitations and possible improvements.
The SJAC (p.1) classifies the sectors of an aggregate named “Space-related industries” in a way, which fits rather well to the above classification. The aggregate corresponds to the upstream and downstream SPI and Private SPE and their “Space Industry” is defined as our upstream SPI except that it does not include the FCS and includes the GOC. Their SPI is then directly linked to the “Space Utilization Service Industry,” which provides “services utilizing space infrastructure (i.e., the products of the SPI) and corresponds to our Data and FISS sections of downstream SPI (Fig. 1). Finally and particularly significant, they state explicitly and shows in a figure the complementarity between Space Utilization Services and products of the “The Space-Related Commercial Equipment Industry,” which manufactures “the hardware to facilitate the use of the above services” (our GUE) as inputs in the User Industry (our Private SPE).
The crucial complementarity between the FISS and GUE is explicitly made in figure 2.1, p.4, of Beatson et al. Their downstream sector corresponds to the aggregate of our downstream SPI and Private and Public SPE, and includes “Space enabled services.” These services together with the goods from the “User equipment suppliers” are the inputs in the production of “Communications, navigation, and broadcasting.” In their diagram, the Space enabled services are supplied by the upstream and launch sectors, whereas their User equipment comes from a sector “of highly specialized companies” supporting “upstream and downstream operators.” This sector is external to the upstream sector, unlike our GUE which is a part of the downstream SPI.
The UKSA report uses a new terminology with respect to previous reports of the UK Space Agency, but the main classification remains the same. Apart from an “Ancillary services” sector of minor importance, their main sectors named Space manufacturing, Space operations, Space Applications correspond roughly to our upstream SPI, downstream SPI, and Private SPE. Two discrepancies in this correspondence are to be noted. The first one is that Space operations include “launch services” (and probably FCS, even if they are not named), which are part of our upstream SPI. However, the quantitative significance of this discrepancy should be very low. The second one is that all “user devices and equipment” are placed by the UKSA in the “Space Applications” segment, whereas we put those that have been “value-augmented” in Private SPE and the other in downstream SPI.
The OECD Space Forum has been using since SPE the concept of value or supply chain to define the SPE and describe its internal structure. This linear chain can be thought as obtained by suitable aggregations of sectors in our tree form I–O network of the SPI and parallel arrows of SPE. In its most recent formulation (see pp.16–21, in OECD) that chain runs through producing institutions (“actors”) alongside their products, straddling the whole “broader space economy,” which corresponds roughly to the aggregate of our SPI and Private SPE. However, the internal classification of the Space Forum is somewhat different from our classification. For example, the Space Forum group of “Operators,” positioned between the “Primes” (corresponding to our SCs and ground structure producers in the upstream SPI) and the “Downstream,” includes both “Launch services provision” and “Satellite operations, including lease or sale of satellite capacity (telecom: commercial FSS and MSS operators; earth observation operators),” which in our classification are part respectively of the upstream SPI and of FISS in downstream SPI.
In the CSA/ASC (pp.8–10), the data on the Canadian space sector are organized into five categories “on the basis of a value chain approach” derived from that of the OECD Space Forum. The first two categories (Research, Engineering, Testing and Consulting, and Manufacturing) are grouped into an upstream segment and the following three (Satellite operations, Products and Applications, and Services) in a downstream segment. Again, although some matching of these categories to ours is possible, their classification and definitions are somewhat different from ours. Broadly speaking, the downstream segment of the CSA/ASC Report is split by us in a downstream SPI and Private SPE sectors. 21 Also their “Research, Engineering, Testing and Consulting” includes activities like “outreach activities, legal services, insurance provision” and similar which we do not include in SPI; and “Satellite Operations” includes TT&C activities and similar activities which are put by us in the upstream SPI.
London Economics (p.6) defines the SPE as the aggregate of a “space industry in isolation,” formed by “companies that manufacture, launch, and operate space assets” and “a further layer of companies that utilize the signals and data supplied by these space assets to develop value-added applications …. This latter group [is] clearly not in the space industry.” These definitions are substantially equivalent to our definitions of SPI and SPE apart from the fact that they reserve the word “space economy” to the aggregate of SPI and SPE. However, this dichotomy between the group of companies in the SPI and those outside it does not appear in their successive segmentation of the SPE (pp.8–9), which delineates, following OECD and the UKSA, a “consolidated value chain” in three tires: Space manufacturing, Space operations, and Space applications. It is not said whether the tier in the middle, or which part of it, belongs to the SPI or is out of it. In our classification, however, their “Launch and brokerage sector” is, without brokerage, part of the upstream SPI as well as their “Third-party ground segment operations,” which could be part of FCS services and/or GOS. Also their “VSAT network provision” is positioned by us not in the SPE but in downstream SPI as an FSP.
A Short Guide to Local and Global Space Statistics and to Their Reclassification
The economic data available on the space sector are generally limited to data on revenues and employment, and often only revenues data are available. For this reason, we shall consider below only national or global revenues data, from some of the most widely used sources. We shall reclassify them into four SPI/SPE segments introduced in the “A Possible Segmentation of SPI and SPE” section, with the aim of making homogeneous international comparisons of the size and structures of the space sectors.
National Statistics
Canada
Table 1 reports the figures for the revenues in 2015 of each “category” of a Canadian space sector that corresponds approximately to our aggregate of SPI and Private SPE (see CSA/ASC). The matching of these categories with our segments is not as good as one would like it were, for the reasons indicated in the “Comparison with Other Classifications” section. However, the “Product and Applications” category, defined as enabling “the transformation of space-derived resources into a usable/useful format,” includes products such as “computer software applications, chipsets, Very Small Aperture Terminals” and similar, which correspond by and large to our GUE products. This makes possible to put that category in our downstream SPI.
Gross Revenues of Space Industry and Private Space Economy in Canada (2015)
Source: CSA/ASC, p.19.
Conversion at a PPP rate (OECD, Nat. Acc.) of 1.247 C$ per US$.
Of which TV-broadcasting C$ 2,560M.
PPP, purchasing power parity; SPE, space economy; SPI, space industry.
Italy
The Italian Space Agency (ASI—Agenzia Spaziale Italiana) has set up a database, named Distretto Virtuale (see ASI—Portale Distretto Virtuale— Virtuale—https://distvir.asi.it/DV/home.html) containing synthetic data (value of production, employment, etc.) and structural data (public/private, final/intermediate, foreign/national, and other breakdowns of the production) on the space units of Italian firms from 2010 to the present. The space units in the database form a sample with a very high coverage of Italian upstream SPI and of the EO sector of the Private SPE, some coverage of the downstream SPI in which Telespazio is the major player and a limited coverage of the remaining Private SPE sectors. By merging the data on the values of space production and employment of 57 Italian firms in the Distretto Virtuale for 2015, 22 with data gathered from public sources, an enlarged sample of 72 firms was obtained, whose aggregate data are shown in Table 2. The enlarged sample covers almost all the upstream SPI and give a satisfactory representation of all the remaining sectors, if one does not consider, as I have done of necessity, the activities of large firms for the production of GNSS receivers and their components (STMicroelectronics), and those for their integration in vehicles and other systems (FIAT Chrysler Automobiles, Ansaldo STS, Magneti Marelli, Olivetti, and others). 23
Values of Production of Space Industry and Private Space Economy in Italy (2015)
Source: Our computation, partly based on data for 2015 from the Distretto Virtuale. The list of companies in the sample is available on request.
Conversion at a PPP rate for Italy (OECD, Nat. Acc.) of 0.743 € per US$.
Of which TV-broadcasting €2,776.440M (Sky Italy).
Japan
In Table 3, the data for 2015 are reported on the sales of a Japanese “Space industry” group, split into four sectors, 24 that corresponds closely to our upstream SPI apart from the minor discrepancies noted above.
Gross Sales of Upstream Space Industry in Japan (2015)
Source: SJAC, p.1.
Conversion at a PPP rate [given in SJAC (2017)] is 100¥ per US$.
Norway
In its Annual Report, the Norwegian Space Center (NSC) has been publishing since the beginning of the 1990s a figure showing the series of annual turnover of the Norwegian space sector, divided into product and service turnovers. Table 4 reports the data for 2013. That sector is by and large equivalent to the aggregate of our SPI and Private SPE, but its subdivision in product and services segments is not easily matched by a combination of our segments. More specifically, our upstream SPI does not fit the Norwegian product segment because the latter includes a large component made up of ground station systems and TLC receivers (see PWC, p.61, for the situation around 2010), which are part of our downstream SPI. However, given that the service segment has been and still is largely dominated by satellite TLC services and GOS for EO and meteorological satellites, which are a component of our downstream SPI sector, the matching of the product and service sector in the NSC-AR with, respectively, our upstream and downstream SPI could be after all acceptable.
Turnover of Space Industry and Private Space Economy in Norway (2013)
Source: NSC-AR.
Conversion at a PPP rate (OECD, Nat. Acc.) of 9.029 NOK per US$.
SPE has been set to zero for lack of data on activities like EO value adding (e.g., by Kongsberg Satellite Services—KSAT) or TLC value adding (e.g., by Astrium Services or Inmarsat).
TLC, Telecommunications.
United Kingdom
In Table 5, the data on “incomes” 25 of the three segments of the UK space industry given in the UKSA (p.6) and their correspondence to our classification are reported. We leave out of the UKSA data the “Ancillary Services” segment for the reason given in the “A Possible Segmentation of SPI and SPE” section. Apart from the discrepancies pointed out in the “Comparison with Other Classifications” section that correspondence seems quite good.
Incomes of Space Industry and Private Space Economy in the United Kingdom (2015)
Source: UKSA.
Conversion at a PPP rate (OECD, Nat. Acc.) of 0.697£ per US$.
Of which TV-broadcasting £7,672M (Sky PLC).
Some suggestions from the national data
Figure 4 sums up the national data on the SPI and SPE for six space-faring countries. Leaving aside the upstream SPI sectors of Japan and Europe, which have been inserted to broaden the international comparison of the size of upstream sectors, the comparison of the relative sizes of the SPI and the SPE sectors among the remaining countries seems quite instructive, as far as allowed by the approximations required to obtain the data. First, the figure shows that the ratio of the size of the downstream to the upstream SPI sector is very different among countries. For Canada and United Kingdom, the downstream SPI sector is about 80% higher than the upstream SPI sector; for Norway that percentage rises to more than 300%, whereas the size of the Italian downstream SPI sector is only a 30% of that of its upstream sector.

Second, Figure 4 shows the overwhelming weight of satellite TV-broadcasting in the Private SPEs of Canada, Italy, and United Kingdom: the ratio between the two is somewhat more than 90% in Canada and Italy and 76% in United Kingdom. This fact per se and the “borderline” nature of satellite broadcasting in the space sector call for a separate analysis of the remaining Private SPE sectors. 26 In so doing one sees that the broadcasting SPE sector, net of the TV-broadcasting is far more developed in the United Kingdom than in Canada and Italy not only in absolute terms but also relatively to the size of the upstream SPI sector. In the United Kingdom, the former is almost 50% higher than the latter; for Canada and Italy, the former is only, respectively, 34% and 10% of the latter.
To sum up, Figure 4 suggests that Norway has a space sector with a downstream SPI (in fact a TLC and other satellite services sector) relatively far greater than the other countries. In Italy, on the contrary, the upstream SPI sector is very strong relatively to the downstream SPI and even more to the Private SPE net of TV-broadcasting. In Canada's space sector, the sizes of the upstream and downstream SPI sectors are similar, but that of the Private SPE net of TV-broadcasting is far lower than them. In the United Kingdom, the downstream SPI sector is larger than the upstream SPI; and the Private SPE net of TV-broadcasting is even larger.
It seems that to explain the differences in the composition of the space sectors of different countries, emerging from Figure 4, one cannot look only at technological developments and policies internal to the space sector but also at the characteristics and trends of the economy in which that sector is embedded.
The ASD-Eurospace Statistics
ASD-Eurospace has been collecting statistics on the European space industry (ESPI) 27 since 1993, using methodologies and concepts clearly formulated and available to the public (see, e.g., ASD-Eurospace, pp.20–23). They define ESPI as an “infrastructure supplier [which] … supplies service providers and public institutions, spacecraft and launchers to meet their requirements” (ASD-Eurospace, p.5); and give in various parts of the text a detailed description of its products whose major segments are shown in Table 6. From the table, one sees that these products are almost exclusively goods and, indeed, the text (p.20) recalls that the “services related to the exploitation of the space systems: launch services and satellite operations” are excluded from the SPI. Only the services “associated to the manufacturing process of space systems (such as engineering and test services, consultancies)” and the ground system operation “when they are performed for Space agencies in Europe” are included in the SPI.
Final Sales of European Space Industry (2014)
Source: ASD-Eurospace.
Conversion at the PPP for Eurozone (0.752 € per US$).
Satellite applications systems are Earth orbiting satellites for TLC, EO, and PNT.
Ground services defined in the text.
EO, Earth Observation; PNT, Positioning, Navigation, and Timing.
This means that the ESPI differs from our upstream SPI because we include but ESPI excludes (1) FCS and (2) spaceport construction and services as well as launch services. A possible rationale for the exclusion of (2) is not so much that the European spaceport and the launching activities of Arianespace are in Kourou, French Guiana, but the use of the metrics of final sales, 28 which is a distinctive characteristics of ASD-EUR statistics. With this metrics, indeed, the inclusion in the perimeter of ESPI of the activities of Arianespace would imply a reduction to almost zero (i.e., only to some parts of a launcher) of the final sales of launchers, given that the ESPI launchers are sold only to Arianespace. The values in Table 6 suggest however that the quantitative impact of the above-noted discrepancy is not too much disturbing.
The Satellite Industry Association Statistics
The Satellite Industry Association (SIA), in its yearly State of the Satellite Industry Report, has been publishing data on the revenues of the global satellite industry since 1996, accompanied by concise analysis of significant market trends. This industry consists of the manufacturing and launching of satellites and the use of their services, carried out by private companies for both commercial and government customers (see, e.g., SIA, p.4). The satellite industry then includes neither the activities related to human spaceflight and nonorbital spacecraft nor the satellite activities performed by governments. 29 The former are much more economically significant and, indeed, since the SIA Report of June 2011, the figure for the total revenue of the global satellite industry has been matched with data a figure for a sector that we shall call nonsatellite industry, given that the aggregate of the satellite and nonsatellite industries has been called by SIA SPI. 30 The nonsatellite industry has been defined only in SIA (p.6) as “Non-satellite industry space revenues = human space flight, non-orbital spacecraft, government spending.” Keeping in mind that government are the only buyers (apart from space tourism) of human spaceflights and nonorbital spacecraft from private firms, one sees that the above SIA definition of nonsatellite industry amounts to space budgets less their procurement from private companies for satellite products.
In the SIA reports, the satellite industry is broken down into four segments, (1) satellite manufacturing, (2) launch industry, (3) ground equipment, and (4) satellite services, which are in turn disaggregated into a number of subsegments. In Table 7, the data have been reclassified for 2015 provided for these subsegments into the four main segments of our classification. The matching of SIA subsegments with our segments seems quite acceptable but for the uncertainties relating to the content of the “GNSS Consumer Equipment” in the SIA classification. Up to 2015, this equipment included only the subsegment “GNSS stand-alone satellite navigation devices and in-vehicle services” ($31B for 2015), but for the years 2012–2015, the SIA reports give also data, separately from those which enter in the computation of the SPI total, for the subsegment of “chipsets in devices (e.g., smartphones) whose primary use is not satellite navigation” ($47.1B in 2015) (SIA, pp.28 and 30). The problem for us, with this partition of the GNSS Consumer Equipment segment, is that it is not clear how much each of the two subsegments refers to equipment (receivers), a downstream SPI product, rather than services, which would be SPE services. 31
Global Space Revenues, 2015: The Satellite Industry Association Report Data Reclassified with Our Categories
Source: SIA.
Gateways, network operations centers, VSATs, and others.
Total revenue of $1.8 B is divided into 42/58 (see chart in Rousseau) among data (downstream SPI) and value-added services and information products (SPE).
For satellite TV, radio, broadband, and mobile.
These subsegments in fact contain both equipment and services. If we assume that their total (78.1) is divided into 48/52 (see GSA, chart at p.11) between equipment and services, we obtain 37.5 (>31.0) for services and 40.6 (<47.1).
GNSS, Global Navigation Satellite System.
In SIA, the two above-mentioned subsegments of the “GNSS Consumer Equipment” have been combined, and this has brought its revenues from $31.0B in 2015 to $84.6B in 2016. Correspondingly, the revenues of the satellite industry have jumped from $208.3B to $260.5B. However, this jump has not translated into a similar jump in the total revenues of the SPI, which have shown only a moderate increase from $333.3B to $339.1B, but in a marked fall in the revenues of the nonsatellite industry, from $127.0B in 2015 to $78.6B in 2016. Since the market for the GNSS Consumer Equipment has basically private customers, the shift of its revenues from the nonsatellite to the satellite industry raises doubts about the adequacy of the definition of satellite sector given above in terms of “nonsatellite” procurement and government's SPE activities.
In the four lines at the bottom of Table 7, the figures are adjusted for the revenues of satellite and nonsatellite industries in 2015, as done in SIA, but using the exact values of the two subsegments of the GNSS Consumer Equipment for 2015, given in SIA (p.30).
The Space Report Statistics
The Space Report of the Space Foundation has been providing each year since its first issue in 2006 a comprehensive worldwide review and analysis of space activities, coupled with global statistics on commercial operators 32 and governments' space budgets. As shown in Table 8, those activities are grouped into two commercial segments, one for “Commercial Infrastructure and Support Industries” and the other for “Commercial Space Products and Services”; and in two space budget segments, one for the U.S. government and the other for the non-U.S. governments. A detailed knowledge of the composition of governments' budgets would provide the data for evaluating, at their costs of course, the space activities of governments, or in our terminology the Public SPE. In practice, without those data, the aim of an evaluation of the global space activity (all of SPI and SPE, in our terminology), without large-scale double counting, can be pursued by adding to the governments' budgets only the revenues of commercial operators from sales to other commercial operators, leaving out revenues from sales to the governments.
Global Space Revenues, 2015: The Space Report Data Reclassified with Our Categories
Source: Space Report.
See “The Space Report Statistics” section for these estimates.
Includes “Geolocation and Navigation Equipment” with $83.3B of revenues.
DoD, Department of Defense; NASA, National Aeronautics and Space Administration; NOAA, National Oceanic and Atmospheric Administration.
This approach is followed with partial success in the Space Report, Exhibit 2w, which adds to the government budgets the revenues from the segments of “Commercial infrastructure and support industries” and the “Commercial space products and services.” The first segment includes the subsegments of “Satellite manufacturing (commercial)” and “Satellite launch industry (commercial)' subsegments of the “Commercial Infrastructure and Supply Industries,” where the “commercial” in brackets is referred to the commercial nature of the buyers; and this is the procedure which allows avoiding double-counting. However, the same procedure has not been followed of necessity for the subsegments of “Ground stations and equipment,” “Satellite Communications,” and “Earth observation,” whose revenues come partly from sales to government but are treated as coming from sales to commercial buyers or final consumers, which implies some double-counting. 33 An informed guesswork of the size of the upward distortion in the value of the global SPE is difficult but in our opinion not hopeless. 34
An alternative approach to the evaluation of the global space activity consists of removing from the space budget the space procurement expenses, that is, public expenses for purchases of space goods and services and to add them to the commercial sales to commercial buyers and final consumers. A merit of this approach is that it allows computing the value of the Public SPE ( = government budget − government procurement) and the total of commercial space sales ( = sales to commercial buyers + sales to final consumers + sales to governments).
With the purpose of illustrating the second approach, a few assumptions have been made, some reasonable and others of necessity somewhat bold, which have led to the figures in the second column of Table 8, which shows how the Space Report subsegments are allocated to our segments. This allocation is straightforward for all the “Commercial” subsegments, but for the “Ground Stations and Equipment” and “Earth Observation” segments, which had to be split into components assigned to different segments of our classification. About the former, Space Report (p.19) informs that from a total of $110.523B, a 75.4% ($83.334B) is made up of GNSS consumer devices and services, which implies that the remaining 24.6% ($27.189B) is made up of real ground stations and equipment, that is, a component of downstream SPI. 35 As for the GNSS devices (receivers both stand-alone and embedded in other mainly non-GNSS devices), they are again a component of the downstream SPI, whereas the value-adding services form a component of the SPE. The Space Report does not provide a quantification of these two components and so we have divided them into the ratio 48/52 (see chart in GSA, p.11), which leads to $40.000B for devices and $43.334B for value-adding services (Table 9). Similarly, the “Earth Observation” revenues of $2,468B have been divided between Data and Value-added services in the proportion of 42/58 (see chart in Rousseau), between Data for $1.037B and Value-added services and Information Product for $1.421B (Table 9).
Satellite Industry Association and Space Foundation Reclassifications Compared
Includes also procurement for human spaceflight and nonorbital spacecraft.
The identification of the procurement expenses in 2015 in the two government space budget segments has been based on the following data and assumptions. For the United States, (1) all NASA procurement, which is 80% of its total budget 36 ($14.408B = $18.010B × 0.80), results in purchases from the commercial space sector; the 80% is assumed also for NOAA ($1.778B = $2.223B × 0.80), whereas the percentage is zero for the other U.S. space agencies; (2) the percentage of procurement of the space departments in the Department of Defense (DoD) is the same as that for the Air Force, 37 that is, 25% and results in purchases from the commercial space sector for $5.893B ($23.572B × 0.25). For the non-U.S. governments, (1) all ESA procurement, which is 62% of its total budget, 38 results in purchases from the commercial space sector; and the same percentage is applied to all other non-U.S. civil space budgets. This gives $13.249B ($21.370B × 0.62). (2) For non-U.S. military space, the DoD percentage is used, which gives $2.645B ($10.579B × 0.25).
Adding up the above figures on government procurement, one obtains a total of $37.973B, which has been divided into the proportion of 80/20 39 between upstream SPI ($30.378B) and downstream SPI ($7.595B). Finally, subtracting that total from the global government budget of $76.515B gives $38.542B for the global Public SPE (Table 8).
Some Comments on the Global Data of SIA and Space Foundation
The annual reports of SIA and Space Foundation have long been the basic statistical sources of data on space activities on a worldwide scale. Their data must be taken at face value because both the reports give only very broad indications about their methodologies in collecting them, similar to what is done by the national statistical reports; but somewhat different from ASD-Eurospace report, which gives some fairly good information on its statistical methodology. Anyway even an occasional cross-checking of data between different sources suggests a rough coherence among them and this stands in favor of a reasonable empirical reliability of those data. Indeed, recalling from Tables 8 and 9 that the SPI and the SPE cover essentially the same set of space activities (our SPI and SPE aggregate), we see that in 2015 the ratio (SPI/SPE) is a reasonable 0.97; and also for the years 2010–2016 that ratio is typically somewhat <1, but for 2 years in which it is exactly one (!) and slightly >1. These fluctuating deviations are a bit worrying, but they should not prevent the use of the data on SPI and SPE for answering to broad questions on the space sector.
A limitation of the breakdowns into segments of the SPI and the SPE is given by the fact that they preclude some useful information on global space activities. The SIA report, as noted in “The Satellite Industry Association Statistics” section, covers the whole satellite industry, with its revenues from both commercial and government buyers, but leaves in the black box of the nonsatellite industry the revenues from government purchases of human spaceflight and nonorbital spacecraft, 40 so that the figure obtained for the upstream SPI in Table 7 ($22.0B) is clearly an underestimate of its true value. At the same time, the figure for the upstream SPI in Table 8, obtained from the Space Report, gives a still lower value of $9.565 because it covers only satellite and launch (and other) revenues to commercial buyers. Finally, the Space Report gives only the total values of government space budgets, without identifying their space procurement and space operation (or Public SPE) components.
The assumptions about the procurement shares in space budgets and the subdivision of its total between upstream and downstream SPI at the end of the previous section have permitted the evaluation of both the Public SPE and the upstream SPI, whose values are reported in the last column of Table 9. It must be stressed again that these values are obtained by making a set of assumptions that should be considered not only as provisional but also as made for illustrative purposes rather than for establishing the true data.
Finally, keeping in mind the approximate value of the original statistics and of our reclassifications of the SPI and SPE, one can see that the figures in Table 9 are not terribly out of line. Moreover, the consistency between the figures in its two columns would improve significantly if one could interpret the $18B of difference between the figures for upstream SPI of the Space Report and that of SIA as a rough estimate of government procurement for human spaceflight and nonorbital spacecraft. In such a case, indeed, one could lower the Public SPE in the SIA SPI by $18B and increase by the same amount the figure for its upstream SPI. A nice possibility, however, does not necessarily correspond to the reality!
Conclusions: Summary and Open Problems
In part 1, the space sector has been defined as the set of activities producing space products (SPI) or using them to obtain nonspace products (SPE). By using an I–O framework and keeping in mind the distinction between capital goods and their services, a precise segmentation of the SPI into an upstream and a downstream segment was obtained (Fig. 1). The upstream SPI includes not only the activities to produce the SCs (a spacecraft floating in space or roving on extraterrestrial bodies) but also those required to keep spacecraft on their tracks (TT&C). The downstream SPI includes the activities needed for the effective use of the SC services, which mean the matching of SC services with both GOS and GUE to obtain FSPs.
The I–O framework for the SPE is made simply of a number of parallel production lines, which transform a space product into one fit for the use by firms or final consumers (Fig. 3). Given that governments are not only major buyers of SCs but also important operators of their services for the production of fundamental collective goods (defense, space exploration, etc.), the SPE activities run by governments (Public SPE) were separated from those run by private (commercial or nonprofit) operators (Private SPE).
The practical implementation of the definition and segmentation of the space sector has its problems. A first one derives from the fact that at the upper end of the space sector it is not easy to find where the space production chain fades away into a nonspace production chain; and similarly at the lower end, to decide which intermediate products are specific to the productions of SPE products. Another problem has to do with the fact that sometimes it is problematic to decide whether the production of a particular good or service should be included in the space sector or not. Notably, deciding the point beyond which the GNSS value chain activities are out of SPE is particularly open to question.
The I–O framework displays the complementarity of SC services with both ground operations capitals and services (GOC and GOS) and GUE, but at the same time, it stresses the importance of keeping the statistics for personal equipment (GNSS or not) clearly separated from those for the various types of network equipment; and even more from those for the equipment and structures for spacecraft flight control (GCC). Equally important is, of course, the distinction between the statistics for GNSS equipment and those for GNSS value-added services. Such distinctions are not always made in some of the space statistics examined in this article, where one finds only aggregate values on the above-mentioned activities or disaggregate values but grouped in a generic ground segment, without stressing that they refer to very different segments in the I–O network of the upstream SPI.
Finally, the I–O approach asks for considering only consolidated revenues or revenues from final products (gross revenues net of the revenues from internal transactions) of the space sector or any of its segments. The use of a metrics of consolidated revenues is important because it is the correct measure of the value of products that a sector transfers outside, or its final products. This does not happen for the global space statistics and the national ones (with the ASD-Eurospace exception), which present only values for the gross sales of their space sectors. Therefore, especially in the case of the global statistics, their values can be taken only as metrics for the size of the space markets as defined by the chosen segmentation of aggregates such as SPE, SPI, or others, and not as metrics of what these aggregates transfer to the rest of the economy.
In part 2, the statistics on the space sector have been reclassified for a number of countries, Europe and the world by using our segmentation of the space sector in upstream SPI, downstream SPI, Private SPE, and Public SPE. Keeping in mind that the original data have been taken at face value and the conversion of the original segments into ours has been inevitably approximate, the results summed up in Figure 4 look reasonably realistic and quite informative on the different characteristics or if it pleases “specializations” of the space sectors of different space-faring nations.
The national statistics do not cover the activities of the Public SPE as do instead the statistics of SIA and Space Foundation but neither gives an explicit measure for it. Also one does not find in those statistics, for reasons specific to each of them, a value for the revenues of the global upstream SPI. That is why our attempt to reclassify the SIA and Space Foundation global values (Tables 7 and 8) had to be based on some hypothesis, which we have done more to show the interest of our reclassification than in the hope of getting really realistic value.
Footnotes
Acknowledgment
The author thank Clemente Diena for his help in data collection.
Author Disclosure Statement
No competing financial interests exist.