




Abstract
Abstract
The robust material properties of sapphire across a large temperature range make it an ideal material for pressure sensing at extreme temperatures; however, it is difficult to machine and requires specialized processes, such as laser ablation. Sapphire's thermomechanical properties are investigated to understand the influence of picosecond pulsed laser ablation processes on the elastic modulus and strength for temperatures ranging from room temperature to 1,300°C. Single crystal sapphire cut on the r-plane is tested using four-point bend bar specimens where thermomechanical properties in the as-received state are compared with properties after specimens are milled in the center region by the laser. Optical microscopy illustrates strong changes in the birefringence in the laser-machined region. Laser ablation results in a modulus reduction across all three temperatures tested while the strength increases. The modulus of laser-ablated sapphire is shown to be more resistant to temperature changes when operating below 950°C. The variability in strength also increased in the laser ablation specimens, which is promising for pressure sensor reliability. Bayesian statistics was used to assess differences in the elastic and strength properties as a function of both temperature and laser machining processes.
Introduction
Sapphire is an important material in numerous applications due to the unique combination of optical, dielectric, thermomechanical, and chemically resistant properties. 1 For example, the combination of high hardness and optical properties is ideal for scratch resistant windows and precision mechanical elements that undergo high wear. It is also an ideal electronic substrate material for thin film technology.2,3 Crucibles and spray nozzles that are exposed to high-temperature or corrosive fluids are often made of sapphire due to its resistance to chemical reactions and high melting point (∼2,100°C). More recent applications include pressure and shear sensor development for characterization of high-temperature fluid flows in gas turbines, hypersonic aircraft, and commercial space transport. 4
Within the field of microsystems, traditional microelectromechanical system (MEMS)-based sensors typically use chemical etching processes to machine microscale and nanoscale features. This has led to numerous technological advances using silicon, which is an ideal material for chemical etching processes. Silicon has been used abundantly in MEMS-based sensors and some include novel machining methods such as laser ablation5–7 and oxygen ion implantation. 8 Silicon has been the dominant material for choice in MEMS sensor design due to its abundance and well-defined manufacturing processes. 5 Despite these benefits, most commercially availed silicon-based MEMS sensors are typically only rated up to temperatures less than 125°C; however, some novel designs can read temperatures in the range of 300°C–400°C. 9 Recent advances, involving using silicon carbide-based piezoresistive pressure sensors, have been shown to be able to operate at 800°C. 10 While this progress is promising, a higher temperature still needs to be achieved. Fuel mixtures in turbines can reach temperatures in excess of 1,300°C, which is hot enough to corrode and melt the most robust silicon-based MEMS sensors.
In comparison, sapphire's chemical resistance and high melting point create a unique opportunity for developing high-temperature pressure sensors; however, these same properties also render most of the traditional chemically based MEMS manufacturing techniques used for sensor fabrication impractical. Laser machining, as an alternative manufacturing method, has been proven effective to machine ceramics. Jiang et al. studied laser-induced damage in different sapphire specimens caused by 1,064 nm wavelength laser irradiation. 11 Other research has illustrated that picosecond laser pulsing from a 355 nm light source creates dislocations and amorphous characteristics in sapphire within a thin surface region ∼5μm deep. 4 The ablated surface also illustrated enhanced fracture toughness based on indentation tests relative to pristine sapphire specimens. In the laser-ablated specimens, no crack formation was visible on the surface near the stress raisers formed by the Vickers indents. Whereas thermal annealing and crack healing have been quantified in sapphire,12,13 there is lack of measurements describing how laser irradiation can affect the mechanical strength and elastic properties of the material when exposed to a range of elevated temperatures. Such information is critical to ensure technology transition to pressure sensor systems that can operate over broad temperature and pressure regimens. In the present study, we investigate changes in modulus and strength after laser ablation over temperatures ranging from 25°C to 1,300°C. Comparisons are drawn between pristine and laser-machined specimen properties for the r-plane crystal cut.
Due to the pervasive applications of sapphire, there has been significant research on its thermoelastic, strength, and fracture properties. 14 For example, Schmid et al. focused on understanding the effects of temperature and crystal orientation on strength of sapphire along different crystallographic planes. 15 In general, c axis sapphire crystal cuts exhibit a sharp decrease in strength at high temperatures. This prior study excluded thermomechanics on the r-plane sapphire crystal cut. In this article, we focus on thermoelastic and strength properties on the r-plane as a function of both temperature and laser machining using four-point bend bar specimens. Bending mechanics based on theory and the finite element method is compared with experiments to infer changes in elasticity and strength. Bayesian uncertainty quantification is used to quantify clear differences in elastic modulus as a function of temperature, given the uncertainty and sensitivity in specimen thickness.
In the following sections, the experimental setup is first described to illustrate how elastic modulus and strength are quantified. We then characterize the bend bar specimens, using optical microscopy and mechanical loading experiments, to quantify the effects of the laser-machined zone. Bayesian statistics is used to obtain probability measures of the elastic modulus across the three temperatures tested for the laser-machined and as-received specimens. Concluding remarks are given in the final section.
Experimental Setup
A four-point bending apparatus was implemented to quantify sapphire's elastic modulus and flexural strength at high temperatures. A box furnace capable of temperatures ranging from 600°C to 1,600°C (model: ST-1600C-445-AG; Sentro Tech Corporation) was used to heat the specimens. A 1 kN MTS load frame was modified to load the specimens within the box furnace, as shown in Figure 1. A 5 N MTS load cell was realigned to measure specimen loads by attaching a stainless steel cantilever to the screw-driven crosshead that loads the bend bar specimens. This was done to align the load cell with the exhaust port of the furnace. The load cell was thermally isolated from the box furnace by inserting a polycrystal alumina push rod between the load cell and the bend bar specimens. Thermal effects on the load cell due to the high-temperature furnace were deemed negligible through validation with an infrared camera during the highest temperature tested. The push rod was machined such that two polycrystal alumina pins, separated by 4 mm, could be attached to its end to load the specimen. The specimen was supported by a polycrystal alumina block and pins positioned 10 mm apart. The specimen geometry and four-point bending configuration are shown in Figure 2. A capacitor probe was mounted above the furnace to measure displacements of the alumina rod, via a rigidly attached conducting flange, which estimates flexural displacements of the four-point bend specimens within the furnace. Attaching the flange directly to the rod serves to isolate the displacement of the rod and by extension, the displacement of the four-point bend specimens from other potential sources of compliance in the setup. In addition, the rod was allowed to expand from the thermal loading before it was placed in contact with the sapphire specimens. This minimized the error in the displacement measurements due to thermal expansion. This configuration was used to load specimens with dimensions 16 × 6 × 0.115 mm 3 . A rigorous experimental validation of the setup has been done to minimize compliance in the system as described elsewhere. 16
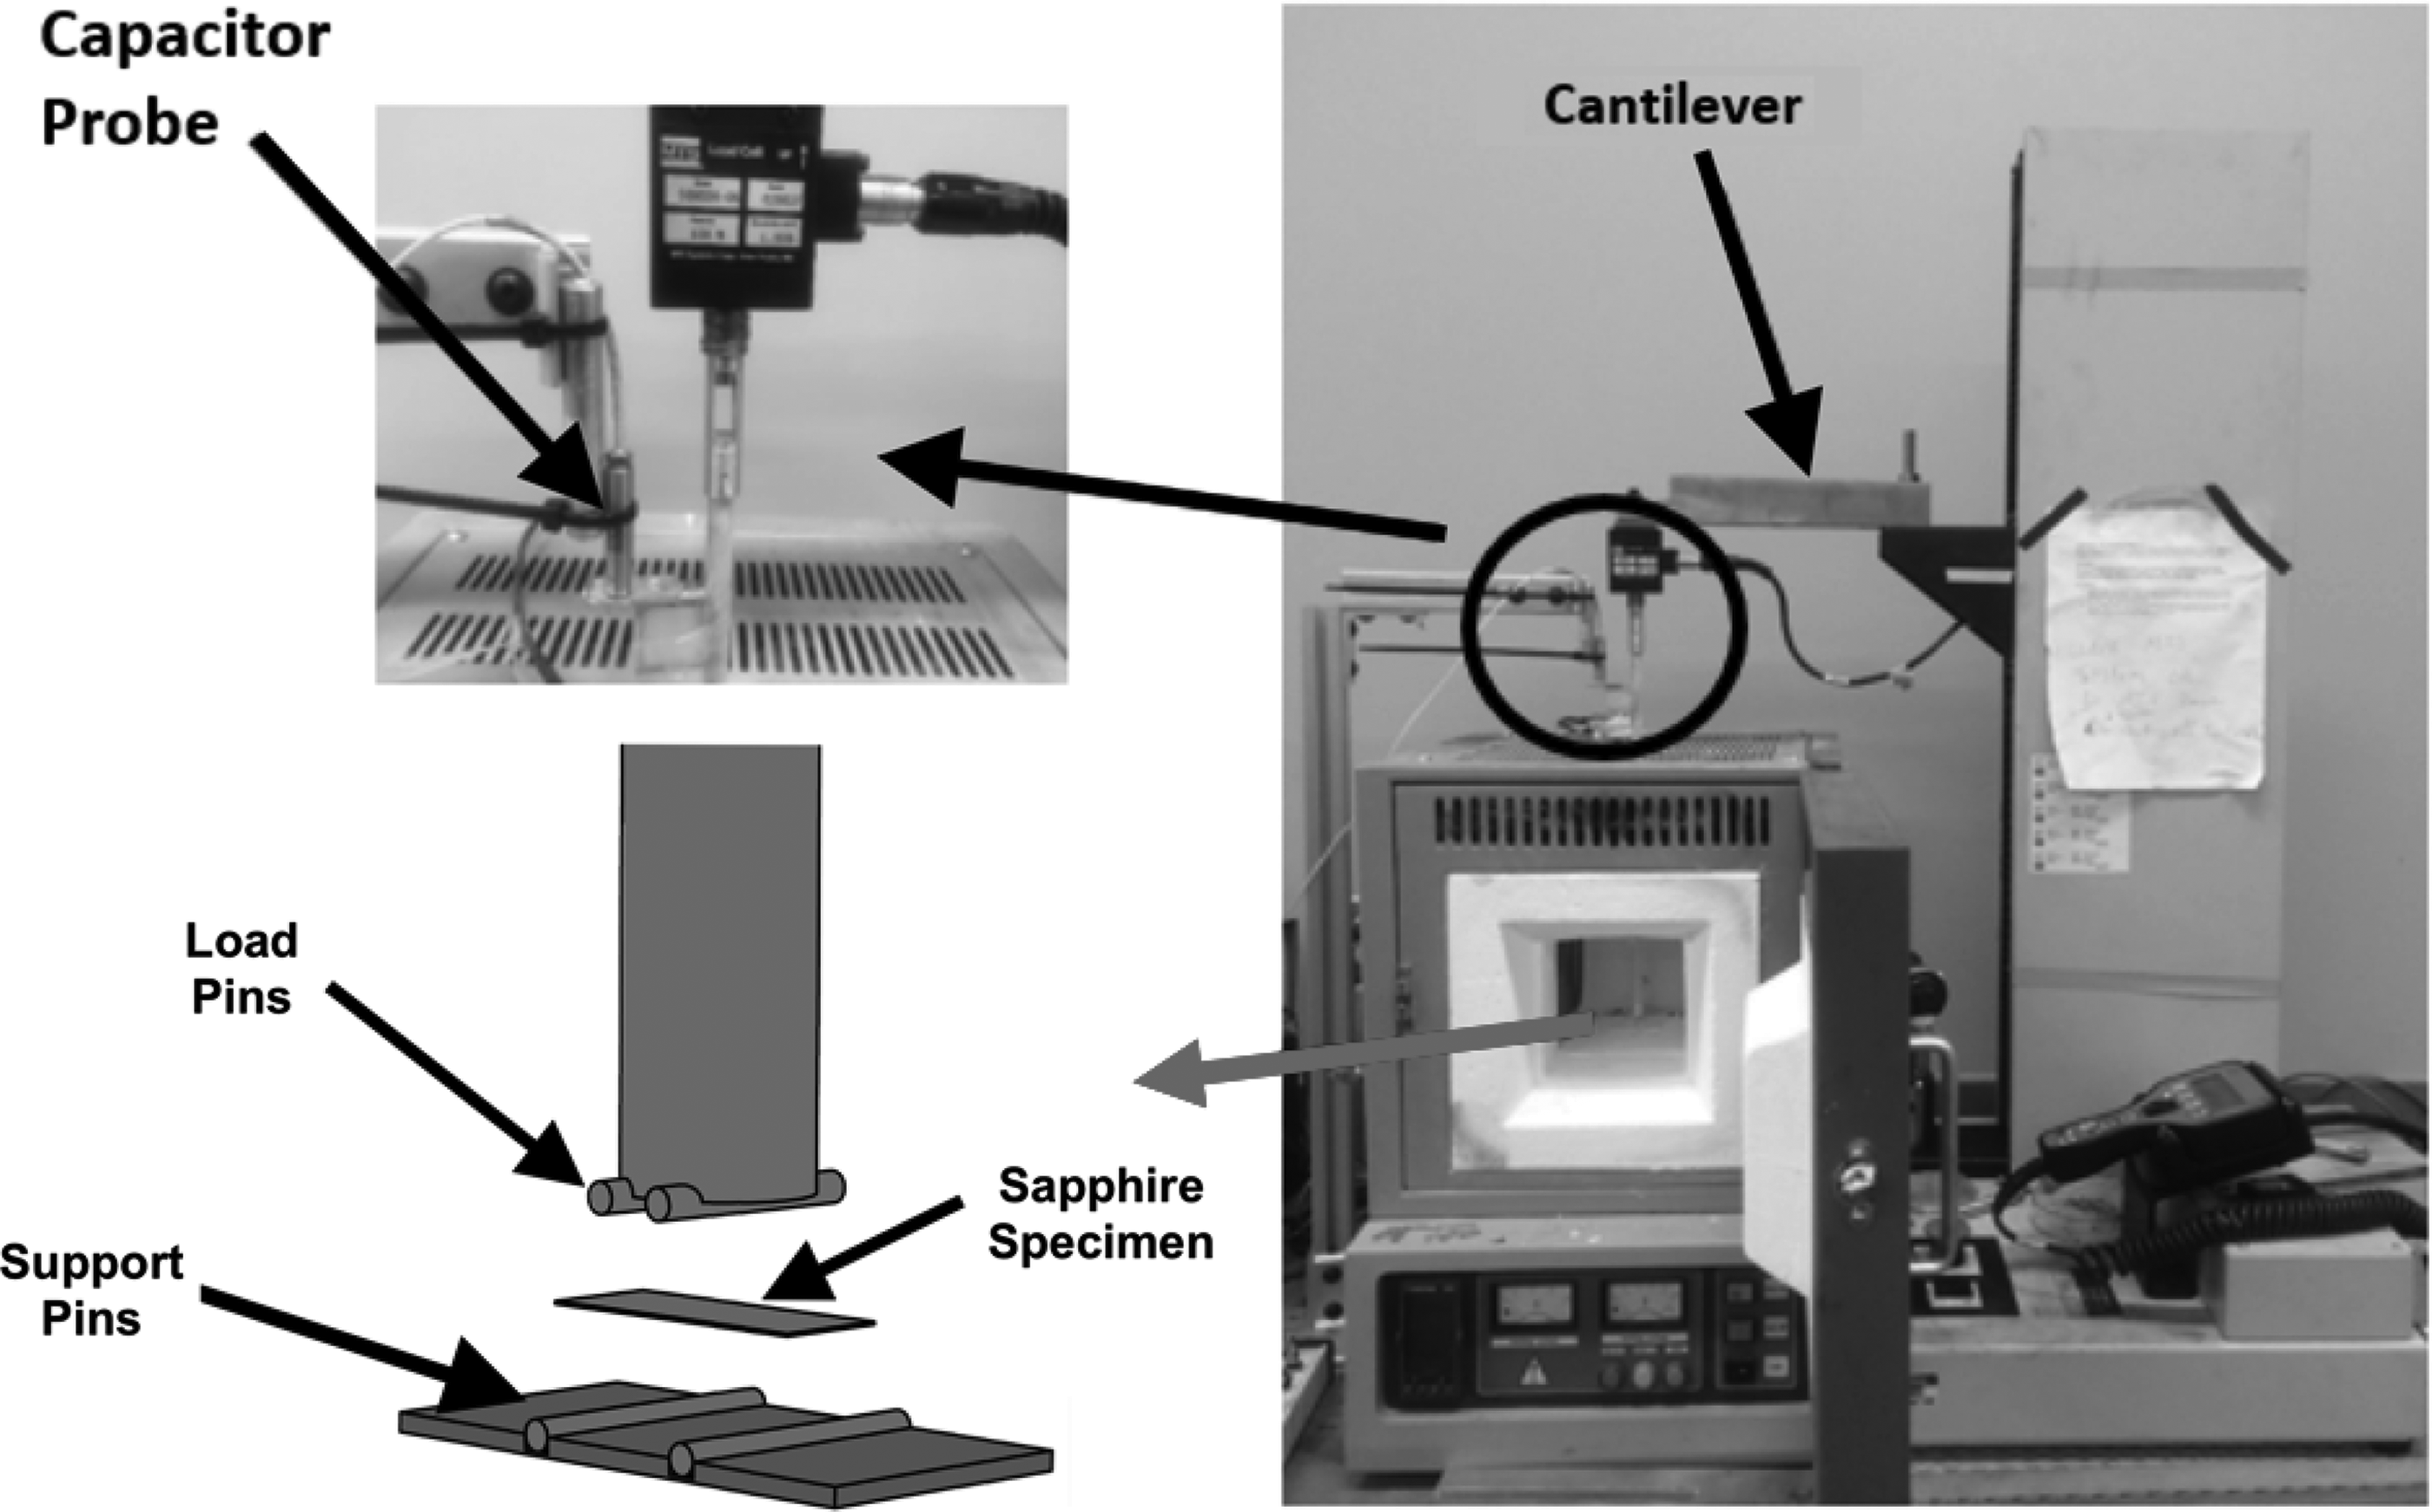
The test setup with box furnace and loading machine integrated together.
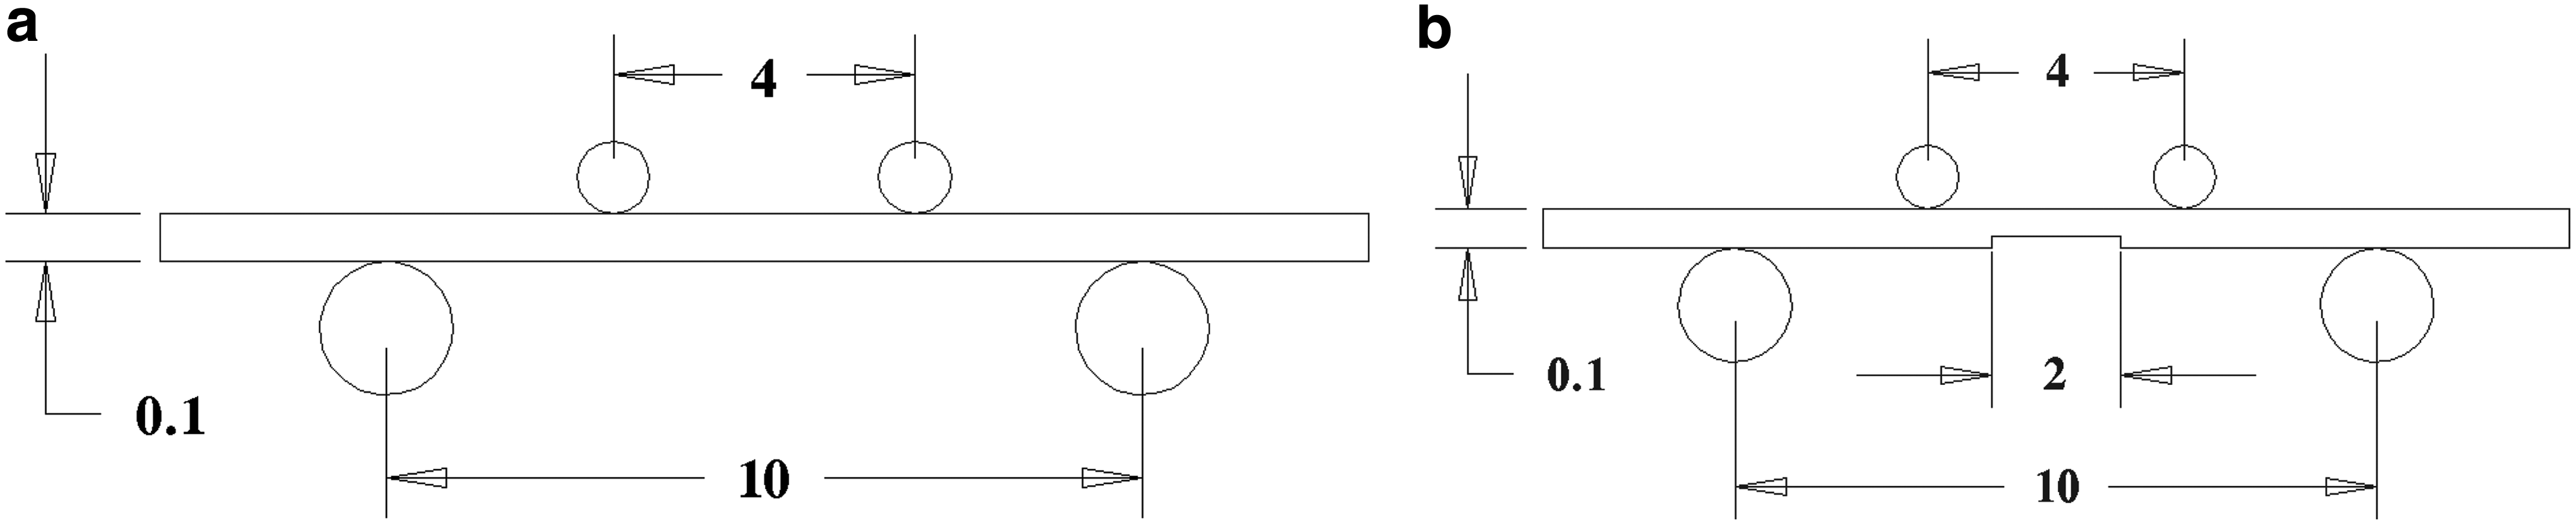
To quantify any mechanical property changes postlaser ablation, the specimens were machined using a picosecond laser to mill the center region within the uniform moment area of the specimen. A laser fluence of 3.81 J/cm 2 was used with frequency of 100 kHz and scan speed of 100 mm/s. Details describing laser micromachining control of the specimens have been discussed elsewhere. 17 The milled depth was nominally 20 μm leaving a thickness within the center of the specimen of nominally 80 μm. Both the as-received and laser-machined specimens are shown in Figure 2.
Both pristine and laser-machined specimens were tested at room temperature, 950°C, and 1,300°C. The heating rate inside the furnace was 8–12°C/min in all experiments. The furnace temperature was held at the required temperature for 15 min before the mechanical testing was initiated. The experimental setup was validated using polycrystalline alumina as described elsewhere. 16 Importantly, several four-point bend measurements were conducted at room temperature using the MTS load frame with and without the furnace setup and were found to be highly repeatable on polycrystalline alumina.
Experimental Results
Thermomechanical Characterization
Linear elastic beam mechanics was utilized to determine the modulus and strength of the specimens. The Young's modulus was determined using Bayesian statistical analysis coupled with equations derived from beam theory, and is discussed later. The following relationship was used to relate the expected load, P, from the measured displacement,
where E1 is the Young's modulus, 
where I2 is the moment of inertia of the laser-machined region, c is the distance between the point of loading and the beginning of the machined region, l2 is the width of the machined region, and E2 is the modulus of the machined region. It should also be noted that E2 is an effective modulus through the entire thickness of the laser-machined region. We also calculate the stress from load and geometry to determine strength using the following relationship:
where w is the width of specimen and tx is the thickness of the specimen at the break point. We have denoted the maximum stress,
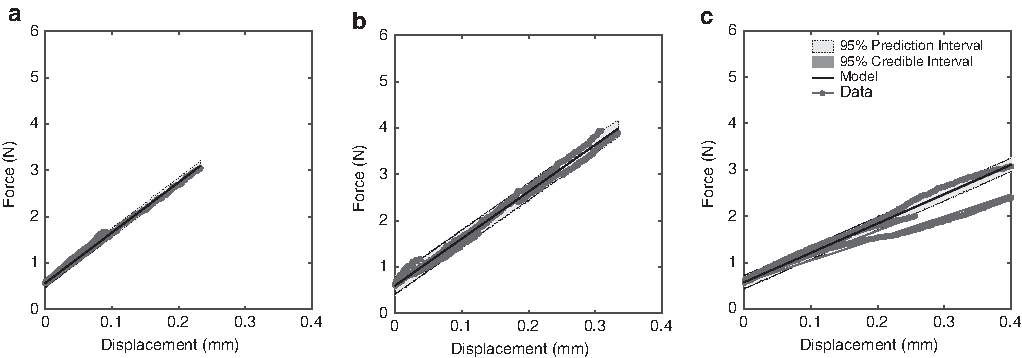
Figures 3 and 4 show the results from the load/displacement experiments. Each figure shows the load/displacement curve, while the legend in each graph gives the strength of each specimen based on Equation (3). A MATLAB curve fitting tool was used to find a linear estimate, which produces deterministic values for the modulus represented in black in the figures. The modulus was identified based on the relationships given by Equations (1) and (2) for each temperature and laser-machined condition.

Load versus displacement curve for pristine sapphire tested at
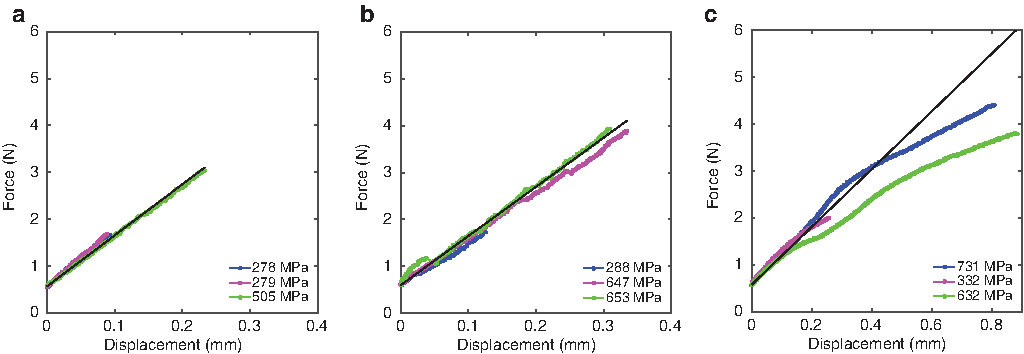
Load versus displacement curve for laser-machined sapphire tested at
A total of nine pristine and nine laser-machined specimens were tested and comparisons are drawn between laser-machined and pristine specimens at each temperature. Figure 3a–c shows data for pristine sapphire tested at 25°C, 950°C, and 1,300°C, respectively. Figure 4 shows the same results for the laser-machined specimens. At 950°C, the laser-machined specimens have higher strength by almost a factor of two relative to the pristine specimens. However, the variability in strength is larger in the laser-machined specimens. At 1,300°C, the laser-machined specimens exhibit higher strength than the pristine specimens, but the difference in strength is less compared with the ones tested at 950°C.
Table 1 summarizes the strength of the pristine and laser-machined specimens at different temperatures. The same data are plotted in Figure 5, which can be compared with an earlier study by Schmid et al. 15 that did not include r-plane strength of sapphire. While all of the specimens in the prior results showed a loss in strength above 500°C, the r-plane sapphire in the present study exhibited an increase in strength from room temperature to 950°C and an even greater increase from 950°C to 1,300°C. The laser-machined specimens exhibit higher average strength than pristine specimens at all temperatures tested.
Strength Comparison Between Pristine and Laser-Machined Specimens

Strength comparison between laser-machined and pristine sapphire at different temperatures. Color images available online.
While the strength was measured for every individual specimen, the modulus was calculated from the curve fit for all three specimens for each condition and hence one average modulus value was calculated for each group of three specimens tested under the same conditions. In addition, when the laser-machined modulus was computed, the E1 in Equation (2) was treated as a constant value at each temperature. These E1 values are listed in the first column of Table 2, which shows the modulus values for pristine and laser-machined specimens obtained from the slope of the fitted curves. The pristine specimens show a drop in modulus at 950°C but a small increase at 1,300°C. The laser-machined specimens exhibit an increase in the modulus at 950°C values but then show a considerable decrease at 1,300°C.
Elastic Modulus Comparison on the r-Plane Between Pristine and Laser-Machined Sapphire Specimens
Validation
Finite Element Analysis
The beam equations used to calculate Young's modulus and the flexural strength both assume that anisotropic elasticity is negligible. Finite element analysis (FEA) via COMSOL® was used to validate this isotropy assumption. To generate the necessary models for FEA validation, the stiffness matrix for sapphire, specifically for the r-plane, was first obtained, and compared with errors produced when approximating the elastic tensor as isotropic.
Crystal anisotropy and isotropic approximation
The crystal structure of sapphire is described by a rhombohedral phase contained within a hexagonal crystal structure. This leads to elastic anisotropy that is well documented in the literature.18–20
The general representation of the stress/strain constitutive relationship is given by the following:
where
where
We obtain the elastic tensor on the r-plane from properties measured on the c-plane crystal cut of sapphire. This tensor is written in Voigt notation where the Greek superscripts coincide with
which shows anisotropy on the r-plane as evidenced by nonzero shear coupling coefficients. The anisotropy of sapphire makes any analysis increasingly complex, and so, to simplify the problem, the behavior of sapphire is also considered to be approximately isotropic. This is represented by this isotropic relationship
where
Pristine sapphire model
Two finite element models for pure bending were created for the pristine sapphire specimens, one used the anisotropic stiffness tensor in Equation (6) and the other used an isotropic stiffness tensor in Equation (7). The predicted finite element displacements at the load pins (Fig. 1) under identical loading conditions for the anisotropic and isotropic models were ∼88.28 and 85.60 μm, respectively. The relative difference between these values is about 3%, which shows that the isotropic assumption is reasonable. It is shown in the Bayesian Statistical Analysis section that uncertainty in the data and specimen geometry is larger than the approximations of isotropy.
Bayesian Statistical Analysis
Bayesian statistics is applied to quantify model parameter uncertainty and its influence on predicting the load/displacement curves. Bayesian statistics is based on the idea that calibration parameters exhibit uncertainty due to model discrepancies and observation errors associated with data. Bayesian model calibration is based on Bayes' relationship as follows:
which quantifies the probability of observing parameters
where ith experimental data point and error measurement are denoted by Pdata(i) and
where E is the modulus, and t is the thickness.
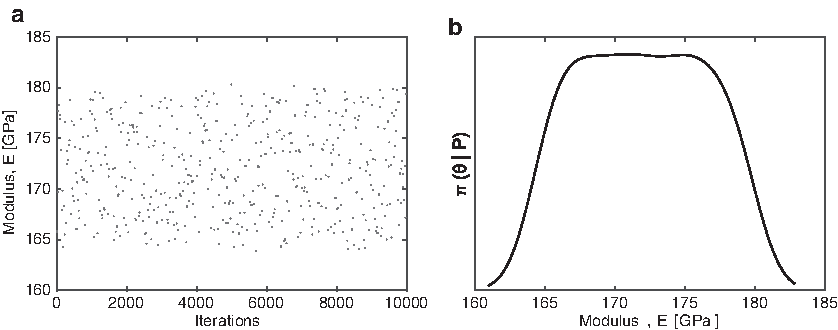
Figure 6a shows the sampling chain for the modulus with 1 × 10 4 iterations. This figure represents the stochastic sampling of the DRAM algorithm. This distribution represents a converged posterior that is not expected to change on increasing any number of iterations. Figure 6b shows the posterior density for modulus over the limits prescribed in DRAM sampling algorithm. The plot of the experimental data along with the model prediction for the load given the displacement is shown in Figure 7. Also included in the plot are the prediction and credible intervals obtained from Bayesian analysis. The prediction interval takes into account the experimental or measurement errors, while the credible interval takes into account the model uncertainties. It should be noted that due to the strong nonlinearity in Figure 4C for the laser-machined specimens at 1,300°C, only the data before 0.2 mm of displacement were used to infer the modulus listed in Table 2.
One important aspect that affects the model prediction is beam geometry. The equations for the load given previously by Equations (1) and (2) are both highly sensitive to the thickness since it is raised to the third power within the moment of inertia. Due to this larger sensitivity in specimen thickness, we consider this parameter in the Bayesian inference. It can be shown from Equations (1) and (2) that both modulus and thickness cannot be uniquely inferred from only the load data. Therefore, we take additional independent measurements of the thickness to obtain limits on the specimen thickness. The specimen thickness was measured with the length probes provided by HEIDENHAIN named CT2500 with a resolution of 100 nm. The measured values for thickness were between 114 and 116 μm. We assume a uniform distribution on the thickness between these values during the Bayesian inference. The densities for thickness of the specimen are more or less the same for each case and are not discussed. The inclusion of the thickness in the Bayesian analysis has a significant effect on the modulus posterior density, as seen in Figure 8, further illustrating the sensitivity of the model to variable specimen thicknesses and the reason for its inclusion in the Bayesian analysis. Figure 9 shows the posterior densities on the same plot for pristine and laser-machined specimens to draw the comparison between different cases.
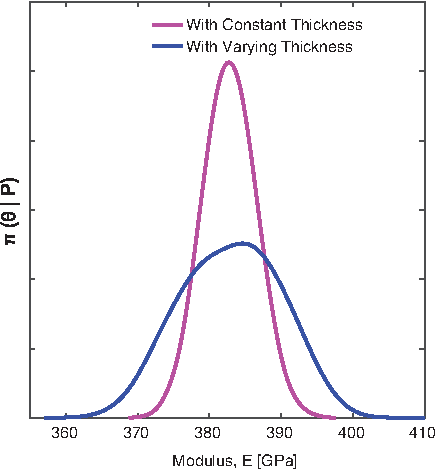
Comparison of the modulus posterior density when thickness is varied versus when it is held constant. Color images are available online.
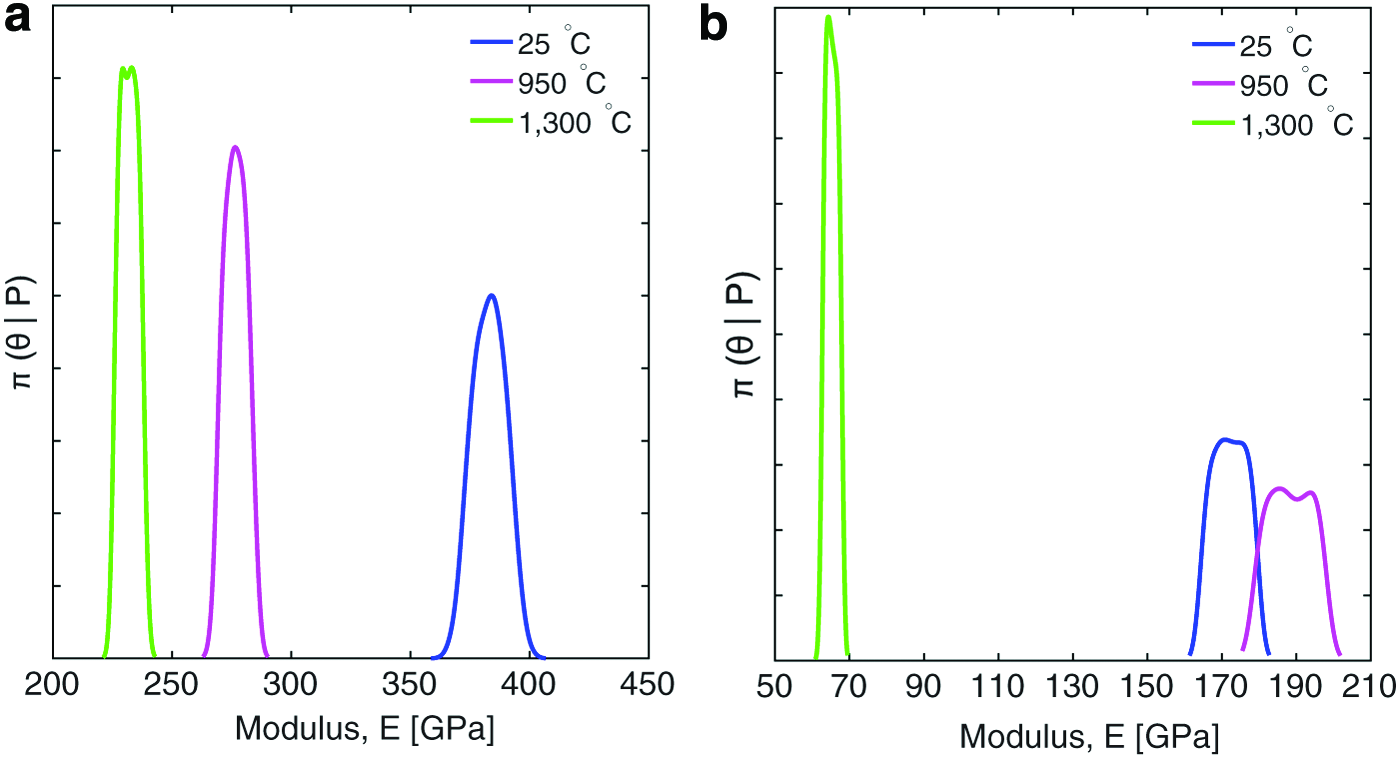
Posterior densities for pristine
Optical Characterization
Polarized microscopy
The laser-machined specimens were also optically characterized using cross-polarized optical microscopy to quantify the presence of birefringence within the laser-ablated zone. Prior measurements using transmission electron microscopy of laser-machined sapphire illustrated a significant amount of dislocations with an ∼5-μm-deep region, 4 suggesting that significant residual stress may be present. This prior analysis was conducted on much thicker specimens relative to the 115μm nominally thick bend bar specimens tested in this study. Therefore, changes in birefringence were quantified for comparisons with thermomechanical measurements. An Olympus BX-60 microscope equipped with transmission cross-polarizers and a digital camera was used to quantify optical characteristics of the laser-machined sapphire bend bars. All images shown were taken after the flexural strength test; however, similar optical characteristics were observed before the bending experiments were conducted. Figure 10 shows the cross-polarized images of the laser-machined specimens. These images are focused on the laser-machined region. The top darker region is the laser-ablated region and corresponds to the center of the bend bars previously shown in Figure 2b schematic. Starting from left to right shows bend bar specimens tested at 25°C, 950°C, and 1,300°C, respectively.
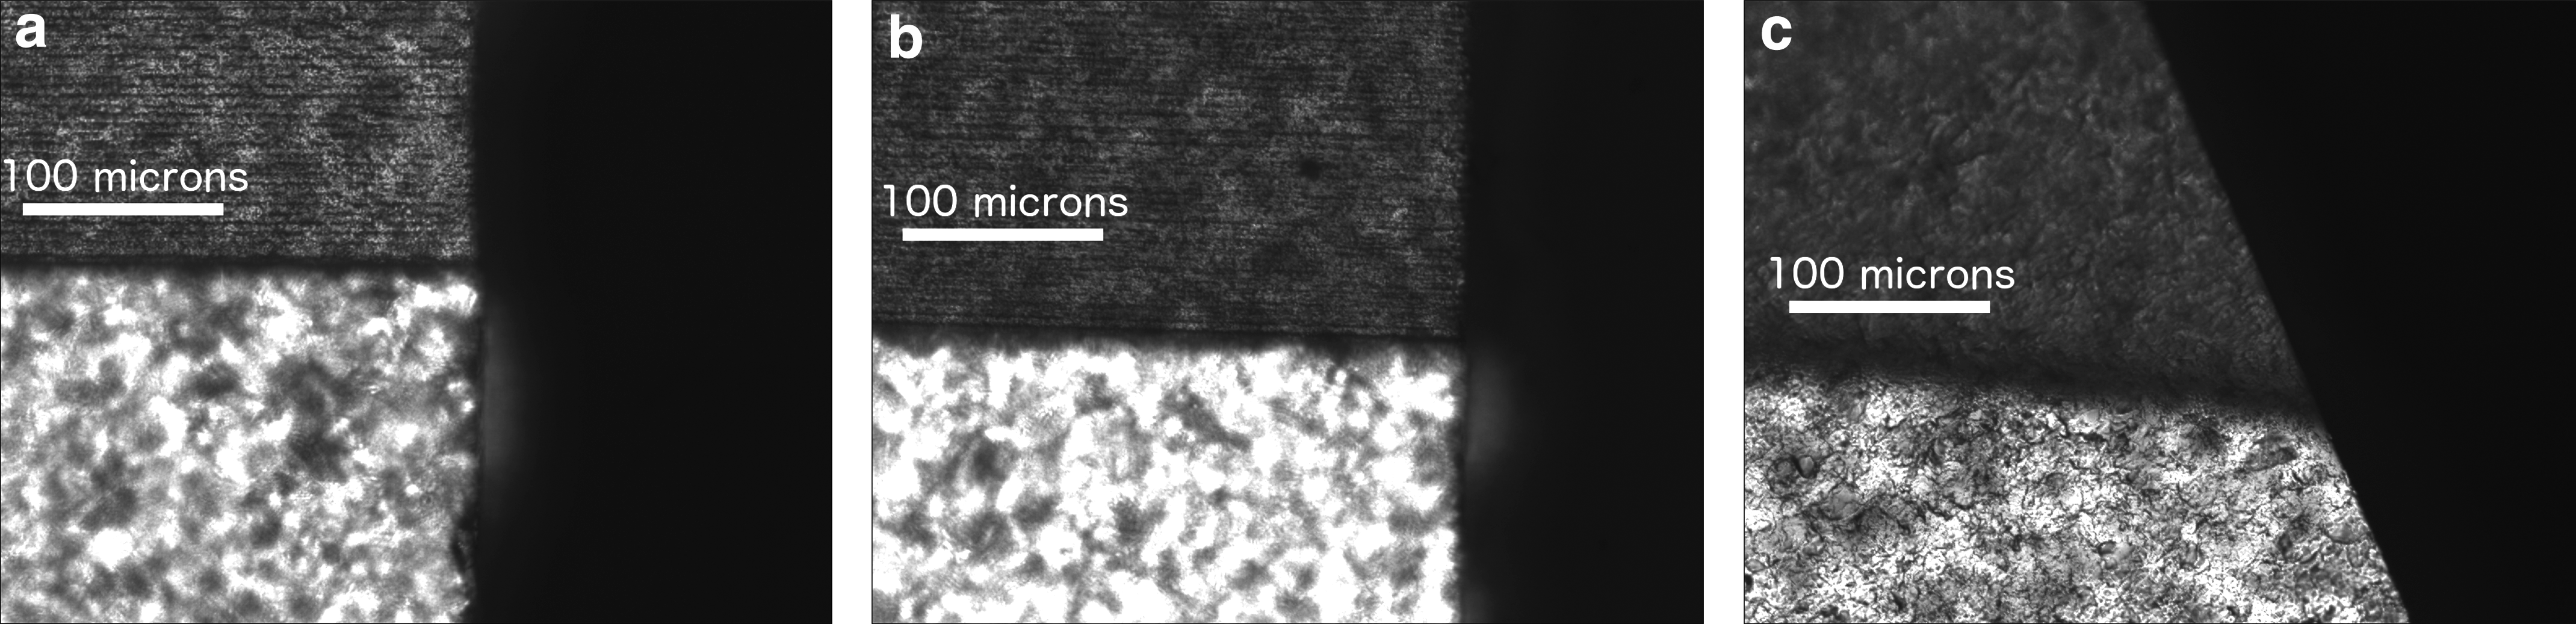
Cross-polarized images with focal plane on laser-machined region of the specimen. The darker zone on the top is the laser-machined region.
The difference in these three specimens is seen from a change in birefringence and surface texture in the laser-machined region. The images show the characteristic horizontal lines in the direction of laser machining for specimens tested at 25°C and 950°C. The surface morphology has changed in the specimen tested at 1,300°C, which more closely resembles the as-received surface morphology in the nonlaser-machined regions. This appearance was not consistent for all samples tested at 1,300°C as some specimens retained the distinct horizontal lines pictured in Figure 10a and b. In Figure 10b, the laser-machined region shows changes in birefringence after testing at 950°C, which may lead to changes in residual stress or metastable phases. These effects are considered in the flexural experiments described in the Thermomechanical Characterization section.
Confocal microscopy
We also review the fracture surfaces using confocal microscopy to identify any differences in the fracture surface as a function of temperature and/or laser-machined subsurface damage. Confocal microscopy is ideal for this analysis as it enables stitching of the images together to obtain a three-dimensional (3D) surface. Figures 11–13 show the confocal images of several bend bar specimens. Images in grayscale are the scanned images of fractured surfaces, while the color part of the figure shows the 3D images in the same region. The surface under tension is marked in each color figure and denotes the surface that was laser machined. The top surface of each grayscale image is the tensile surface in Figures 11 and 13 and the bottom side in Figure 12. The scale and color bar on the images show the heights and depths on the surface. Figure 11 is an image for a pristine specimen at 20 × magnification. Figures 12 and 13 are the laser-machined specimens under 20 × optical zoom tested at 950°C and 1,300°C, respectively. Figure 12 shows a similar fractography pattern to that of Figure 11. These patterns are noticeably missing from the specimen tested at 1,300°C, suggesting a transition in the failure mode at significantly elevated temperatures.
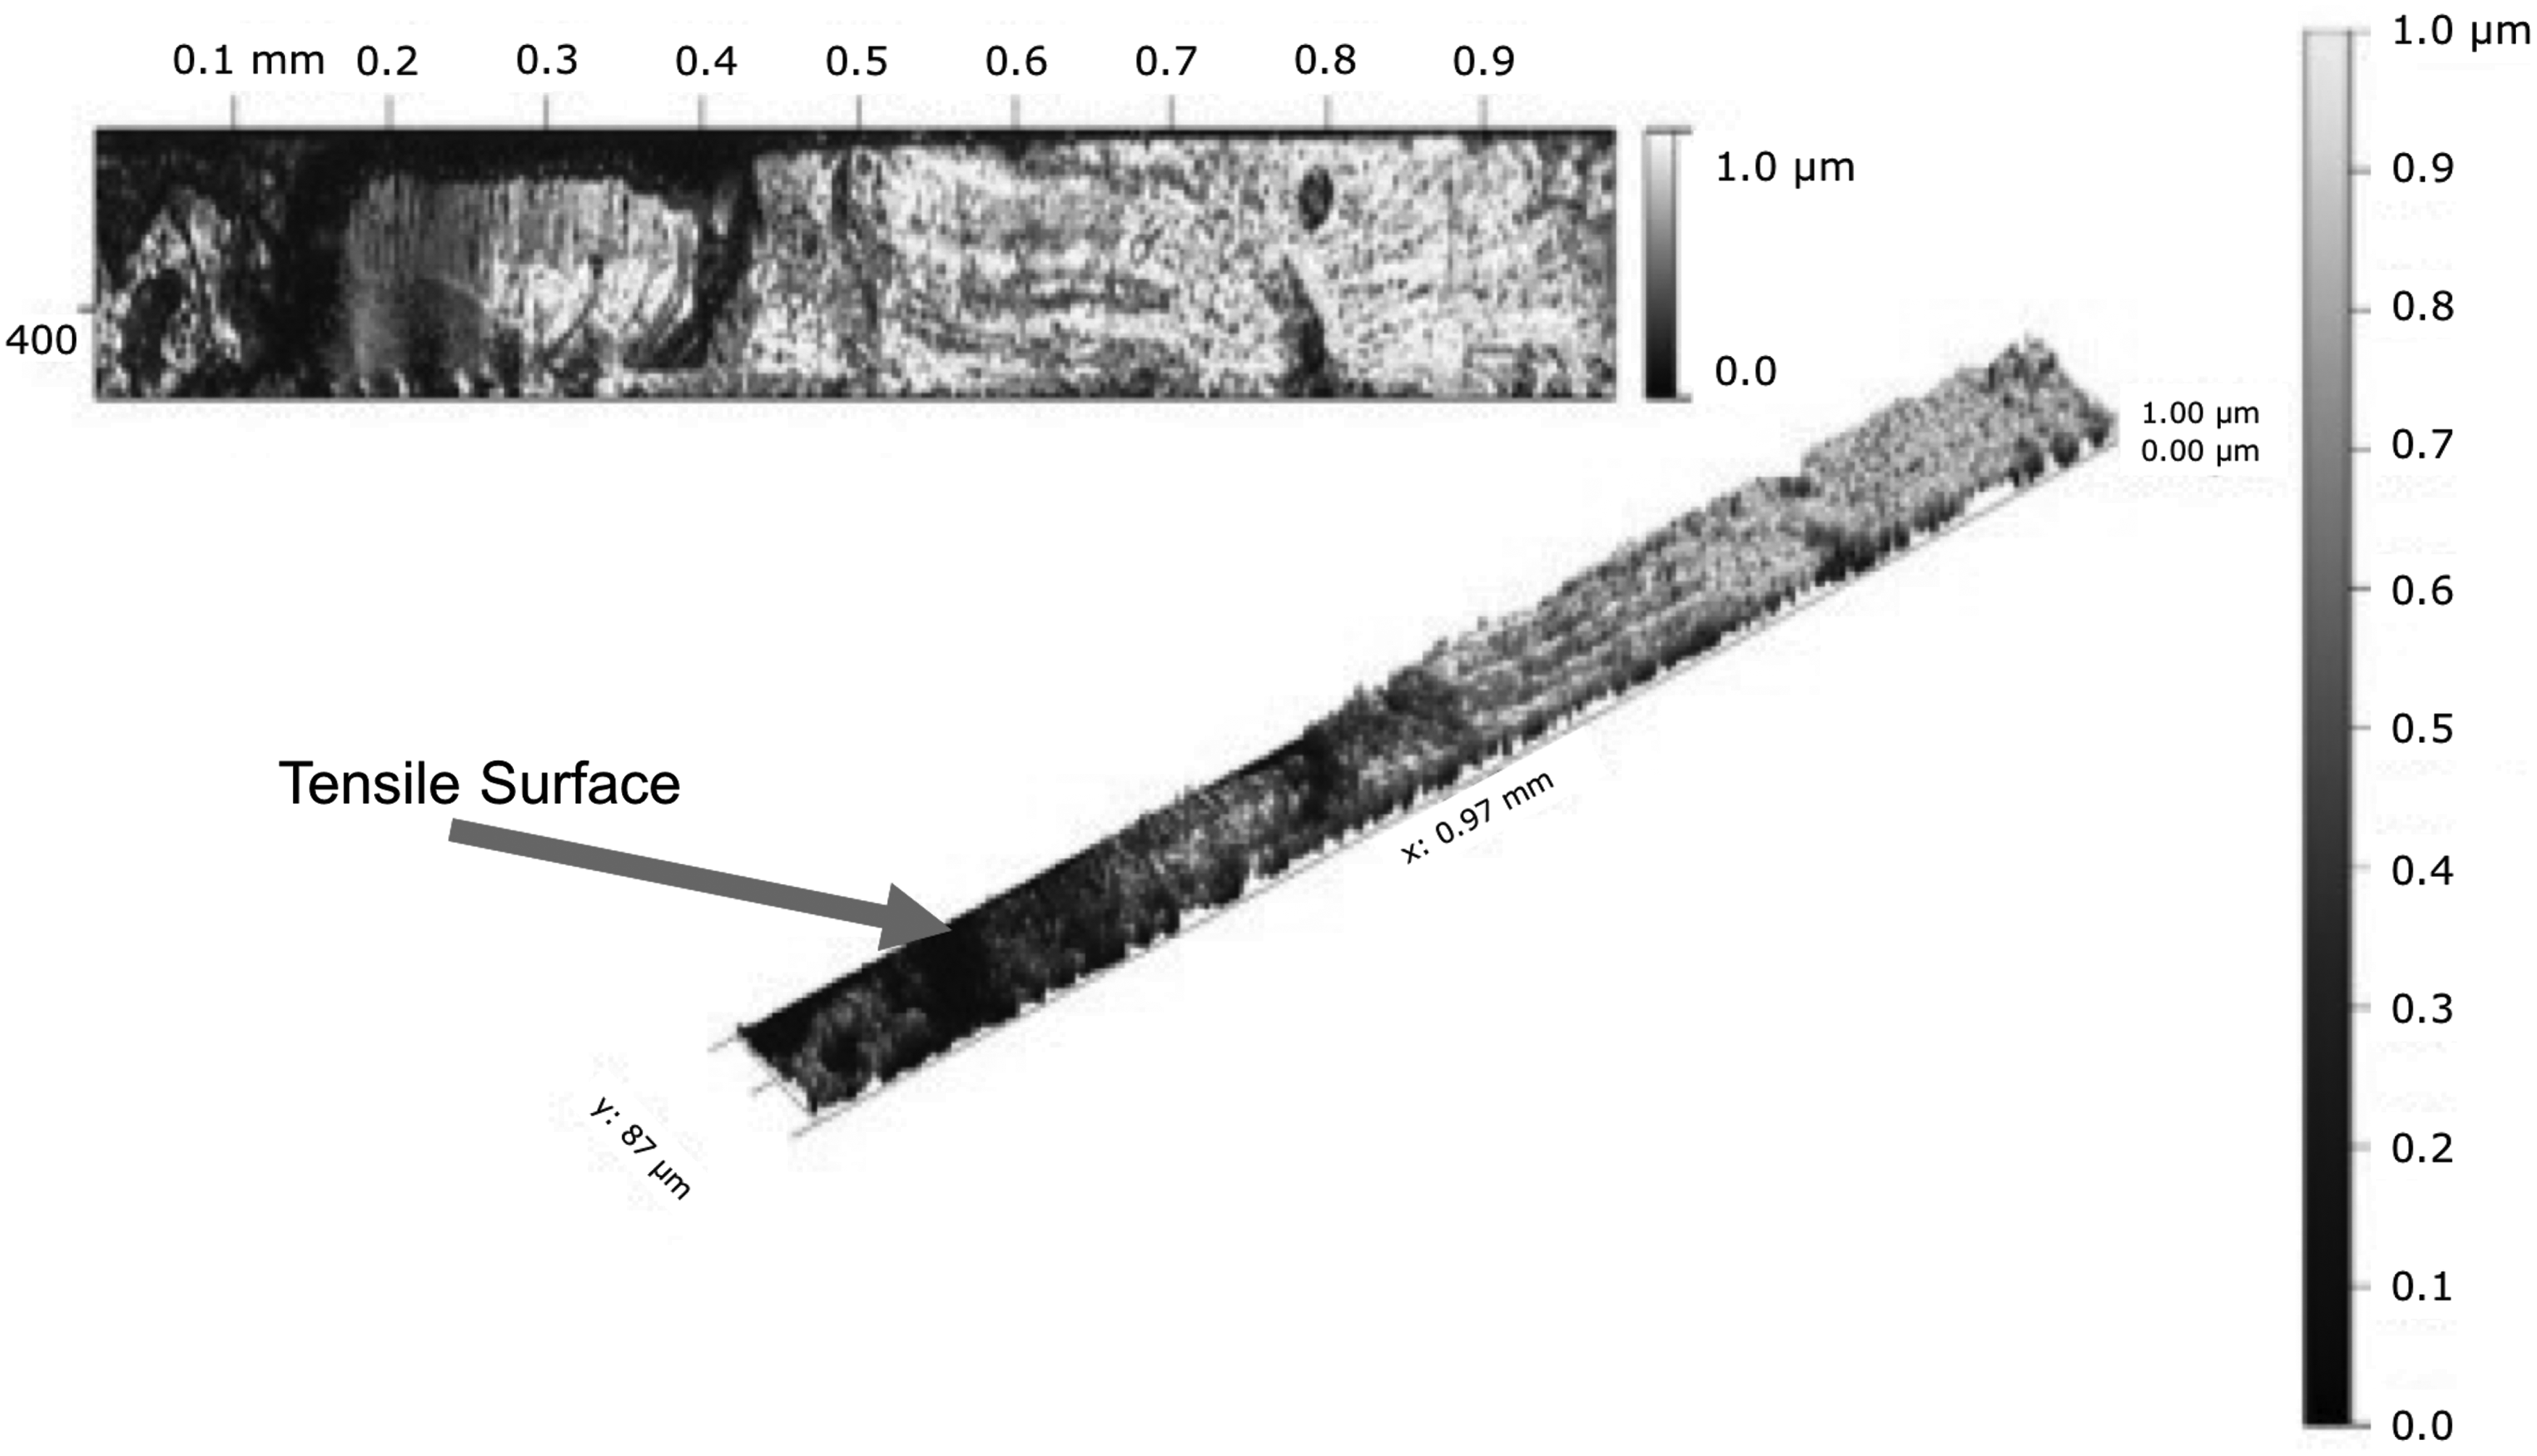
Confocal microscope images for the pristine specimen at 20 × zoom, which was tested at room temperature.

Confocal microscope images for the laser-machined specimen at 20 × zoom, which was tested at 950°C.
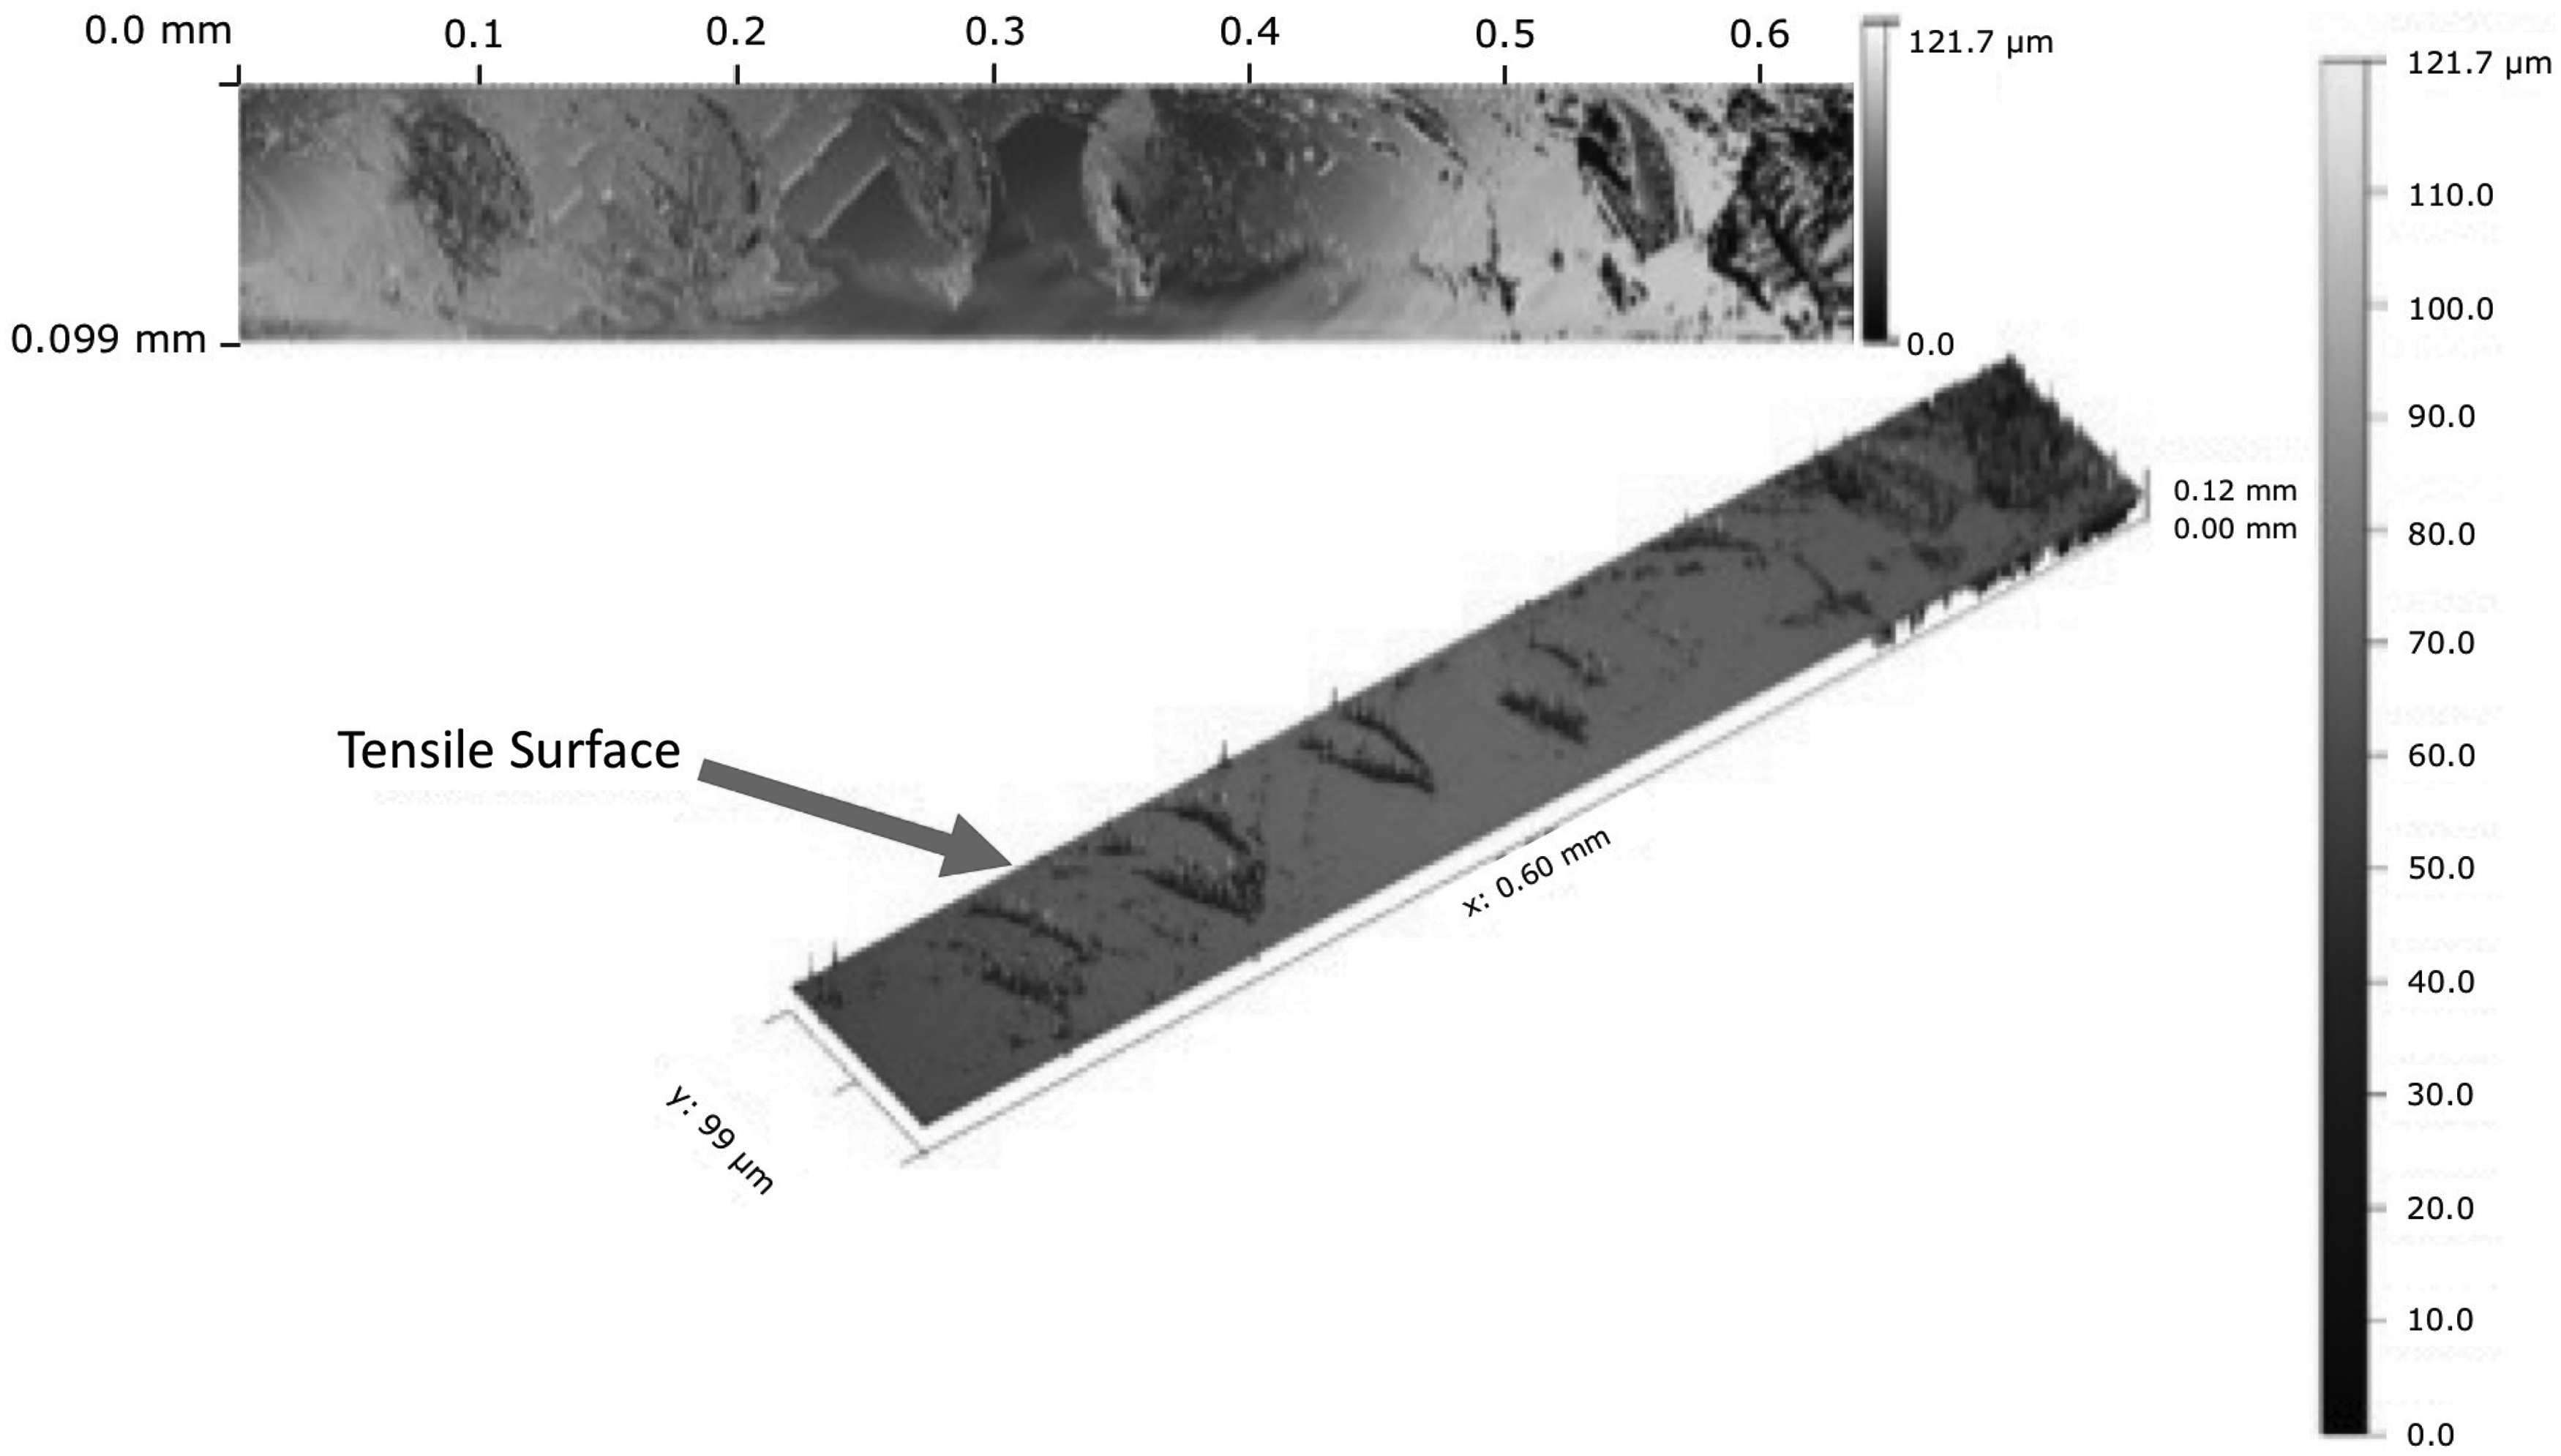
Confocal microscope images for the laser-machined specimen at 20 × zoom, which was tested at 1,300°C.
Concluding Remarks
The aim of the present study has been to quantify the effect of laser machining on the mechanical properties of sapphire at elevated temperatures to accelerate technology transition to high-temperature pressure sensor development. The experiments were performed over a range of high-temperature conditions, yielding results that provide additional information on the strength and elastic properties of the laser-damaged sapphire relative to as-received specimens. These properties are important to design for pressure sensitivity and maximum pressure loading. The laser-ablated sapphire yielded generally higher strength compared with pristine sapphire; however, there was larger variability, which may be due to laser processing and specimen surface roughness. Laser-ablated sapphire exhibited higher average strength at 950°C and 1,300°C, but little increase at 25°C. This trend is different from what is observed for other sapphire crystal cuts. The modulus of the pristine specimens also showed a consistent decrease, as presented in Table 2; however, the laser-machined specimens exhibited an increase at 950°C and a substantial decrease at 1,300°C.
Footnotes
Acknowledgments
The authors greatly appreciate the support from the FAA Commercial Space Transport (CST) Center of Excellence. They also appreciate the laser-machined specimens provided by Dr. Mark Sheplak's research group at the University of Florida.
Author Disclosure Statement
No competing financial interests exist.
APPENDIX A1
Equation (2) was derived using standard beam theory. Appendix Figure A1 shows a schematic of the laser-machined beam and the relevant geometry and boundary conditions.
The beam was split into the three regions shown in Appendix Figure A1, where regions 1 and 2 have pristine properties and region 3 has laser-machined properties. The leftmost vertical boundary of region 1 corresponds to
where P is again the load, x is the position along the beam, and M is the reactionary moment resulting from the applied load. This was done for all sections of the beam and results in the following set of equations:
To get the equations for the slope of the beam, the moment was divided by the moment of inertia, I, and elastic modulus, E, corresponding to the region. It was then integrated with respect to x resulting in the following set:
where Ci represents integration constants, and where the subscripts PR and LM correspond to pristine and laser-machined properties, respectively. The equations for the displacement were determined by integrating Equation (12) with respect to x, resulting in the following:
The integration constants were determined using the following set of boundary conditions, which satisfy continuity in slopes and displacements:
By solving for the integration constants using the boundary conditions, the equations for the displacement can be obtained.
To obtain the equation used in the Bayesian analysis, the equation relating the load and displacement at the point of loading,
where