
Abstract
Water ice in the form of debris covered glaciers or ice sheets that could be up to hundreds of meters thick has been discovered and mapped in the mid latitude of Mars. This presents a unique opportunity for in situ resource utilization (ISRU) of water, where the location could be favorable for a future human base. Under NASA funding, Honeybee Robotics developed and demonstrated water extraction from subsurface ice with a Technology Readiness Level (TRL) 5 RedWater system in a Mars-simulated environment that utilizes 2 proven terrestrial technologies: coiled tubing (CT) and the Rodriguez well (a.k.a. RodWell). CT is a continuous length of tube (metal or composite) that is unspooled from the surface and can be used to advance a bottom hole assembly through the overburden layer and into the underlying ice. The RodWell is a method of melting a well in subsurface ice and pumping the liquid water to the surface, which has been demonstrated and used to support polar operations in both Greenland and Antarctica. The aim of this article is to report the results of end-to-end testing of the TRL-5 RedWater system in −60°C ice and at Mars ambient pressure (and compare the results obtained in an Earth ambient environment). The performance of the system was evaluated in terms of drilling with pneumatic cuttings clearing, melting a well, and extracting the water from the well to a tank at the surface. After performance evaluation, the validated figures of merit may serve as input to higher level efforts, such as the design and development of integrated, water-rich habitat system architectures that rely on ISRU-derived water.
Introduction
Water is a key resource to sustain future astronaut missions to Mars where NASA wants to establish a permanent human base in the coming decades. Instead of bringing water from the Earth, it can be mined directly from the Martian subsurface and used to produce drinking water, oxygen, and fuel. In the past decade, orbital measurements revealed that a third of the Martian surface contains shallow ground ice (Fig. 1). Mars Reconnaissance Orbiter Shallow Radar (SHARAD) revealed that lobate-debris aprons are, in fact, debris-covered glaciers with very high-water ice content. 1
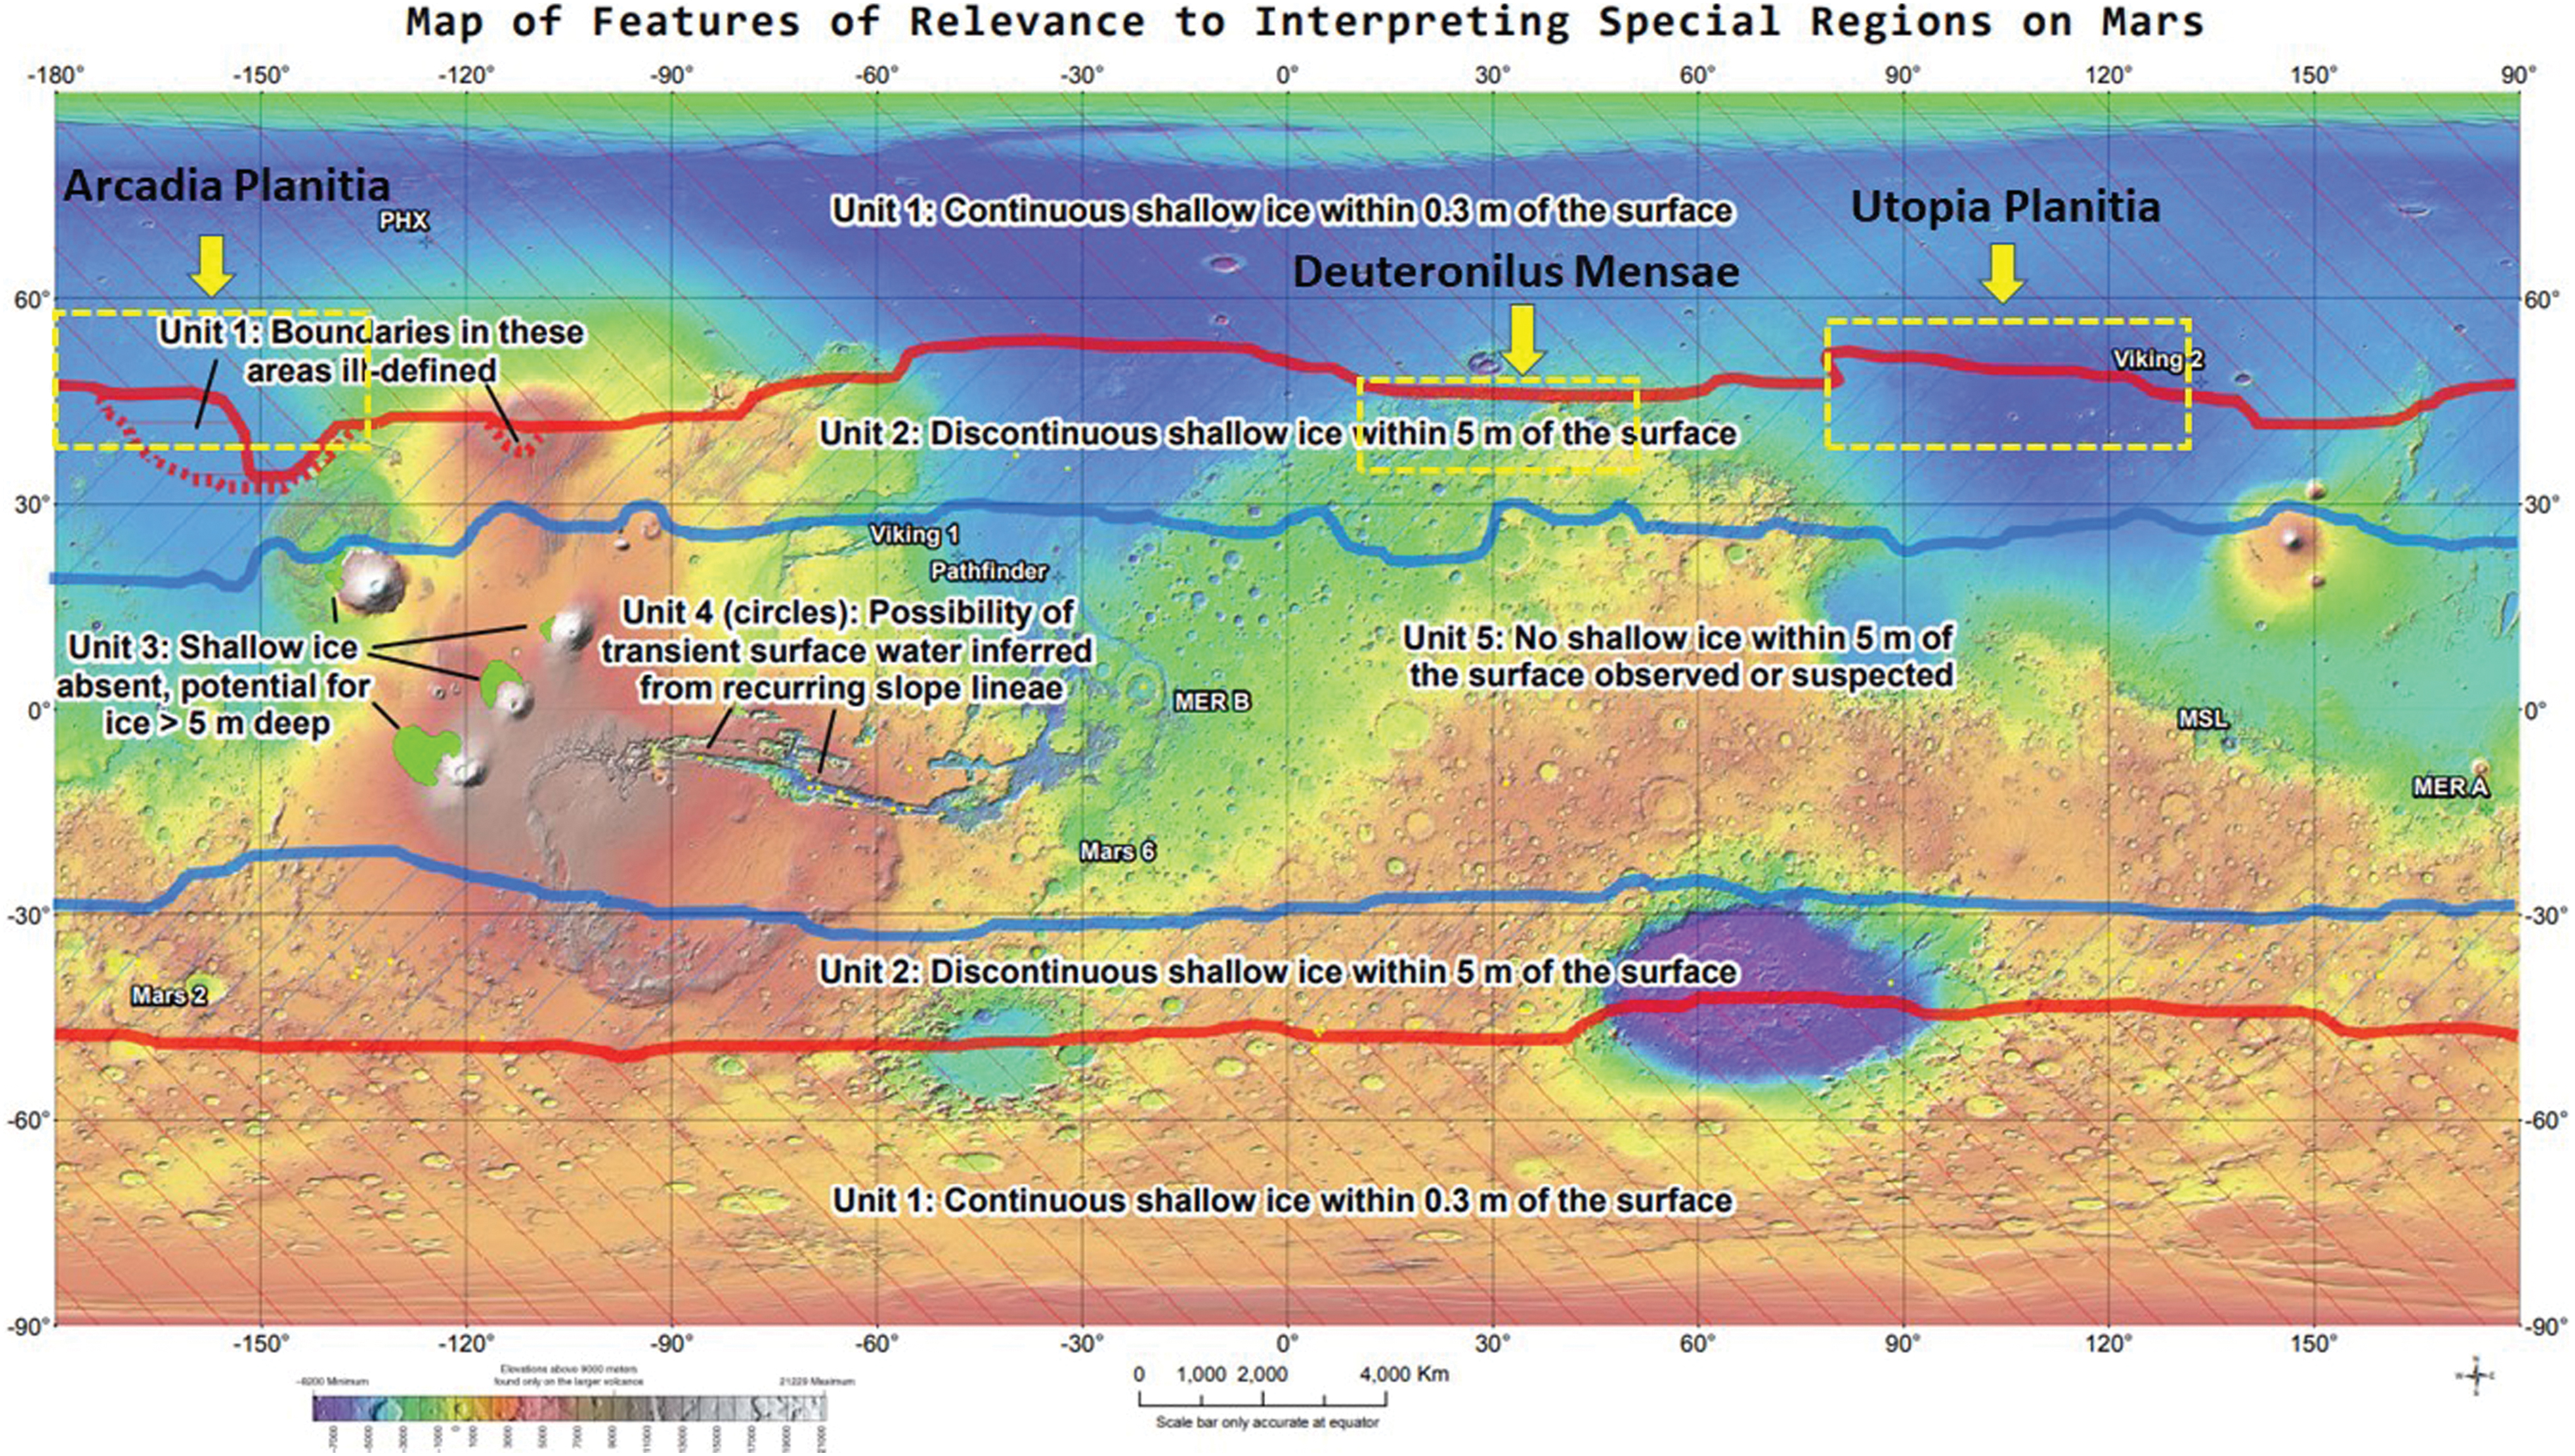
Interpretive map of the likely depth of Martian ice developed by MEPAG Special Regions Science Analysis Group (SR-SAG2) with approximate location of possible regions of interest (yellow dotted squares) for a future ISRU mission added by the author. Credit Rummel et al. (2014). ISRU, In Situ Resource Utilization. Color images are available online. 6
SHARAD data have also been used to identify and map mid-latitude buried ice sheets in Arcadia Planitia and Utopia Planitia that are up to 80 and 170 m thick, respectively,2,3 and may contain a high fraction of water ice. 4 Both regions contain ice volumes of thousands of cubic kilometers. Debris covered glaciers up to 1 km thick have also been discovered in regions such as Deuteronilus Mensae. 1 The vertical resolution of the available radar sounding data is limited to ∼10 m, and the penetration depths of other methods of water detection (e.g., neutron-spectrometer detections of hydrogen) are limited to the upper meter. 5
Thus, to reach and extract water, a system would need to first penetrate through at most 10–20 m of overburden. The discoveries of nearly pure ice deposits in mid-latitudes on Mars justify implementing 2 proven terrestrial technologies: coiled tubing (CT) for drilling and Rodriquez Well or RodWell for water extraction (Figs. 2 and 3).

RoXplorer terrestrial CT Rig. CT, coiled tubing. Photo Credit MinEx CRC. Color images are available online.
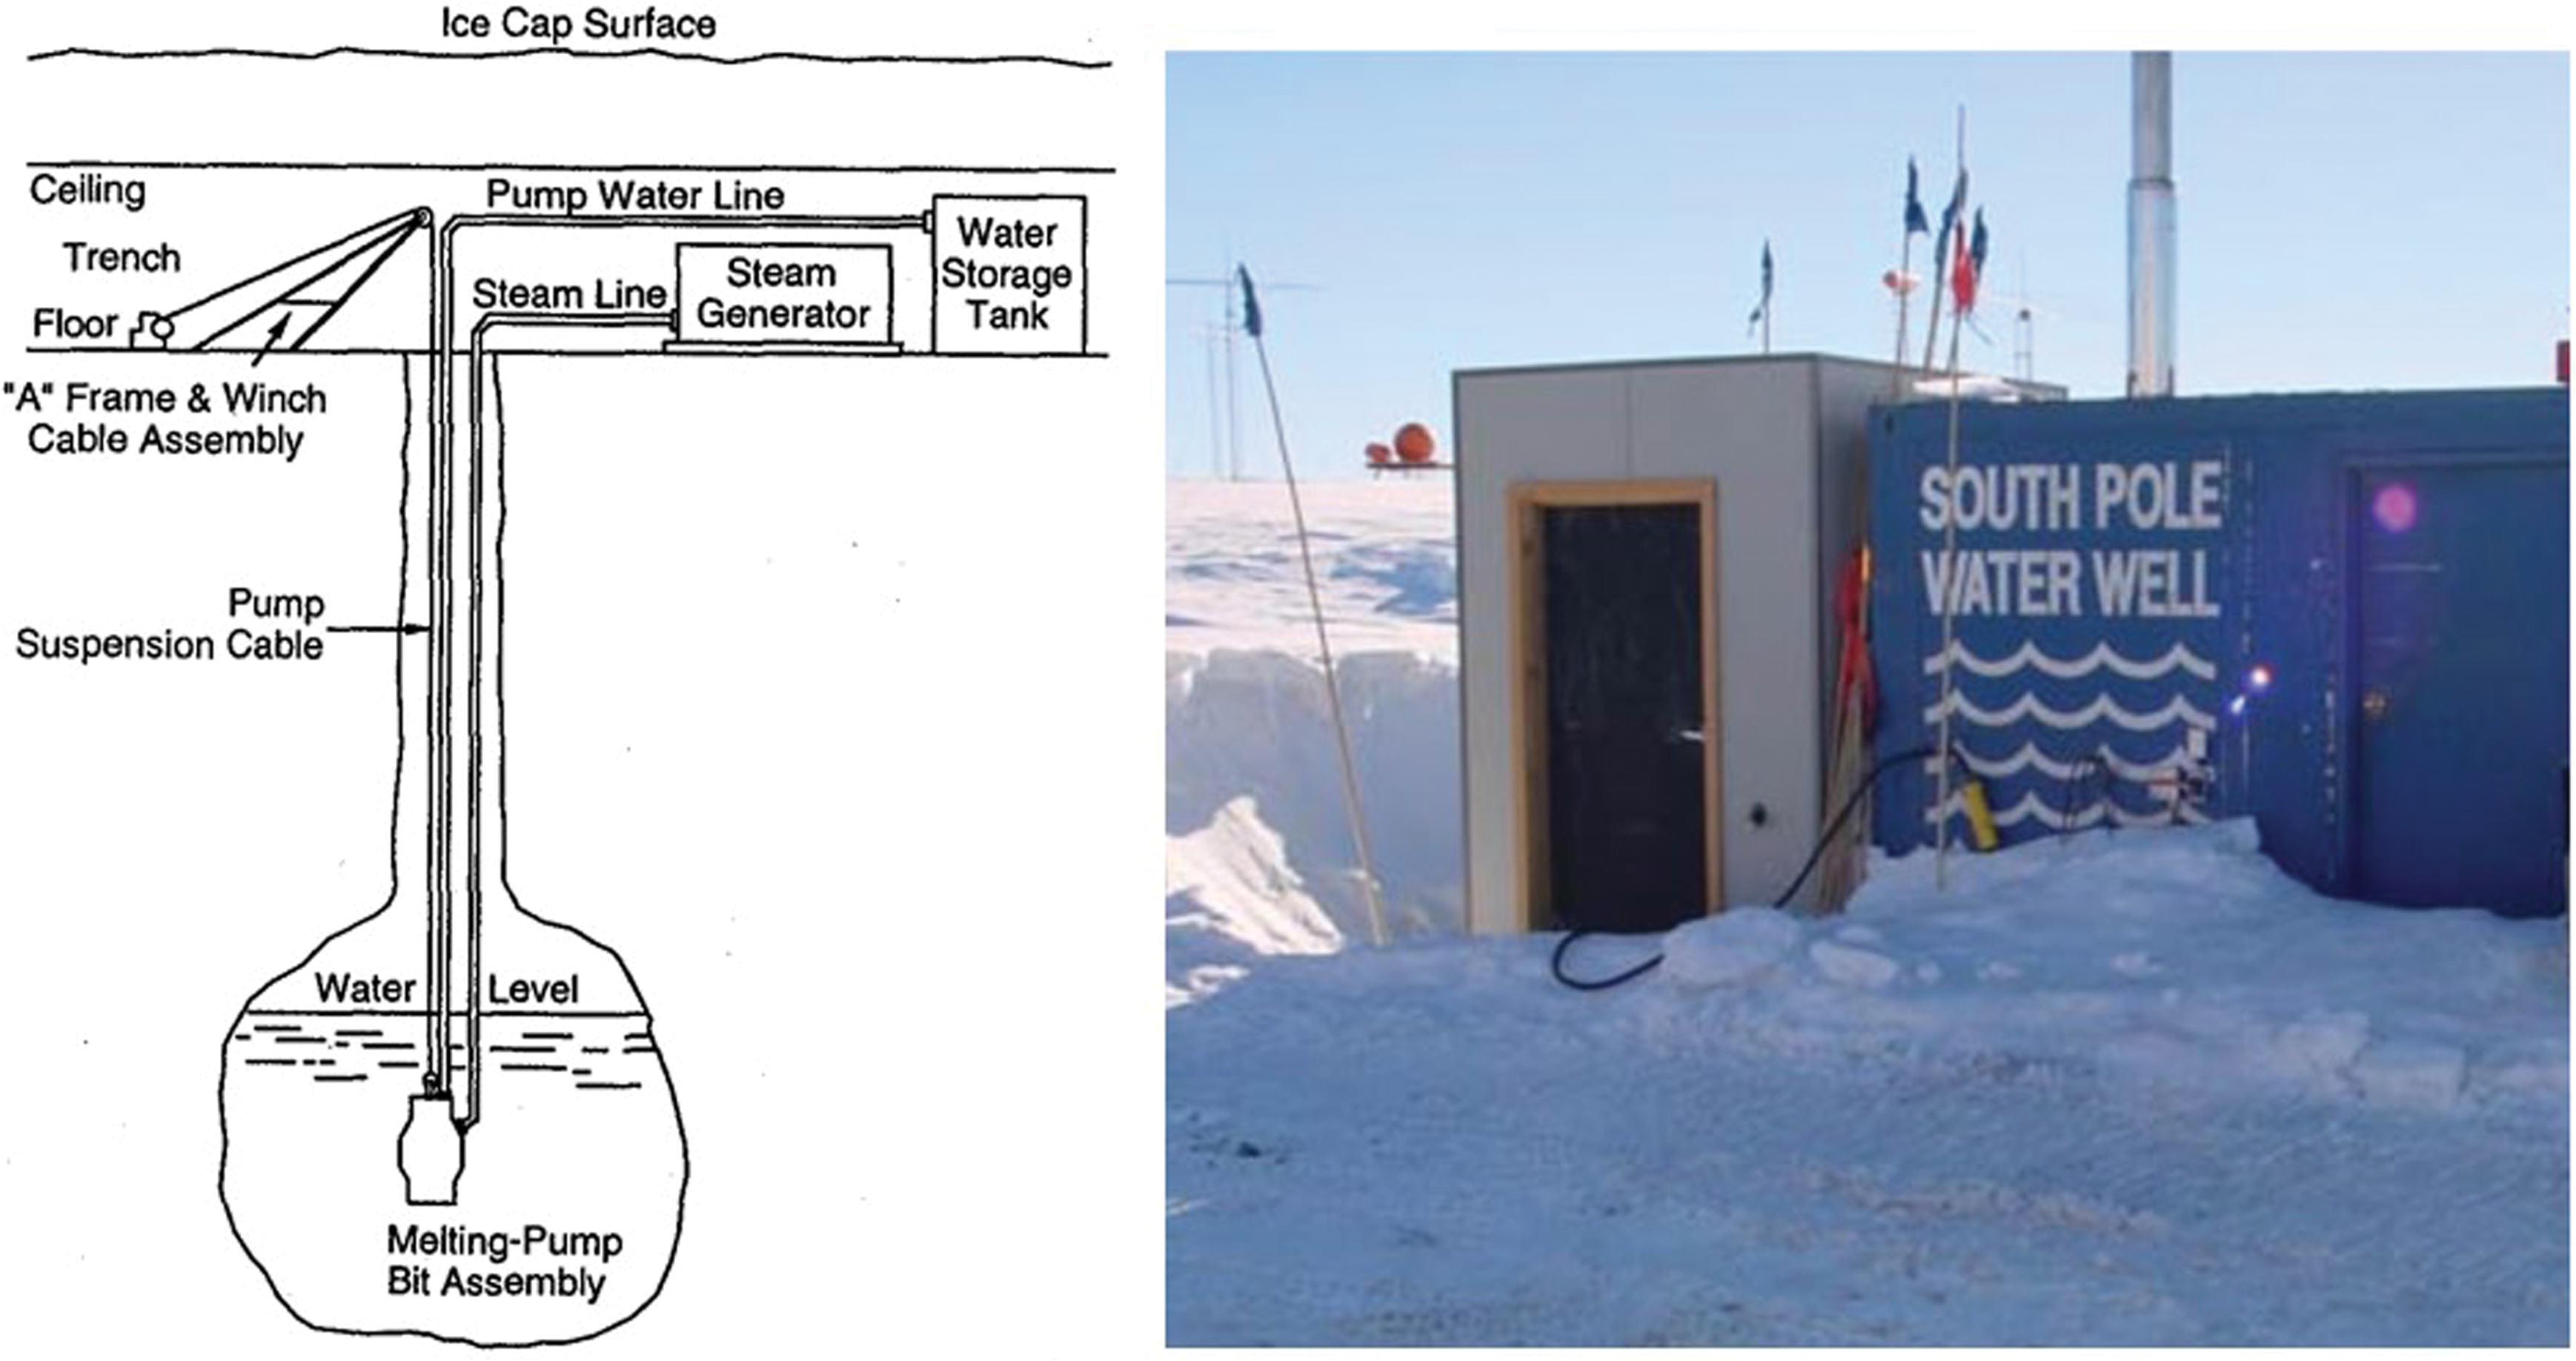
Left: Equipment used in a RodWell at Camp Century, Greenland. 7 Credit: Lunardini and Rand (1995). Right: photo from 2001 of the RodWell structure housing at the South Pole Station, Antarctica. 8 Photo Credit: Gerald Przybylski. Sourced from: https://www.southpolestation.com/trivia/rodwell/rodwell.html Color images are available online.
What Is RedWater
CT rigs use a continuous length of tubing (metal or composite) that is flexible enough to be wound on a reel and rigid enough to react drilling forces and torques. The tube is pushed downhole by using injectors (often a set of actuated rollers that pinch the tube and advance it down). The end of the tube has a Bottom Hole Assembly (BHA) consisting of a motor and a drill bit. A hole is drilled by advancing CT deeper into the subsurface while blowing cuttings out of the way with compressed air (or drilling mud). Commercial CT rigs such as RoXplorer (Fig. 2) typically weigh 15 tons and can drill to 500 m depth at 1 m/min in hard rock.
A RodWell is a technology that relies on continuous heating and recirculation of water to melt out a large subglacial cavity. A hole is first drilled in ice to a stable depth below the overburden and firn; then, water must prime the system so that pumping can begin. The water is then pumped to the surface, where it is heated and pumped back down into the well. Only after a large volume of liquid water has been created does extraction begin, siphoning off a fraction of the water pumped up before it is heated and pumped back downhole. This architecture was first designed and built by the U.S. Army Corps Engineers Cold Regions Research & Engineering Laboratory in the late 1950s and early 1960s in Greenland 7 and has also been used in recent years at the South Pole Station in Antarctica as the main source of fresh water (Fig. 3). 9
The RedWater system combines the 2 technologies into 1 (Figs. 4 and 5). It uses the CT to advance the BHA as it drills a hole by using a rotary-percussion mechanism that allows the system to be material agnostic to formation strength (a similar mechanism was implemented in Honeybee Robotics WATSON Planetary Deep Drill). 10 During drilling, compressed gas is sent downhole via the tubes in the CT and the gas escapes at the bottom in the annular space between the BHA and the borehole wall removing cuttings (step 1 of concept of operations [conops]; Fig. 6) that can be collected for analyses at the surface.

The BHA with main components labeled. BHA, bottom hole assembly. Color images are available online.

The injector system consists of drive rollers that deploy the CT off a 16-inch drum and advance the BHA as it drills into the underlying ice. Color images are available online.
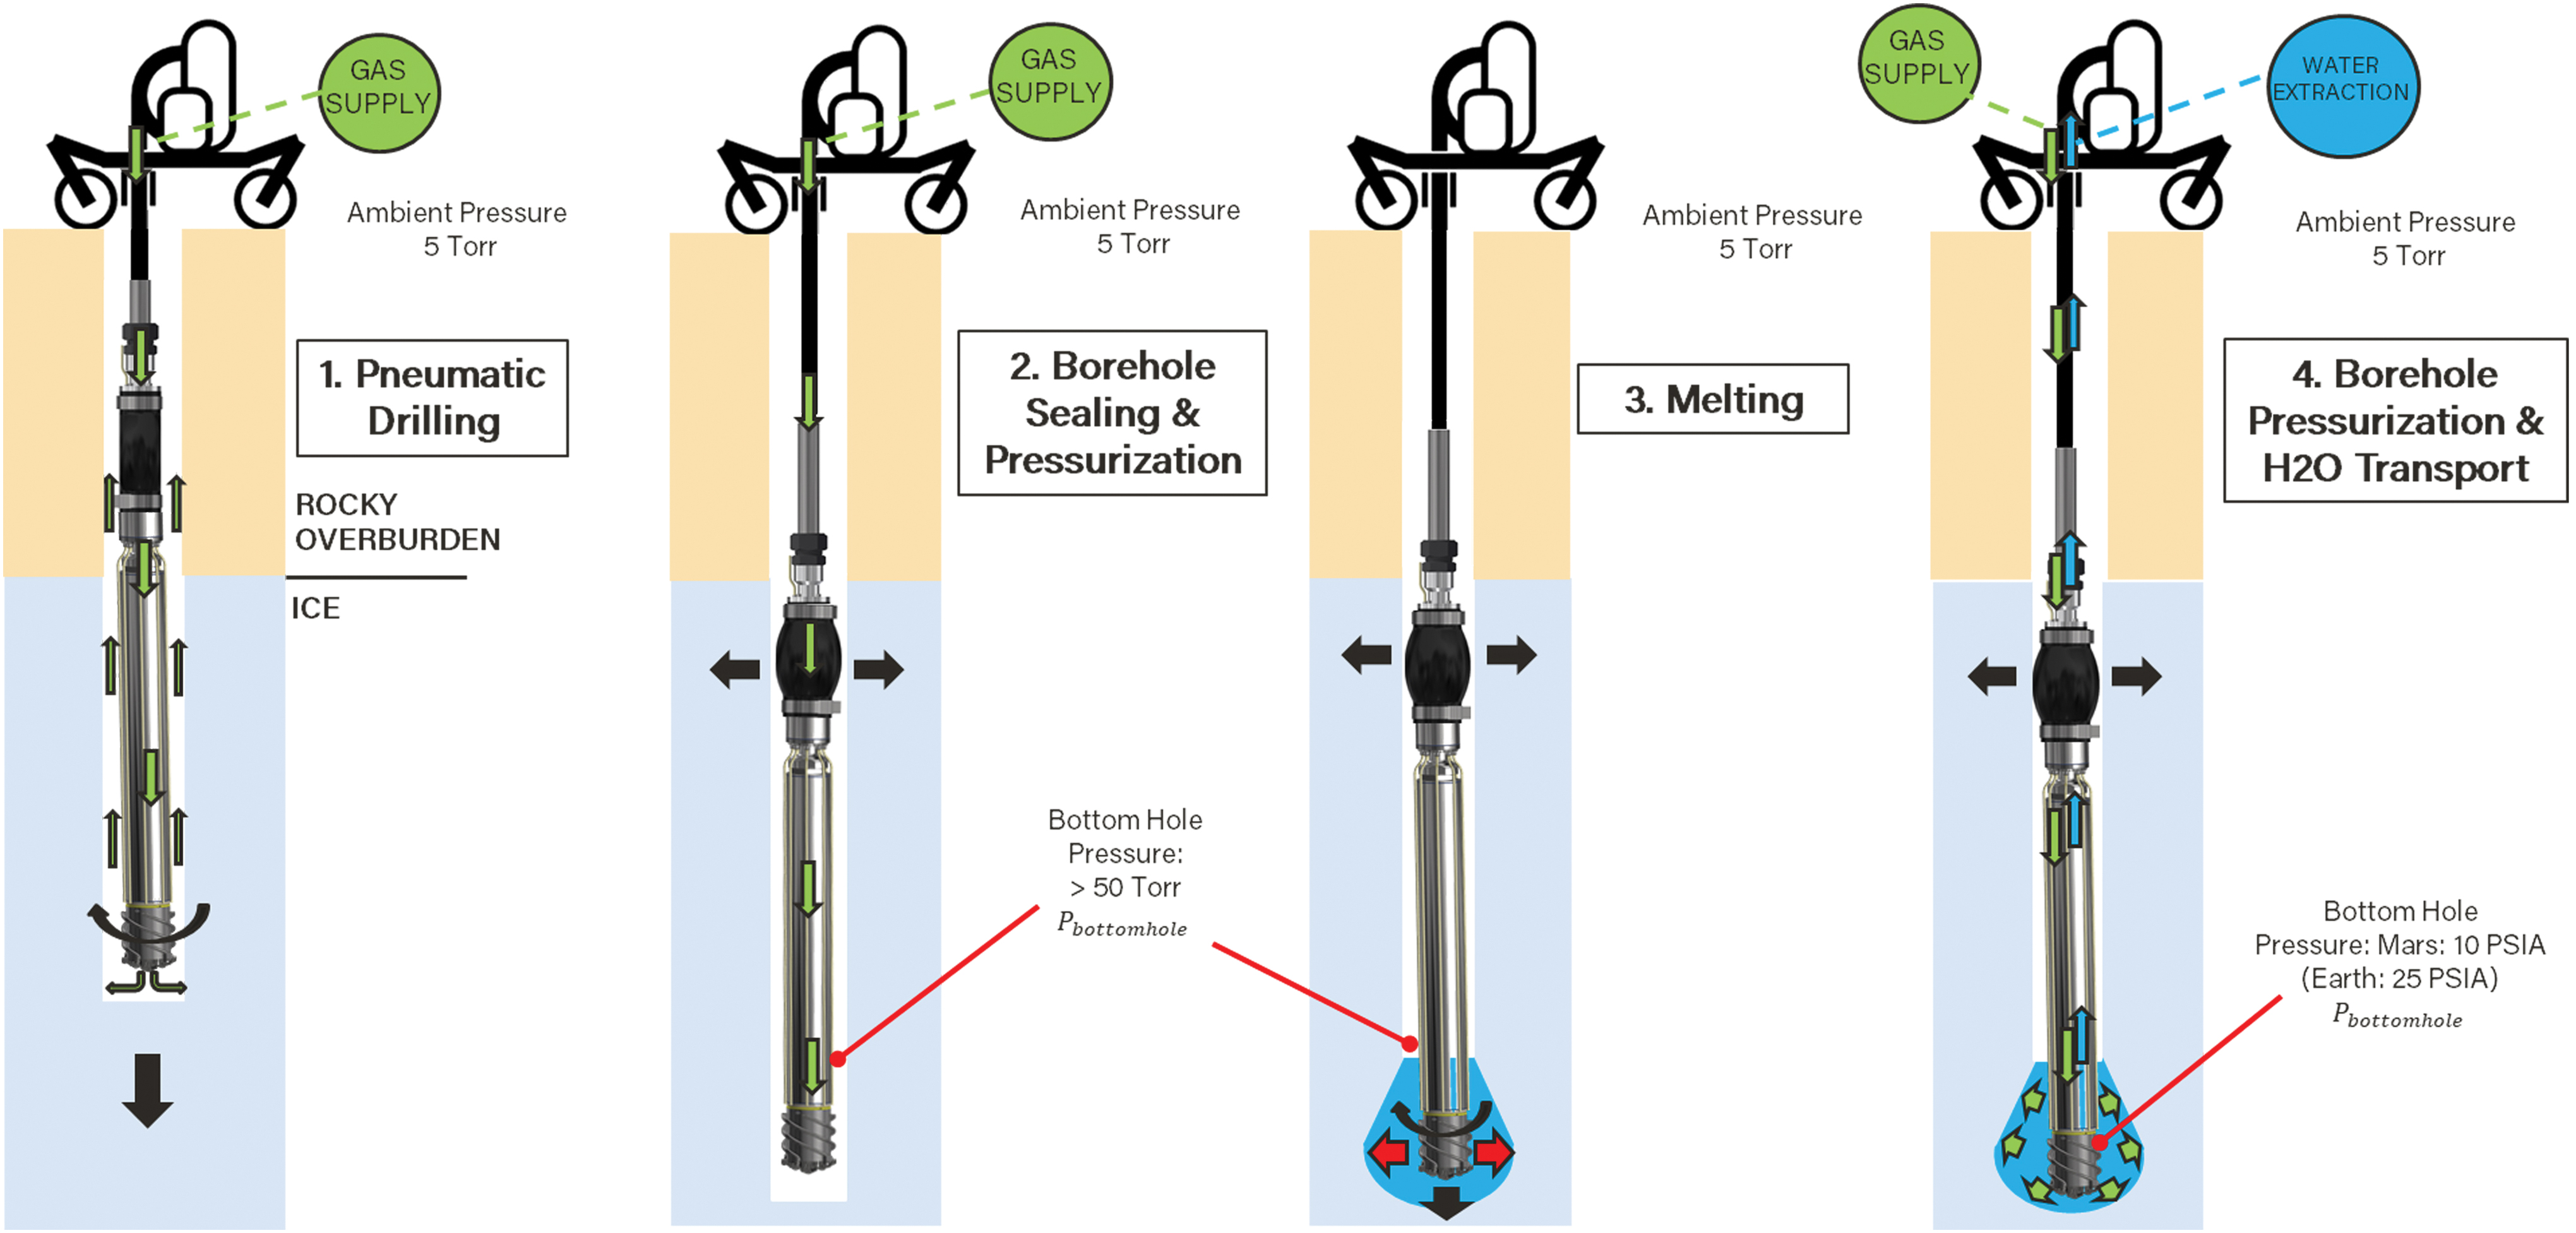
RedWater system conops. Color images are available online.
On reaching an ice layer, drilling continues for another ∼1 m or until the packer (i.e., inflatable seal) is fully embedded within the ice. The CT stops advancing the BHA, and the packer is inflated to seal the borehole (step 2) isolating it from the Mars ambient pressure, which can be near or below the triple point of water. As the auger continues to spin, heaters in the auger are turned on to melt the surrounding ice (step 3).
The sealed borehole is pressurized slightly to prevent water sublimating and allow melting. Once the ice has melted and formed a sufficiently large well, the gas from the surface is used to pressurize the borehole and at the same time pump the melted water up into a storage tank (step 4) on the surface via a 3-way valve, which switches between the gas tank and the water tank. Using the auger to “stir” the melted water speeds up the melting process. After extracting a portion of the liquid water, the CT is reactivated to continue to melt a deeper well or to drill further into the underlying ice and begin a new well.
Objectives
The main objective is to develop Technology Readiness Level (TRL)-5 technology and demonstrate its end-to-end functionality as an in situ resource utilization (ISRU) water extraction system in Mars simulated conditions (ice temperature and ambient pressure), which includes: (1) drilling in ice with/pneumatics to clear cuttings, (2) melting a well in subsurface ice, and (3) pumping or extracting the melt water to the surface.
Before system-level testing, various TRL-4 breadboards were built and tested per Table 1 to validate models and ensure the subsystems functionally check out before integration. An end-to-end test was performed in a 5 m tall walk-in freezer at Honeybee with sintered clear ice blocks, which were held at approximately −5°C to −10°C before performing the test under Mars simulated conditions under vacuum. This allowed to refine system operations by making any necessary modifications, which are more difficult and labor intensive once the system is being tested in a thermal vacuum chamber (TVAC).
High-Level Objectives for the Technology Readiness Level-4 Breadboard and Technology Readiness Level-5 System Testing
BHA, bottom hole assembly; TRL, Technology Readiness Level; TVAC, thermal vacuum chamber.
Materials and Methods
The RedWater system was tested under Mars simulated conditions at Honeybee in a 3.5 m tall Mars TVAC, where both the ambient pressure and ice temperature were controlled to ∼5 Torr and −60°C, respectively. The ice temperature was based on annual surface temperature data from the Viking2 site (similar latitude to Arcadia Planitia), with surface temperatures fluctuating between −110°C and −5°C and a thermal wave estimated to extend to about 2–6 m depth according to thermal models. 11
Thus, at 20 m depth, the ice temperature is likely to be −60°C or warmer since the subsurface ice temperature is an average of these fluctuations and warms up with depth. In comparison, the temperature of ice below 8 m at the South Pole station is approximately −50°C. 12
Ice Sample Preparation
The ice sample took several days to prepare. It involved stacking three 10 × 10 × 20-inch clear sculpture ice blocks inside a metal drum and freezing them in one by one with ice water filling the annular space and fusing the blocks together (Fig. 7). This process was done in a walk-in-freezer at approximately −15°C. The metal drum measured 138 cm H × 46 cm outer diameter (OD) and consisted of (2) 30-gallon drums that were welded together. Copper coils were wrapped on the outside of the drum for liquid nitrogen (LN2) cooling. There are a few reasons worth mentioning why clear sculpture ice blocks were used for both breadboard and system-level testing:

Left: clear sculpture ice blocks measuring 10 × 10 × 20 inches were stacked on top of each other and frozen together by filling the annulus gap in a 0.46 m OD × 1.4 m tall metal drum with ice water. Right: The drum was wrapped on the outside with copper coils for LN2 cooling (not shown is the outer layer of insulation). Once the water was completely frozen, TCs were installed by drilling holes from the side of the drum used to monitor ice temperature and well growth. LN2, liquid nitrogen; OD, outer diameter; TC, thermocouple. Color images are available online.
The ice is a homogenous, non-porous, and impermeable material that is suitable for the characterization of drilling performance and comparing between different testing conditions (e.g., rotary percussive drilling in −60°C ice vs. −5°C ice where the latter was performed earlier as part of the system-level testing and functional checkouts in the freezer).
It speeds up the freezing process. Freezing water in the drum without the ice blocks in a −15°C to −20°C ambient temperature would likely take a week or more.
The sculpture ice is transparent, and, thus, the well growth and the BHA position relative to the well can be visually monitored and measured directly. This was successful with stacked sculpture ice blocks in the freezer testing. However, for TVAC testing, LN2 coils wrap around a drum and the view of the ice blocks is obstructed.
To measure the well growth for the TVAC testing, a thermocouple (TC) matrix was installed in the lower section of the ice sample (Fig. 8) where the well was expected to form. This allowed monitoring of the well during testing and enabled more accurate estimates of the rate of growth post-test, taking into account the TC locations with respect to the well center.
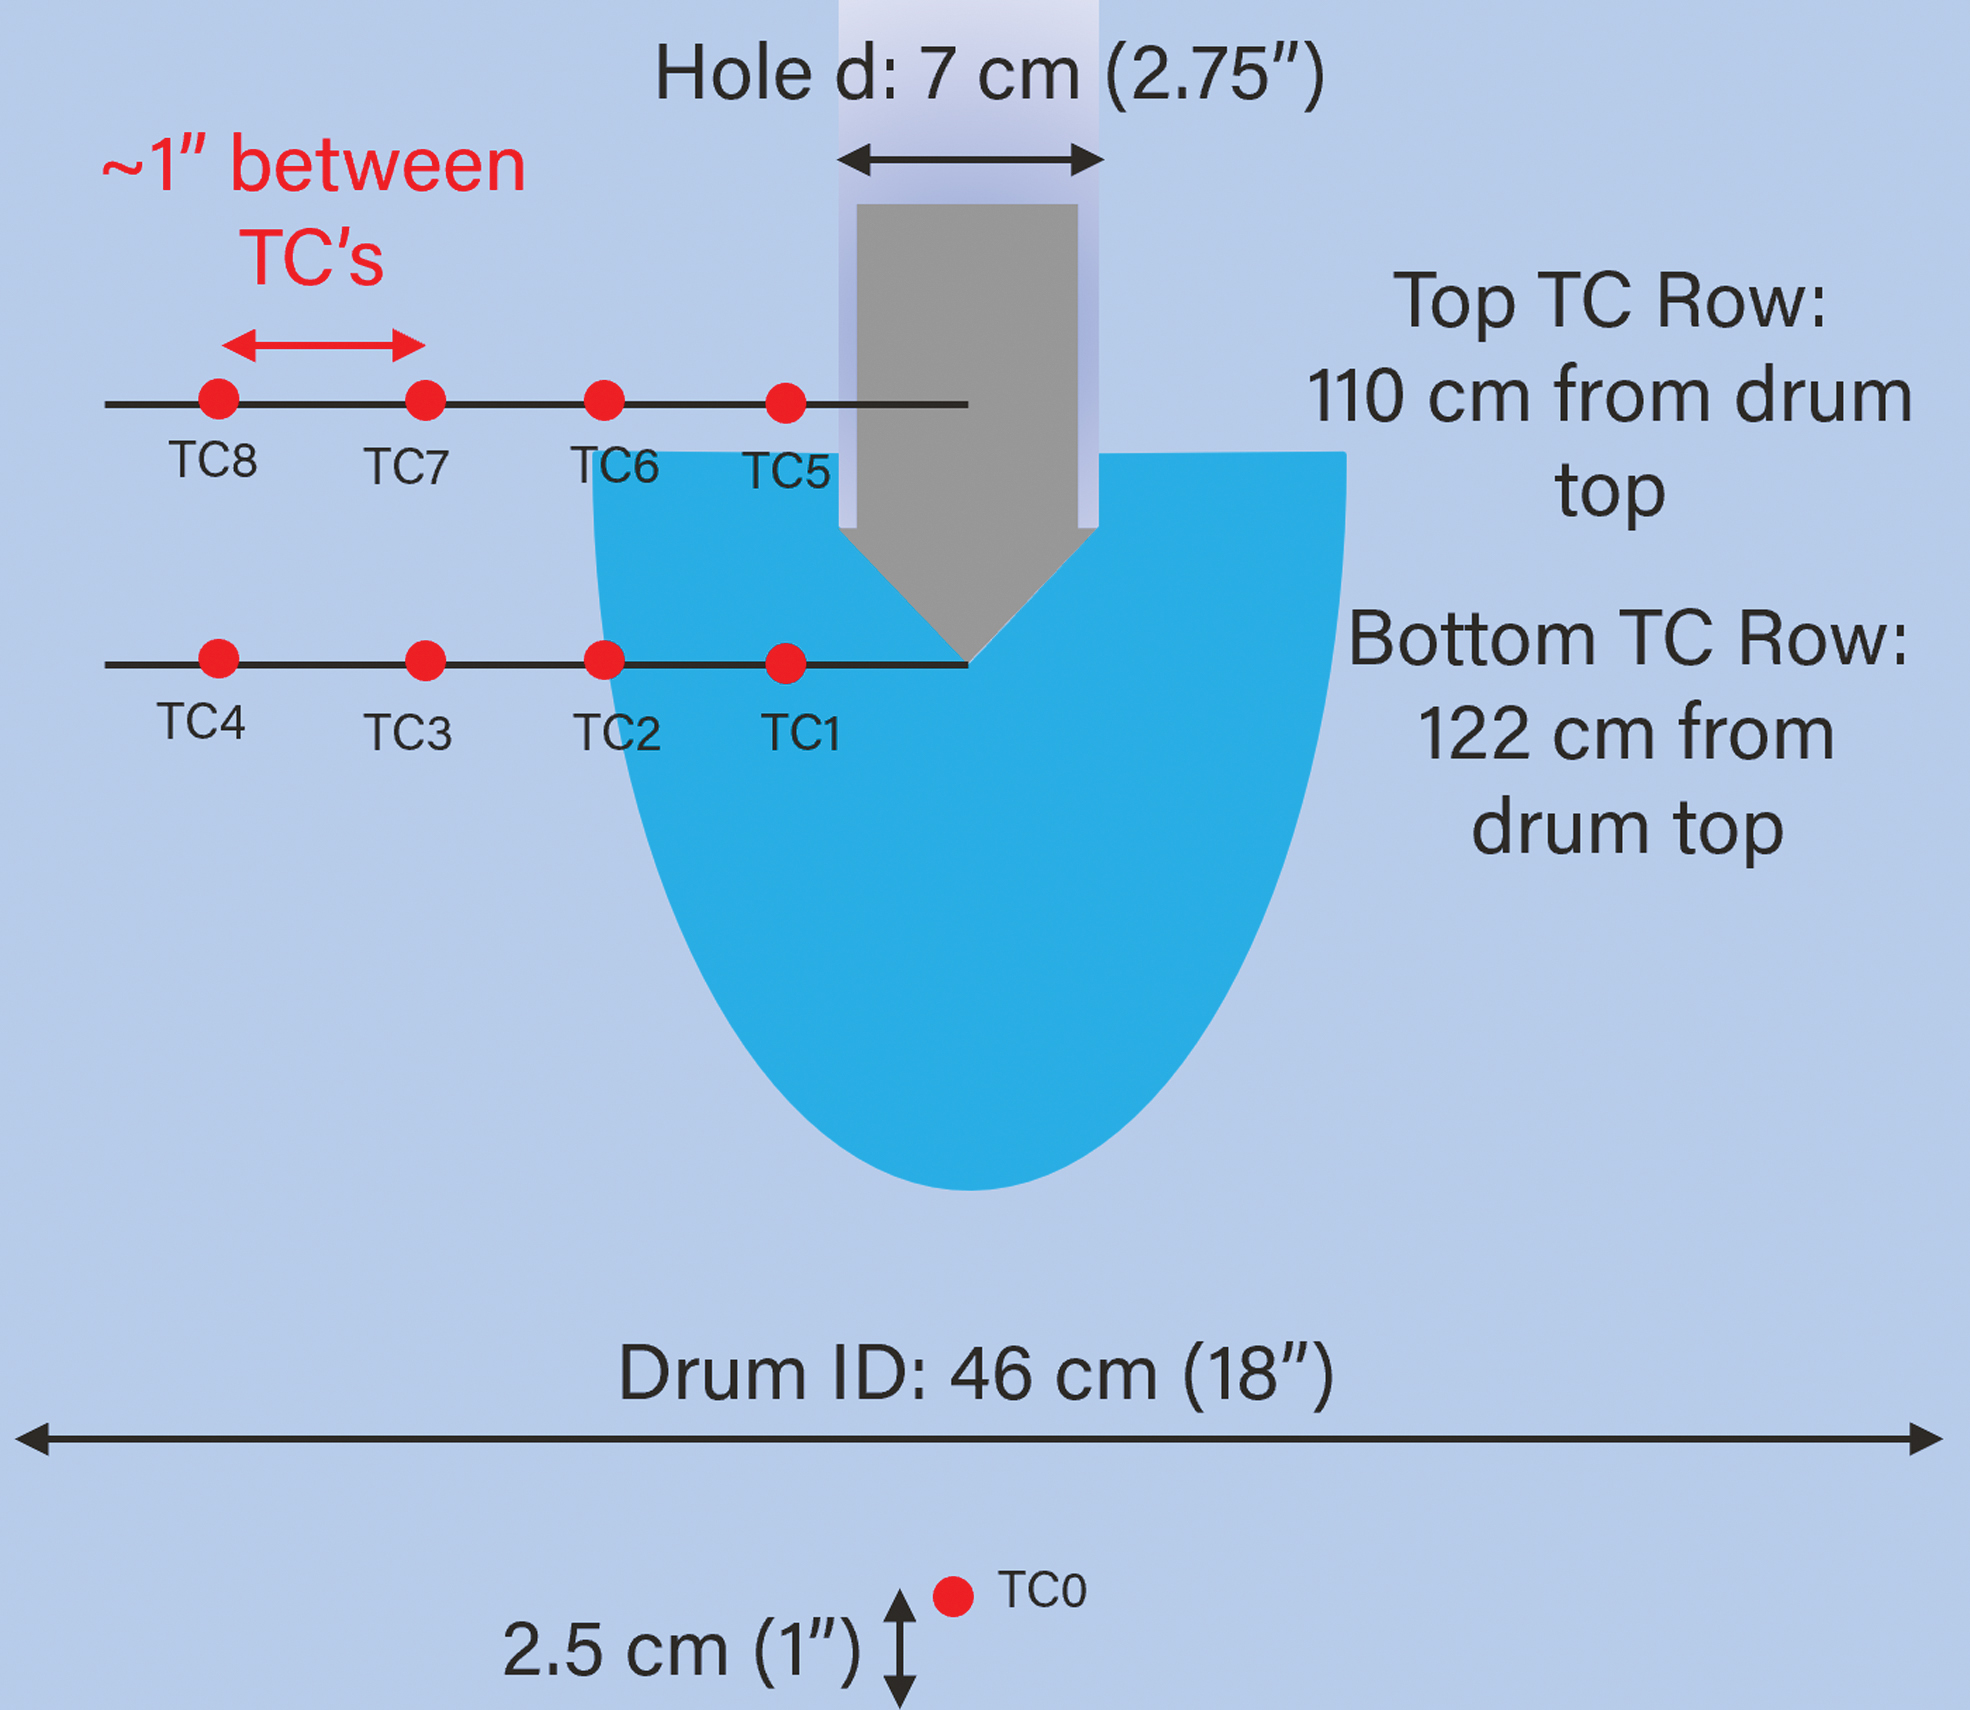
Two rows of 4 TCs were installed to monitor the ice temperature and determine the growth rate of the well. The TCs were installed ∼6 inches in the radial direction from the side of the drum with ∼1-inch spacing between TCs. Note that the TC row heights are w.r.t. the top of the drum (ice surface was 20 cm below top) and were selected to allow the packer to be fully embedded in ice. Color images are available online.
After 3 days at −15°C, the ice was further cooled to −60°C with LN2 flowing through the copper coils with constant monitoring of ice temperature. This process took approximately half a day before the ice drum could be moved into the TVAC to begin testing of the RedWater system while continuing to cool the ice with LN2 via feedthroughs on the chamber wall.
General Setup and Installation
Figure 9 shows the layout of the TRL-5 system in computer-aided design and the actual hardware installed inside the TVAC. An item structure frame was installed first to support the Injector system, which was later moved in with a forklift. The RedWater mission control was to the right of the TVAC and consisted of the Electrical Ground Support Equipment (EGSE), the Valve Control Station for controlling pneumatic and hydraulic lines, and computer monitors streaming live video of the RedWater operations from cameras installed both inside and outside the TVAC.
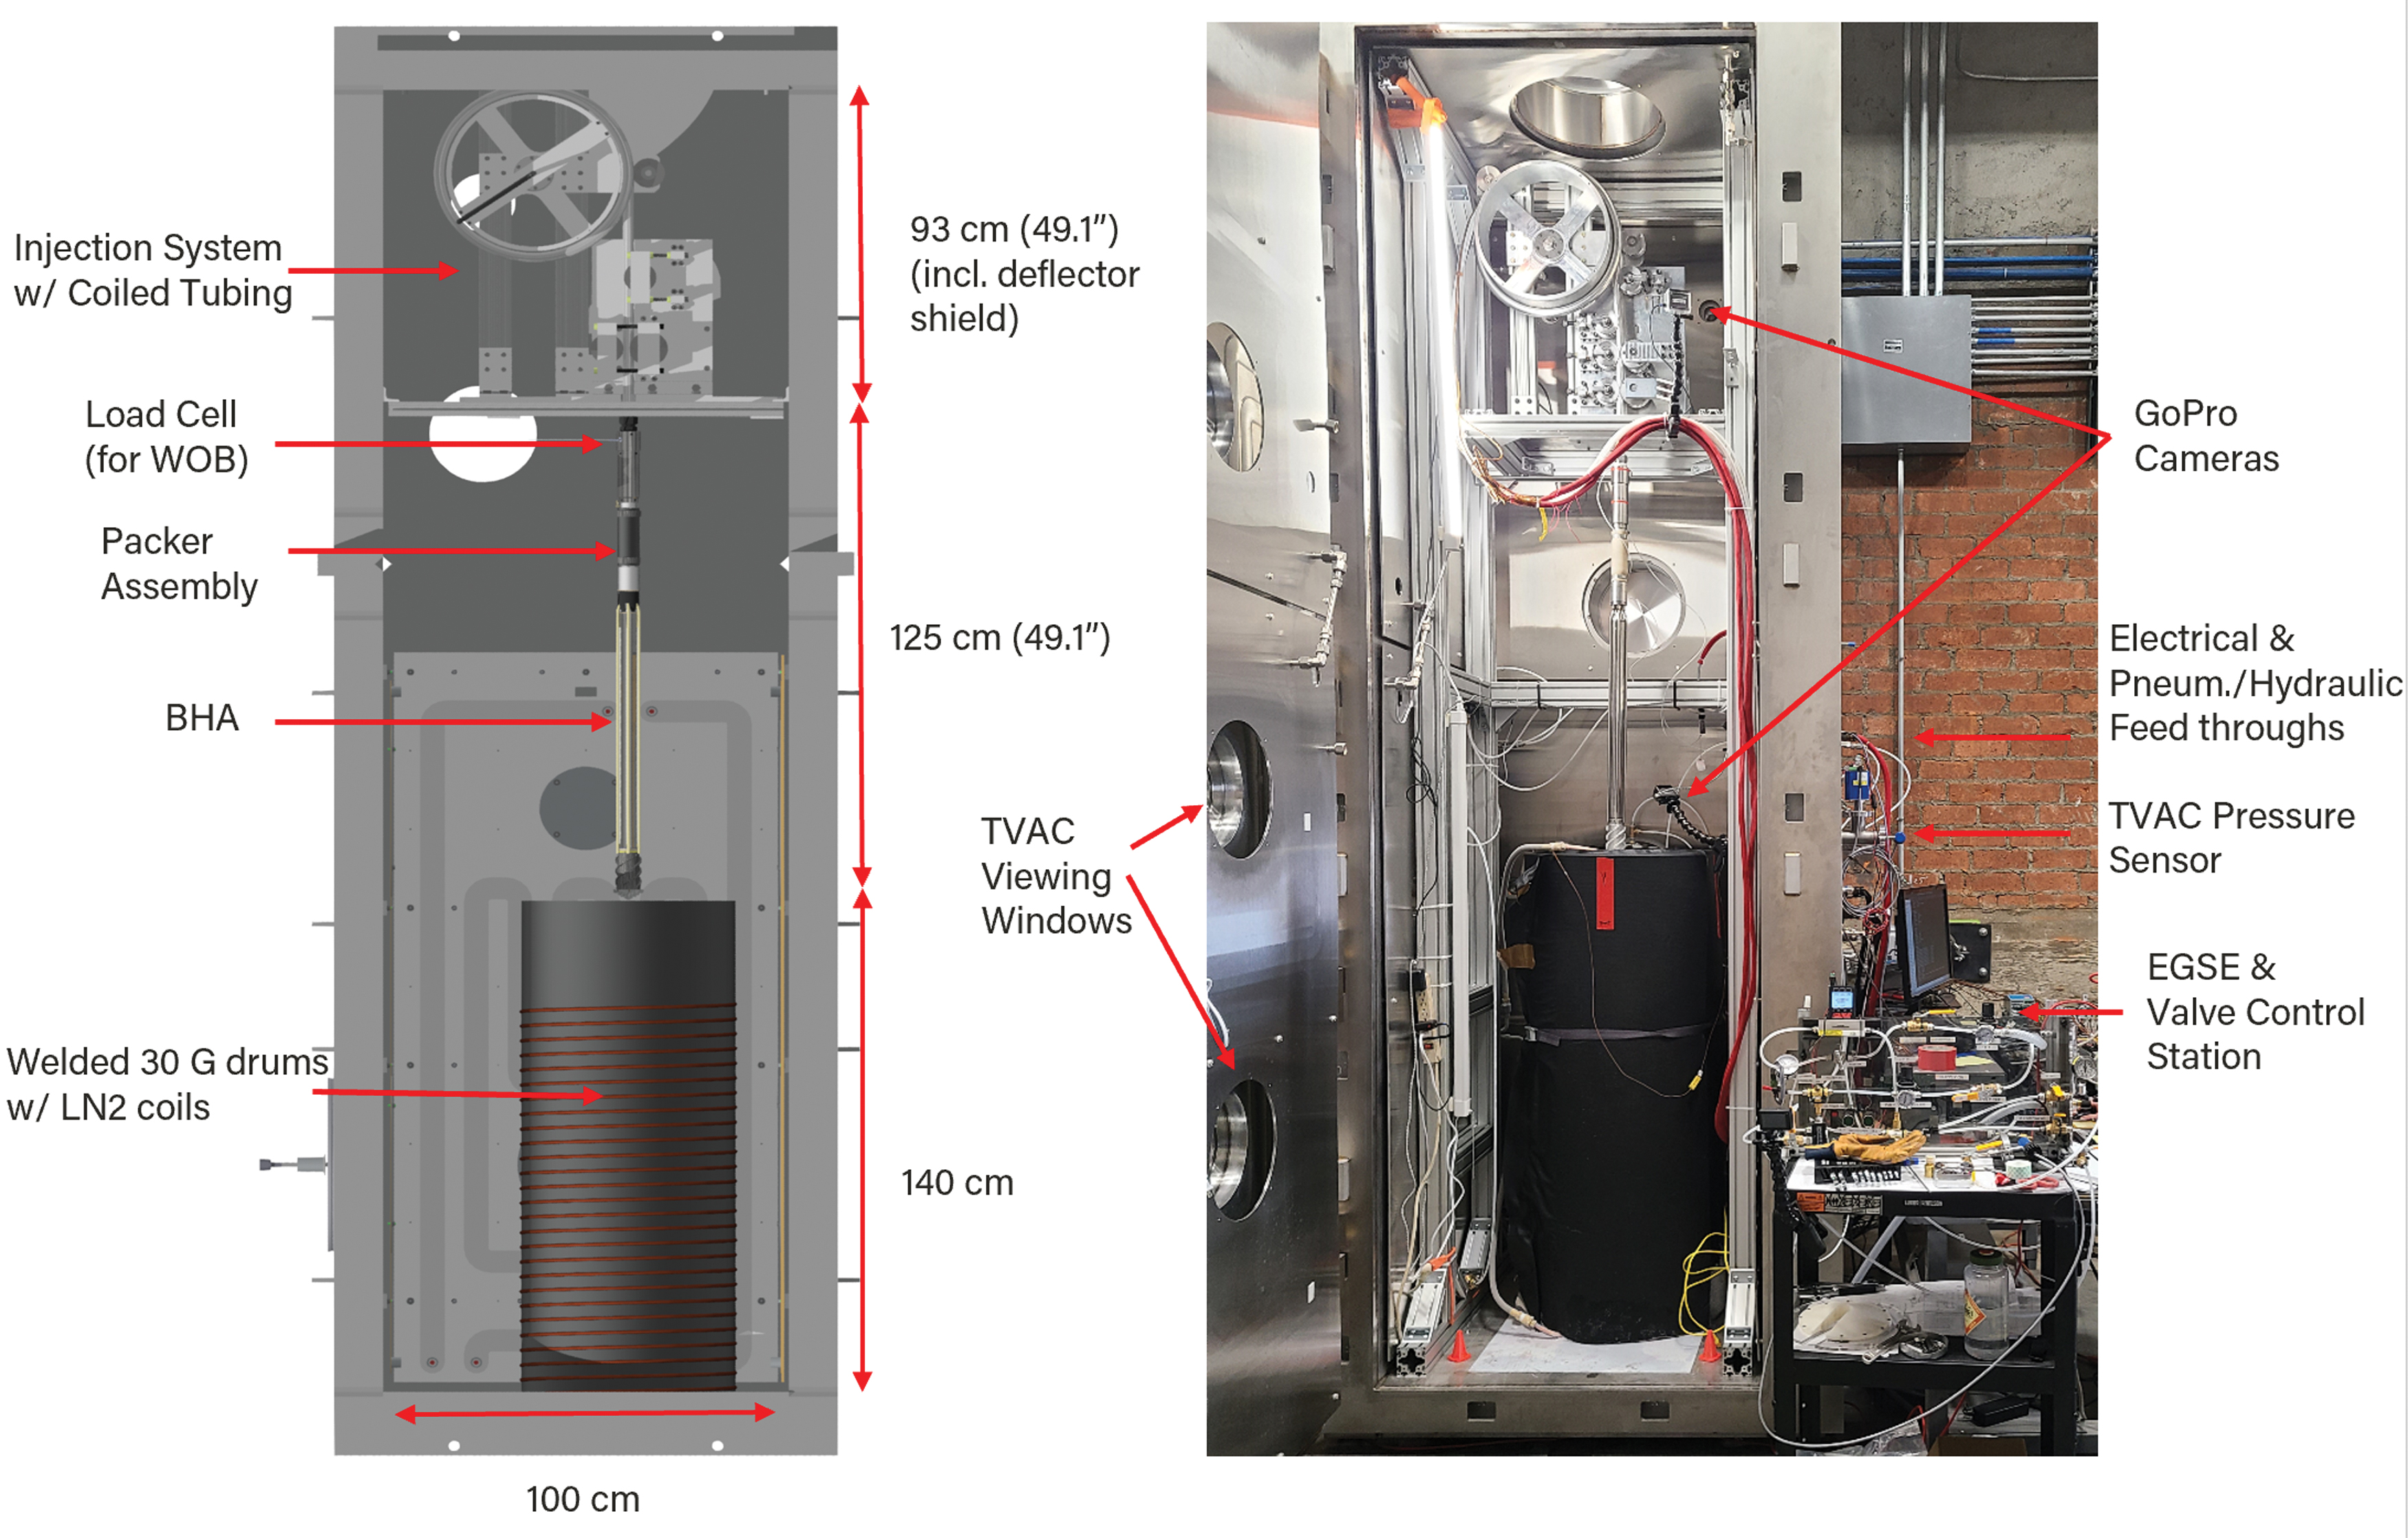
Left: CAD rendering showing main RedWater components in Honeybee's Tiny Eagle TVAC. Right: actual system installed in the TVAC with the EGSE and Valve Control Station to the right of the chamber. Cameras were installed inside and outside of the chamber to record data and monitor operations. Note the water tank is not visible here (Fig. 22). CAD, computer-aided design; EGSE, Electrical Ground Support Equipment; TVAC, thermal vacuum chamber. Color images are available online.
Electrical Ground Support Equipment
The EGSE (Fig. 10) was positioned to the right of the TVAC and consisted of electrical components, including regulated AC to DC power supplies, motor drives, circuit breakers, a data acquisition (DAQ) system, solid state relays (SSRs), and current sensors that measured the power output from the auger heaters. The DAQ consisted of 2 LabJacks for controlling heaters via SSRs and can measure up to ∼30 analog input channels for TCs that are embedded in the ice (Fig. 8) to monitor well growth, and other sensors such as TCs, resistive temperature devices, and relative humidity sensors that are integrated in the BHA. The RedWater system connects to the EGSE via electrical feedthroughs on the right side of the chamber.
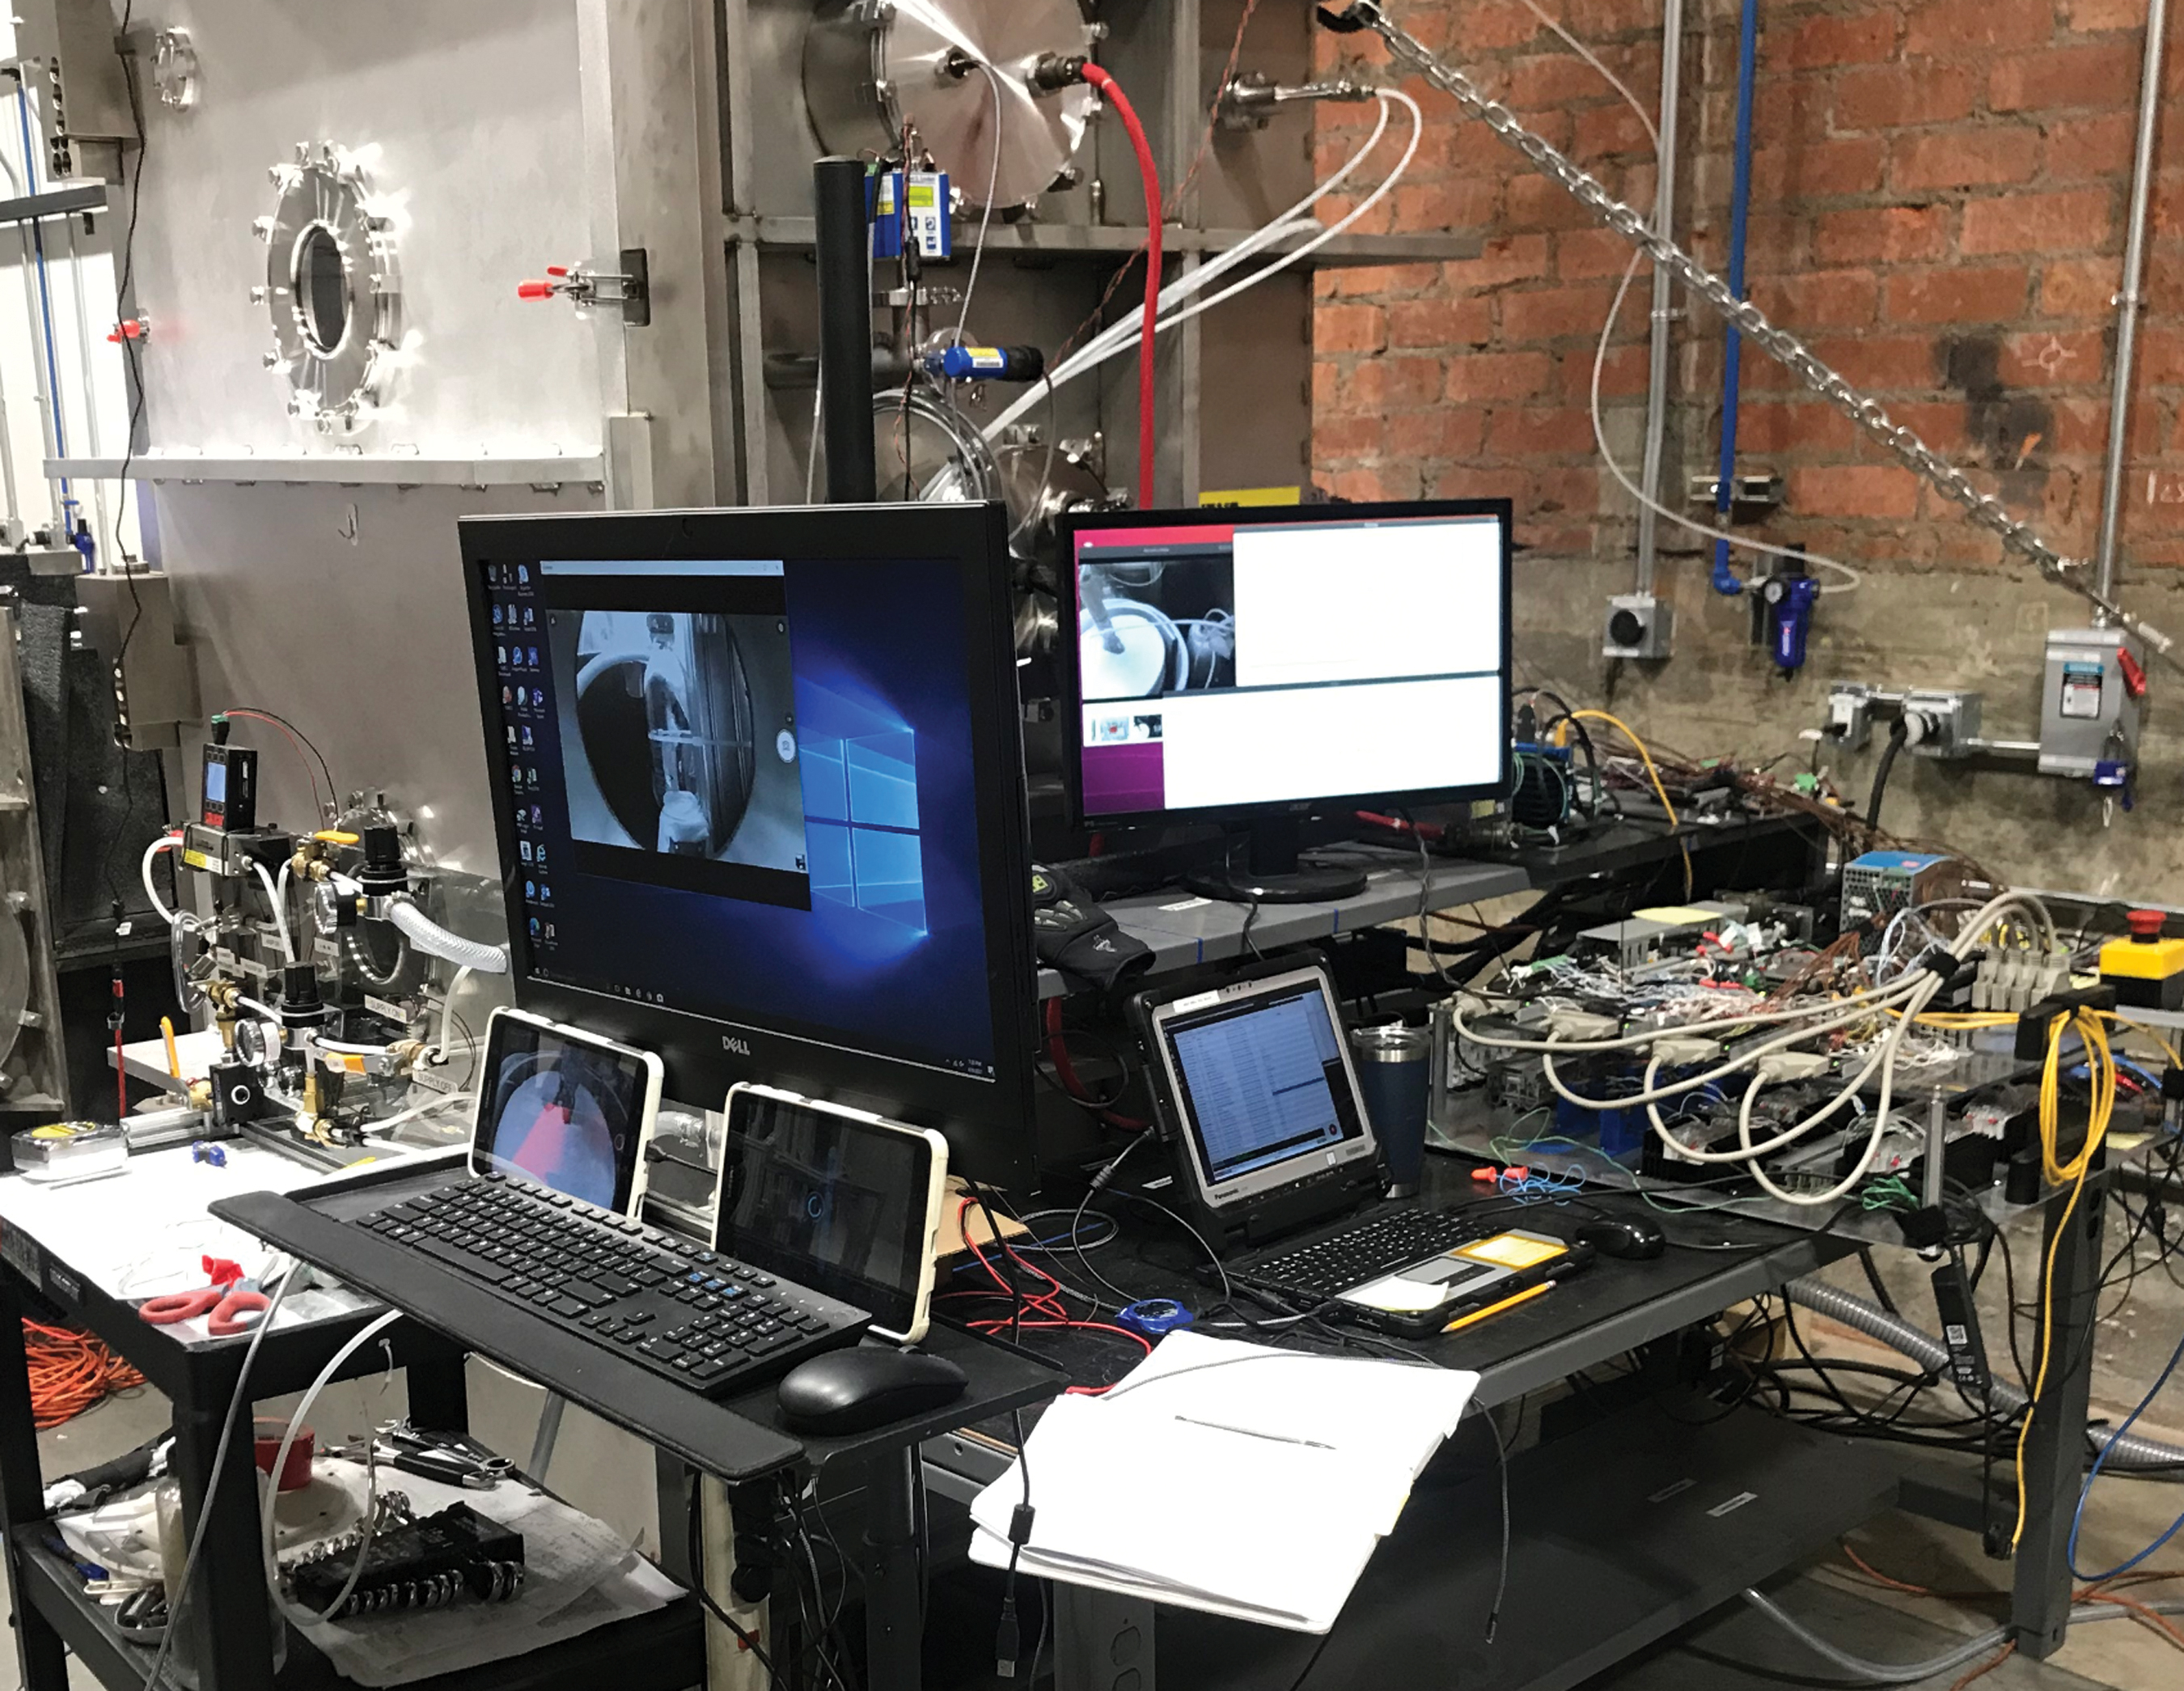
Left: overview showing the EGSE setup with monitors displaying a real-time video of the RedWater system running in the TVAC. Visible on the main display is the tank/vessel which collects melt water. Right: Detailed layout of some of the main EGSE components, including motor drives, power supply, and LabJack DAQ. Not shown are the current sensors and SSRs that were used for measuring and controlling the auger heaters. DAQ, data acquisition; SSR, solid state relay. Color images are available online.
Software
The RedWater system was controlled from Honeycomb (Fig. 11), a custom software framework developed for controlling robotic drills, written mainly in C++ under Ubuntu 16.04, and for this setup deployed on a Panasonic CF-33 Toughbook. The software consists of rule-based algorithms that have various safety limits such as motor current and temperature limits. After an operation is completed, the operator is responsible to set/check operational parameters and decide whether to move to the next operation.
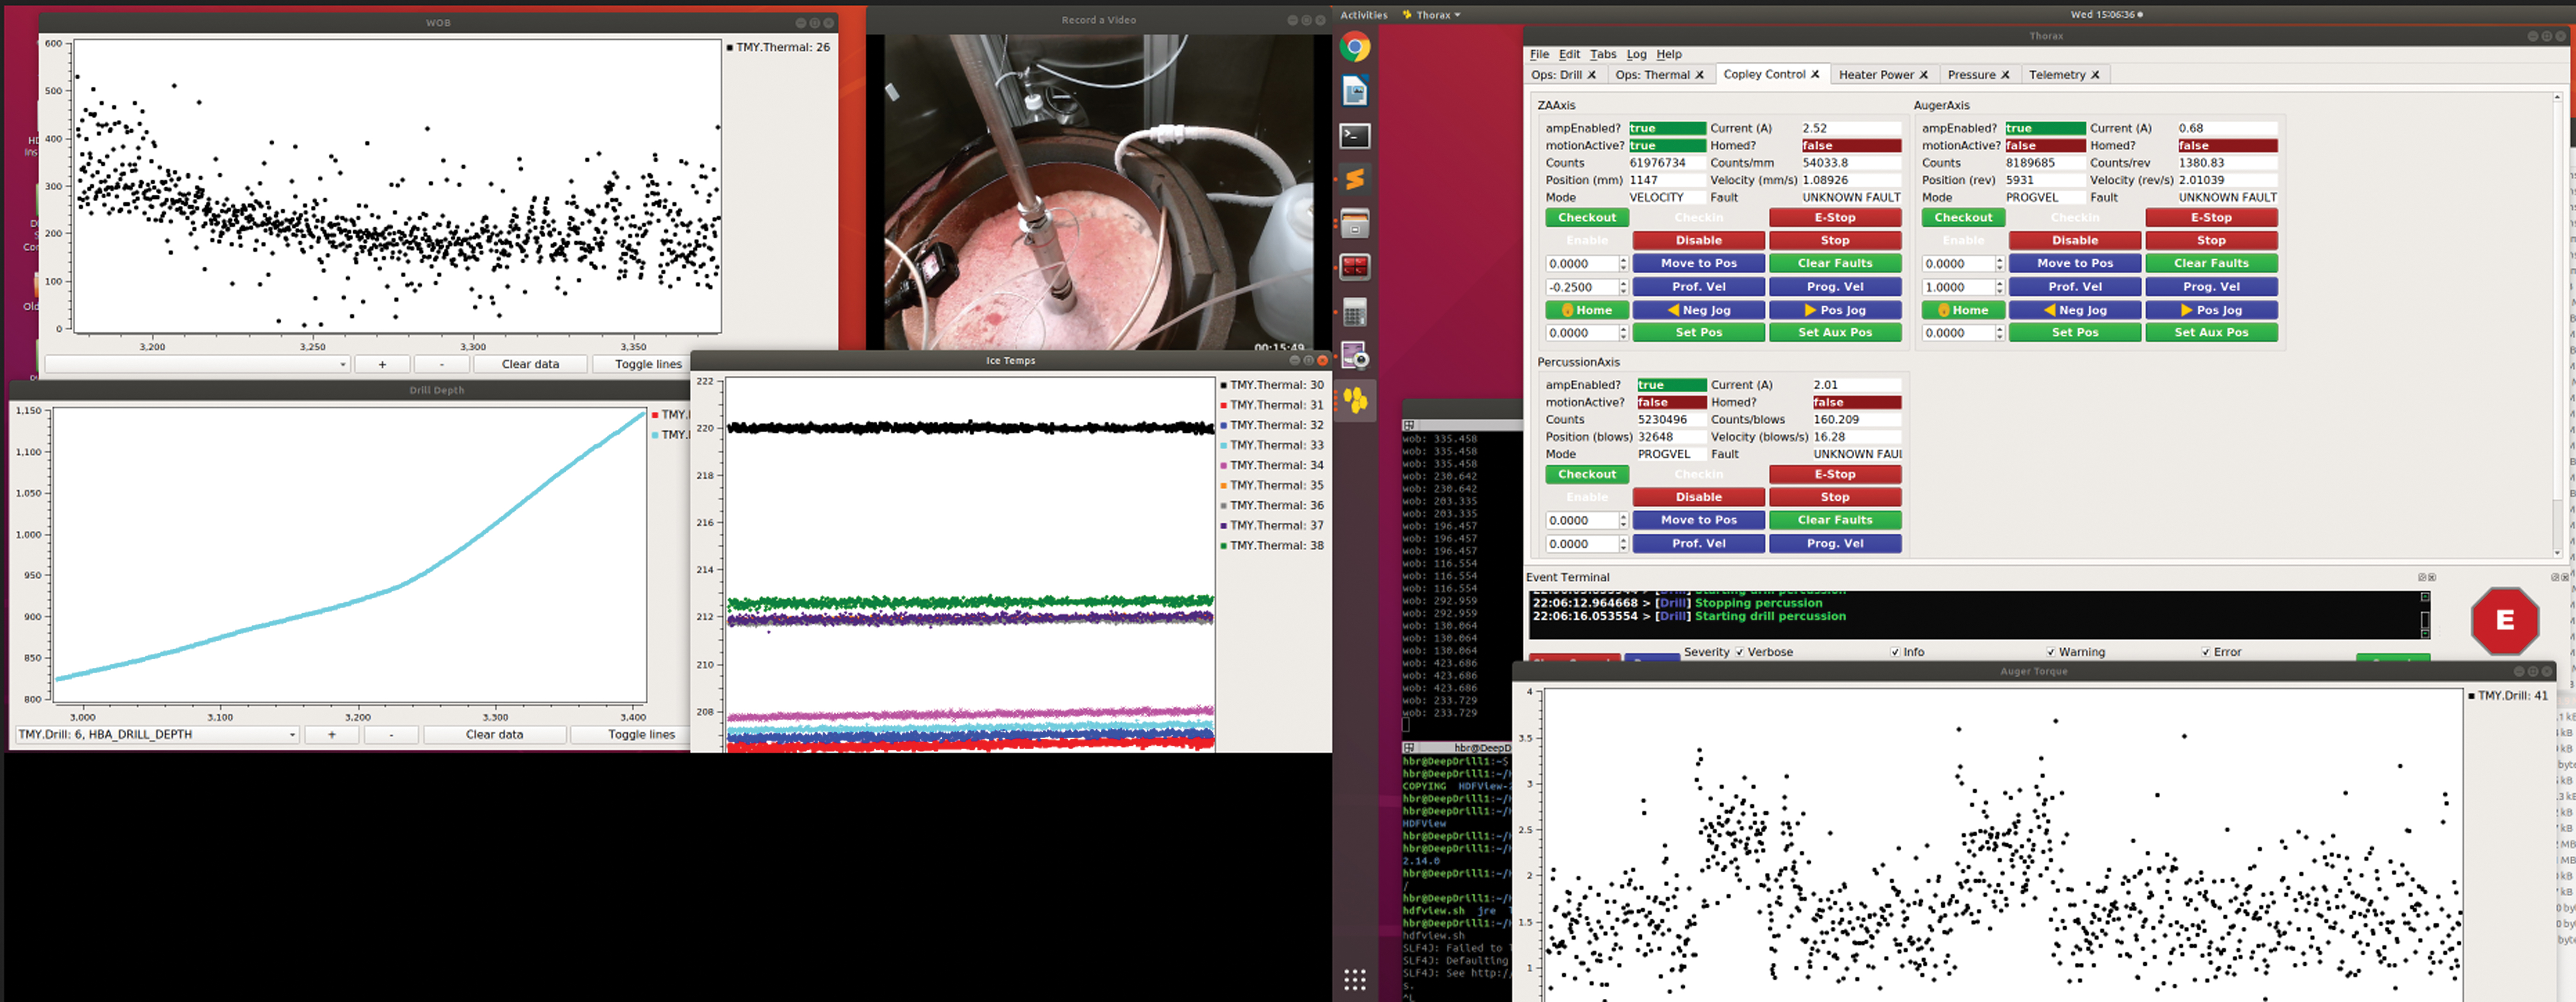
Honeycomb graphical user interface used to monitor and control the RedWater system. Plots can be displayed to view telemetry in real time while the system is controlled semi-autonomously by setting parameters and sending commands. Event logs and data products with telemetry are continuously being logged. Color images are available online.
If there is a fault within an operation, or if the limits are exceeded, a fault-recovery routine is triggered, which puts the RedWater system into a safe state. Operations can be combined with no Human-In-The-Loop intervention. However, for the TRL-5 system, operations were run individually (i.e., in semi-autonomous mode) by issuing the following commands:
OpCalibrate—tares the Weight-On-Bit (WOB) measurement and acquires no load motor currents for the injector, auger, and percussion actuators. OpSeek—detects a surface using WOB measured by a load cell for feedback to; for example, start drilling or to continue melting. OpDrill—advances the BHA to drill to a target depth where 3 motors are simultaneously run (i.e., CT injector, auger, and percussion). OpMelt—turns heaters embedded in the auger on to melt the well at a set auger temperature and proportional gain to control the heater power output. Manual Mode—low-level motor commands such as a jog or position move.
Each of the earlier cited software operations is executed autonomously. For example, “OpSeek” includes unspooling the CT while slowly rotating the drill bit, and monitoring WOB and torque. When the WOB and torque exceed preset limits, the CT is retracted slightly and stopped. Drilling employs a more complex set of algorithms that take into account the formation strength to adjust drilling parameters. Note that sealing the borehole by inflating the packer is performed manually from the Valve Control Station described in the next section.
While the Honeycomb program is running, telemetry from motors, sensors, and operational parameters can be displayed from the graphical user interface as plots (Fig. 11) and is logged as HDF files. Event logs are also generated as simple text files that record the sequence of events, including issued commands, errors, and any faults that are detected during operations.
Valve Control Station
The Valve Control Station (Fig. 12) is a manual setup that was connected to a pressurized CO2 CD 50 gas tank (not shown) containing 22.7 kg of CO2 when full, where valves, regulators, and flow meters were used to control the pneumatics and hydraulic lines during RedWater operations. The mass flow rate of CO2 used to clear ice cuttings during drilling was measured by an Alicat M-100SLPM-D flow sensor and manually adjusted via a needle valve. Regulators and gauges were used to set and monitor the packer and the borehole pressures.

Valve control station that is used to inflate/deflate the packer, pressurize the borehole to extract water from the well and to remove cuttings during drilling operations using pressurized CO2 gas from a pressurized CD50 tank (not shown). Color images are available online.
The tubes connected to the BHA could be used for either pneumatics or hydraulics, which was set by valves. Further details on the pneumatic and hydraulic connections are shown in the schematic in Figure 13.

Schematic capturing RedWater hydraulic and pneumatic connections. Color images are available online.
Test Procedure
The test procedure was derived from the RedWater conops and was divided into 5 main phases, including preparation, drilling, melting, water extraction, and clean-up. Each test phase consisted of several tasks that were executed sequentially to maximize the chances of a successful test and for acquiring the desired data. The procedure with the step-by-step instructions was thoroughly documented with the main task flow shown in Figure 14.
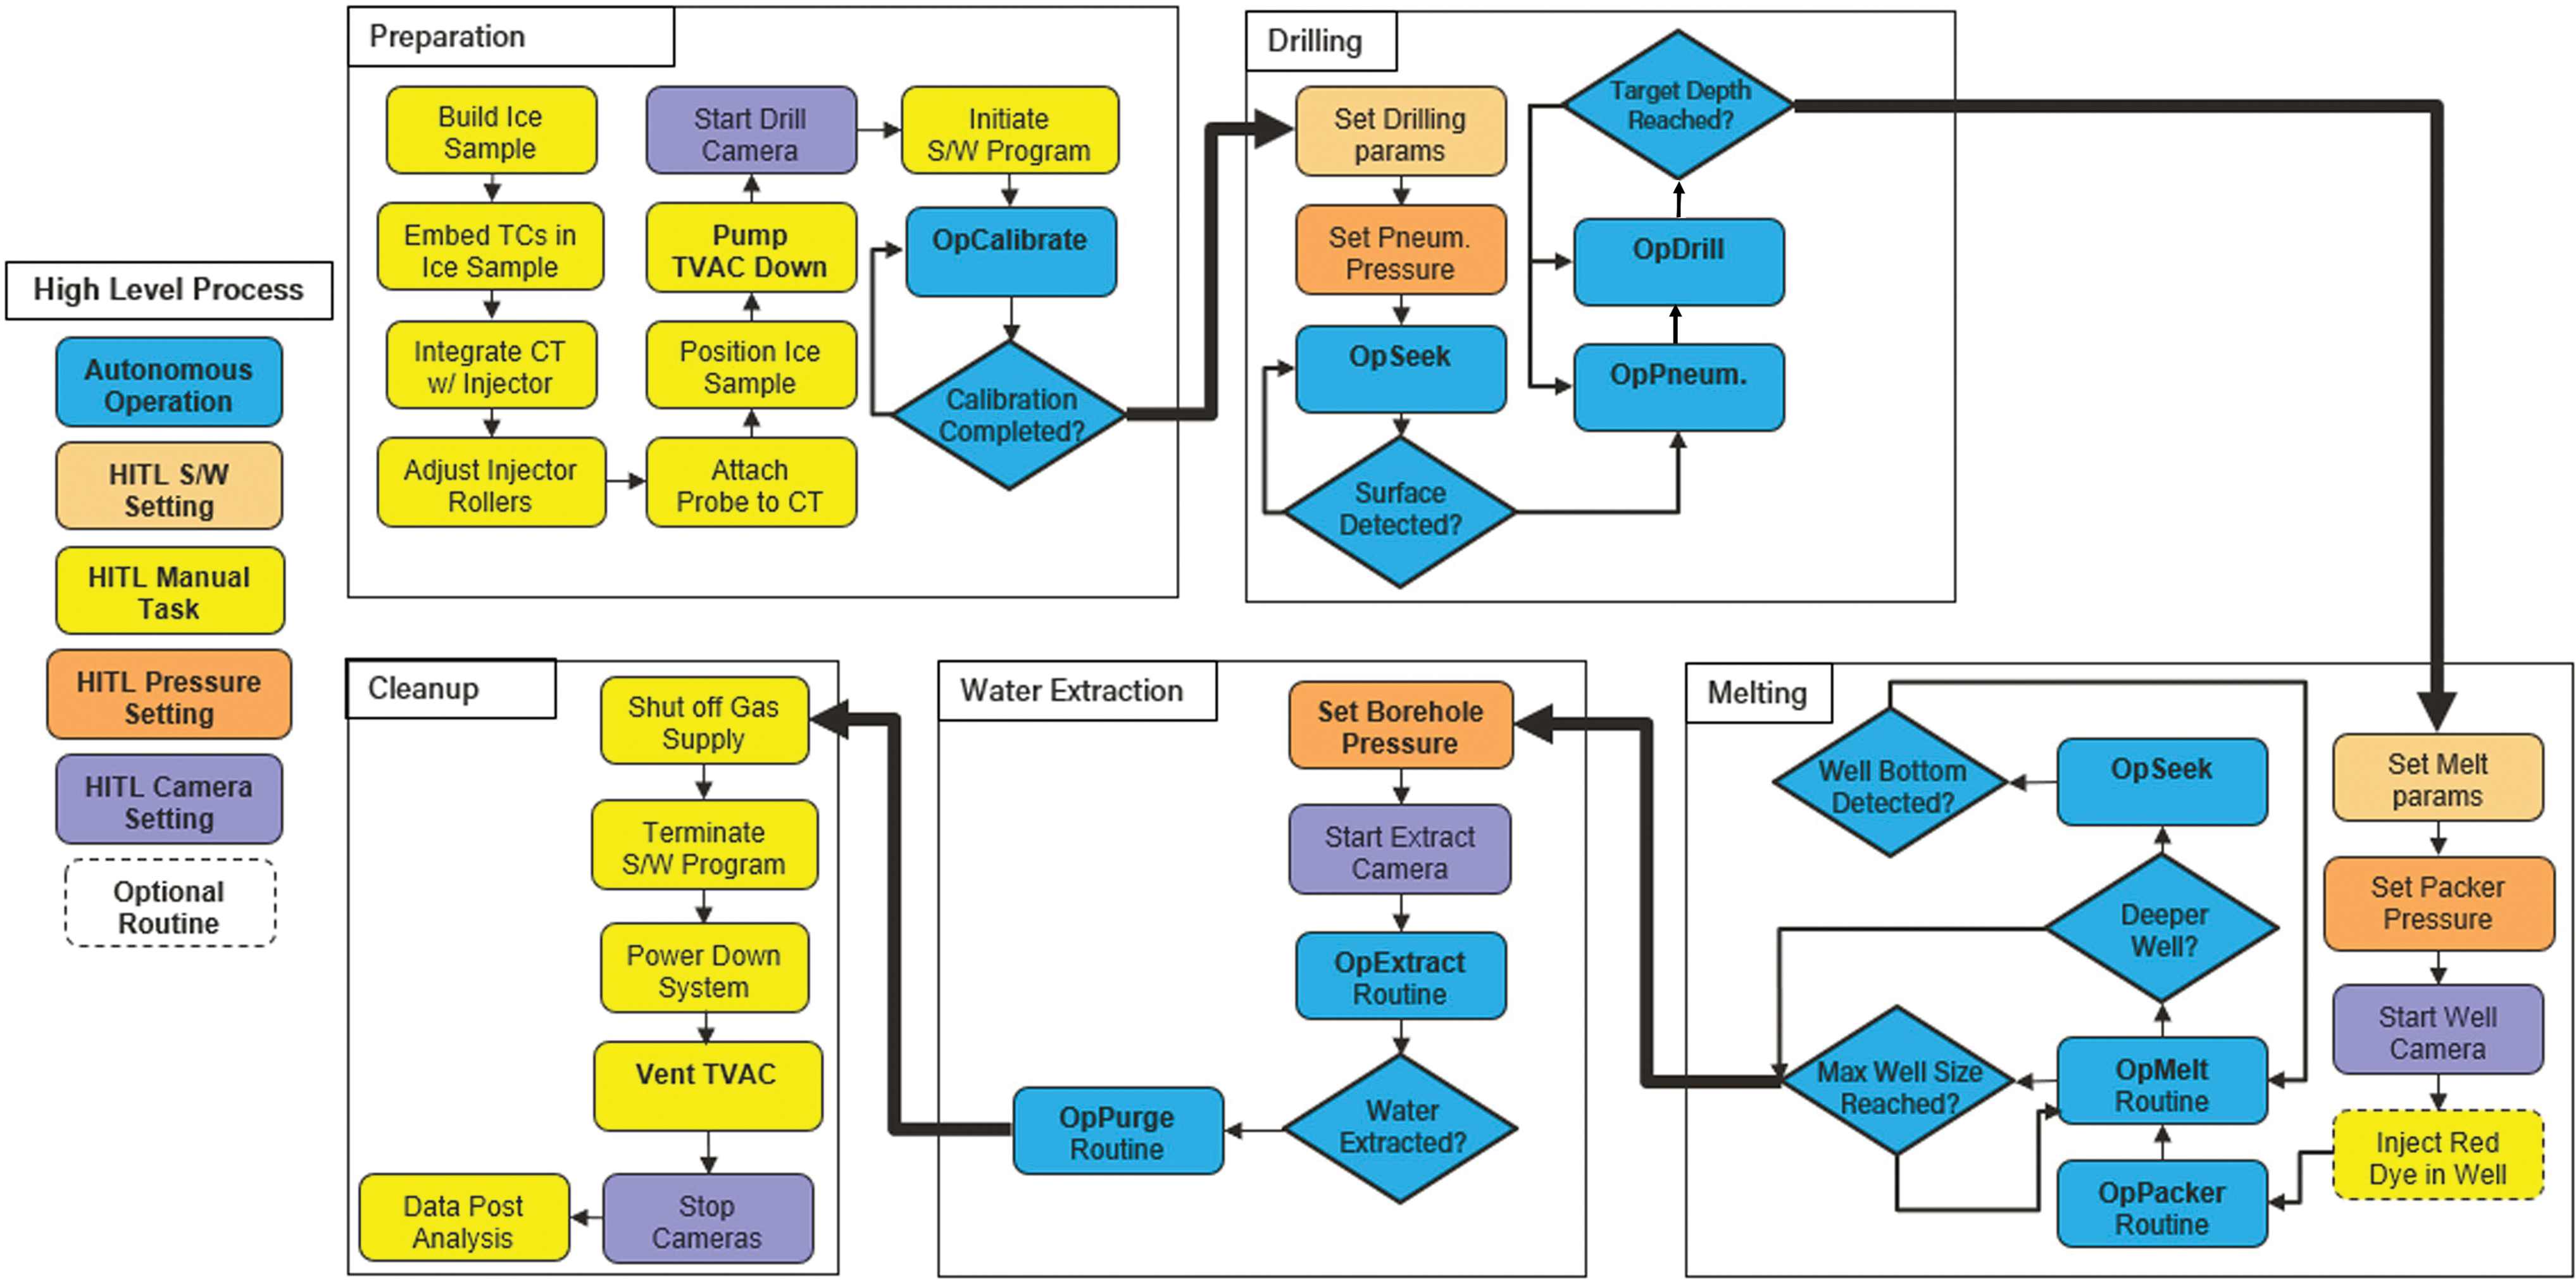
Diagram of the main task flow for the RedWater TVAC test. The entire test procedure was broken up into multiple tasks for each test phase so that the procedure flowed smoothly, and all necessary data were captured. Note that only the main tasks are shown and OpExtract and OpPurge were manual Human-In-The-Loop operations. Color images are available online.
Results
Testing in a Mars simulated environment took place in 2 stages, where the first stage of the test involved drilling and the second stage continued with melting and then water extraction. The BHA drilled to 110 cm depth fully embedding the packer in the ice (measured from the surface of the ice, which was level with the top of the ice drum) without any problems.
Drilling in the colder −60°C ice (compared with −5°C ice in the previous freezer testing) resulted in the partially melted ice cuttings refreezing on any drill surfaces that were not sufficiently heated, which prevented the auger rotation. With the packer inflated and auger heaters outputting an average of 570 W (controlled by the auger temperature set point set at 350 K), the auger broke free after 112 min. The auger rotation resulted in a more uniform well temperature distribution and a more efficient well production (Table 4). The TCs preinstalled in the ice (Fig. 8) captured rapid well growth, with the well volume reaching ∼6.6 L after 156 min (Table 4) as determined after the test was completed (Fig. 21).
Thermal Vacuum Chamber Well Test Data Based on Thermocouple Embedded in the Ice Detecting Well Growth
To extract the liquid water from the well, the BHA had to advance deeper to submerge the tubes used to transport water to a vessel located at the surface. Only a small amount of water was extracted, because the unheated section of the BHA also became frozen-in, preventing the BHA from advancing into the well to extract most of the liquid water. An attempt to release the BHA from the ice by using the CT Injector to lift the BHA with the ∼230 kg ice drum by a few cm off the ground was unsuccessful.
The subsequent sections describe each of the test phases in more detail, providing the relevant inputs, measured outputs, and any additional observations, including lessons learned that are part of the discussion section.
Drilling w/ Pneumatic Cuttings Clearing
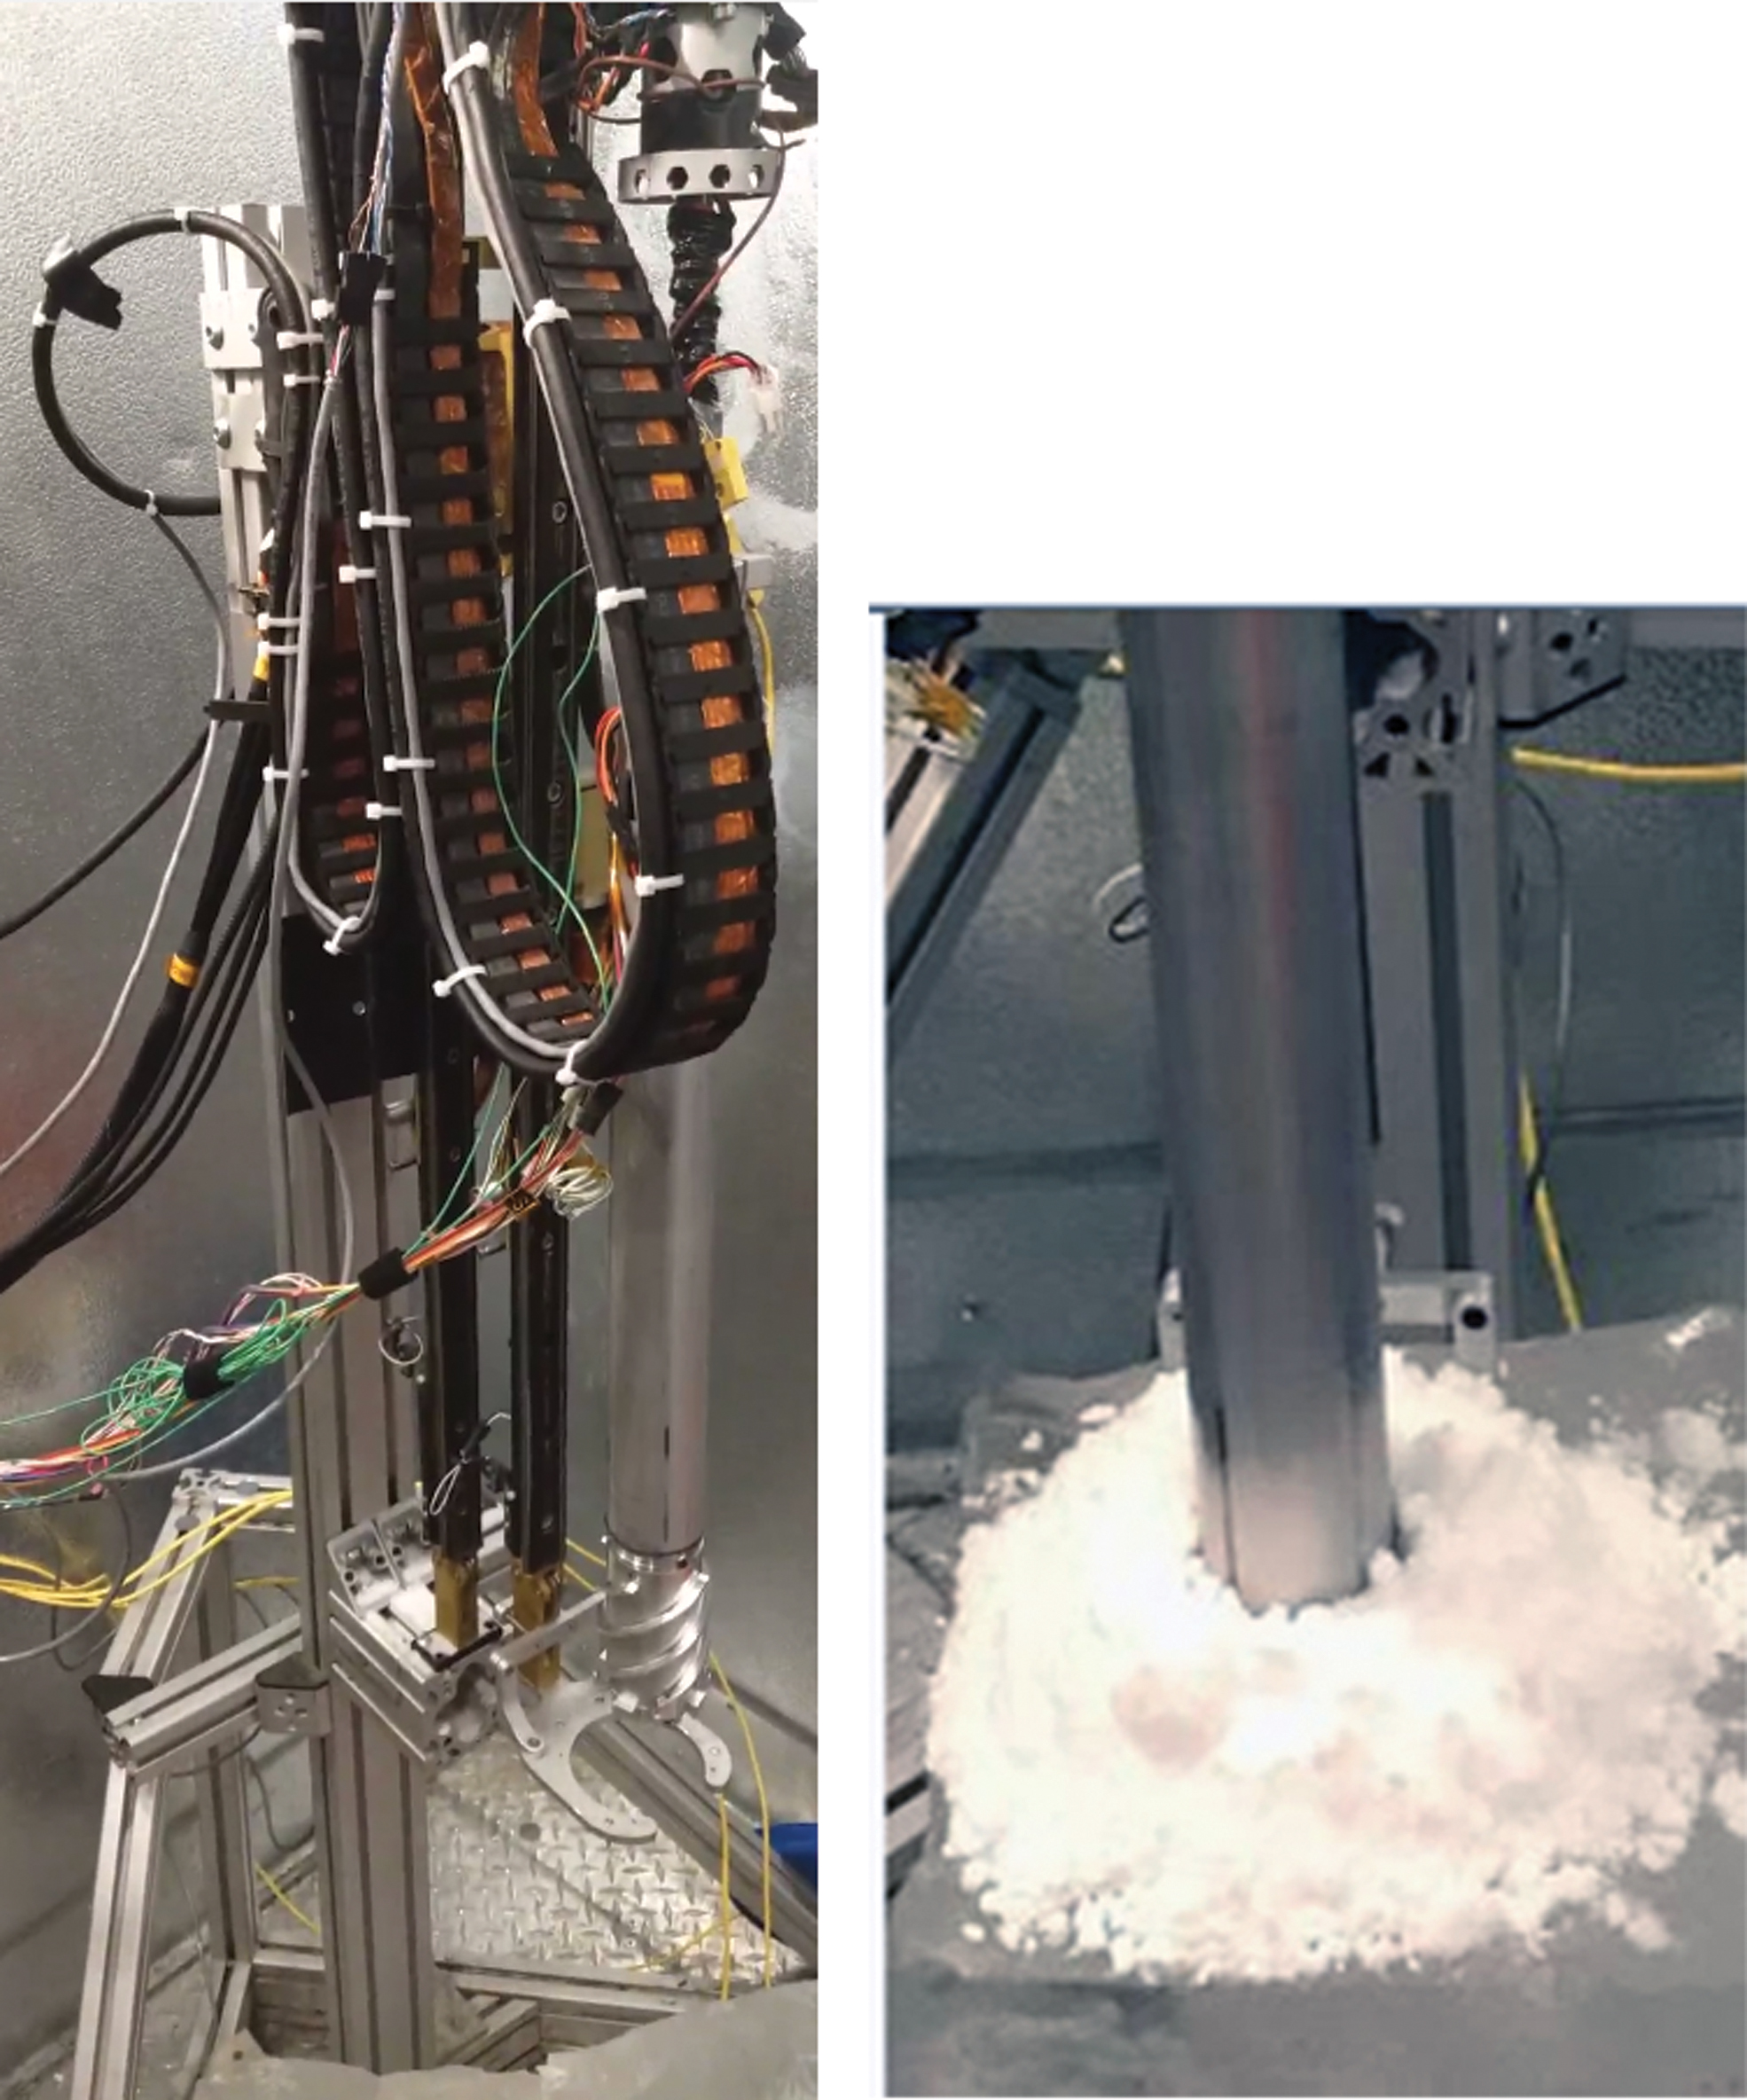
The mass flow rate of CO2 to clear cuttings while drilling was set to 0.5 g/s. At this flow rate, the ice cuttings were blown out of the borehole and accumulated in a pile (Fig. 15) whereas a constant rate of penetration (ROP) of 0.54 mm/s (1.9 m/h) was maintained with no visible choking or decrease in ROP, except when the gas was turned off for the last 1–2 cm to generate cuttings (to prime melting) just before reaching the final target depth (Fig. 16).

View through the TVAC window with the probe deployed at ∼80 cm drill depth and a pile of ice cuttings accumulating around the packer. Cuttings were observed to be hitting the bottom of the injector system ∼1 m above the borehole but did not reach any of the Injector rollers or gears. Color images are available online.
Penetration data with rotary-percussive mode of drilling and pneumatic cuttings clearing in −60°C ice and ∼7 Torr ambient pressure simulating Mars conditions. The ROP was relatively constant, as ice cuttings were blown out with 0.55 g/s CO2 injected into the borehole via 4 outer tubes attached to the BHA. ROP, rate of penetration. Color images are available online.
The TVAC roughing pump maintained the ambient chamber pressure relatively stable at 7–8 Torr during drilling operations . A total of 1 kg of CO2 regulated at 50 pounds per square inch in gauge pressure at the Valve Control Station was used to drill 104.5 cm in 33 min. The resulting gas to cuttings ratio was 1:3.6 in the TVAC test, which is an order of magnitude lower compared with 1:0.16 ratio used in the freezer test performed at Earth ambient pressure.
The WOB and drilling torque were relatively constant in the −60°C ice with an average of 197 N and 2.8 Nm, respectively. The auger speed was 120 rpm and percussion ran at 972 bpm ∼60% of the time (turned on when WOB was above a preset threshold). This resulted in an average mechanical power of 131 W and a specific energy of 0.017 Wh/cc of drilled ice. The drilling parameters and average output data are summarized in Tables 2 and 3.
Input Drilling Parameters for Thermal Vacuum Chamber Test
WOB, weight-on-bit.
Measured Average Drilling Performance Outputs from Thermal Vacuum Chamber Test Data
Assumes an ice density of 0.9167 g/cc.
ROP, rate of penetration.
The Injector system deployed the CT as expected, with no external slippage and minimal borehole deviation observed. An Al6063-T832 CT (Fig. 17) advanced the BHA to 104.5 cm depth per the position data reported in the Honeycomb software (Fig. 16). The actual depth was measured after drill testing as 103 cm (±1 cm) with a maximum ∼1.0° deviation (i.e., <2 cm off the original axis at the final drill depth). The Injector system implemented 2 sets of drive rollers that clamped the 1.0-inch OD × 0.056-inch-thick CT with an estimated 1200-lb force (based on a 10-ft-lb fastener torque wrench setting).
Fully deployed CT with probe at a final ∼1.1 m drill depth in the −60°C ice ready to transition the melting phase. Note the fixture was adjusted after drilling, which is not recommended for future tests due to the condensation build-up, which can refreeze on the system when the chamber is pumped back to Earth ambient pressure and the door is opened. Color images are available online.
The required pulling force to uncoil the CT from the 16.0-inch drum was estimated to 2517 N based on an average no-load motor current of 1.11 A and average motor continuous current of 2.76 A. This pulling force corresponds to a 200 Nm output from the 2 drive rollers with an average contact diameter of 79.25 mm.
Melting
Sealing the borehole with the packer (Fig. 18) allowed the well to slowly expand even without auger rotation, which was stopped by freeze-in condition when the system was primed with cuttings. The packer was inflated to 45 pounds per square inch in absolute (PSIA) pressure with no leaks detected and no vapor observed during the melting process. The first 2 TCs in the top row, TC1 and TC2 (Fig. 19 and Table 4), were triggered at t = 85 min and t = 100 min, corresponding to 0.5 and 1.6 L of liquid water, respectively. The auger finally broke free after the heaters were on for 112 min. This was facilitated by increasing the max. continuous and peak motor current limits by ∼30%. The well rapidly expanded with the auger rotating at 120 rpm triggering additional TC's embedded in the ice: TC3 at t = 121 min, and TC4 at t = 156, which were in the top row, and TC5 at t = 146 min, which was the first TC in the bottom row (Table 4 & Fig. 8 ).

Image of packer inflated to 45 PSIA during melting and water extraction phases taken by a GoPro installed in the chamber. Note the red ice cuttings that were pneumatically removed during drilling from the lower portion of the borehole that was dyed red to be able to see the extent of the well post-testing. PSIA, pounds per square inch in absolute. Color images are available online.

Plot capturing RedWater thermal data (dotted lines) and ice temperatures (solid lines) during well formation. The first 112 min of the melting phase were with no auger rotation followed by rotation at 120 rpm, where the heater power was noticeably higher. Water was also injected at t = 70 min to help break the auger free. The ice temperatures from the embedded TCs TC0–TC8 also began to noticeably increase as the well expanded and detected the perimeter of the well. This occurred at t = 85 and t = 100 min for TC1 and TC2 followed by TC3, TC5, and TC4 triggering at t = 121 min, t = 146, and t = 156 min, respectively, while the auger was rotating. Color images are available online.
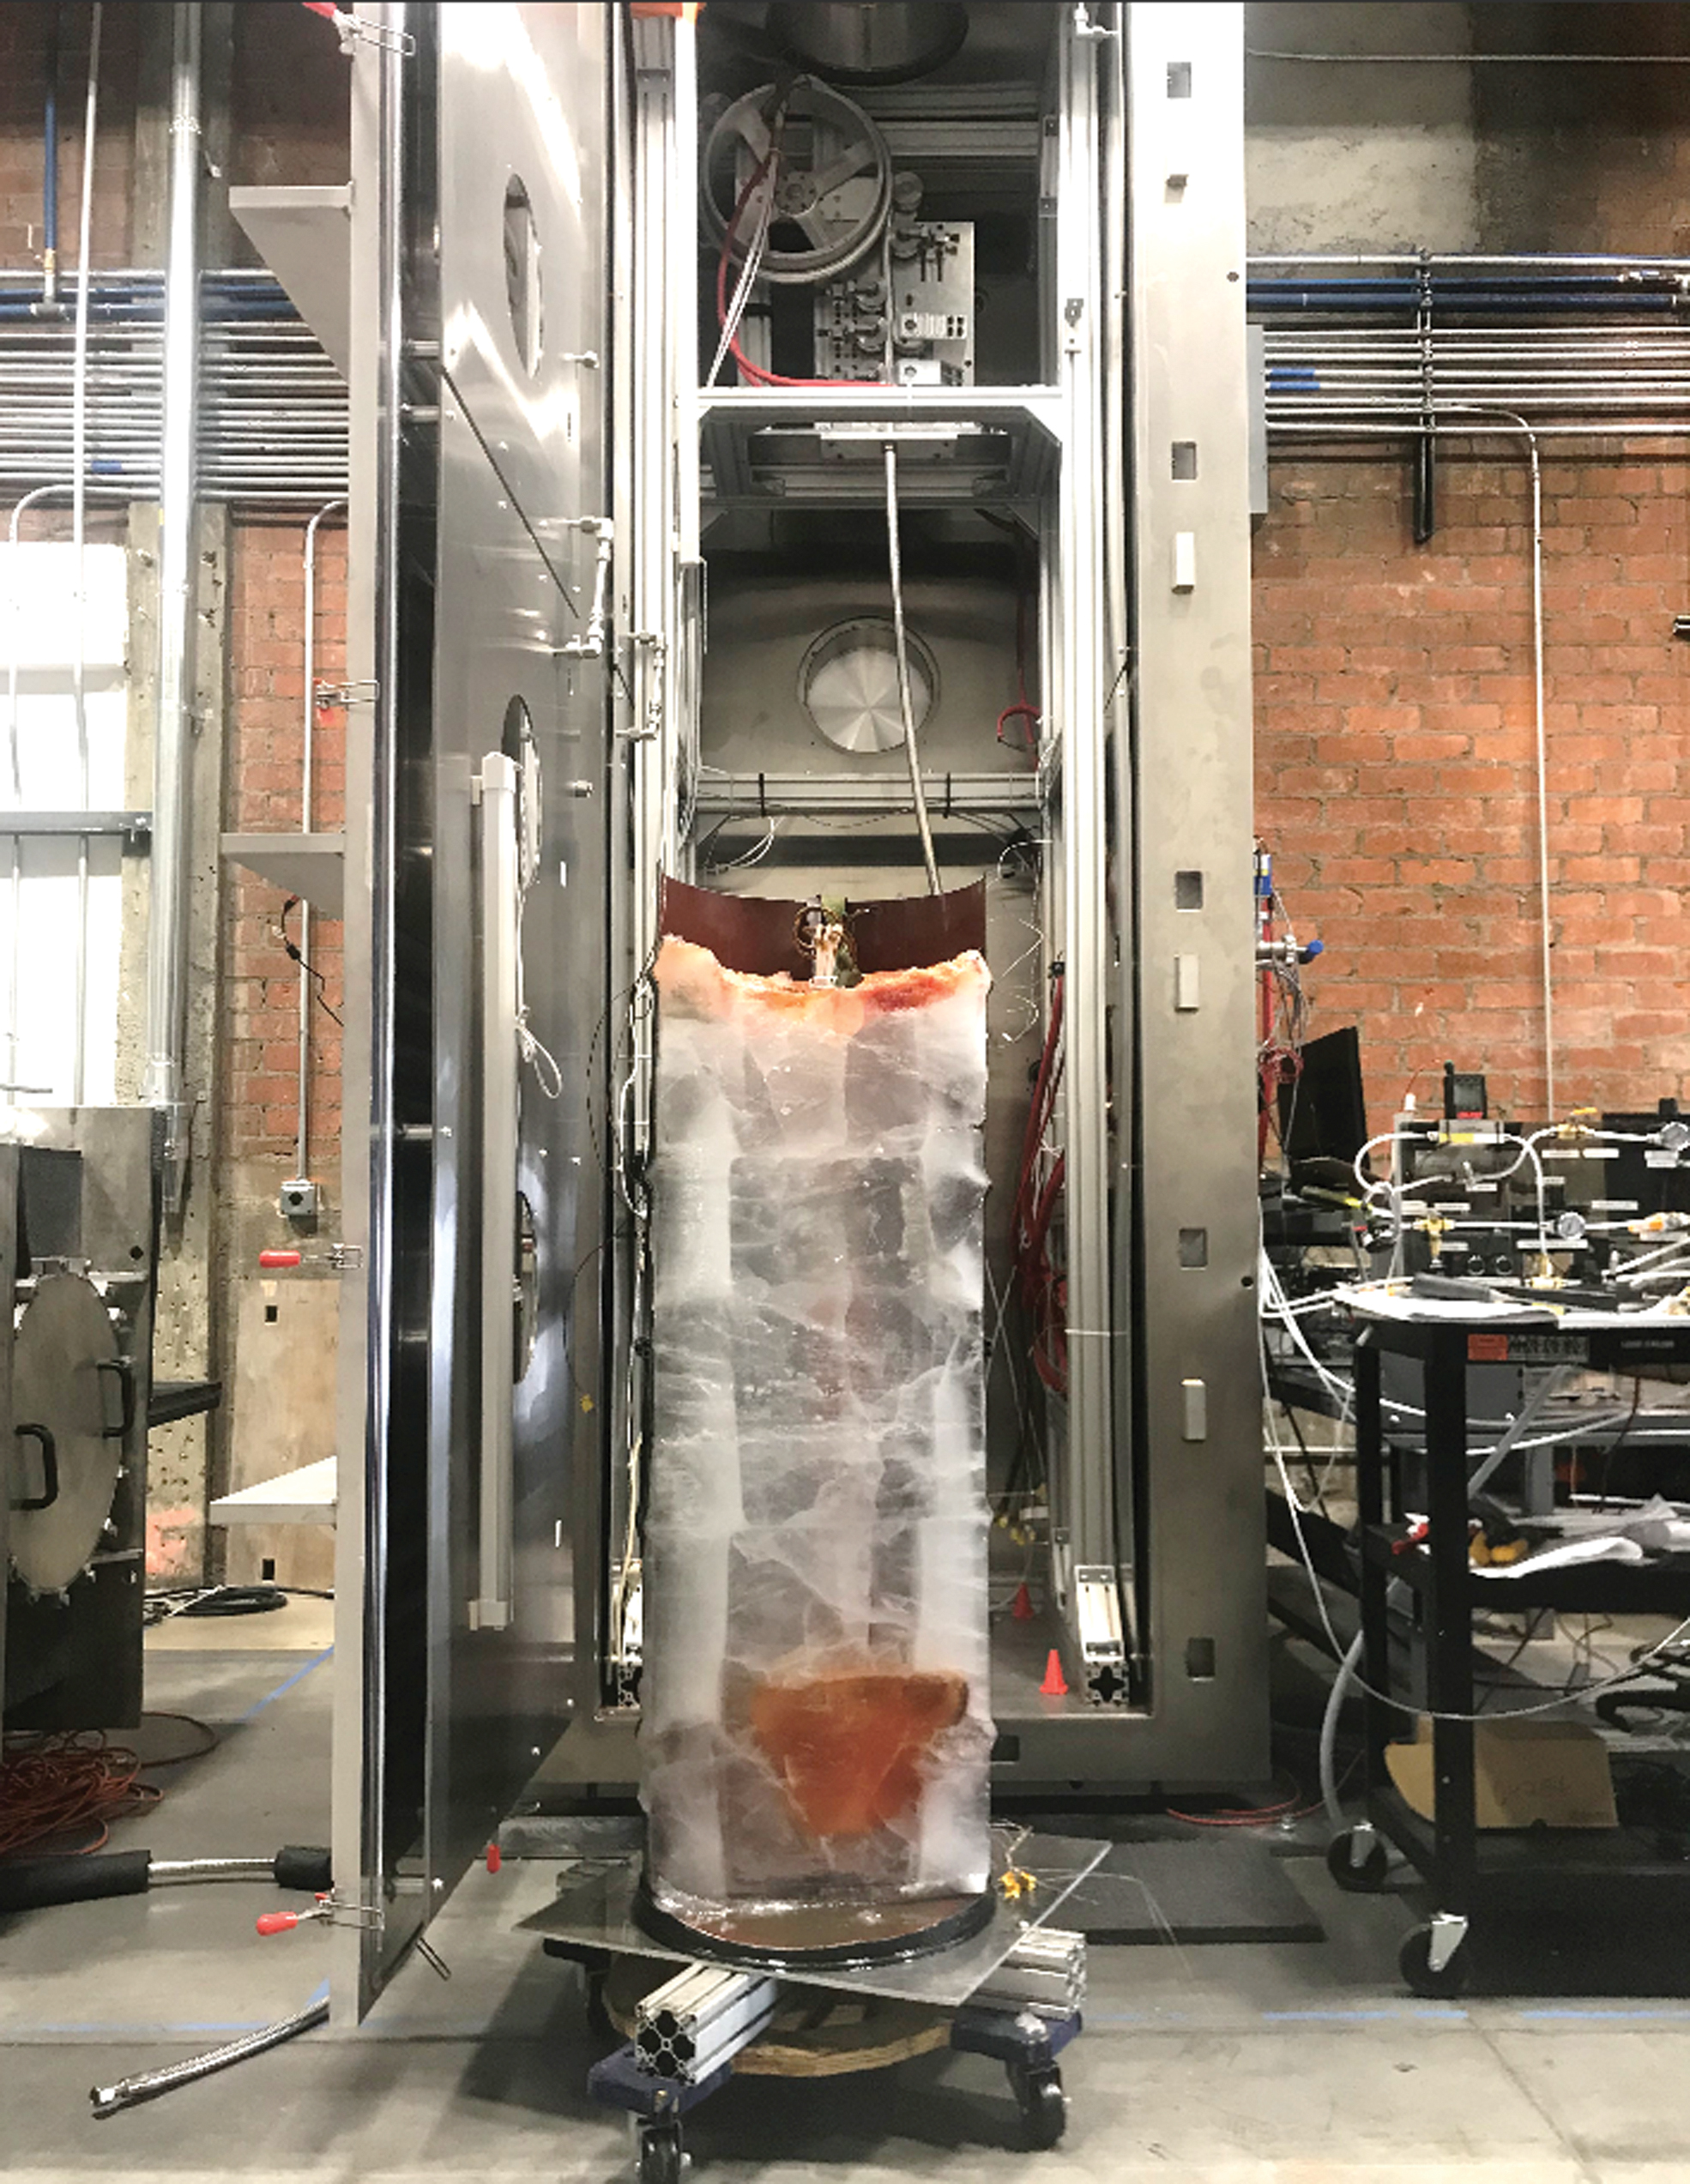
The final well geometry was measured post-test by removing the outer drum barrel and cutting the ice block in half to expose the frozen well (Fig. 20). The TCs embedded in the ice served to monitor the intermediate growth of the well, where the position relative to the well was also verified post-test to account for any deviations of the BHA during drilling (Fig. 21). The ice was cooled to about 210 K as indicated by TC1–TC8 in Figure 19, with all TCs gradually increasing as the well expanded. The bottom TC TC0 remained coldest at an average of 226 K.
Vertical cross-section of the ice was made with a chain saw (left), allowing to take measurements of the maximum diameter (28 cm) (right), height (22 cm) and estimate the volume (6.6 L) of the well assuming a perfect paraboloid. Note the top of the well curved because of the difference in densities between ice and liquid water. Color images are available online.
Left: A horizontal cross-section allowed for the verification of the TC's exact position (top row located 110 cm from top of drum) relative to the center of the well after the test. Right: These measurements were input into a CAD schematic to get more precise dimensions to calculate well volume over time when detected by the TCs that were spaced out radially within the ice. Color images are available online.
The well reached a final volume of 6.6 L with a diameter of 28 cm and a height of 22 cm, giving a D:H ratio of ∼1.3 (same ratio was observed in freezer testing with −5°C ice). Tables 5 and 6 summarize the input parameters and output data recorded during melting. The well grew vertically downward from ∼90 to 112 cm depth relative to ice surface so that the auger was almost completely submerged in the well except for the top 1–3 cm (the auger and bit assembly measure 12.3 cm in length). The total melting time was 156 min (of which the last 44 min was with the auger rotating in the well and accounted for more than 50% of the total well volume) and the average power draw was 858 W over the entire melting duration.
Input Melting Parameters for Thermal Vacuum Chamber Test
Measured Average Outputs from Thermal Vacuum Chamber Test Data
The average power draw was higher, whereas the auger was rotating (i.e., more heat was being dissipated into the well): 1.3 kW versus 570 W. The final melting efficiency for the 6.6 L well reached 27%, which was calculated based on the latent heat needed to melt the final well volume divided by the total energy output by the auger heaters. This is likely a conservative number since boundary effects from the LN2 cooled drum throttled the production rate as the well expanded. Due to the small scale of the test and boundary effects however, extrapolation of these results is likely not representative of a full-scale ISRU flight system producing larger quantities of water in subsurface Martian ice. Thus, additional modeling and validation testing without these boundary effects is recommended.
Water Extraction
The BHA was unable to advance further into the well to extract most of the produced liquid water because of a freeze-in condition that likely occurred above the heated auger (which was rotating and creating the well). With the well forming from a depth of ∼89–91 cm and extending downward, the BHA tubes were likely near or just above surface of the well. Nevertheless, a small amount of water was extracted (<100 mL) where the borehole pressure was increased from ambient chamber pressure to 29.7 PSIA, resulting in an estimated flow rate of 0.83 lpm.
The water was extracted into a Nalgene vessel (Fig. 22) located inside the TVAC and regulated to an ambient pressure ∼50 Torr by using a pressure relief valve to maintain the pressure above the water triple point to prevent boiling. Surprisingly, the extracted water was clear even though the well was dyed red during the melting phase. It is possible that the ice cuttings from the final 1–2 cm that were drilled without pneumatics and left behind to prime the melting phase, entered the outer tubes and melted without mixing with the red-dyed water in the well that formed below. According to a post-analysis, drilling 2-cm with the 2.75-inch (70 mm) diameter RedWater bit corresponds to ∼80 mL of liquid water, which is very close to the extracted amount of water.
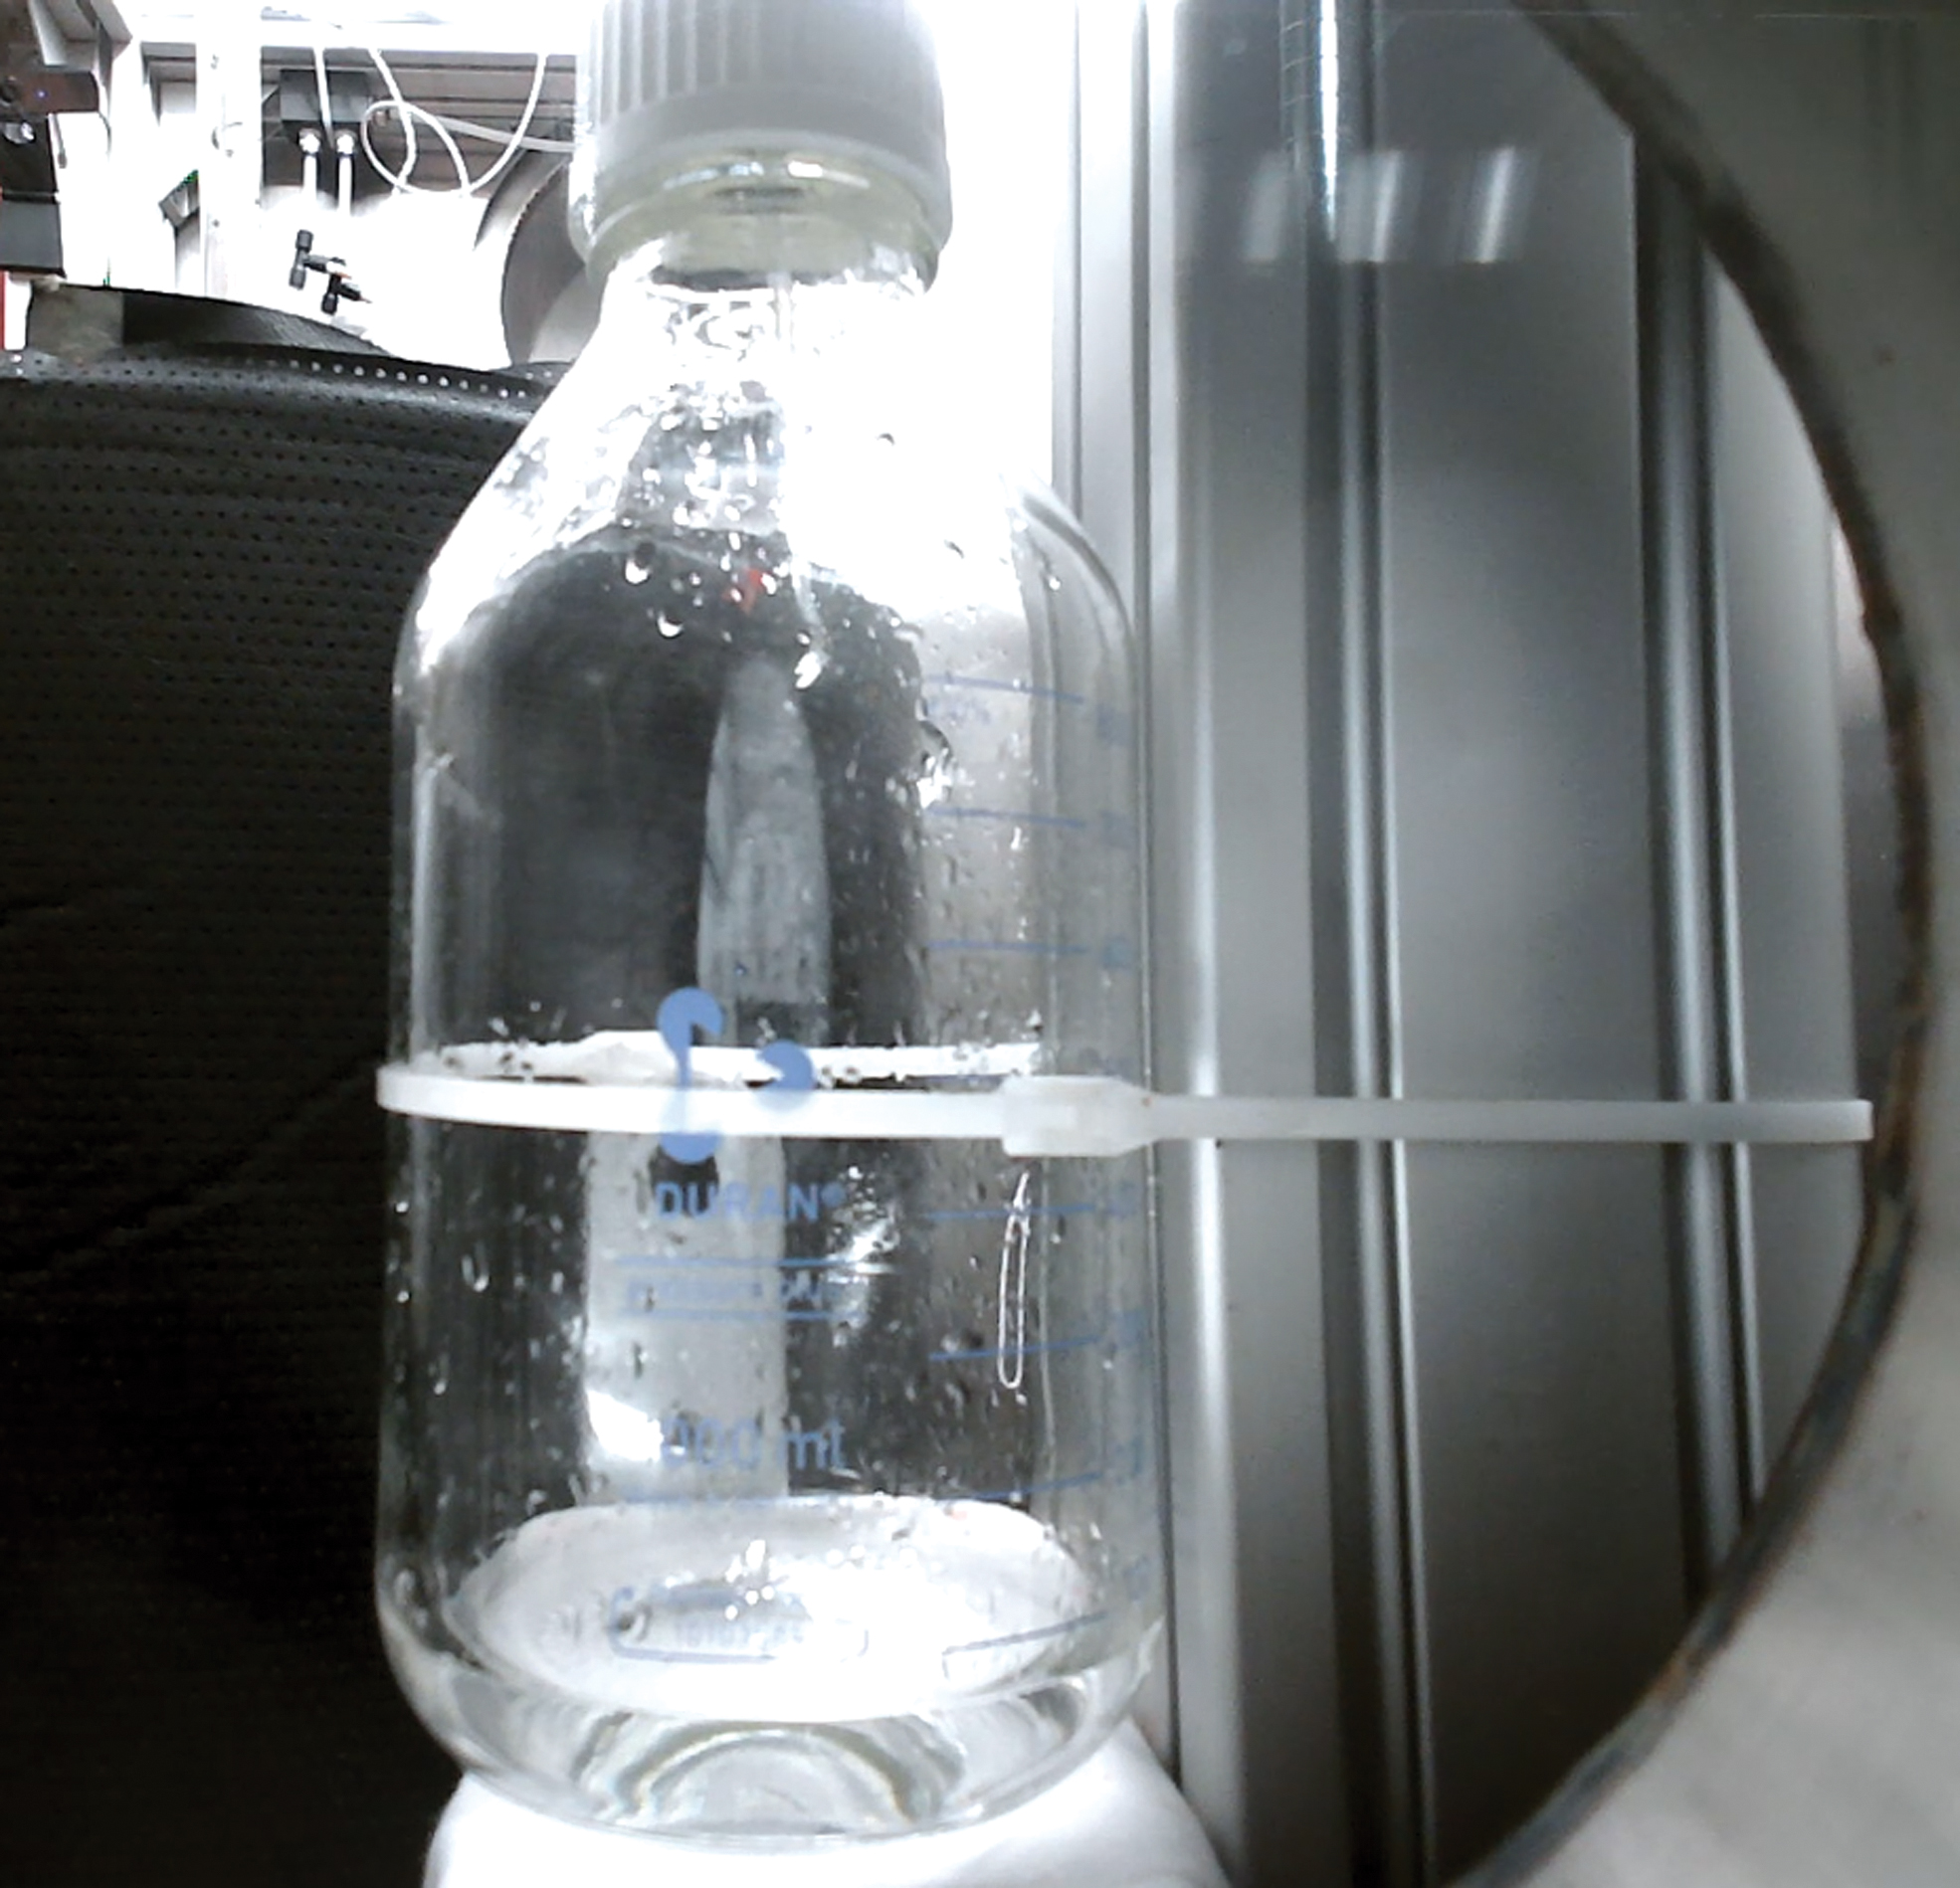
Approximately 80 mL of water was extracted to a Nalgene vessel in the TVAC after a well was melted. To extract water, the borehole that was already sealed with the packer was pressurized from the Valve Control Station to 29.7 PSIA, resulting in an estimated 0.83 lpm flow rate of pure liquid water. Color images are available online.
Discussion
The freeze-in condition described in the Melting section, which prevented the BHA advancing into the well to extract more water, likely occurred because an unheated BHA section was exposed to “wet” ice cuttings that refroze. In the current design, the auger (Fig. 4) is the only heated section that makes the hydraulic tubes and other surfaces susceptible to freeze-in conditions. It is, thus, recommended to integrate heaters such as the coil type that can be wrapped over the entire length of the BHA. A thermal analysis would be needed to confirm that a sufficient amount of heat can be dissipated into the surrounding environment to unfreeze the BHA without overheating the internal electronics given that certain sections may not be directly in contact with the surrounding ice/water to dissipate the heat directly.
Another lesson learned was that ice cuttings can easily get the auger/bit stuck, especially with added heat. This likely occurred with the cuttings that were purposely left at the bottom of the borehole after drilling to facilitate priming the melting process. Rodriguez wells rely on liquid water that is continuously being recirculated between the surface and the well. Similarly, the RedWater system can pump a small amount of liquid water from the surface to prime melting rather than using ice cuttings, which can partially melt and cause a freeze-in condition when the heaters are initially turned on.
The TRL-5 RedWater design specs and results obtained from system-level testing in both the TVAC and walk-in freezer at Honeybee are summarized in Table 7. It can be seen that the system was designed with plenty of margin to be able to meet possible new requirements and uncertainties. For example, the system was designed to meet an average continuous power output of 300 W mechanical, and the auger heaters are rated for a maximum output of 5800 W thermal power compared with an average of 173 W mechanical and 1100 W thermal power measured during freezer testing.
Summary of Technology Readiness Level-5 System Test Results Versus Design Specifications
Max WOB was determined by the load cell being preloaded by a CT until slippage was detected at the Injector. Same roller configuration and CT material was used as for TVAC and freezer testing.
Total average thermal power includes with and without auger rotation.
Based on TRL-4 subsystem breadboard testing.
Assumes an ice density of 0.9167 g/cc.
CT, coiled tubing.
The system required even less power in TVAC testing; however, the lower thermal power (860 W) is a result of the heated auger being stationary and not stirring the well, which increases the thermal dissipation. Note that “n/a” values in Table 7 represent test results and not design specs (e.g., the measured gas to ice cuttings mass ratio). The max. available drill depth was limited by the 3.4 m CT that was spooled on the injector drum compared with ∼1.0 to 1.5 m deployed during testing, which was limited by the height of the TVAC and freezer, respectively. The minimum required drilled depth is driven by the packer location relative to the drill bit, which is 101 cm from the tip of the bit to the top of the packer. For a full-scale flight system, the packer would likely decouple from the BHA once it is set in the ice, allowing for much deeper wells to be created. Additional packers could also be integrated to e.g., isolate permeable zones to prevent gas leaks when pumping water to the surface.
The average ROP when drilling ice in the freezer versus in the TVAC was 0.54 mm/s (1.93 m/h) and 0.59 mm/s (2.1 m/h), respectively. The ROP in −20°C ice used in an earlier breadboard test was also around 0.5 mm/s (1.8 m/h). These similar ROP results can be explained by the fact that the mechanical properties of ice, such as the onset of ice ductility, transition at much colder temperatures, around 165 K (−108°C). 13 Note also that the same type of homogenous sculpture ice blocks and similar drilling parameters were used for all tests so that the data sets could be compared.
The slightly higher ROP in the TVAC and freezer tests compared with the breadboard (by 6% and 16%, respectively) can be explained by the fact that the auger and percuss speeds were higher than the breadboard: 120 rpm and 972 bpm for the freezer and TVAC tests compared with 105 rpm and 805 bpm for the breadboard. Also, cuttings were not cleared during the breadboard test over the 10 cm drilled depth (Fig. 23, right). Drilling parameters were kept constant, which includes the set auger torque and set WOB (4 Nm and 300 N, respectively) for all tests performed.
Breadboard testing of the BHA auger and percussion mechanisms attached to the LITA drill (left). LITA is a 1 m class drill with a linear stage that was used to advance the BHA and provide WOB feedback. The test was performed in approximately −20°C to 10 cm depth (right) with the BHA auger and percussion set to 105 rpm and 810 bpm, respectively. The average ROP was measured to 0.51 mm/s (1.8 mm/h) based on a position encoder mounted on the linear stage motor. LITA drill, Life in the Atacama drill; WOB, weight-on-bit. Color images are available online.
The target mass flow rate of CO2 to clear cuttings during drilling at a Mars ambient pressure was estimated to be within 0.5 and 3.0 g/s based on generated pneumatic modeling and validation breadboard tests. Results showed that 0.55 g/s was sufficient to clear cuttings at Mars pressure (∼5 Torr) to maintain a constant drilling ROP to ∼1 m depth compared with 18.5 g/s at Earth ambient pressure, which shows that the model is conservative and that using pneumatics for drilling/sample handling applications on Mars is more efficient than on Earth.
It is expected that even less gas would be required on Mars than reported due to the lower gravity effects assuming the same depth and hole geometry. 14 Note, however, that our model should be expanded to account for additional frictional losses in longer pneumatic lines and deeper drilled boreholes that are expected for a system deployed on Mars.
The target ice temperature was −60°C based on the expected ice temperature at 20 m depth (deepest regolith-ice boundary) at the Viking 2 site (similar latitude to Arcadia Planitia) where the ice temperature warms up with depth. The LN2 coils that were wrapped around the ice drum (Fig. 7) brought the ice temperature at the start of the test down to −73°C (210 K) measured by TC8 at the side of the drum and −53°C measured by TC0 at the bottom of the drum (Fig. 8).
The final ice temperatures were −30°C (243 K) and −39°C (234 K) for the same TCs when the heaters were turned off. Thus, adding a separate cooling loop under the ice drum and controlling the LN2 flow rate with temperature feedback may help maintain a more uniform temperature in the ice in future testing to make the test more representative of the targeted subsurface ice temperatures on Mars.
The ambient pressure target was set to 5 Torr, which represents the approximate average Martian surface pressure. The roughing pump on our TVAC brought the ambient pressure to 1–2 Torr, which increased to 7–8 Torr during drilling (Fig. 16) because of the gas that was injected into the borehole to clear ice cuttings during drilling. The ambient pressure remained around 1–2 Torr during the melting and water extraction phases, bringing the pressure below the water triple point where liquid water cannot exist.
The original target borehole pressures required to pump water from the borehole (10 and 25 PSIA for Mars and Earth ambient pressures) assumed a 3 m length of tubing that had to be increased to 10.5 m for the final length used in the TVAC and freezer testing. Thus, the borehole pressure had to be increased to account for the increase in tubing length assuming a 2 lpm flow rate. A hydraulic model was developed and validated with a 10.5 m length of ¼ in OD × 3/16 in inner diameter tubing by using a TRL-4 breadboard that was demonstrated at Earth ambient pressure with a 39 PSIA borehole pressure and a packer pressure of 69 PSIA, which resulted in 1.5–2 lpm water flow rate.
For Mars ambient pressure, the borehole pressure can be lowered to ∼25 PSIA due to the lower ambient pressure for the same flow rate and tube configuration. This result formed the baseline for the TVAC test; however, since the inlets of the outer BHA tubes (Fig. 4) were likely not submerged (reaching an estimated depth of 90 cm from the surface), the borehole pressure was gradually increased to about 30 PSIA to ensure that as much water could be extracted as possible. The resulting flow rate was estimated between 0.5 and 1 lpm, where a significant amount of gas (assumed over 50% volume) was observed since the flow was not steady.
This can explain the discrepancy with the higher modeled results which assume the tubes are always submerged in the well. Note that the packer was inflated to 45 PSIA pressure, which sealed the borehole without any leaks observed (from both the packer and the borehole) that was monitored from the Valve Control Station by using the flow meter, borehole, and pressure gauges (F1, P1, and P2, respectively, in Fig. 13).
Conclusions
The TRL-5 RedWater system was validated with an end-to-end full-scale test performed under Mars simulated conditions in approximately −60°C ice and ∼5 Torr Mars ambient pressure. During this test, the integrated system successfully demonstrated all the critical steps necessary to bring water from below an icy subsurface to an H2O tank/vessel at the surface. These steps included: drilling to ∼1 m depth with pneumatics to clear cuttings, borehole sealing, and pressurization with an inflatable packer, melting a 6.6 L well in the ice, and extracting a small amount of water (∼100 mL) via a 10.5 m total tube length to the surface.
Figures 22 and 24 show that the system performed the necessary steps successfully, and Table 7 summarizes the design specifications and test data from both the freezer and TVAC system-level testing. It can be seen that the performance/test data are within the design specifications of the system, confirming the validity of the subsystem-level testing and design margins.
The BHA was detached from the CT and removed with the ice drum from the TVAC. The ice drum was split in half, exposing a cross-section of the parabolic-shaped well (dyed red) that reached a final volume of 6.6 L. Color images are available online.
It is recommended that future development includes adding heating capability to the entire surface of the BHA and the ability to decouple the packer from the BHA to produce larger wells while minimizing the risk of freeze-in conditions. From an operational standpoint, it is also recommended that melting is primed with liquid water that is injected into the borehole from the surface rather than using pre-drilled ice cuttings that can easily refreeze and stall the auger.
To develop a higher TRL system, further validation should be performed in less ideal conditions such as a mix of water ice with dust and debris (with the addition of a water separation and purification system) and an overburden layer with a mix of fine dust with a variety of rock sizes. This can present different challenges, such as, for example, hydraulic lines blocking or sediment collecting on the bottom of the well, which need to be addressed by an ISRU system such as RedWater for a future landed mission to Mars.
Footnotes
Acknowledgments
The authors would like to thank the following individuals for their input and help: Hari Nayar, Julie Kleinhenz, Diane Linne, Jerry Sanders, and Brian Wilcox.
Author Disclosure Statement
No competing financial interests exist.
Funding Information
The work has been funded by the NASA BAA Next Space Technologies for Exploration Partnerships-2 (NextSTEP-2), In Situ Resource Utilization (ISRU) Technology.