
Abstract
Abstract
Aim:
To explore the gradient between the acute-phase response (APR) and peritonitis of differing severity.
Methods:
In 202 patients with peritonitis, we determined serum concentrations of interleukin (IL)-6, IL-10, IL-13, tumor necrosis factor (TNF)-α, and C-reactive protein (CRP). The severity of peritonitis was graded in accordance with the Mannheim Peritonitis Index (MPI). The grade–response relation between the severity of peritonitis and each analyte was explored.
Results:
A statistically significant association was found between the medians of severity of peritonitis and IL-6 (p < 0.025), TNF-α (p < 0.01), CRP (p < 0.033), IL-10 (p < 0.0001), and IL-13 (p < 0.004). Both TNF-α and IL-10 had a direct, and IL-13 an indirect, relation to severity, whereas CRP and IL-6 tended toward linear behavior in equilibrium. A significant association persisted between individual MPI scores and IL-6 (p < 0.002), TNF-α (p < 0.002), CRP (p < 0.002), and IL-10 (p < 0.001), but not IL-13 (p = 0.646).
Conclusion:
Around the mean value of grade II peritonitis, the equilibrium between pro-inflammatory and anti-inflammatory cytokines is lost. This change coincides with the 26-point threshold for the MPI.
Multiple organ dysfunction commonly develops secondary to the systemic inflammatory response syndrome (SIRS). Cytokines are among the best-identified candidates for mediating SIRS/MODS. The final outcome of SIRS does not depend on any single cytokine. Rather, the intricate interaction of neuroendocrine, inflammatory, metabolic and coagulation factors; oxidative stress, hypoperfusion, endothelial lesions, and apoptosis dictates the disposition and condition of the patient [3]. An unfavorable outcome in secondary peritonitis can be explained only as a multi-causality paradigm. Therefore, it is imperative to establish the role played by each putative agent.
Cytokine participation in SIRS/MODS, leading to death from sepsis, meets most of Bradford Hill's criteria of causation [4]. The temporal relation and strength of this association have been confirmed in numerous studies [5–9]. The present physiopathological explanation is that there is an excessive or prolonged inflammatory response, an inadequate anti-inflammatory reaction, or an inappropriate equilibrium between these two responses that leads to greater severity of lesions and death [10]. This is a plausible hypothesis.
As to the role of cytokines in the unfavorable outcome in secondary peritonitis, the criterion of causation that has been the least explored is that of the dose–response relation between these factors and the severity of peritonitis. A dose–response relation exists when variation in the magnitude of the proposed cause correlates with variations in the magnitude of the effect [11].
We studied the grade–response correlation. The purpose of this study was to describe the gradients among interleukin (IL)-6, tumor necrosis factor (TNF)-α, C-reactive protein (CRP), IL-10, and IL-13 and secondary peritonitis of increasing grades of severity.
Patients and Methods
A longitudinal comparative study was undertaken at the Department of Surgery of the Hospital General de Durango (Mexico) from February 15, 2006, to June 30, 2007, using all inpatients, 18 years of age or older, who had surgically confirmed secondary peritonitis. This diagnosis was established by the identification of a perforation or necrosis with inflammatory peritoneal liquid either localized in an intra-abdominal abscess or accompanied by generalized peritonitis. Patients with immunodeficiency or those who used or had a history of chronic usage of immunosuppressive agents were excluded.
Non-probabilistic sampling of consecutive cases was undertaken. After their surgical intervention, and on admittance to the Department of Surgery, all patients with secondary peritonitis reported in their surgical record were allocated to our study.
In order to explore the early induced response (4–96 h), a blood sample was taken from each patient 18 to 24 h into the postoperative period. By this time, the response to infection is well into its second phase [12], and the regulatory influence of cytokines on the patient's evolution is pivotal [13].
All samples were centrifuged, and the serum was cryopreserved at −40°C until use. The samples were processed to determine TNF-α (pg/mL), IL-6 (pg/mL), IL-10 (pg/mL), IL-13 (pg/mL), and CRP (μg/100 mL). Each analyte was determined separately using a standard enzyme-linked immunosorbent assay (ELISA); IL-6 and IL-10 were determined with Quantikine® HS (Research and Diagnostics Systems, Minneapolis, MN; IL-6, sensitivity = 0.016–0.110 pg/ml, coefficient of variation [CV] intra-assay 7.3% and inter-assay 7.7%; IL-10 sensitivity ≤0.5 pg/mL, CV intra-assay 7.7%, and inter-assay 11.3%); IL-13 and TNF-α with Quantikine® kits (Research and Diagnostics Systems; IL-13, sensitivity ≤32 pg/mL, CV intra-assay 4.9% and inter-assay 5.5%; TNF-α sensitivity = 0.5–5.5 pg/mL, CV intra-assay 4.6% and inter-assay 5.8%.). C-reactive protein was determined with the AlerChek kit for CRP (AlerCHEK™ Inc. Portland, ME) and had a sensitivity of 0.12 mg/dL, with a CV of 2–6%.
In accordance with the Mannheim Peritonitis Index (MPI) score, each patient was assigned to one of three groups with respect to severity: <21 points = grade I; 21 to 29 points =grade II; and >29 points = grade III [14]. The MPI is derived from a cohort study of 1,234 patients with purulent peritonitis and has been validated in Europe, Asia, and North America [14–18]. The score is the sum of points given according to the presence or absence of any of eight adverse factors relevant to prognosis: age >50 years (5 points), female gender (5 points), organ dysfunction (7 points), malignant disease (4 points), duration >24 h (4 points), non-colonic origin (4 points), diffuse generalized peritonitis (6 points), and the appearance of the exudate (cloudy 6 points; feculent 12 points). The mortality rate of grade I, II, or III peritonitis is close to zero, 6%, and >50%, respectively. [15]. The MPI is the simplest of the scoring systems available and can be used in the under-staffed and under-equipped circumstances common in much of the world [18]. Its simplicity has contributed to expansion of its use in spite of resistance to its employment by some First World surgical academic circles.
For each analyte, common descriptive statistics were calculated: Mean, standard deviation (SD), variance, median, skewness, and kurtosis. In order to explore the grade–response relation between the dependent variable, the severity of peritonitis, disease grade, and the independent variables represented by each analyte, we used multiple regression. We also explored multiple linear regression between individual MPI scores and each analyte, and simple correlation to compare the models was obtained.
For statistical analysis, SPSS v. 15.0 (SPSS Inc, Chicago, IL) and Statistica 7.0 (StataSoft Inc., Tulsa, OK) were used. In all cases, α was 0.05 and the significance p < 0.05.
In accordance with Mexican medical legislation, the Ethics Committee of the Hospital General de Durango, SSD approved the study, which they classified as “minimum risk.” Signed informed consent was obtained from each patient.
Results
During the study period, 202 patients meeting the inclusion criteria were admitted, of whom 61.4% (n = 124) were male. The mean age for both genders was 39.9 ± 20.1 (SD) years. Seventeen patients died (overall mortality rate 8.4%; 95% confidence interval [CI] 5.1%, 12.5%). The mean hospital stay for all the patients was 5.3 ± 4.4 days.
The most common source of secondary peritonitis was the appendix: 67.3% (n = 136). Of the patients with appendicitis, 78 (57.4%) had uncomplicated appendicitis and 58 (42.6%) perforated or gangrenous appendicitis. Other common sources of contamination were the jejunum and ileum 10.3% (n = 21); colon 7.9% (n = 17); stomach 3.46% (n = 7); and gallbladder and biliary tree 3.46% (n = 7). Less frequent sources were the liver 2% (n = 4); the uterus and fallopian tubes 2% (n = 4); and the duodenum, pancreas, and the spleen 1% (n = 2) each.
The time interval from the onset of symptoms to presentation at the hospital differed, with an impact on patient outcome. This was taken into consideration in the MPI, using as a threshold 24 h of evolution. With respect to the severity of their peritonitis, 79.7% (n = 161) of the patients were grade I, 11.9% (n = 2) grade II, and 8.4% (n = 17) grade III.
Figure 1 shows the histogram of each variable studied. The MPI tended to be mesokurtic, with a slightly positive skewness. All the analytes were frankly leptokurtic and had positive skewness, with the exception of CRP, which was negative with respect to this trait.
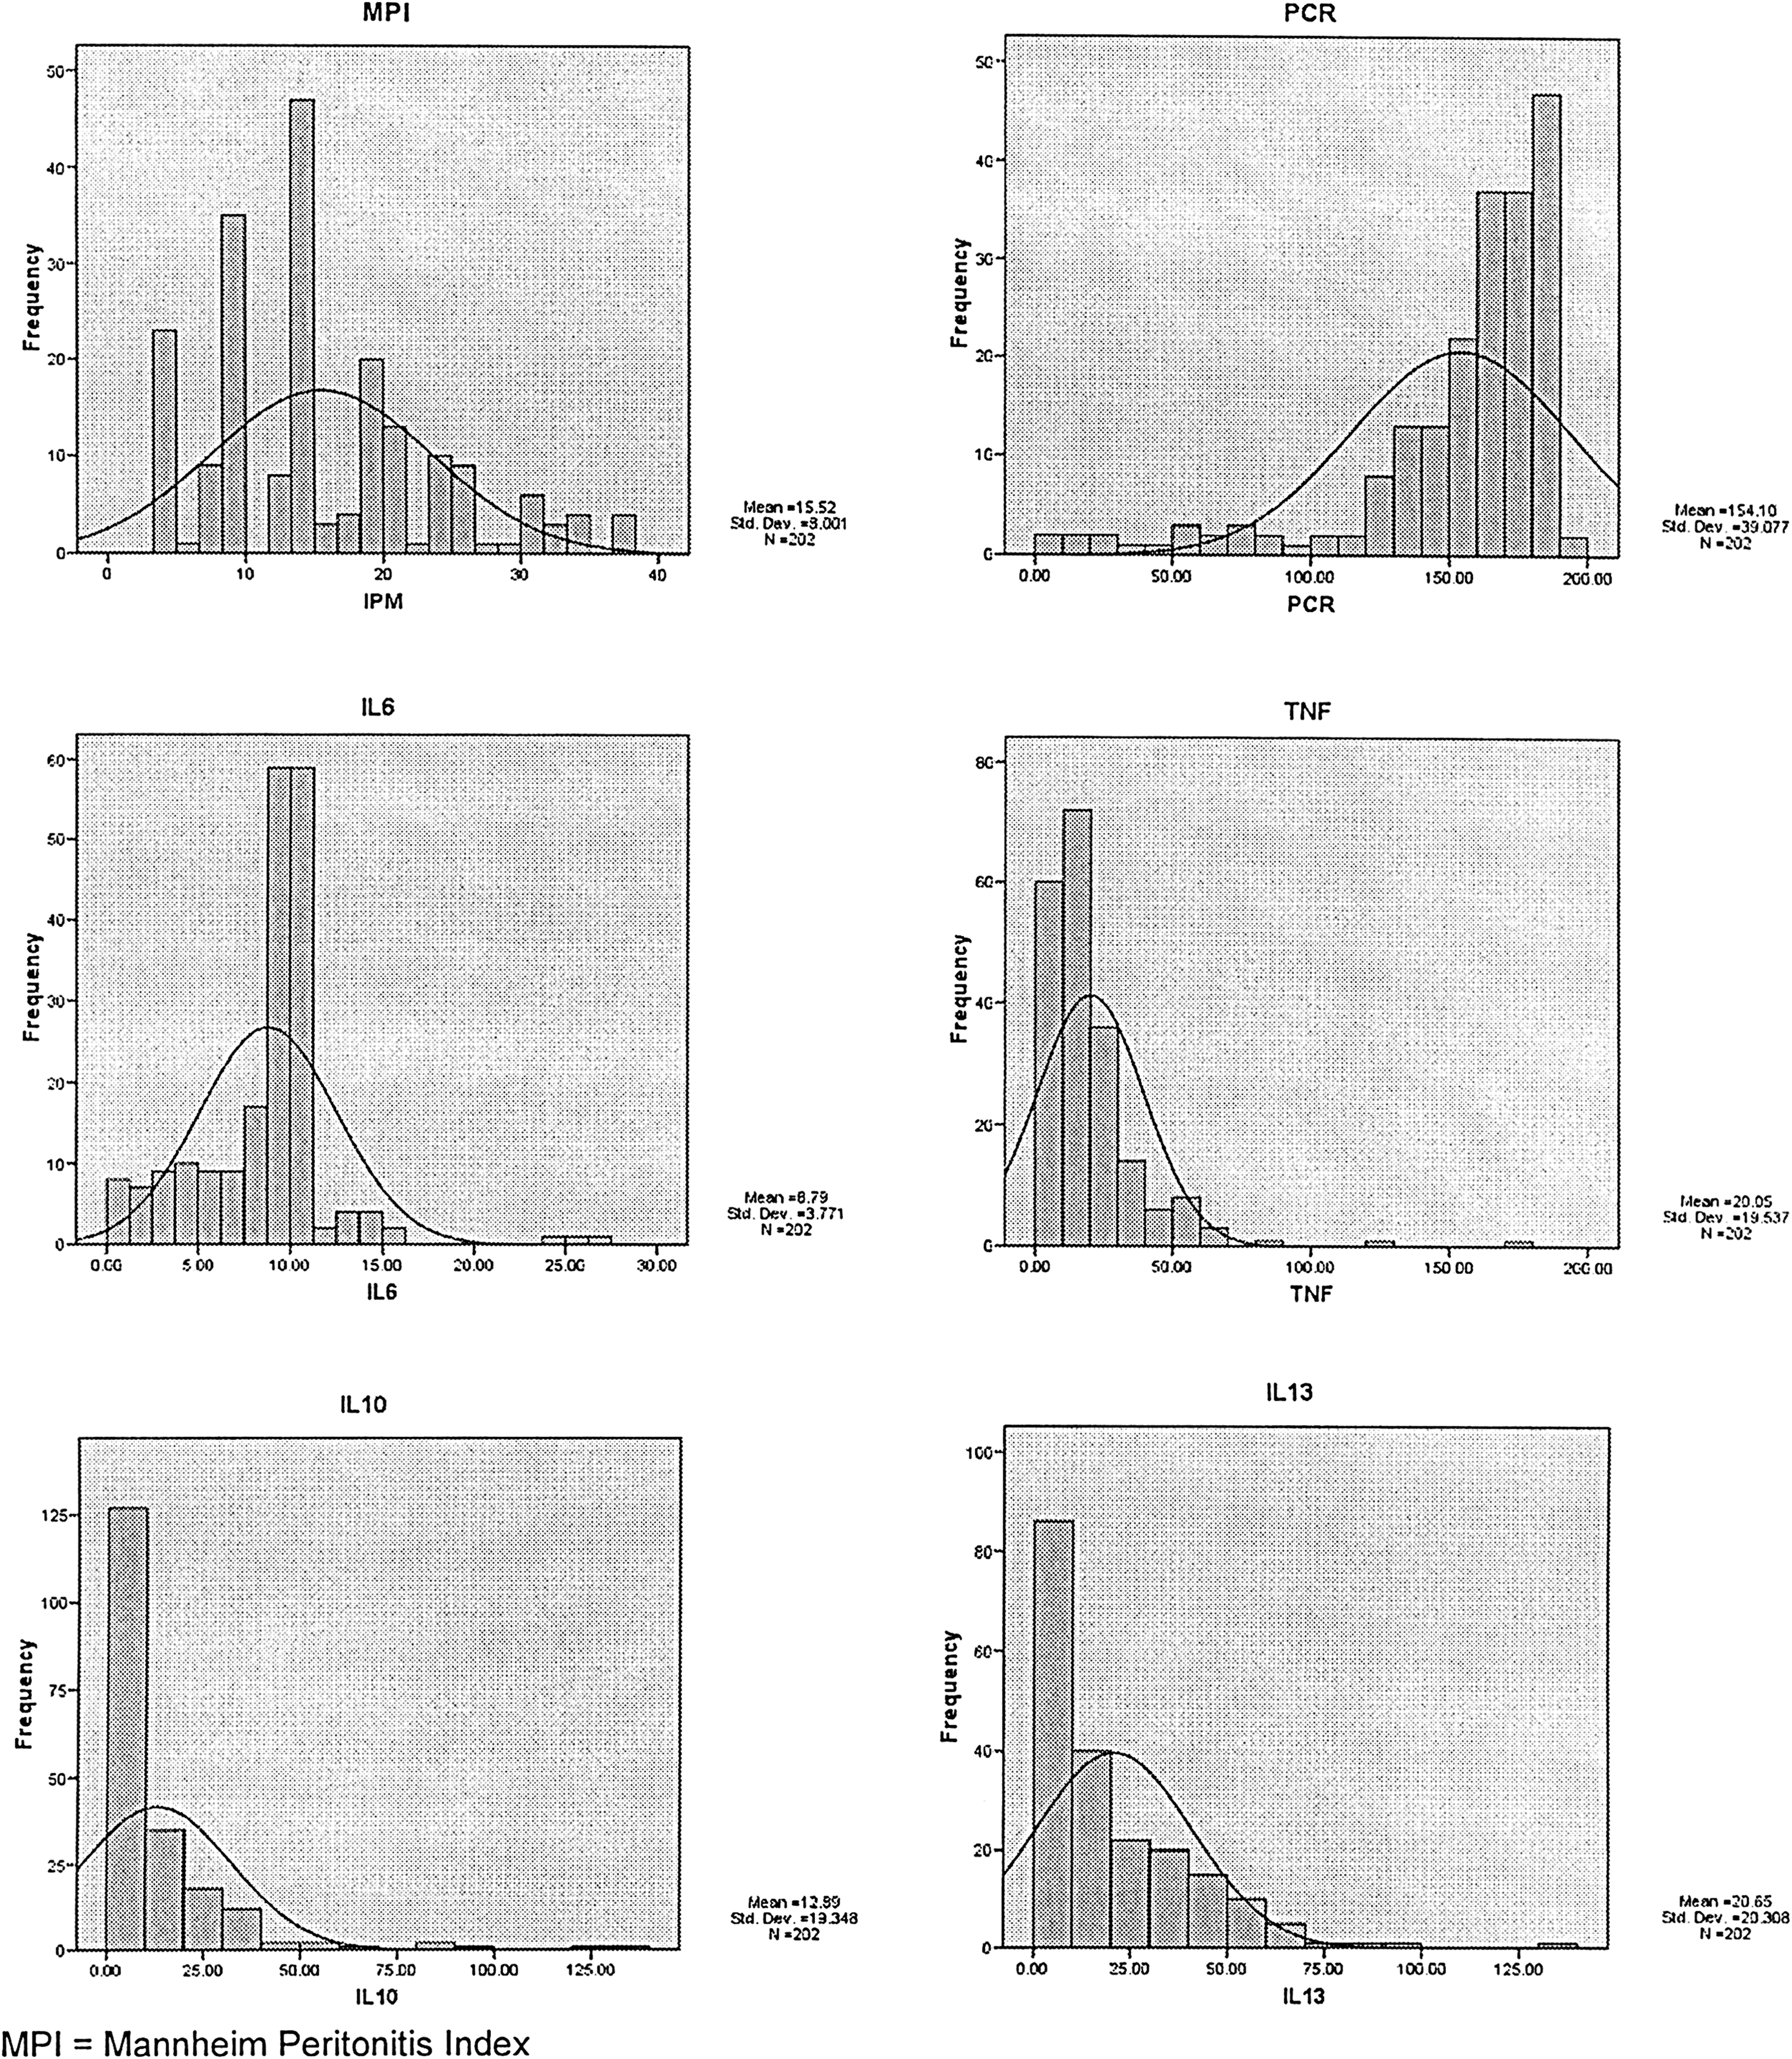
Mannheim Peritonitis Index tends to be mesokurtic with slight positive skewness. All analytes were frankly leptokurtic and had positive skewness with exception of C-reactive protein, which was negative. All units on x axis were measured in picograms with exception of CRP (PCR), which was measured in milligrams. The results dictated the use of variable medians instead of means. TNF = tumor necrosis factor-alpha; IL = interleukin.
Considering the data distribution (Fig. 1), we decided to use the median test to compare each analyte with peritonitis severity. A statistically significant association was found in the case of all analytes, as shown in Table 1.
CRP = C-reactive protein; IL = interleukin; TNF = tumor necrosis factor; F = frequency.
In Figure 2, the behavior of each analyte median at each grade of peritonitis severity is analyzed. The result of the multiple correlation analysis between individual MPI score and the corresponding value for each analyte is presented in Table 2.

Median values of analytes. Each acts in different manner in accordance with Mannheim Peritonitis Index gradient. Around grade II midpoint is the break point, where analyte slopes change course. PCR = C-reactive protein.
Correlation significant at 0.001 (two-tailed).
Multivariable analyses of candidate predictors are shown in Table 3. Using backward stepwise regression, the first model included IL-13, IL-10, IL-6, TNF-α, and CRP (explanatory variables) and MPI (dependent variable). This model indicated statistical significance (p < 0.001) in the prediction of the MPI, but the elimination of IL-3 (second model) offered better reliability.
Predictors: (Constant), IL-13, IL-10, IL-6, TNF-α, CRP
Predictors: (Constant), IL-10, IL-6, TNF- α, CRP
CRP = C-reactive protein; IL = interleukin; MPI = Mannheim Peritonitis Index; TNF = tumor necrosis factor.
Consider the multivariable regression equation:
After we adjust all our study variables according to the second model, the equation becomes:
If we replace the values of the coefficients, we have:
After we introduced each patient's analyte values into Equation 3, we obtained the calculated MPI (MPIc). With the statistical package, we ran a simple correlation, obtaining a low, but significant, correlation (r = 0.387; p < 0.001).
Because the dynamics of the different analytes are diverse, and their slopes differ at distinct moments, we ran partial regression models for each MPI severity. At grade I, we observed a better association with IL-6 and CRP. At grade II, a greater association with IL-10 with a negative slope was observed. With grade III severity, the association between MPI and all analytes was weakest.
Equations 4–6 correspond to the MPIc of each degree of severity: Grades I, II, and III (Table 4):
CRP = C-reactive protein; IL = interleukin; TNF = tumor necrosis factor.
After entering specific formulas for each grade of severity, we recalculated, and calculated correlations between each grade of MPI, MPIc, and MPIca. The non-adjusted model r2 (0.1496) increased to 0.7198 with the model adjustment.
Discussion
These results confirm the presence of a grade–response gradient between peritonitis severity (MPI grade) and the cytokine/acute phase response (APR) reactant studied: TNF-α and IL-6 (pro-inflammatory cytokines), IL-10 and IL-13 (anti-inflammatory cytokines), and CRP (acute phase protein). The patterns were not consistent among analytes. We comment on those we deem noteworthy.
The absence of a normal distribution (see Fig. 1) dictated the use of medians, instead of means, to study the association between peritonitis gradient and the cytokine/APR protein. C-Reactive protein and IL-6 had constant relations with horizontal propensity. The TNF-α concentration tended to be directly proportional to the degree of severity and spikes between grades II and III. Both IL-13 and IL-10 increased toward grade II severity, and then they sloped. Whereas IL-13 fell to its lowest concentration at grade III, IL-10 continued to increase, although only slightly (see Fig. 2). The median test between all members of the APR and peritonitis severity was statistically significant (see Table 1).
Tumor necrosis factor-α, possibly the most important pro-inflammatory cytokine, displayed a direct relation to severity, with a sharp increase between grades II and III. Interleukin-10, an anti-inflammatory cytokine, also had a direct relation to severity. It increased gradually, but between grade II and III, it increased at a slower rate. Overall, IL-13, also an anti-inflammatory cytokine, correlated indirectly with severity, but initially, it increased, then decreased sharply between grade II and grade III. It would seem that the homeostatic mechanisms regulated by cytokines, specifically TNF-α, IL-10, and IL-13, have a grade–response relation to peritonitis severity, but, around the mean value of the grade II range, they are overwhelmed, such that the anti-inflammatory response fails, and the pro-inflammatory response increases.
If we consider that grade II peritonitis corresponds to MPI 21–29 points (mean 25 points), an interesting fact is noted. Linder et al., presenting the MPI, considered that values above 26 points correspond to peritonitis of above average severity. Patients with a higher score had a mortality rate that surpassed 24%, the general mortality rate of the 1,253 cases studied [15]. As stated, our data suggest that the explanation for what occurs at this point is a failure in the homeostasis between pro-inflammatory and anti-inflammatory mechanisms.
There is a grade–response relation between peritonitis severity and TNF-α, IL-10, and IL-13 during the early-induced component of the peritoneal inflammatory response. Among Bradford Hill's criteria of causation, this criterion is not always present, but, when found, it is strong evidence for a causal relation [11, 4]. This observation coincides with the literature and supports the reputed pivotal role of cytokines in an unfavourable outcome in cases of peritonitis, within their complex multicausal paradigm.
In the APR, certain serum proteins produced by the liver increase or decrease in response to stimulation by TNF, IL-1, and IL-6 [19]. C-reactive protein was the first acute-phase reactant described and probably is the most studied [20]. Interleukin-10 inhibits CRP and IL-6 production [21]. Interleukin-13 downregulates the CRP-inducing effect of IL-6 on hepatocytes and reduces the production of TNF-α [22]. Therefore, the analytes studied provide an overall picture of signaling, the effector response, and feedback during the APR.
The multiple correlation analysis of each individual's MPI score with the corresponding value for each analyte in general confirms our statement that there is a grade–response relation, with a difference. Individual MPI scores were associated significantly with IL-6 (p = 0.002), TNF-α (p = 0.002), CRP (p = 0.002), and IL-10 (p < 0.001), the only exception being IL-13 (p = 0.646) (see Table 2).
In 1987, Linder et al. published their index with clinical parameters readily calculated without the need for technological resources. They were able to characterize the eight clinical parameters they found useful in a multivariate mathematical model [15]. As shown in Equation 3, the same can be done using the patient's analyte values. An individual's MPI score can be estimated from his plasma values of IL-6, TNF-α, CRP, and IL-10.
There are numerous reports of the association between sepsis severity and one or more of the analytes explored in our work [23–26]. None has explored the dose–response relation between peritonitis severity and these cytokines/acute phase reactants.
Although secondary peritonitis is one of a variety of types of sepsis, there are substantial differences in the cases reported in different studies. Many reports include pneumonias, meningococcal infections, and perinephritis, among others. The anatomic dissimilarities in different models (e.g., the presence of the blood–brain barrier in the central nervous system) or differences in flora can render results non-comparable.
The MPI is specific for peritonitis. Other scoring indexes have different uses. A score frequently used in the study of septic patients is the Acute Physiology and Chronic Health Evaluation (APACHE) II. It is a severity of disease classification system for a heterogeneous group of conditions, not all of them associated with sepsis [27]. We judge the MPI to be the score most appropriate for the purpose of this study.
The low frequencies of some of the sources of peritoneal contamination did not allow us an analysis of an association between the source and outcome or serum concentrations of the analytes studied. However, examination of the cases of appendicitis, the most common source of secondary peritonitis in this study, showed some differences. In comparing uncomplicated appendicitis with perforated or gangrenous appendicitis, we found a statistical difference between the serum concentrations of IL-6 (p = 0.006), CRP (p = 0.0001), and IL-10 (p = 0.0001) but not of TNF-α (p = 0.729) or IL-13 (p = 0.729).
Another limitation of our study was the fact that we took only one measurement of our analytes. Cytokine dynamics during the postoperative inflammatory reaction change with time. Nevertheless, our aim was not a time course study of the APR but, as stated, to describe the grade–response relation between the severity of peritonitis and the members of the APR during the early-induced response. Our system of data collection achieved this goal.
Conclusion
The existence of a dose–response relation between the severity of peritonitis and the serum values of the members of the inflammatory cascade studied during the early-induced response has been described. The 26-point threshold of the MPI seems to coincide with the point where the balance between pro-inflammatory and anti-inflammatory cytokines is lost. Blood concentrations of IL-6, TNF-α, CRP, and IL-10 allow us to predict an individual's MPI score with considerable accuracy, underlining the crucial role of cytokines at this point. If we consider that the MPI is based on clinical criteria, our results give hard data that help to explain what may be occurring at this threshold and provide the physiological basis for what takes place in this clinical score. The knowledge of the relevancy of the putative causal factors in SIRS will one day allow us to take therapeutic measures to avoid MODS and consequent death in patients with secondary peritonitis.
Author Disclosure Statement
No conflicting financial interests exist.