
Abstract
Abstract
Background:
Approximately 20% of patients become infected after cardiac surgery. Pneumonia is one of the most serious infections, increasing the chance of death 14-fold. The higher frequency of pneumonia after cardiac surgery may be explained by surgical conditions. Focusing on high-risk groups may make several strategies more effective, and external validation is an essential phase of building prediction models to identify such groups.
Purpose:
To compare the performance of two previously validated prediction models for pneumonia after cardiac surgery (classification and regression tree [CART] and a logistic regression model [LRM]) on an external validation set.
Methods:
A series of 527 adult cardiac surgery patients at a small private hospital were analyzed prospectively to identify prognostic factors for pneumonia. Pneumonia occurred in 7.6% of patients in this derivation set. The probability of pneumonia onset was estimated by means of CART and LRM using a cut-off point that maximized both sensitivity and specificity without decreasing accuracy greatly. The results were confirmed with a validation set obtained by enrollment of consecutive 333 adult patients undergoing major cardiac surgery. There were significant differences in the fraction of emergency cases in the derivation and validation sets.
Results:
The LRM selected emergency surgery (odds ratio [OR] 5.28), chronic obstructive pulmonary disease (COPD)(OR 4.29), ventricular dysfunction (OR 2.68), and age (OR 1.04) as independent predictors of pneumonia. The CART model selected emergency surgery, age, unstable angina, body mass index, COPD, weight, and ventricular dysfunction as predictors. The CART model also selected low body mass index, weight, and unstable angina as predictors. Emergency surgery was the strongest predictor in both models. The LRM performed better than the CART model for the global, discrimination, and calibration measures.
Conclusion:
The LRM model displayed superior performance. A possible advantage of the CART prediction model is that it may be easier to interpret via its graphical presentation than prediction models based on logistic regression. However, there are a number of disadvantages of the CART approach. The LRM model can be used by infection control practitioners for risk adjustment across different periods or units and for evaluation of the efficacy of new technologies.
The higher frequency of pneumonia after cardiac surgery may be explained by surgical conditions, such as extracorporeal bypass, absence of lung ventilation during surgery, immunosuppression, insertion and maintenance of chest tubes, hypoventilation secondary to pain, and lung trauma. Therefore, preventing pneumonia is important. Choosing high-risk groups as the focus may make several strategies more effective, including selective intervention, rate adjustment, optimized surgical schedules, and surgical risk awareness.
External validation is an essential phase of building prediction models. It may involve temporal, geographical, and domain validations [3]. Prediction models tend to perform better on the original data than on new external data. This difference in performance is an indication of the optimization of the apparent performance for the derivation set and corresponds to an external validation step [4]. Most papers discussing prediction rules have been concerned mainly with the development of the rules (that is, with derivation). A smaller number of studies have addressed validation of the rules, and hardly any publications have studied their implementation and impact on physician behavior or patient outcomes [3]. This lack of external validation can be a problem because good calibration and discrimination in the development set does not guarantee good predictive value in different patients, with most prediction rules showing reduced accuracy when tested in new patients [4]. The aim of the present study was to compare the performance of two previously validated prediction models for pneumonia after cardiac surgery (classification and regression tree [CART] and a logistic regression model [LRM]), on an external validation set.
Materials and Methods
Derivation data
The CART and LRM were derived in a previous study [5], in which 527 adult cardiac surgery cases at a small private hospital from between June 2000 and August 2002 were analyzed prospectively to identify prognostic factors for pneumonia. Pneumonia occurred in 7.6% of patients in this set.
Initially, the differences in the clinical and demographic characteristics of the populations at the two hospitals were assessed using tests for equality of proportions: the Student t-test for comparing the means of normally distributed variables (as judged by the Shapiro-Wilk test) and the Mann-Whitney U test was used whenever the variables were not distributed normally.
Stepwise multiple logistic regression and CART analysis were used to identify the most important prognostic factors for pneumonia. In multiple logistic regression, a forward stepwise selection procedure used a p value of 0.2 or less for the association with pneumonia as the criterion for entering variables in the model. A backward stepwise elimination procedure was then performed, with a p value of 0.05 or less as the criterion for remaining in the model. Initially, all the variables were included in the CART analysis.
We placed restrictions on the size of the regression tree by requiring a minimum of five observations before the first split on a variable and a minimum of 10 observations before the final split. In general, CART analysis is used to create a large tree that has a minimum number of classification errors but that is well adjusted to the data. To be useful, the model must be downsized (“pruned”). We accomplished this objective by decreasing the number of nodes without a significant increase in deviance using a graph that shows the relation between deviance and the number of nodes on the tree. The best tree suggested by our analysis had 12 leaves. The probability of pneumonia onset was estimated by means of CART and LRM using a cut-off point that maximized both sensitivity and specificity without decreasing accuracy greatly. For both models, this value was 7%; that is, patients for whom the model estimated a probability of developing pneumonia of ≥0.07 were considered as having pneumonia.
Validation data
A validation set was obtained at a public hospital in Rio de Janeiro, Brazil, the Instituto Nacional de Cardiologia (INC), by enrolling 333 consecutive adult patients undergoing major cardiac surgery between October 2006 and May 2007. The research protocol was approved by the Ethics Committee (research number 0111/17.7.06). The data were collected prospectively.
Patient selection
The derivation and validation cohorts used the same criteria for inclusion, exclusion, and definition. All patients undergoing cardiac surgery (coronary artery bypass, valve replacement or repair, and correction of adult congenital cardiopathies) who survived for at least 48 h post-operatively were included.
Patients who underwent minor surgical procedures, such as pericardial drainage and biopsy, and those who had pneumonia as early as 15 days before surgery were excluded. Hospital charts were not available for 0.6% of the patients considered for study enrollment.
Diagnosis criteria and definition of prediction factors
Patients were defined as having post-operative pneumonia if they met the U.S. Centers for Disease Control and Prevention definition of nosocomial pneumonia [6], as assessed by a single infectious disease specialist (MS) who was blinded to the presence of the prediction factors for pneumonia. Microbiological confirmation of the diagnosis was not required.
Demographic variables included gender, age (years), and weight (kilograms). Diseases or conditions predisposing to pneumonia included chronic obstructive pulmonary disease (COPD), which was defined as a history of COPD, COPD diagnosed on the basis of findings of complementary tests, or the use of inhaled or oral steroids or bronchodilators; ventricular function, which was dichotomized as (1) normal or mildly abnormal or (2) moderately or severely impaired on the basis of echocardiography findings or observation during catheterization; and unstable angina, which was defined as the presence of progressive refractory ischemia that necessitated hospitalization in the ICU and intravenous medication for pain control. Cardiac surgery (surgical features) was classified as elective (the procedure could be delayed without increasing the risk of heart impairment), urgent (the procedure was required during hospitalization to minimize the chance of later clinical deterioration in the absence of an elective or emergency condition), or emergency (the procedure was required immediately because of ischemic dysfunction, defined as progressive ischemia or acute infarction in the 24 h preceding surgery, acute pulmonary edema necessitating intubation, or mechanical dysfunction, defined as shock with or without circulatory support). The surgery type was transformed into a dichotomous variable: Emergency vs. non-emergency.
Statistical analysis
Data were analyzed using two software packages for exploratory analysis: Stata (version 9.0 for Windows; Stata Corp., College Station, TX) and R (version 2.7.1; The R Foundation for Statistical Computing, Vienna, Austria). Model performance was assessed by adapting the R code originally created by Steyerberg [7].
Traditional statistical methods are cumbersome or may be of limited utility in addressing classification problems. Logistic regression is the method most commonly used in the analysis of medical data [8], but it does not deal well with predictor variable distribution, complex interactions, and patterns. Over the last few years, there has been increasing interest in the use of CART analysis, a tree-building technique that is unlike traditional data analysis methods. Because of this difference, CART has been accepted relatively slowly. Lewis [9] argued that CART is effective for creating clinical decision rules that perform as well as or better than rules developed using more traditional methods and that CART is able to uncover complex interactions between predictors that may be difficult or impossible to identify using traditional multivariate techniques. A CART analysis constructs a binary classification system based on the presence or absence of the outcome in question through successive partitions that divide the data into more homogeneous subgroups with each division or “node.” At each node, the algorithm selects the variable with the greatest capacity for discriminating between the two outcomes, in this case, the presence or absence of pneumonia. The regression tree has a hierarchical structure in which the first division corresponds to the variable with the greatest discriminatory power.
The performance measures were grouped into three categories (Table 1): Discrimination, calibration, and global measures. Discrimination refers to the ability to separate correctly classes with and without the outcome. Calibration represents how closely the predicted probabilities agree with the actual outcomes. Global measures include both discrimination and calibration.
Y=observed outcome; Ŷ=predicted outcome.
ROC=receiver-operator characteristic.
The Hosmer-Lemeshow test is performed by creating 10 groups containing the deciles of the fitted values. Observed and expected values are calculated [10]. The null hypothesis of the test specifies that the model is well adjusted. The results showed no rejection of the null hypothesis for the LRM (p=0.08) and rejection for the CART (p<0.01). The Goeman le Cessie test is based on the sum of the squared smoothed residuals and has an interpretation similar to that of the Hosmer-Lemeshow test. Because of technical limitations, the Goeman le Cessie test was performed only for LRM and did not reject the null hypothesis for it.
Results
The cohort characteristics are shown in Table 2. There were major differences in the fraction of emergency cardiac surgery cases in the derivation and the validation cohorts.
Table 3 describes the LRM, and Figure 1 describes the CART model. The LRM selected emergency surgery (odds ratio [OR]=5.28), chronic obstructive pulmonary disease (COPD)(OR=4.29), ventricular dysfunction (OR=2.68), and age (OR=1.04) as independent predictors of pneumonia. The CART model selected emergency surgery, age, unstable angina, body mass index (BMI), COPD, weight, and ventricular dysfunction as predictors. The CART model also selected low BMI, weight, and unstable angina as predictors, with 11 terminal nodes (“leaves”) and probabilities of pneumonia that ranged from 0–66%.
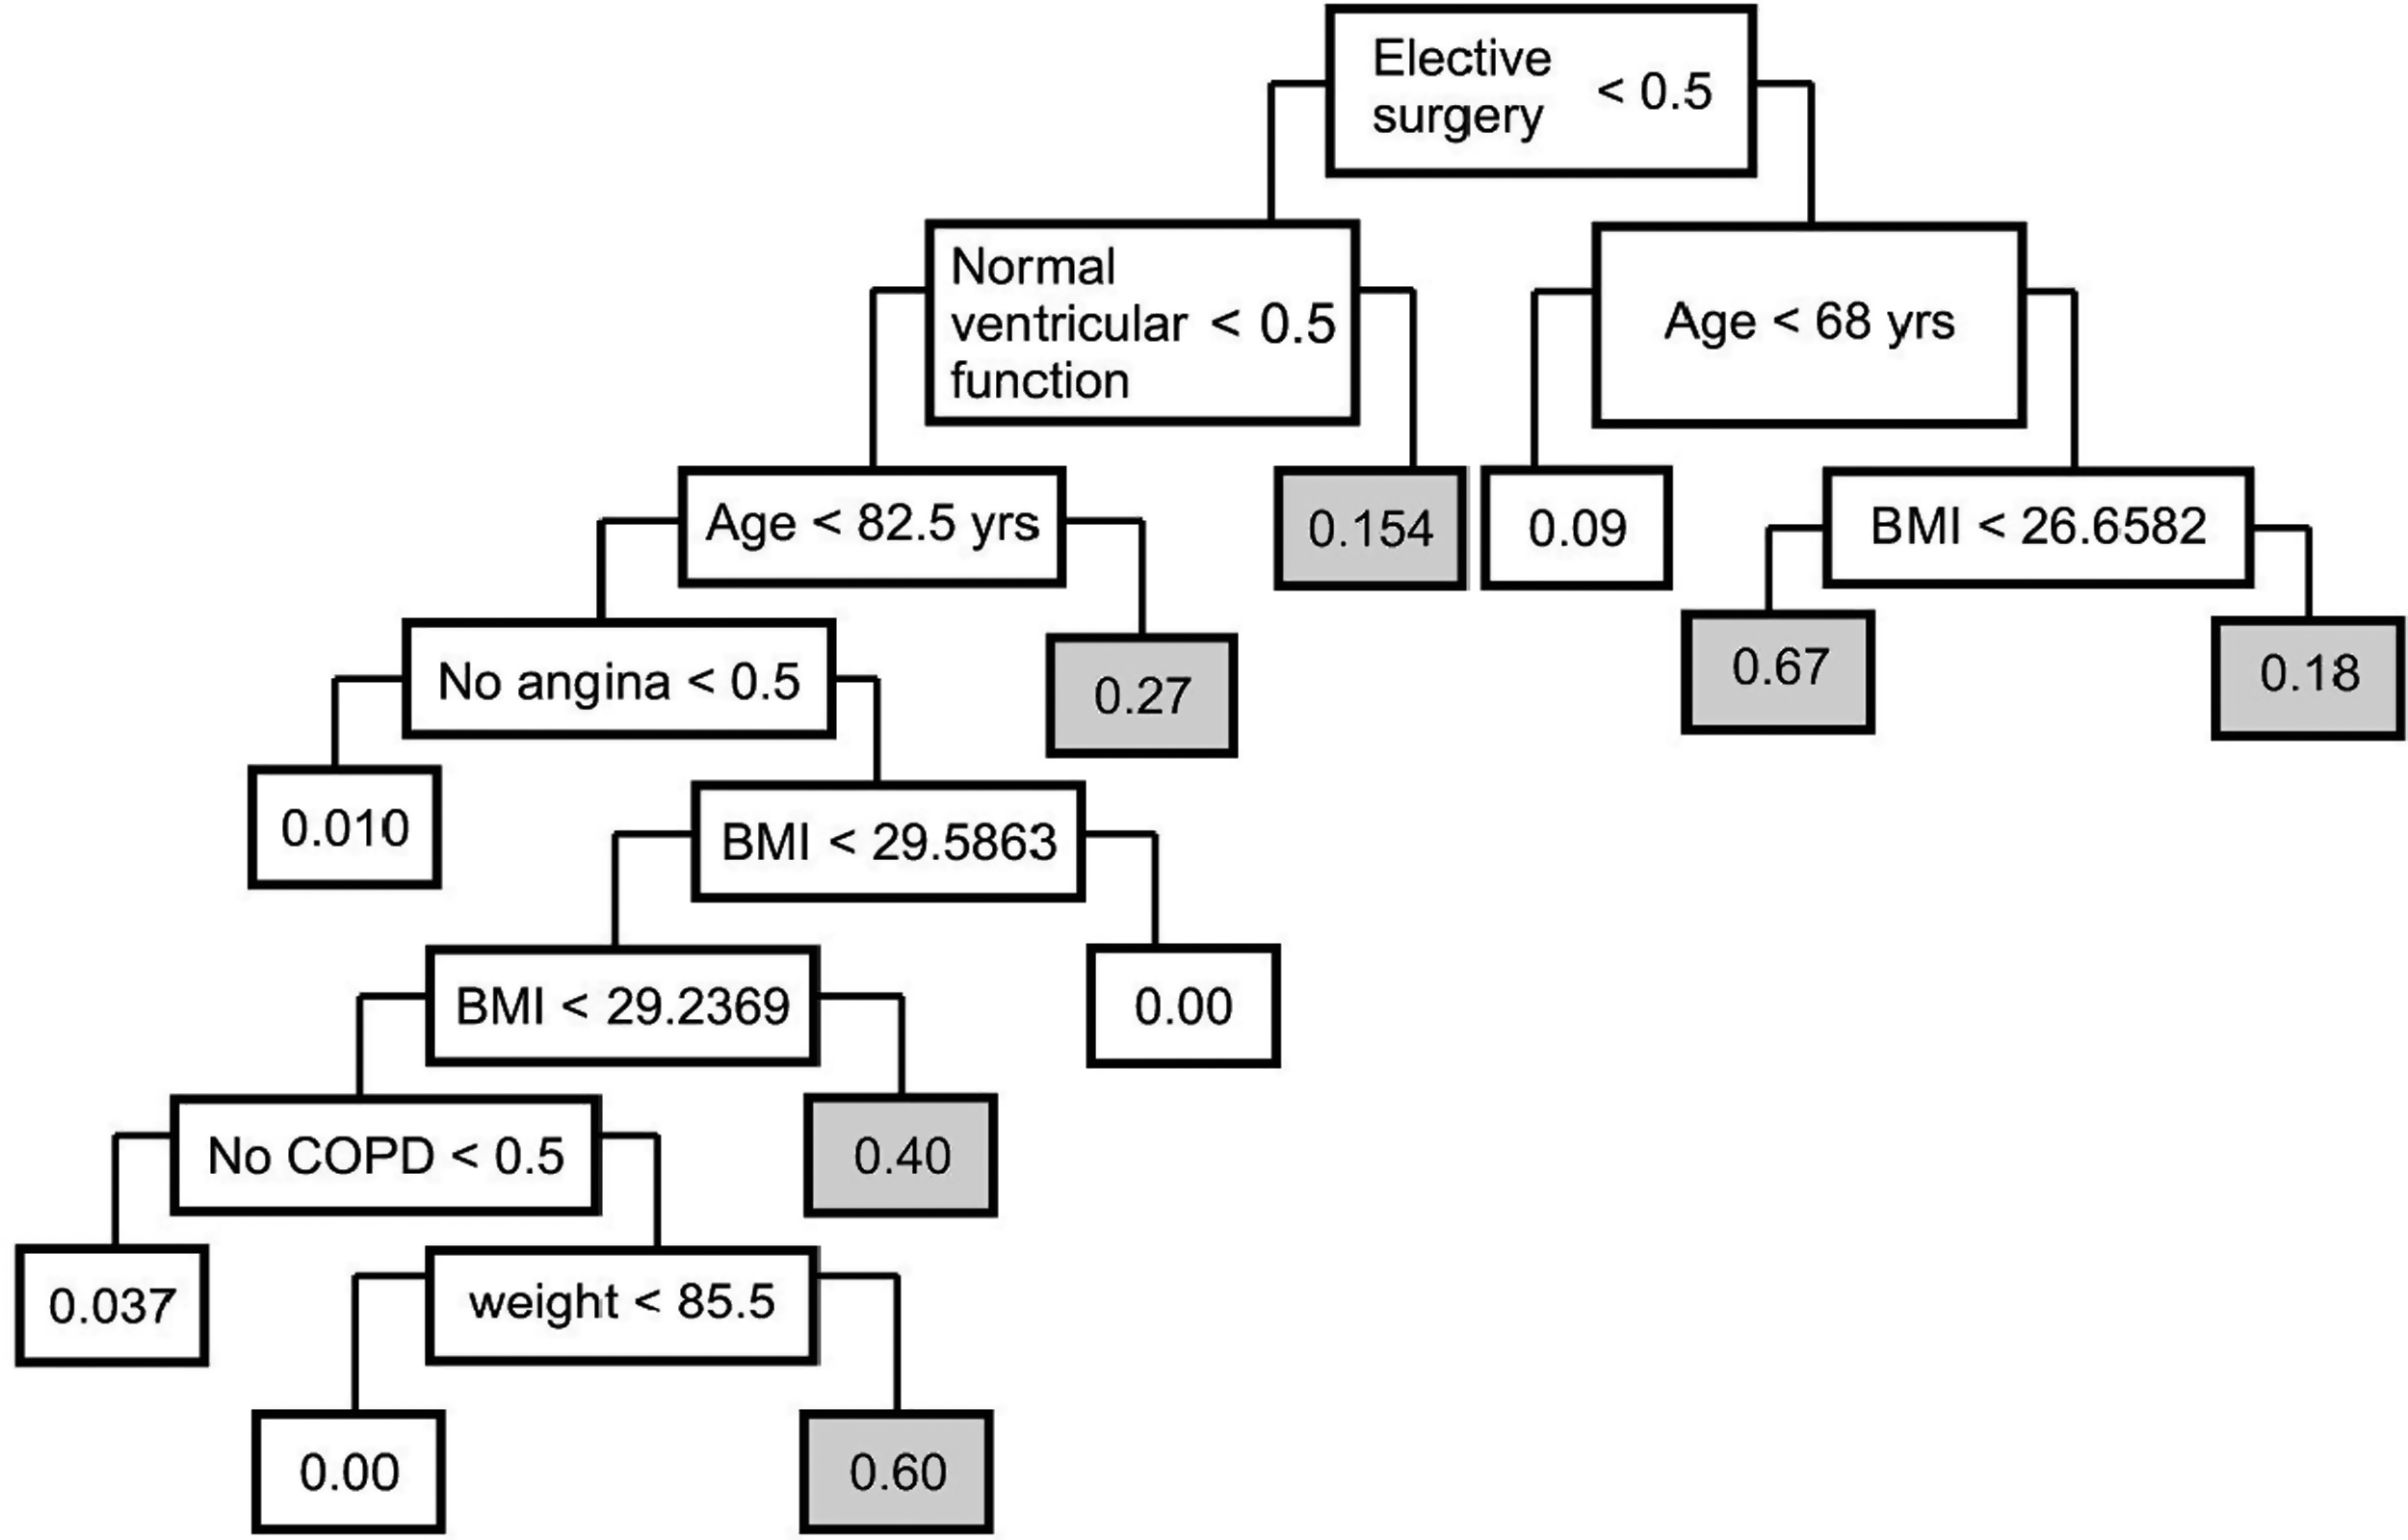
Classification and regression tree (CART) model with colored nodes for high-risk groups. BMI, body mass index; COPD, chronic obstructive pulmonary disease.
CI=confidence interval; COPD=chronic obstructive pulmonary disease.
Emergency surgery was the strongest predictor in both models, increasing the chance of pneumonia almost six-fold, a result that probably represented a proxy for disease severity and other surgical factors, such as the duration of surgery, lung trauma, and bleeding. In the literature, COPD and age usually are associated with pneumonia. Ventricular dysfunction and unstable angina are signs of severe cardiac disease. Low BMI and weight are associated with severe valvular disease.
The validation set cohort was comprised of middle-aged adults, mostly males. The cohort had a low percentage of emergency surgery, low-to-medium creatinine values, a high prevalence of moderate-to-severe ventricular dysfunction, and longer hospitalization before surgery than the derivation cohort (see Table 1). The incidence of pneumonia in the validation cohort was similar to that in the derivation cohort (7.6%). In 74% of cases, the diagnosis was based mainly on declining respiratory function. Such a decline occurred in only 8.3% of patients without pneumonia. Microbiological confirmation was available in 61% of the pneumonia cases. Enterobacteriaceae were the most prevalent microorganisms. Fever was present in 72% of the cases, cough in 38%, rales in 43%, leukocytosis in 87%, altered mental status in 32%, and change in sputum characteristics in 76%.
The LRM performed better than the CART model for the global, discrimination, and calibration measures. The global measure R2 showed that only a small fraction of the variation in the data is explained by these models, and the Brier scores were low and similar in the two models (Table 4).
CART=classification and regression tree; LRM=logistic regression model; CI=confidence interval.
The C index showed better discrimination for LRM than for CART, but the difference was not significant. Considering the discrimination slope, we found a low discriminative ability with little superiority to the CART model.
In terms of calibration, the major difference in model performance was that the calibration slope in the LRM was close to 1 and much higher than in the CART model (Fig. 2). The Hosmer-Lemeshow test indicated a clear advantage in calibrating the LRM, which was confirmed by good calibration for the LRM in the Goeman le Cessie test. The graphic aspects of the LRM line graph were closer to the ideal line (the predictions were more similar to the observed outcomes) than those of the CART, but it overestimated probabilities above 40% for pneumonia (Fig. 3). Graphical analysis showed LRM to predict lower values, especially after 20% of the observed probability.
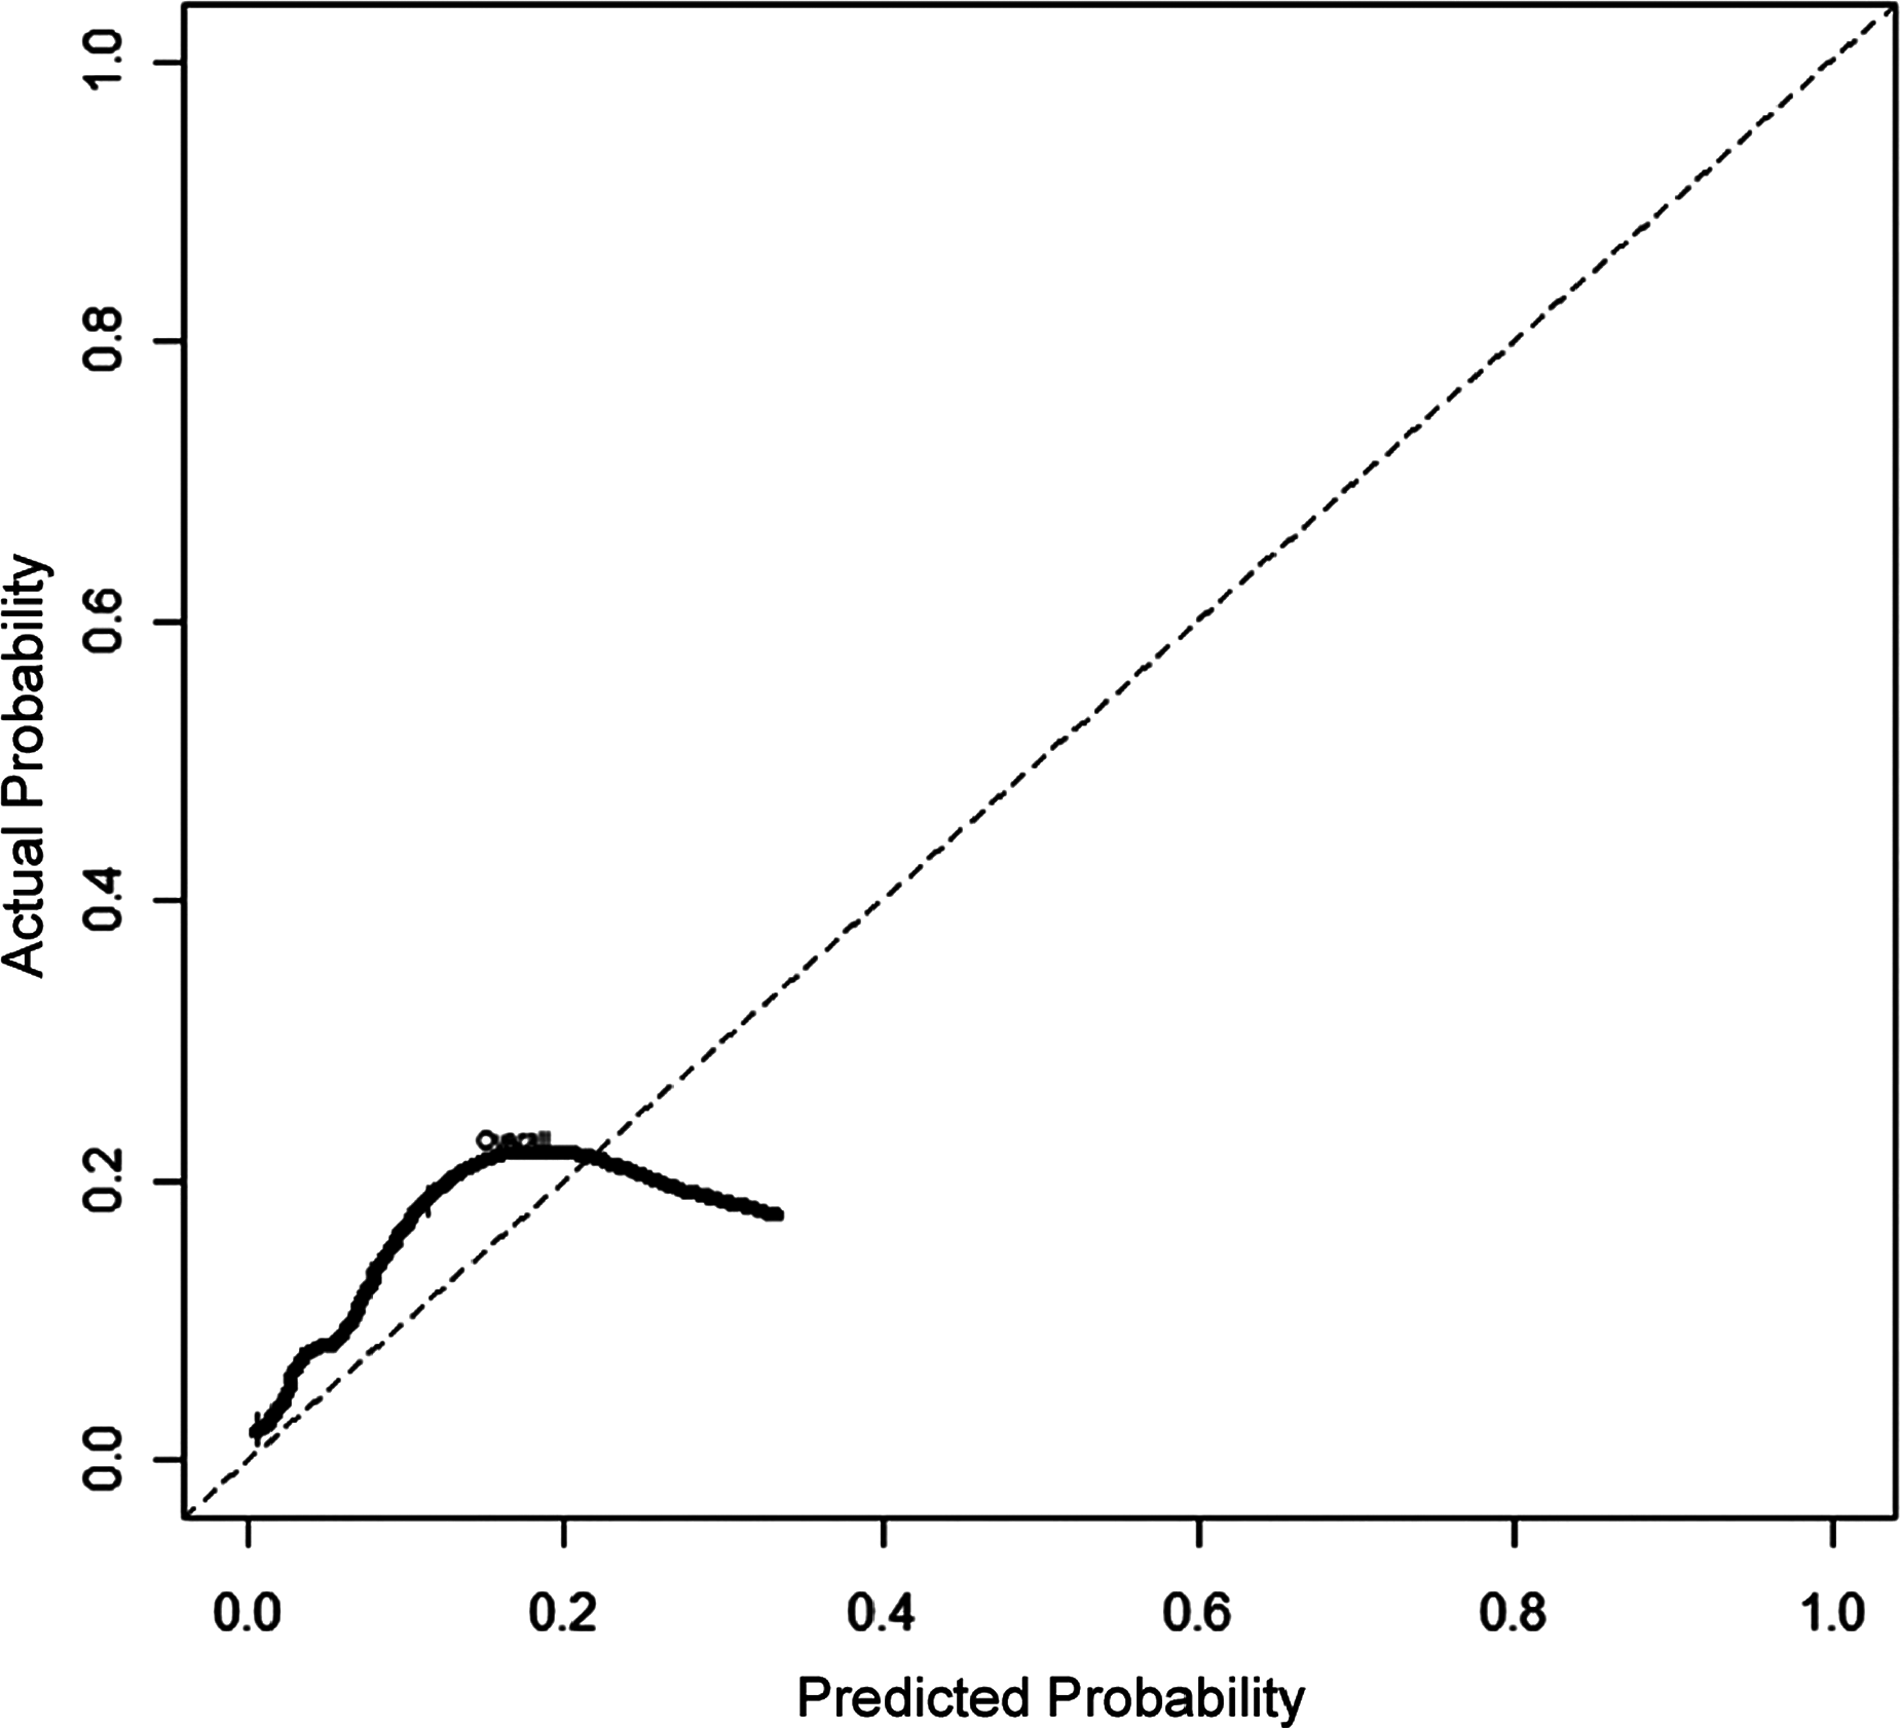
Calibration graph of logistic regression model (LRM).
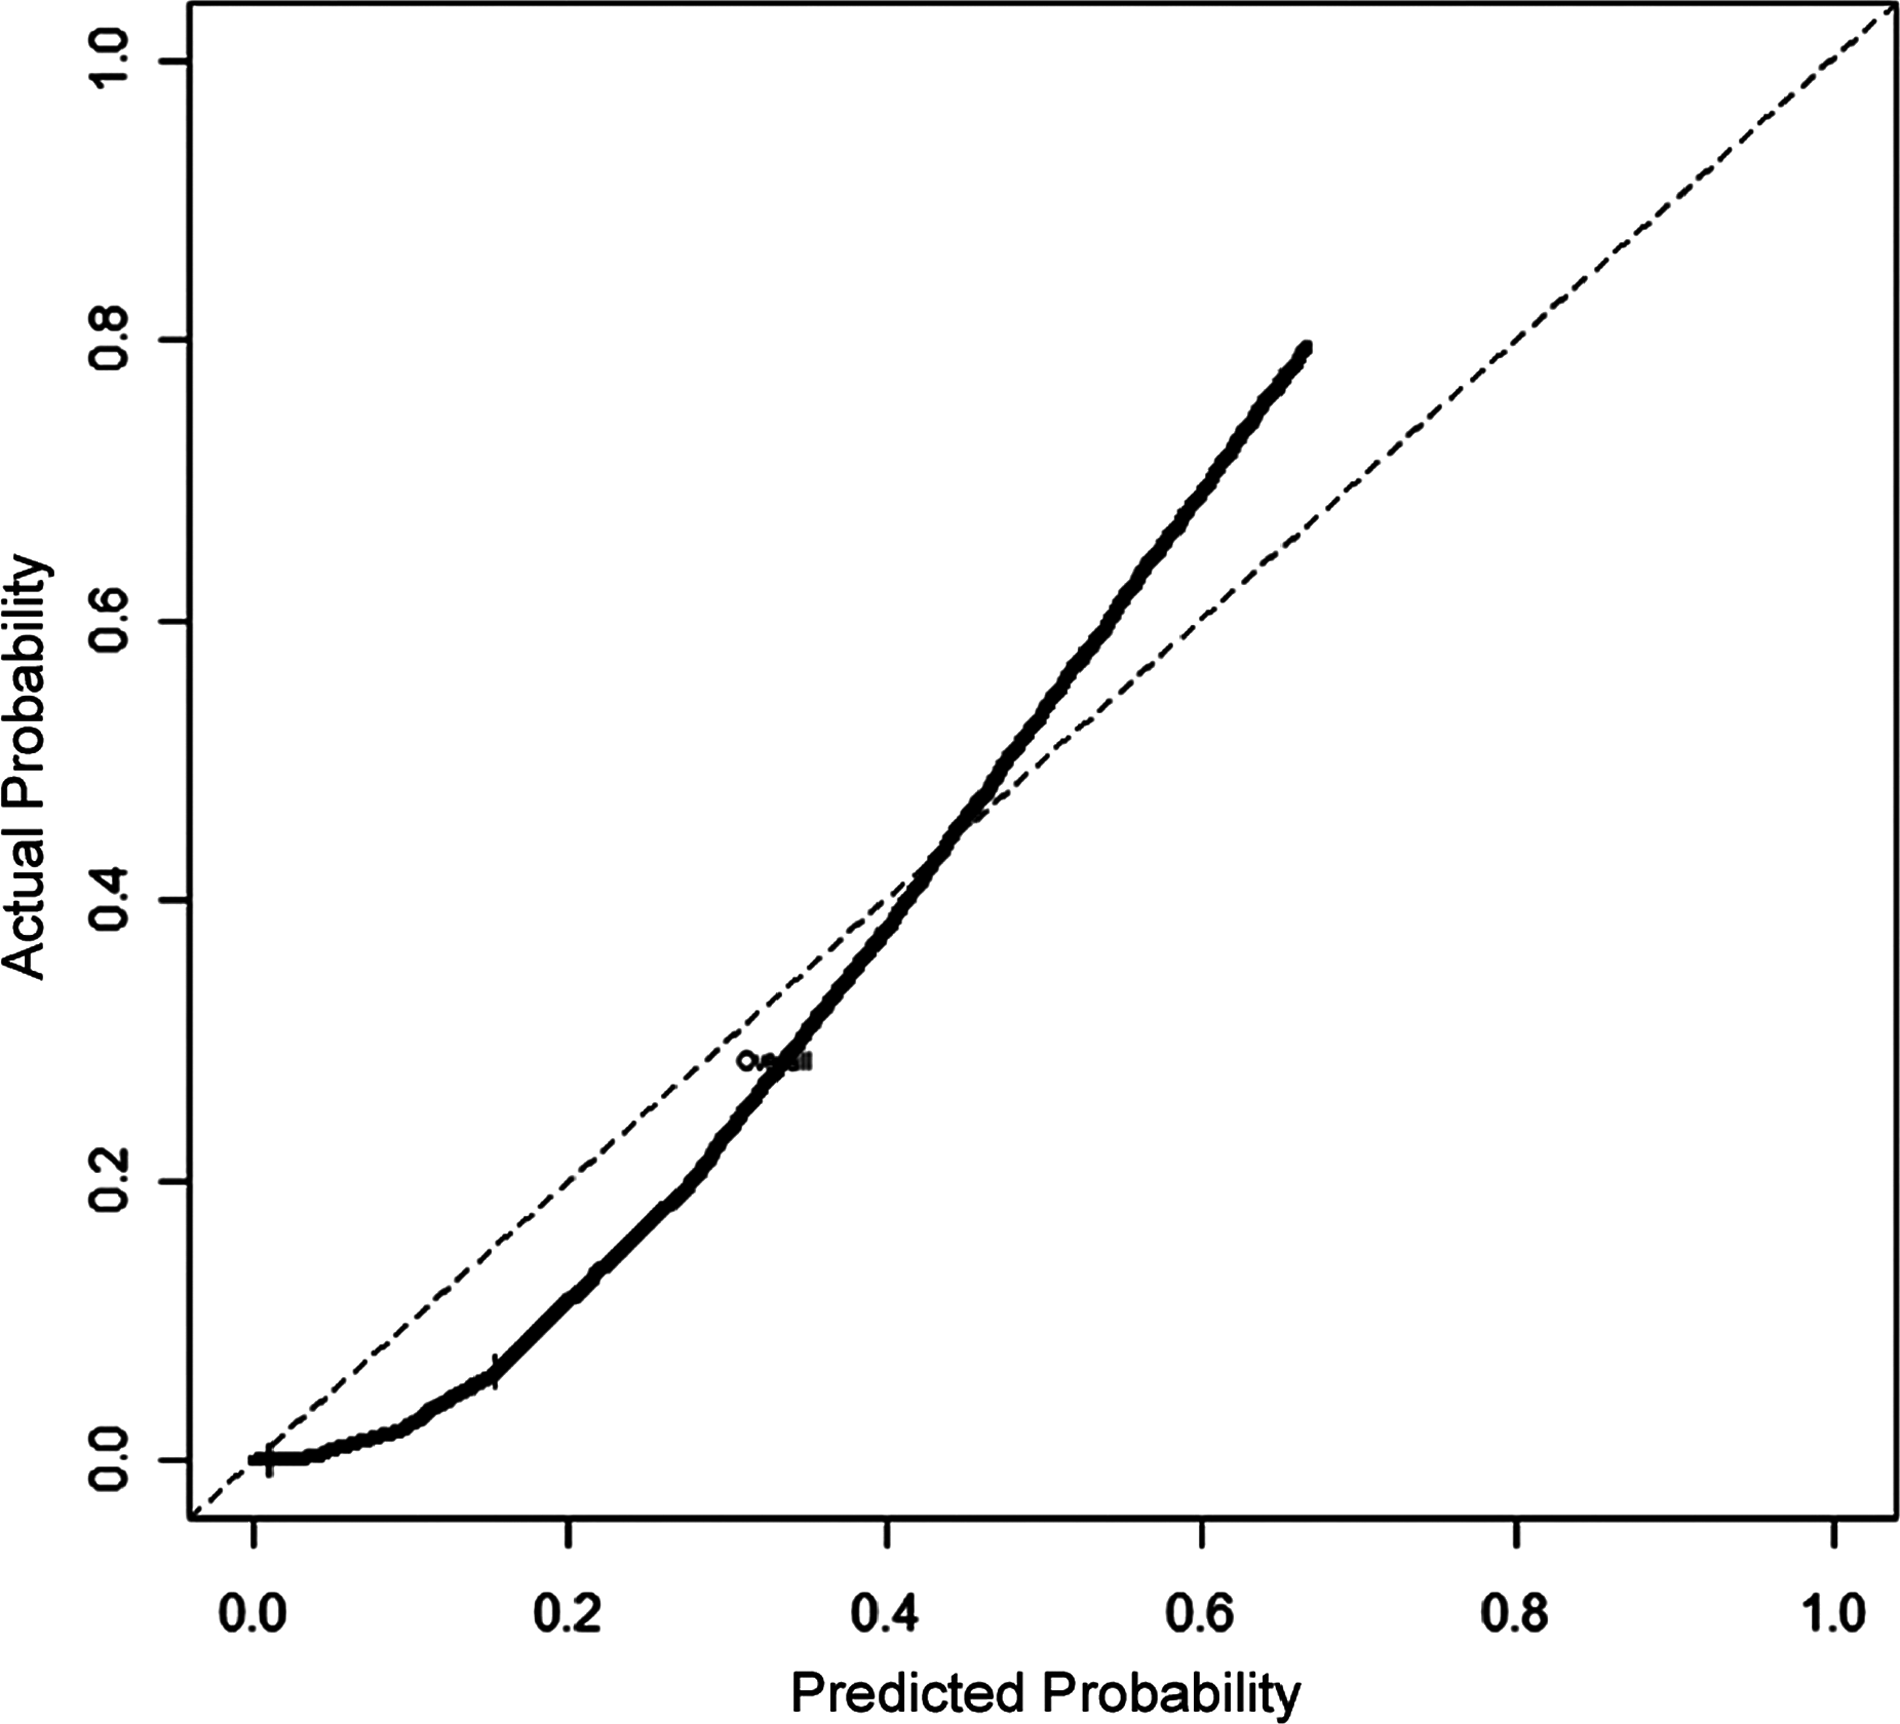
Calibration graph of classification and regression tree (CART).
Discussion
The ability to predict undesired outcomes of cardiac surgery, such as pneumonia, has been of particular interest to physicians and patients. Physicians need support for making decisions involving preventive strategies, such as special ventilation, subglottic aspiration tubes, silver-coated endotracheal tubes, different antibiotic prophylaxis strategies, or even medical management instead of a surgical approach [1].
The LRM model displayed superior performance in comparison with the CART approach
Being from a public tertiary hospital in Brazil, the population in the validation cohort had some distinctive characteristics. The low prevalence of emergency surgery may be explained by the absence of an open emergency department and the greater use of percutaneous coronary interventions for acute coronary syndrome. Other important characteristics were the length of the pre-operative stay, basically as a result of the low number of operations performed in relation to those needed and the delayed laboratory examinations in public hospitals (see Table 3). Poor access to tertiary referral centers is associated with a greater prevalence of clinical ventricular dysfunction. The low-to-medium values for serum creatinine concentration were attributable to organizational features of the health system that assigned patients with pre-operative chronic kidney disease to another hospital in the city. The incidence of pneumonia was similar to that in the derivation cohort (7.6%).
The comparative performance of the global measures showed low R2 values, probably reflecting the inherent limitations of modeling complex phenomena such as nosocomial pneumonia. The Brier scores for both models presented near-ideal values, considering that lower values are better and that 0.25 corresponds to a similarity identical to chance.
The discrimination measures showed results similar to those in the literature, in which C index values range from 0.52 to 0.72 and in which only one model for the prediction of pneumonia after non-cardiac surgery [11] has a value of 0.84. The interpretation of the C index depends on the clinical problem; for example, the diagnosis of bacterial meningitis can be established by a single test having a C index >0.80. To improve diagnostic testing, a model that combines several test outcomes should achieve a C index of at least 0.90. On the other hand, in scenarios for which accurate instruments for treatment are not yet available, such as the selection of couples for intrauterine fertilization, a prediction model with a C index of 0.65 may already be helpful [12].
The calibration measures (see Table 1) exhibited important differences, with the calibration slope of the LRM being closer to 1 (the ideal value). This measure reflects the calibration graph, a plot in which observed frequencies are plotted against predicted probabilities. Ideally, the plot shows a 45° line with a slope of 1. The intercept and slope of the calibration line can be estimated in an LRM by the linear predictor of log odds [12]. A slope <1 indicates that the predictions are extreme (either too low an estimate for low probabilities or too high an estimate for high probabilities). This type of miscalibration, with the slope close to 1 and a non-zero intercept, is a typical finding in external validation studies, as described by Steyerberg [7]. It indicates that certain patient characteristics, which were not included in the prediction model, were distributed differently in the validation sample than in the development sample. For example, the patients of the validation sample were recruited from a tertiary referral hospital, whereas the patients from the development sample were drawn mainly from secondary referral hospitals. One point of the performance results that deserves attention is differences in calibration that reflect a difference in outcome incidence between the derivation set and the validation set. These differences cannot be explained by different distributions of the predictor values. The calibration differences can be used to update the model, a technique known as “re-calibration” [13].
Several studies have shown that external validation of predictive models is necessary to verify their generalizability to new sites [14]. External validation is essential before implementing prediction models in clinical practice; prediction models that are not validated usually are not ready for clinical application. A model that has been submitted to an external validation procedure with good results is considered to be at level III in model development, a stage which is, ideally, followed by impact evaluation (level IV) [15].
Few models for predicting infection have been submitted to external validation. Models usually are submitted only to internal validation by the bootstrapping or slip methods. Results often are accepted without sufficient regard to the importance of external validation [4], limiting the generalizability of a prediction model to future settings. Most prediction models in infection control do not reach the level of external validation [16–23] and may lose accuracy during validation. A small number of studies have focused on the prediction of nosocomial pneumonia (only one of which [24] created a prediction rule specifically for pneumonia after cardiac surgery), and their predictive models have not been validated.
Diagnostic and prognostic, or predictive, models are created for different purposes. Diagnostic models are used for classifying individuals into their true disease status, whereas prognostic models have the more complex objective of estimating the risk itself and accurately classifying the risk strata [24]. Assessment based only on discrimination, using only the C index, cannot evaluate a model correctly. A calibration statistic assesses how the predicted values agree with the observed values in the validation data. A large set of performance measures that incorporates global, discrimination, and calibration aspects may help in comparing the clinical impact of two models on the risks of individuals and populations.
There are two possible major causes of loss of accuracy during external validation: A lower incidence of predictive core factors, such as emergency surgery, and sample size. Harrell et al. [25] maintained that there are no fixed criteria for calculating sample size based on prediction rules, but, in a practical sense, a minimum of 10 patients may be necessary for each predictive factor in the validation set. Morise et al. [26] highlighted the impact of changes in factor prevalence over the course of a model's performance. Vergouwe et al. [27] suggested that at least 100 events and 100 non-events are required in a sample for external validation. Peek et al. [13] proved that, in models for prediction of death, samples larger than 5,000 patients are needed to have the power to obtain 95% certainty for the area under the curve (AUC) and Brier score.
The literature points to the possibility of tree overfitting, mainly for two reasons [3]: The rule may have been developed inadequately, or there were major differences between the derivation and validation populations. Neither of these two reasons can be ruled out. Infection is a multivariable adverse event that is not understood fully. Decisions on variable choice can lead to mistakes. Also, cardiac surgery is changing continually, particularly since the development of percutaneous revascularization methods. The most important prediction variable in the derivation set (emergency surgery) was much less common in the validation dataset. As always, one of the great problems with model prediction is the time gap between derivation and validation and clinical use, which can lead to an obsolete model.
The present study has some limitations. One important one is not including peri-operative variables, such as the duration of surgery, days on mechanical ventilation, or number of re-operations. However, the primary objective of the study was to use a prediction model to plan prevention measures before surgery, which restrained the use of peri-operative data. In clinical practice, developing a model that is well calibrated across diverse settings with a limited number of predictors can be difficult, leaving some variation between patients unexplained [10].
The accurate diagnosis of ventilator-associated pneumonia is difficult because many complications of cardiac surgery and critical care, such as fluid overload, pulmonary embolism, pulmonary contusion, and atelectasis, can cause radiologic images and fever mimicking the clinical appearance of ventilator-associated pneumonia [28]. Microbiological data usually are impossible to collect without tracheal intubation, with its high risk of the additional sedation necessary for bronchoscopy. The use of U.S. Centers for Disease Control and Prevention (CDC) criteria and the limitation of the diagnosis to only one trained infectious disease physician was an attempt to homogenize diagnosis, which is difficult for inexperienced physicians.
The selected predictive variables agree somewhat with the prediction model presented by Hortal et al. [20], with both models including age and emergency surgery. One major advantage of this study was the use of simple data accessible to any investigator. The utilization of more advanced epidemiologic tools contributes to the development of more robust evidence in the infection control field.
Although practical implementation was not the objective of this paper, some points deserve attention. Reilly and Evans [29] listed the main barriers to the effective use of decision rules, in particular, a fear of diminished autonomy, conviction that clinical judgment is superior to decision rules, distrust of the accuracy of the rule's predictors or the translation of predictions into decisions, weak incentives for using a rule, concerns that important factors are not addressed by a decision rule (e.g., patient co-morbidity or resource availability), difficulty using a decision rule instrument, and the absence of supportive infrastructure (available during impact analysis). For most of the barriers, the solutions are studying the impact and use of software for calculating predictions for use at the point of care.
Footnotes
Acknowledgments
The authors acknowledge all of the Infection Control Team and the Postoperative Intensive Care Unit of the Instituto Nacional de Cardiologia.
Author Disclosure Statement
No competing financial interests exist.