
Abstract
Abstract
Purpose:
Changes in insulin resistance (IR) cause stress-induced hyperglycemia after trauma, but the numerous factors involved in IR have not been delineated clearly. We hypothesized that a statistical model could help determine the relative contribution of different clinical co-variates to IR in critically injured patients.
Patients and Methods:
We retrospectively studied 726 critically injured patients managed with a computer-assisted glycemic protocol at an academic level I trauma center (639 ventilated controls without pneumonia (VWP) and 87 patients with ventilator-associated pneumonia (VAP). Linear regression using age, gender, body mass index (BMI), diabetes mellitus, pneumonia, and glycemic provision was used to estimate M, a marker of IR that incorporates both the serum blood glucose concentration (BG) and insulin dose.
Results:
Increasing M (p < 0.001) was associated with age (1.62%; 95% confidence interval [CI] 1.27%–1.97% per decade), male gender (9.78%; 95% CI 8.28%–12.6%), BMI (4.32% [95% CI 4.02%–4.62%] per 5 points), diabetes mellitus (21.2%; 95% CI 19.2%–23.2%), pneumonia (10.9%; 95% CI 9.31%–12.6%), and glycemic provision (27.3% [95% CI 6.6%–28.1%] per 100 g of glucose). Total parenteral nutrition was associated with a decrease in M of 10.3%; 95% CI 8.52%–12.1%; p < 0.001.
Conclusions:
Clinical factors can be used to construct a model of IR. Prospective validation might enable early detection and treatment of infection or other conditions associated with increased IR.
T
Computer-assisted glycemic control protocols, used in our surgical and trauma critical care units, provide excellent glucose control with a low rate of hypoglycemia [1,3,5]. The effective glycemic control facilitated by these protocols may prevent infection-induced hyperglycemia; in fact, infected patients may have better glycemic control than their non-infected counterparts [7]. Thus, in the setting of tight glucose control, measures of insulin provision and resistance are better signals of infection than hyperglycemia [2–7,10,11,13,15,17].
As seen in Fig. 1, the insulin multiplier M is a surrogate marker of IR that incorporates the contribution of both serum blood glucose (BG) concentration and insulin infusion rate; as such, it reflects a patient's IR more accurately than does either the BG concentration or insulin infusion rate alone. The multiplier is electronically adjusted incrementally as the patient's IR changes. Insulin resistance, as measured by M or other means, is strongly correlated with infection and death in the setting of glycemic control [2,7–9,12,14,16,18,19].

Insulin drip rate is calculated using the formula (units/h) = (serum blood glucose−60 mg/dL) × multiplier M (units × dL/mg × h). Initially, M is set at 0.03 by the computer. After initiation of the drip, serum blood glucose is checked at least once every 2 h. If the follow-up blood glucose concentration is less than the lower end of the target range (in this case, 80 mg/dL), 50% glucose solution is administered using a formula based on the blood glucose value. For values <60 mg/dL, M is decreased by 0.02 (M cannot be less than zero). For values between 61–80 mg/dL, M is decreased by 0.01. If the blood glucose value is between 80–110 mg/dL, the insulin drip rate is adjusted according to the formula, but there is no change in M. If the blood glucose concentration is between 110–200 mg/dL, the insulin drip rate will be adjusted using the formula, but M will not be changed. For blood glucose values >200 mg/dL or multiple values >110 mg/dL, M is increased by 0.01. This process is diagrammed in the figure. If serum blood glucose values remain within the target range, the insulin drip rate also stays within a small range of values. If an event occurs that increases the patient's insulin resistance, such as a new infection, the patient's blood glucose concentration will increase despite the increasing insulin drip rate allowed by the formula (1). This results in an increase in M (2), which creates a new, greater range of insulin drip rates (3). With this increase in M, the blood glucose stabilizes (4). If it does not, the process is repeated. Reprinted from reference 7.
We have shown that M increases significantly as early as two d prior to the date that a patient satisfies the U.S. Centers for Disease Control and Prevention (CDC) criteria for ventilator-associated pneumonia (VAP) [7]. However, this previous work from our institution did not incorporate the effect of disease severity, diabetes mellitus, or nutritional provision in determining the likelihood of infection, nor did it provide a model to calculate the expected IR for a particular patient.
Unfortunately, methods to detect changes in IR rapidly in critically ill patients are lacking. The gold standard method is the euglycemic hyperinsulinemic clamp (EHC), with methodology established by DeFronzo et al. in 1979 [20]. However, use of the EHC is difficult and time-consuming and exposes patients to risks, including hypoglycemia, hyperkalemia, and loss of nutritional provision. Information provided through the use of our computer-assisted protocol may be adequate to create a surrogate, near real-time assessment of IR. If so, changes in IR may detect changes in a patient's clinical status and alert practitioners to the development of infectious or other complications. The first step toward creating such a model would be to determine the relative contributions of infection, diabetes mellitus, nutritional supplementation, and other baseline factors to IR.
Patients and Methods
Study design
We retrospectively studied 726 critically injured, mechanically ventilated patients managed with a computer-assisted glycemic protocol with intravenous insulin with glucose measurements and insulin adjustments made every 1–2 h. We included all patients admitted to the trauma intensive care unit (ICU) at an academic level I trauma center from January 1, 2008 to June 30, 2012. For patients with multiple ICU admissions, only data from the first visit were included.
Analysis of infection
We demonstrated previously that IR increases for as long as 2 d prior to the onset of VAP [7]. We sought to determine if this increase was in fact attributable to VAP. Therefore, 87 patients with VAP were compared with 639 patients ventilated without pneumonia (VWP). Patients with catheter-associated urinary tract infections or central line-associated blood stream infections satisfying the CDC criteria were excluded to avoid confounding the results. These CDC-monitored infections had the most reliable recording of dates to indicate the onset of infection, which was not possible with other sources such as intra-abdominal infection. Furthermore, intra-abdominal infections should have rapid source control to prevent early death from sepsis [21]. To obtain a more homogenous population not confounded by other complications, patients with VAP were included if their infection occurred between ventilator days 3 and 10; this group comprised >95% of our VAP patients and had the most reliable glycemic data. To identify a matching population, VWP patients were included if they were exposed to mechanical ventilation for 3–10 d, so that they would have ventilator exposure similar to that in the VAP group prior to the development of pneumonia and would have sufficient ventilator exposure to have the opportunity to develop a pneumonia satisfying the CDC criteria [22].
Of note, the classification of VAP recently was altered by the CDC because of uncertainties regarding definitions and the necessity of findings on chest radiography that sometimes are absent. The current classification incorporates possible VAP as a subset of ventilator-associated events (VAE) [23]. We attempted to compensate for the diagnostic uncertainty inherent in the CDC criteria through the use of bronchoscopic bronchoalveolar lavage with quantitative culture to establish or eliminate the diagnosis of VAP. Clinical suspicion is determined by standard criteria within the diagnosis of pneumonia; however, a declining P
Glycemic control protocol
At the time of this study, all critically ill, mechanically ventilated trauma patients with a serum BG value >110 mg/dL are placed on a published and validated computer-assisted glycemic control protocol with a target serum BG concentration of 100–130 mg/dL [24–27]. The protocol has since been adjusted to target a BG concentration of <130 mg/dL, reflecting a reduced emphasis on tight glycemic control according to the recommendations from Jacobi et al [28]. The insulin dose is adjusted at every one to two h using a linear equation, and its computer-assisted regulation is more effective than the previous nurse-driven protocol [25].
The insulin drip rate is calculated using Equation 1:
The M value is set initially at 0.03 by the computer. After initiation of the insulin infusion, serum BG is checked at least once every two h. If the follow-up BG concentration is less than the lower end of the target range (in this case, 80 mg/dL), a dose of 50% glucose solution is administered using a formula based on the BG value. For values <60 mg/dL, M is decreased by 0.02, although the minimum value of M is zero. For values between 61–80 mg/dL, M is decreased by 0.01. If the BG concentration is 80–110 mg/dL, the insulin drip rate is adjusted based on the formula above, but there is no change in M. If the blood glucose is 110–200 mg/dL, the insulin drip rate is adjusted using the formula above, but M will not be changed. For BG values >200 mg/dL or multiple values >110 mg/dL, M is increased by 0.01.
If serum BG concentrations remain within the target range, the insulin drip rate also stays within a small range of values. If a process occurs that increases the patient's IR, such as a new infection, the patient's BG concentration will increase despite the faster insulin drip rate allowed by the formula, resulting in an increase in M, creating a new, greater range of insulin drip rates and stabilizing the serum BG concentration. The process is repeated with each additional BG measurement at two-h intervals (or one h after a serum BG value <80 mg/dL). Typically, at least five consecutive glycemic measurements over the first 4–8 h of admission are necessary to achieve a euglycemic steady state, as demonstrated by earlier studies from our institution [1,4,25].
As we have indicated, M is a superior indicator of IR than is the insulin dose, as it is related mathematically to both the serum BG concentration and the insulin drip rate [7]. As a result, M reflects IR in both hyperglycemic patients and euglycemic patients requiring insulin to maintain euglycemia.
Analysis of BG concentration
Glucose data were obtained during the period of mechanical ventilation, while the patients were on our glycemic control protocol. Point-of-care serum BG measurements are obtained by the nursing staff using the SureStep® Pro (One-Touch®) Professional Blood Glucose Monitoring System; www.lifescan.com/professionals/products/sspro/), and relevant data were entered in the bedside computer, allowing necessary adjustments by the computer-assisted glycemic control protocol. The system is designed to accept inputs from arterial, venous, or capillary (fingerstick) sources and to compensate appropriately. Measurements are obtained every two h except after hypoglycemic events (serum glucose concentration <60 mg/dL), which mandate a serum BG measurement after 60 min to ensure that hypoglycemia has been addressed adequately. Values were not filtered, as there is no way to determine retrospectively if a given value is erroneous.
Past studies of our protocol have shown that at most 6% of BG measurements are obtained less frequently than two h apart while the patient is on the glycemic control protocol. Although the incidence of severe hypoglycemia (glucose <60 mg/dL) in the trauma ICU has not been studied, the corresponding incidence in post-surgical patients on an identical glycemic protocol is less than 0.5% [1,29]. As a result, hypoglycemic events were not included in our model.
Nutritional provision
By protocol, after initial resuscitation, patients are started on a glucose-containing maintenance fluid until enteral nutrition can be initiated within 48 h of admission (unless specifically contraindicated). Patients on the computer-assisted glycemic control protocol who have one or more glucose values <70 mg/dL receive 10% glucose solution at 30 mL/h until the commencement of enteral or parenteral nutrition. Registered dieticians evaluate each patient and establish a daily nutritional goal with 20 to 24 nonprotein kcal/kg of body weight [30]. Enteral nutrition is initiated within 48 h of admission unless a specific contraindication exists. If 70% of estimated nutritional need cannot be provided enterally by day 7 of hospitalization, total parenteral nutrition (TPN) is initiated. Dietary specialists and pharmacists, responsible for enteral and parenteral nutrition, respectively, carry out rounds daily as part of a multi-disciplinary patient care team.
Calculation of administered carbohydrate
The glucose content and volume of TPN administered for each patient is captured electronically and integrated into the dataset. For enteral formulations, the volume delivered via the nutritional pump is captured electronically. Patients are assumed to receive 1.5 cal/mL with 20.33 g of carbohydrate/100 mL according to our standard formulary tube feeding (Osmolite 1.5; Abbott Nutrition, Columbus, OH). Because of database limitations, we were not able to capture insulin included directly in the TPN formulation, but this amount typically is low (10 units or less per day) to avoid increasing the risk of hypoglycemia.
Statistical analysis
We created a linear regression model to predict the multiplier M, including covariants we hypothesized would be associated with changes in IR [7]. We included the presence of pneumonia as a binary variable; the presence of diabetes mellitus as determined by direct examination of the medical record; the total grams of carbohydrate administered per day; the patient's age, gender, and body mass index (BMI); and whether they were given parenteral nutrition.
Pearson's χ2 test was used for categorical variables. Nonparametric tests were used elsewhere to eliminate the effects of skewed variable distributions. The Mann-Whitney U test was used to compare medians between experimental groups, and the Spearman's ρ was calculated for bivariant correlation tests. The SPSS version 20 for Mac OS X (IBM Inc., Armonk NY) was used for all analyses.
Study setting, conflict of interest disclosure, and regulatory approval
Vanderbilt University Medical Center is an academic level I trauma center with approximately 3,800 trauma-related admissions per year, including approximately 800 patients admitted to the trauma ICU. Approximately 15% of our admissions result from penetrating trauma, and approximately 18% of our admissions are of patients above the age of 65 years. Our catchment area includes urban, suburban, and rural areas and covers approximately 64,000 square miles.
Our study was approved by the Vanderbilt University Medical Center Institutional Review Board (IRB #121002; approved July 3, 2012). Authors KM and KJS are recipients of the Surgical Infection Society Resident Research Fellowship; the other authors have no disclosures.
Results
Demographics
Patients with VAP had a male predominance and were younger than patients without VAP. The VAP patients had a greater median Injury Severity Score than VWP patients. There was no difference in the proportion of diabetic patients in the two groups. Patients with VAP had longer durations of mechanical ventilation, inotropic support, ICU stay, and hospital length of stay. The mortality rate was not significantly different in the two groups (Table 1). As patients with VAP had longer durations of mechanical ventilation, they had correspondingly longer periods on the glycemic protocol and a greater number of BG measurements. The VAP patients also were more likely to be on TPN during their hospitalization. Although the hospital expected length of stay was longer in the VAP patients, their expected mortality rate was not greater. The expected mortality rate has been shown to be more accurate than other mortality prediction scoring systems, including the Trauma and Injury Severity Score (TRISS), in trauma patients [31]. These parameters are obtained or calculated post hoc at the time of hospital discharge or death and therefore are not baseline differences in the patient populations.
Mann-Whitney U test for continuous variables and Pearson's χ2 for categorical variables.
Abbreviations: BG = blood glucose; BMI = body mass index; ICU = intensive care unit; IQR = interquartile range; LOS = length of stay; TPN = total parenteral nutrition; UHC = University HealthSystem Consortium.
Linear regression modeling
We performed a linear regression analysis to determine which factors are associated with increased IR, as measured by M, in critically injured patients. The results are shown in Table 2. Each 10-y increase in age was associated with a 1.62% (95% confidence interval [CI] 1.27%, 1.97%) increase in M (p < 0.001). Male gender was associated with a 9.78% (95% CI 8.28%, 12.6%) increase in M (p < 0.001). A 5-point increase in BMI was associated with a 4.32% (95% CI 4.02%, 4.62%) increase in M (p < 0.001). Diabetes mellitus was associated with a 21.2% (95% CI 19.2%, 23.2%) increase in M (p < 0.001). The presence of pneumonia increased multiplier M by 10.9% (95% CI 9.31%, 12.6%; p < 0.001). Each additional 100 g of glycemic provision per day increased M by 27.3% (95% CI 6.6%, 28.1%; p < 0.001). Being on TPN was associated with a decrease in M of 10.3% (95% CI 12.1%, 8.52%; p < 0.001).
Age, gender, body mass index (BMI), UHC-EM, ventilator-associated pneumonia (VAP) (yes/no), diabetic status, total parenteral nutrition (TPN), and total daily glucose intake from enteral and parenteral nutrition in grams were used as factors in a linear regression model with a natural log transformation to predict change in M. Results are presented as a percentage increase in M that could be attributed to each factor.
p < 0.001 for all.
Correlation between predicted and observed natural logarithm of multiplier M
We studied the output of our model designed to calculate M to determine if there was differing accuracy in various patient subsets. Fig. 2 contains these data in two graphs. In Fig. 2A, the predicted natural logarithm of M is graphed as a scatterplot against the observed values. The correlation coefficient is 0.524 by Spearman's ρ. In Fig. 2B, the mean predicted value of the natural logarithm of M is diagrammed on the left axis. The mean observed value is diagrammed on the right axis. The time on the insulin protocol in days comprises the X axis. In most cases, the predicted value is significantly lower than the observed value, but the overall patterns in the observed and predicted values are qualitatively similar.

Predicted and observed values of the natural logarithm of multiplier M. (
Subset analyses
As our model could not be calibrated prospectively, we performed four subset analyses to determine if particular factors (gender, VAP, diabetes mellitus, and TPN) affected the predictive ability of the model (Fig. 3). The difference between predicted and observed values of the natural logarithm of M for each subset is graphed on the Y axis against time on the insulin protocol on the X axis. Gender did not affect the predictive ability of the model (Fig. 3A). The model appeared more accurate for patients with VAP (Fig. 3B), and this difference was significant for days 0, 1, and 3–5 (p < 0.05). Although the model appeared more accurate in diabetic patients (Fig. 3C), this difference was significant only on days 6, 8, and 9. Patients on TPN likewise appeared to have more accurate model data (Fig. 3D), but this difference was significant only on days 5, 8, and 10.
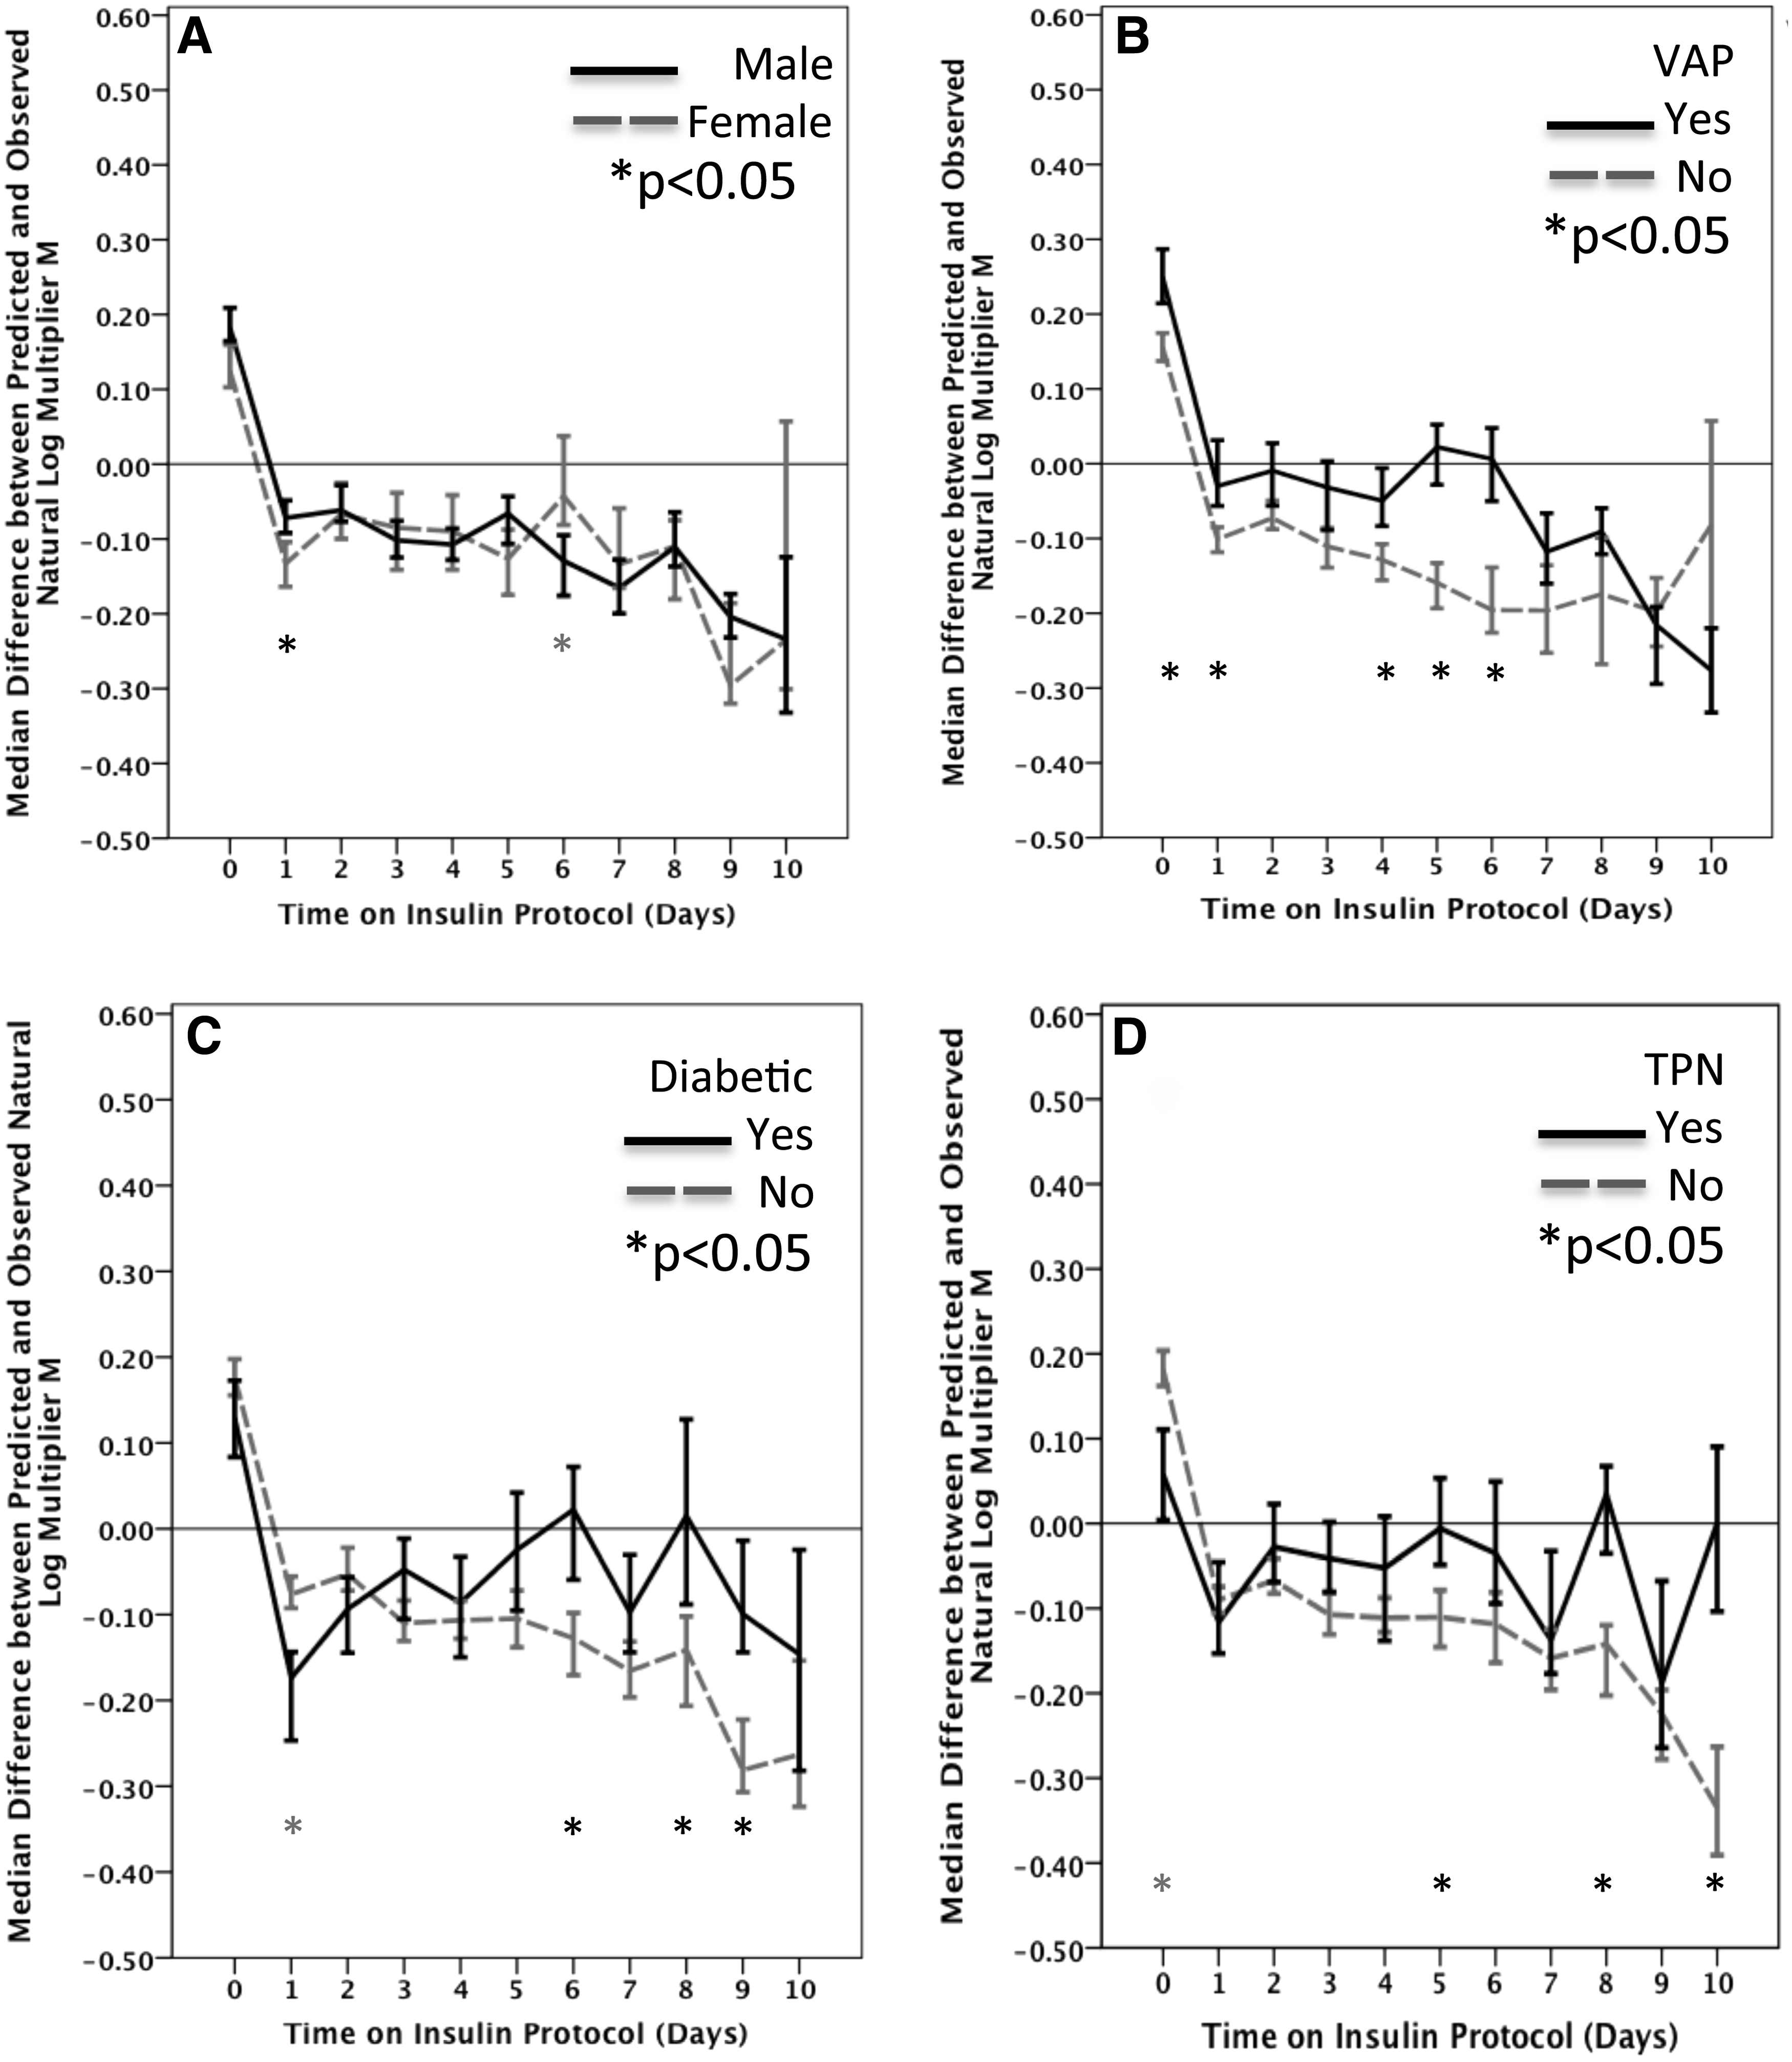
Difference between observed and predicted natural log multiplier M for patient subsets. Difference is graphed on the Y axis against time on the insulin protocol on the X axis. Areas where 95% confidence intervals overlap are not statistically significant. (
Discussion
The work presented here is the first application of a computer-assisted glycemic control protocol and clinical data to calculate an expected estimate of IR for a given patient. Furthermore, this is the first such model to incorporate nutritional data in each 24-h interval, diabetic status, presence of infection, as well as BG and M obtained every one to two h. By calculating the expected IR for critically injured patients, we have established a benchmark for determining when a patient's IR is exceeding expected parameters. Higher than expected IR could be indicative of occult diabetes mellitus, an impending infection, or other factors.
The available reliability data indicate that our model is accurate. This is reflected visually in Fig. 2. The data in this figure support at least two significant observations. First, as we demonstrated previously [7], the observed IR, as estimated by M, increases in a sigmoid fashion with the amount of time in the hospital. Our previous work was not able to identify etiologic factors for this change; we now posit that increasing glycemic provision and infection play significant roles. Other factors may be involved as well, including chronic stress attributable to oxidative injury [5].
Subset analyses indicate that our model does not differ significantly in accuracy by gender. The model is more accurate in patients with VAP, diabetic patients, and patients on TPN at selected time points; overall, the model appears slightly more accurate in patients and subsets of patients likely to demonstrate high IR.
Our model does have limitations. Our dataset did not contain enough patients to utilize a portion of the data for internal validation. We currently are conducting a double-blinded randomized trial of intravenous glutamine administration in critically injured patients; as part of this study, we are conducting EHC experiments that can be used to determine a gold standard value for IR to validate the data in this study. Validation of our work can contribute to better understanding of the effects of stress hyperglycemia, known diabetes mellitus, and occult diabetes mellitus on the critically injured population [32].
Our model is not able to account for subtle differences in the nutritional content of enteral feedings, nor is it possible to account for nutritional provision with the same granularity with which we can obtain glycemic data. Variances in accuracy between different subgroups of patients also may limit the broader applicability of the model. Patients in the VAP group were more likely to be on TPN and had more BG measurements, both of which could be confounding factors. Insulin contained in TPN, the amount of which is variable and determined by a second clinical team, was factored into our calculations, but as a binary variable; thus, patients with TPN have a negative contribution to their predicted M value from the insulin in their TPN. The glycemic impact of the TPN already is accounted for as part of total glycemic provision. We did not perform a subset analysis excluding patients on TPN because this would disproportionately affect the VAP group and reduce statistical power; we elected instead to adjust for TPN as a binary variable. Finally, documentation of surgical site infections frequently was lacking; thus, some of our patients could have had infections that could have affected their IR.
These findings agree with our previous work showing that the absolute difference in median values of the M multiplier between VAP and VWP patients is between 0.01 and 0.02 in the 48 h preceding satisfaction of the CDC criteria for ventilator-associated pneumonia [7]. In addition, this study provides a basis for linking a patient's outpatient diabetes mellitus status to their IR after acute trauma. Our future experiments are designed to provide prospective model validation as well as to integrate the possible effects of known and occult diabetes mellitus with concurrent measurement of glycosylated hemoglobin on IR in critically injured adults.
Although this model does have some deficiencies, it is the first to be published that is able to determine an expected value of IR for a critically injured patient without the benefit of a euglycemic hyperinsulinemic clamp experiment. As such, further research in this area could be crucial to enabling earlier treatment of infection, thus improving outcomes.
Conclusion
This work consists of a novel linear regression model designed to determine the contribution of various clinical factors, including age, gender, BMI, diabetes mellitus, nutritional provision, and infection to IR as measured by the multiplier M. Using this model, it may be possible to predict the expected value of IR for a given patient and therefore to determine when actual IR differs from the predicted value. Such variation could have multiple benefits, including detection of infection or occult diabetes mellitus. Future prospective validation of this model has significant potential to yield a tool that would allow real-time screening for infection and other abnormalities based on changes in IR.
Footnotes
Author Disclosure Statement
No competing financial interests exist.