
Abstract
Objective:
Our aim was to describe our antimicrobial stewardship program and the methodology based on the results in a surgical department.
Methods:
Our study was a quasi-experimental study conducted from January 1, 2009, through September 30, 2017. The site was the General and Digestive Surgery Department in a public primary referral center, the University Hospital of Getafe (Madrid, Spain). We implemented the antimicrobial stewardship program following a prospective audit and feedback model, with a surgeon incorporated into the manaagement group. We studied the deaths and 30-day re-admission rates, length of stay, prevalence of gram-negative bacilli, meropenem resistance, and days of treatment with meropenem.
Results:
After three years of the program, we recorded a significant decrease in Pseudomonas aeruginosa prevalence, a significant increase in Klebsiella pneumoniae prevalence, a decrease in meropenem resistance, and a reduction in meropenem days of treatment.
Conclusions:
Antimicrobial stewardship programs have a desirable effect on patients. In our experience, the program team should be led by a staff from the particular department. When human resources are limited, the sustainability, efficiency, and effectiveness of interventions are feasible only with adequate computer support. Finally, but no less important, the necessary feedback between the prescribers and the team must be based on an ad hoc method such as that provided by statistical control charts, a median chart in our study.
The U.S. Centers for Disease Control and Prevention (CDC) estimates of morbidity and death attributable to drug resistance are more than two million infections and 23,000 deaths each year in the United States [1]. Antimicrobial resistance is a natural process, but the misuse and overuse of antibiotics have accelerated its course [2]. The main problem is that infectious diseases caused by resistant micro-organisms are associated with higher morbidity and mortality rates and treatment costs than those caused by susceptible strains of the same species [3–6]. Also, the presence of resistant bacteria and the misuse of antibiotics are considered independent risk factors for a poor prognosis in severe infections [7].
If we focus on surgical infection, the increase in antimicrobial use is particularly significant for the carbapenems and gram-negative bacilli (GNB) resistant to carbapenems, which represent the main cause for concern [8]. The alarm is particularly great for Pseudomonas aeruginosa, whose resistance is greater than 20% in the U.S. and Spain, and on Klebsiella pneumoniae resistant to meropenem, with an increase in recent years that reached 4% in Spain, 8% in the U.S., and 36% in Italy in 2015 [1,9].
The institutional response pays particular attention to the development of antibiotics, the prevention/control of infection, and the optimization of antimicrobial drugs [10]. One of the proposed measures is antimicrobial stewardship programs (ASP), which decrease and improve antimicrobial use and reduce resistance, length of stay (LOS), adverse effects, and costs [11,12]. Knowing the current antibiotic prescription and resistance and detecting areas for improvement are the starting points of ASPs. In surgery, ASPs have focused on antibiotic prophylaxis and empiric guidelines. The ASPs should be part of a surgeon's practice, and his or her active involvement is crucial for its success, as it raises awareness of resistance and encourages the rational use of antibiotics [13–16]. Our aim was to describe our ASP model in a surgical department and to share the relevant aspects of the method for making the achievement of ASP objectives sustainable, effective, and efficient in the context of limited resources.
Patients and Methods
Study design and setting
We conducted a quasi-experimental study of the implementation of an ASP in the GDS Department of University Hospital of Getafe (Madrid, Spain), a 450-bed hospital in the public healthcare network, serving an approximate population of 200,000 patients. The ASP strategy was created in July 2013 following a prospective audit and feedback (PAF) model, with a surgeon as part of the group. The other members of the ASP team were a clinical pharmacist, three clinical microbiologists, three physicians with an interest in infectious diseases, and three critical care specialists. There was no antibiotic restriction for prescribers, and surgeons maintained their autonomy without computerized algorithms. In September 2014, the hospital databases of Admission, Clinical Analysis, Pharmacy, and Microbiology were integrated prospectively through a software program called Wise Antimicrobial Stewardship Program Support System (WASPSS) [17], developed by our center jointly with the University of Murcia (Murcia, Spain).
The ASP implementation was ended after developing a description of the antimicrobial resistance and prescription by departments. This analysis was done through WASPSS with data analyzed retrospectively. According to the data in the GDS Department, we identified an increase in meropenem prescription and resistance. Thus, the ASP team focused on the optimization of meropenem as a priority objective, and the program was implemented on October 1, 2014, in our surgical department.
There were no local antibiotic protocols available to prescribers. The antibiotic treatment was chosen by the prescribing physician according to individual criteria.
Patients
We included all consecutive in-patients admitted to the GDS Department from January 1, 2009, to September 30, 2017. A patient is considered admitted if she or he was assigned by Admission to this hospital department and managed according to the criteria of the department issuing the discharge/death report.
We included all in-patients having reasons for admission to our department such as:
Hepatopancreatic-biliary diseases, including benign and malignant hepatic neoplasms; pancreatitis and pancreatic tumors; and cholelithiasis, cholecystitis, and any other biliary diseases that require surgical intervention; Colorectal cancer, acute diverticulitis, colon perforations, and appendicitis; Esophagogastric neoplasms, hiatal hernias, and bariatric surgery; Endocrine diseases, including thyroid nodules and neoplasms, adrenal diseases, and benign and malignant breast diseases; Any other pathology that requires surgical intervention.
The study excluded patients with an LOS shorter than 72 hours and those patients transferred to the intensive care unit (ICU) without later discharge to the Department of Surgery because of the high resistance rate associated with this department.
Intervention
The prescriptions of meropenem were reviewed by the ASP team, which formulated or not a recommendation about drug, dose, duration, or de-escalation of meropenem. The feedback included the transmission of these recommendations by the ASP member surgeon to the staff. The prescribers maintained their autonomy to accept the recommendation or not.
Phases
This ambispective study was divided into two phases (Fig. 1):
Pre-ASP (baseline) period: January 1, 2009–September 30, 2014, the time before ASP implementation. The data were collected retrospectively.
Post-ASP (intervention) period: October 1, 2014–September 30, 2017. Prospective data were collected.

Timeline of study.
Variables
To compare the population before and after intervention, age and risk of death were obtained. We defined the risk of death according to the All Patient Refined Diagnosis-Related Groups (APR-DRG), a patient classification that incorporates severity of illness subclasses into the DRGs. The APR-DRGs thus expand the basic DRG structure by adding four subclasses of risk of death that relate to the likelihood of dying and create a clinically coherent set of risk of mortality-adjusted patient groups [18].
Our outcomes measured for the baseline and intervention periods were:
Mortality rate, 30 day-readmissions, and LOS;
Prevalence of GNB, E. coli, K. pneumoniae, and P. aeruginosa using episodes as the denominator. All types of cultures were included;
Meropenem resistance of GNB, E. coli, K. pneumoniae, and P. aeruginosa. We consider as resistant those microorganisms classified as resistant or with intermediate susceptibility according to the Microbiology Department. We included intermediate susceptibility as resistant according to a clinical criterion, because if there is no good evolution of the patient infected with bacteria having intermediate susceptibility, the antibiotic should be changed to one to which the organism is sensitive;
Days of treatment (DOT) with meropenem. The DOT was defined as the aggregated sum of the days of any dose of antibiotics administered to an individual patient, regardless of the dose. We standardized this measure by 1000 occupations/bed/day.
For the calculation of the prevalence of microorganisms and the resistance rate, the Clinical Laboratory Standards Institute (CLSI) guidelines were followed [19]. To compare the results in the surgical department, we obtained meropenem resistance and DOT of meropenem.
Statistical analysis
The descriptive analysis was carried out using absolute (n) and relative (%) frequencies to express the qualitative variables. Quantitative variables are expressed as mean ± standard deviation (SD).
The Z test for the difference of proportions was used to determine the significance of differences in the age, mortality risk, deaths, and re-admission rate and the prevalence of GNB and meropenem resistance in the baseline and intervention periods. The Student t-test was used to compare the mean LOS. Statistical significance was considered when the p value was lower than the alpha error, which was 5%.
Data were plotted as a time series with quarterly granularity. On the X axis, the time is represented; and on the Y axis, we represent the prevalence (%), the resistance (%), and the DOT.
We show a run chart for variables, called the median chart. The measure of central tendency was the median, which is indicated by a horizontal reference line. The lower control limit (P10) and the upper control limit (P90) are indicated by dotted lines.
For the calculation of the median, P10, and P90, the three years before the ASP implementation (October 1, 2011, to September 30, 2014) were choosen as the control period (Fig. 1). We selected the closest period in time to the baseline phase to minimize temporal bias.
The median chart interpretation is based on the following rules:
Batch: Six or more consecutive points, all above or all below the median. The values at the median are neither counted nor break a batch;
Trend: Five or more consecutive points, all ascending or all descending. If the value of two or more consecutive points is the same, only the first is counted;
“Astronomical value” is one that is obviously different (unusually high or low).
Results
Thirteen thousand nine-hundred sixty-eight (13,968) patients admitted to our GDS Department were studied. In the pre-ASP phase, 10,321 patients were admitted, and in the post-ASP phase, 3,647 patients were analyzed. The analyses by age and by risk of death are shown in Table 1.
Stratification by Age and Mortality Risk (According to APR-DRG) of Patients Admitted to General and Digestive Surgery Department at University Hospital of Getafe during Baseline and Intervention Periods
APR-DRG = All Patient Refined Diagnosis-Related Groups; ASP = antibiotic stewardship progrm; NS = not significant.
Death, readmissions, and LOS
Table 2 shows the mortality rate, re-admissions at 30 days, and LOS of patients in the baseline and intervention periods. The LOS decreased 1.34 days, a 21.93% reduction, reaching statistical significance (Table 2).
Deaths, 30-day Readmission for Any Reason, and Length of Stay of Patients Admitted to the GDS Department at University Hospital of Getafe during Baseline and Intervention Periods
ASP = antibiotic stewardship program; LOS = length of stay; NS = not significant.
Prevalence of gram-negative bacilli
During the baseline period, 1,532 isolates were retrieved in 988 cultures, and the prevalences of E. coli, K. pneumoniae, and P. aeruginosa were 17.89%, 6.27, and 6.59%, respectively.
During the intervention period, 963 isolates were obtained in 495 cultures, and the prevalence of E. coli, K. pneumoniae, and P. aeruginosa were 18.19% (p > 0.05), 8.81 (p < 0.05) and 3.59% (p < 0.05), respectively.
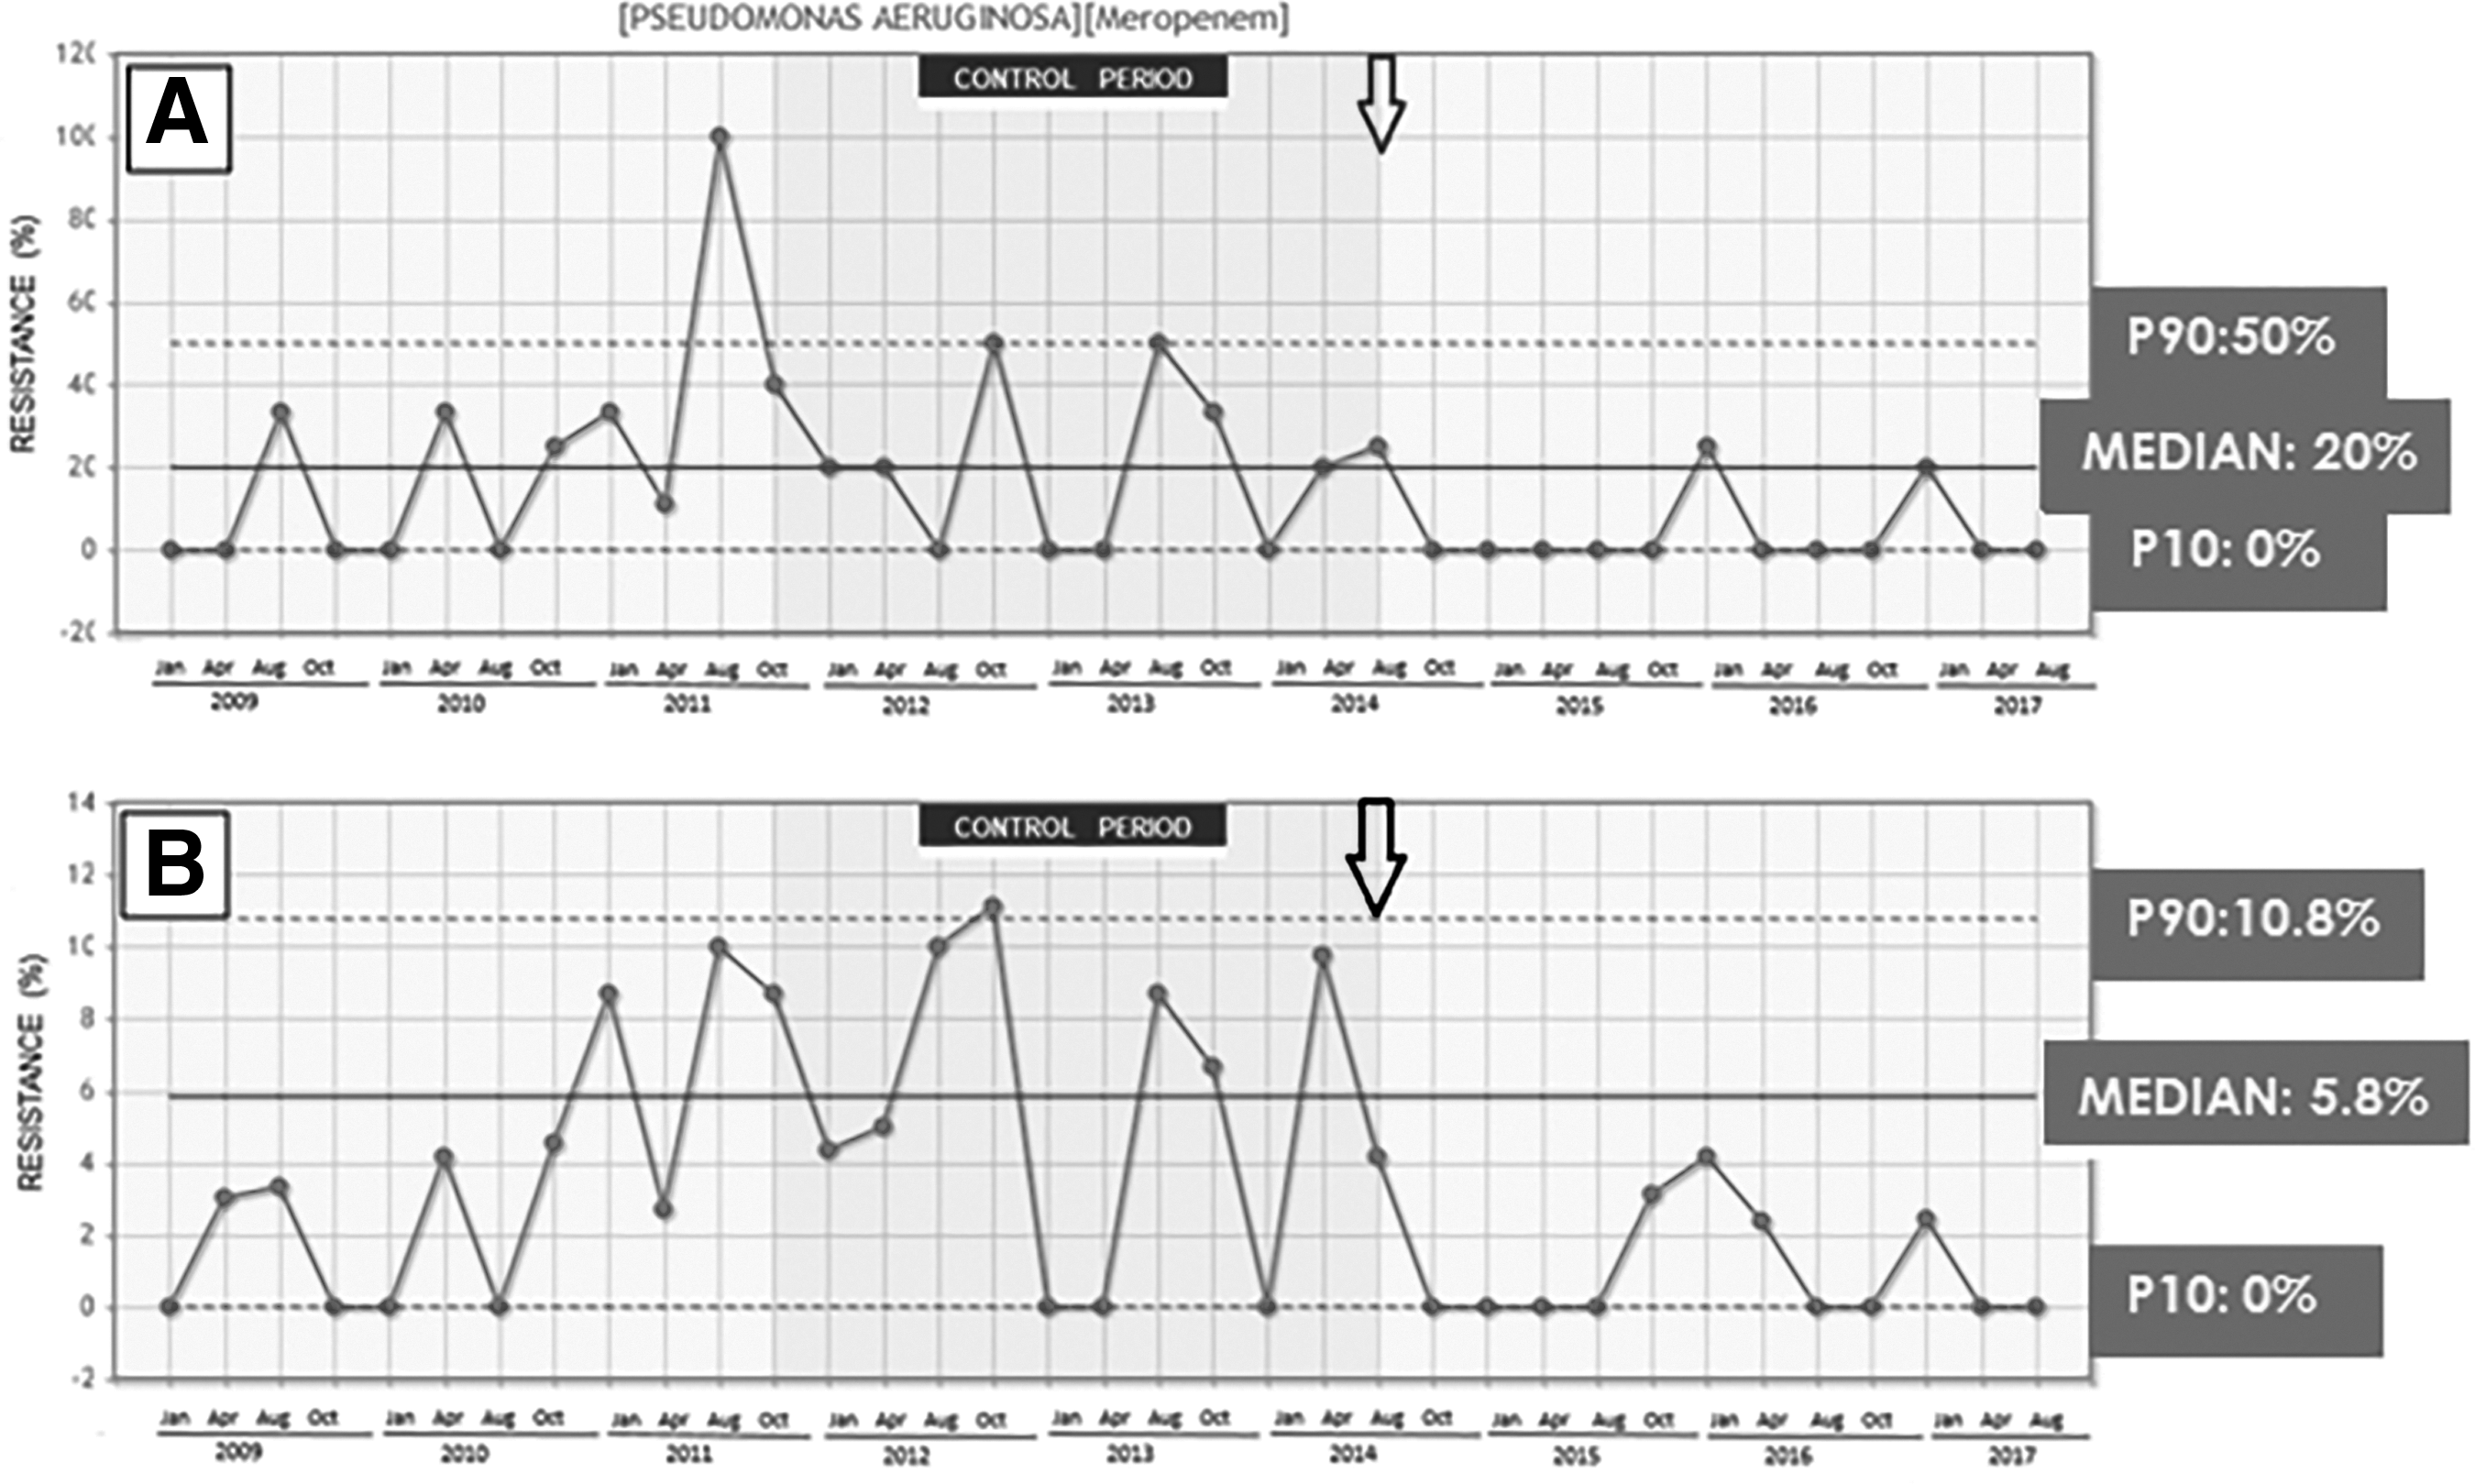
Prevalence data of P. aeruginosa during the intervention period are preferably below the median (0.8%), reaching a significant point of decline (“astronomical value” in January 2015, August 2015, August 2016, April 2017, and August 2017) (Fig. 2A). For the prevalence of K. pneumoniae during the intervention period, data tended to be above the median, reaching 5 astronomical units (on January 2015, April 2016, August 2016, January 2017, and August 2017) (Fig. 2B).

Time series of prevalence (by episodes) of P. aeruginosa (
There is a complementary symmetry between the “astronomical values” of P. aeruginosa (below the median) and K. pneumoniae (above the median) in January 2015, August 2016, and August 2017.
Meropenem resistance
The meropenem resistance rates of E. coli, K. pneumoniae, and P. aeruginosa were 0.45%, 2.53%, and 21.25% respectively, during the baseline period and 0, 0, and 7.69%, respectively, during the intervention period. The analysis of aggregated data showed no statistical differences in meropenem resistance, although there was a downward trend in P. aeruginosa that did not reach statistical significance (p < 0.1).
The data are represented by a median chart in Fig. 3. The visual analysis confirms the trend toward statistical significance obtained with aggregated data of P. aeruginosa (Fig. 3A). The chart of GNB and P. aeruginosa keep parallelism over time, so the meropenem resistance of GNB depends on the resistance of P. aeruginosa. Therefore, this finding justifies the choice of the objectives of this study for our Department.
Time series of meropenem resistance of P. aeruginosa (
The meropenem resistance of GNB and P. aeruginosa at the Hospital as a whole are shown in Fig. 4. The data are lower than in the GDS department during the baseline period. After the ASP intervention, the Hospital continues with an upward trend, surpassing its P90, whereas the resistance is decreasing in the department (Figs. 3A and 4A).
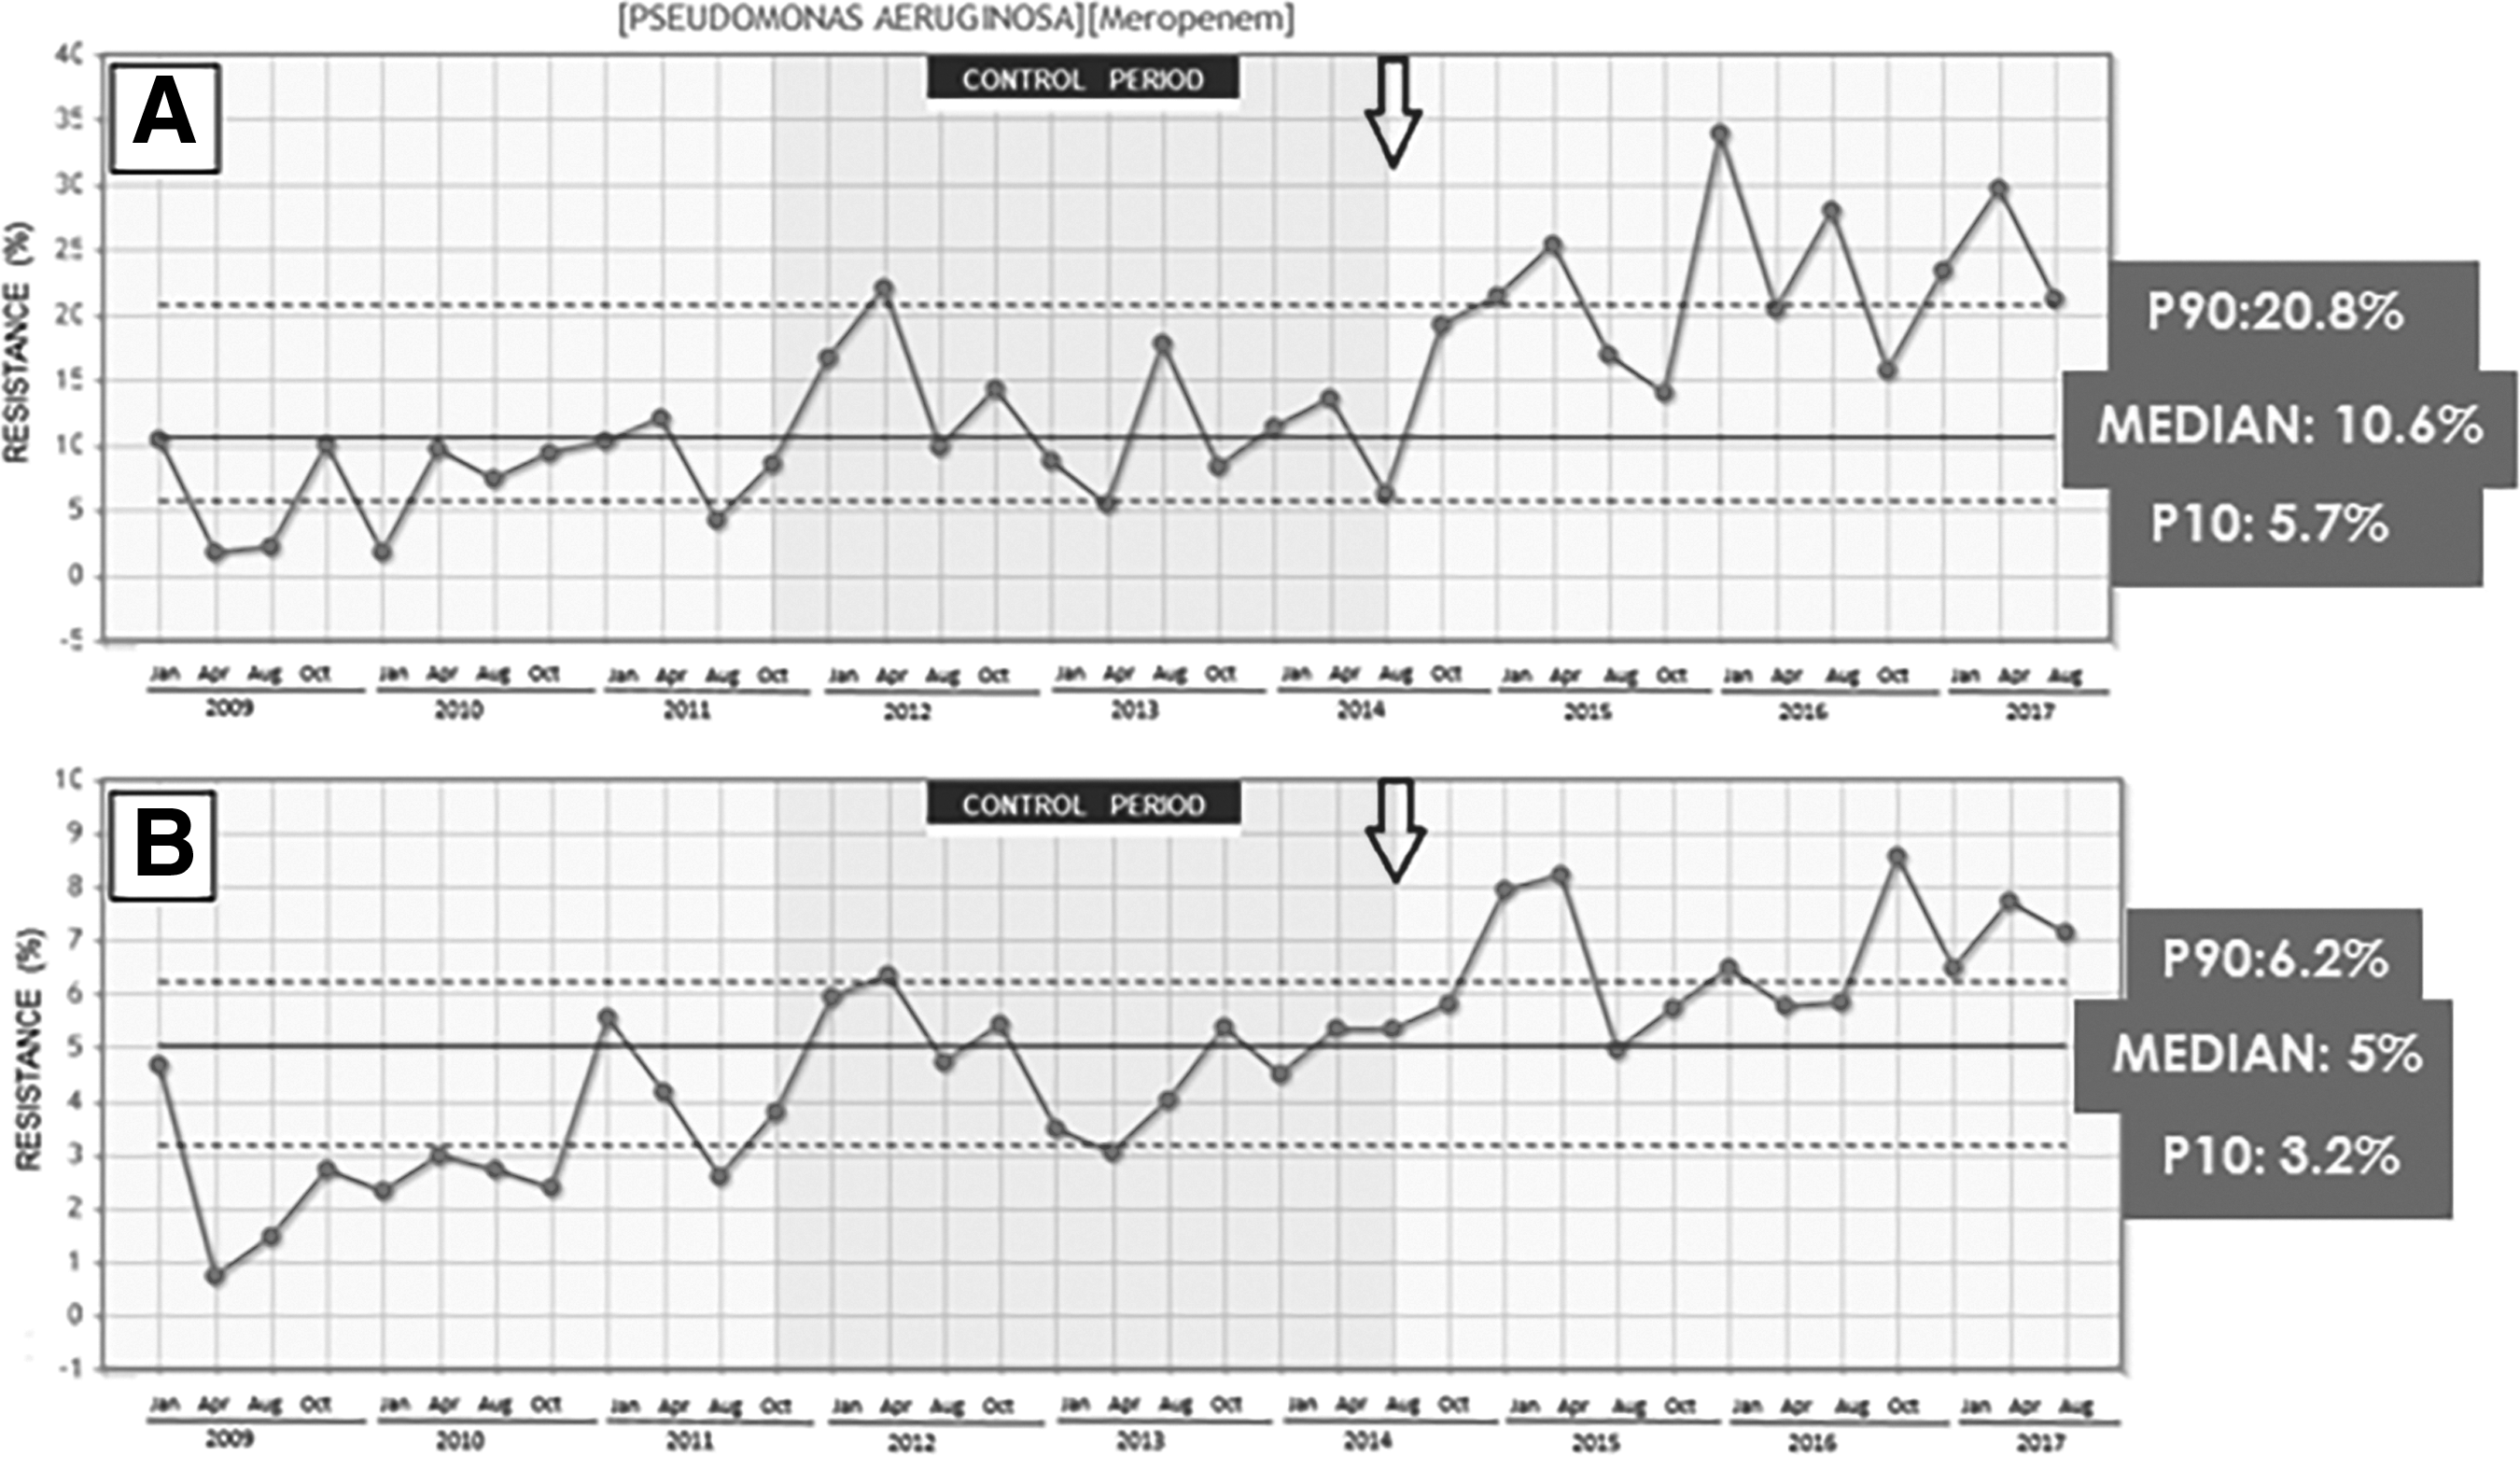
Time series of meropenem resistance of P. aeruginosa (
The relevance of P. aeruginosa in the resistance of GNB is maintained in the Hospital, which reinforces the choice of our objectives (Fig. 4).
Meropenem DOT
During the intervention period, the meropenem DOT showed a downward trend (Fig. 5A). Only one “astronomical value” below the median does not continue the trend. This point (October 2015) was analyzed and proved to be related to the physical absence of the surgical leader. The relevance of this phenomenon is reflected in the median chart (Fig. 5B).
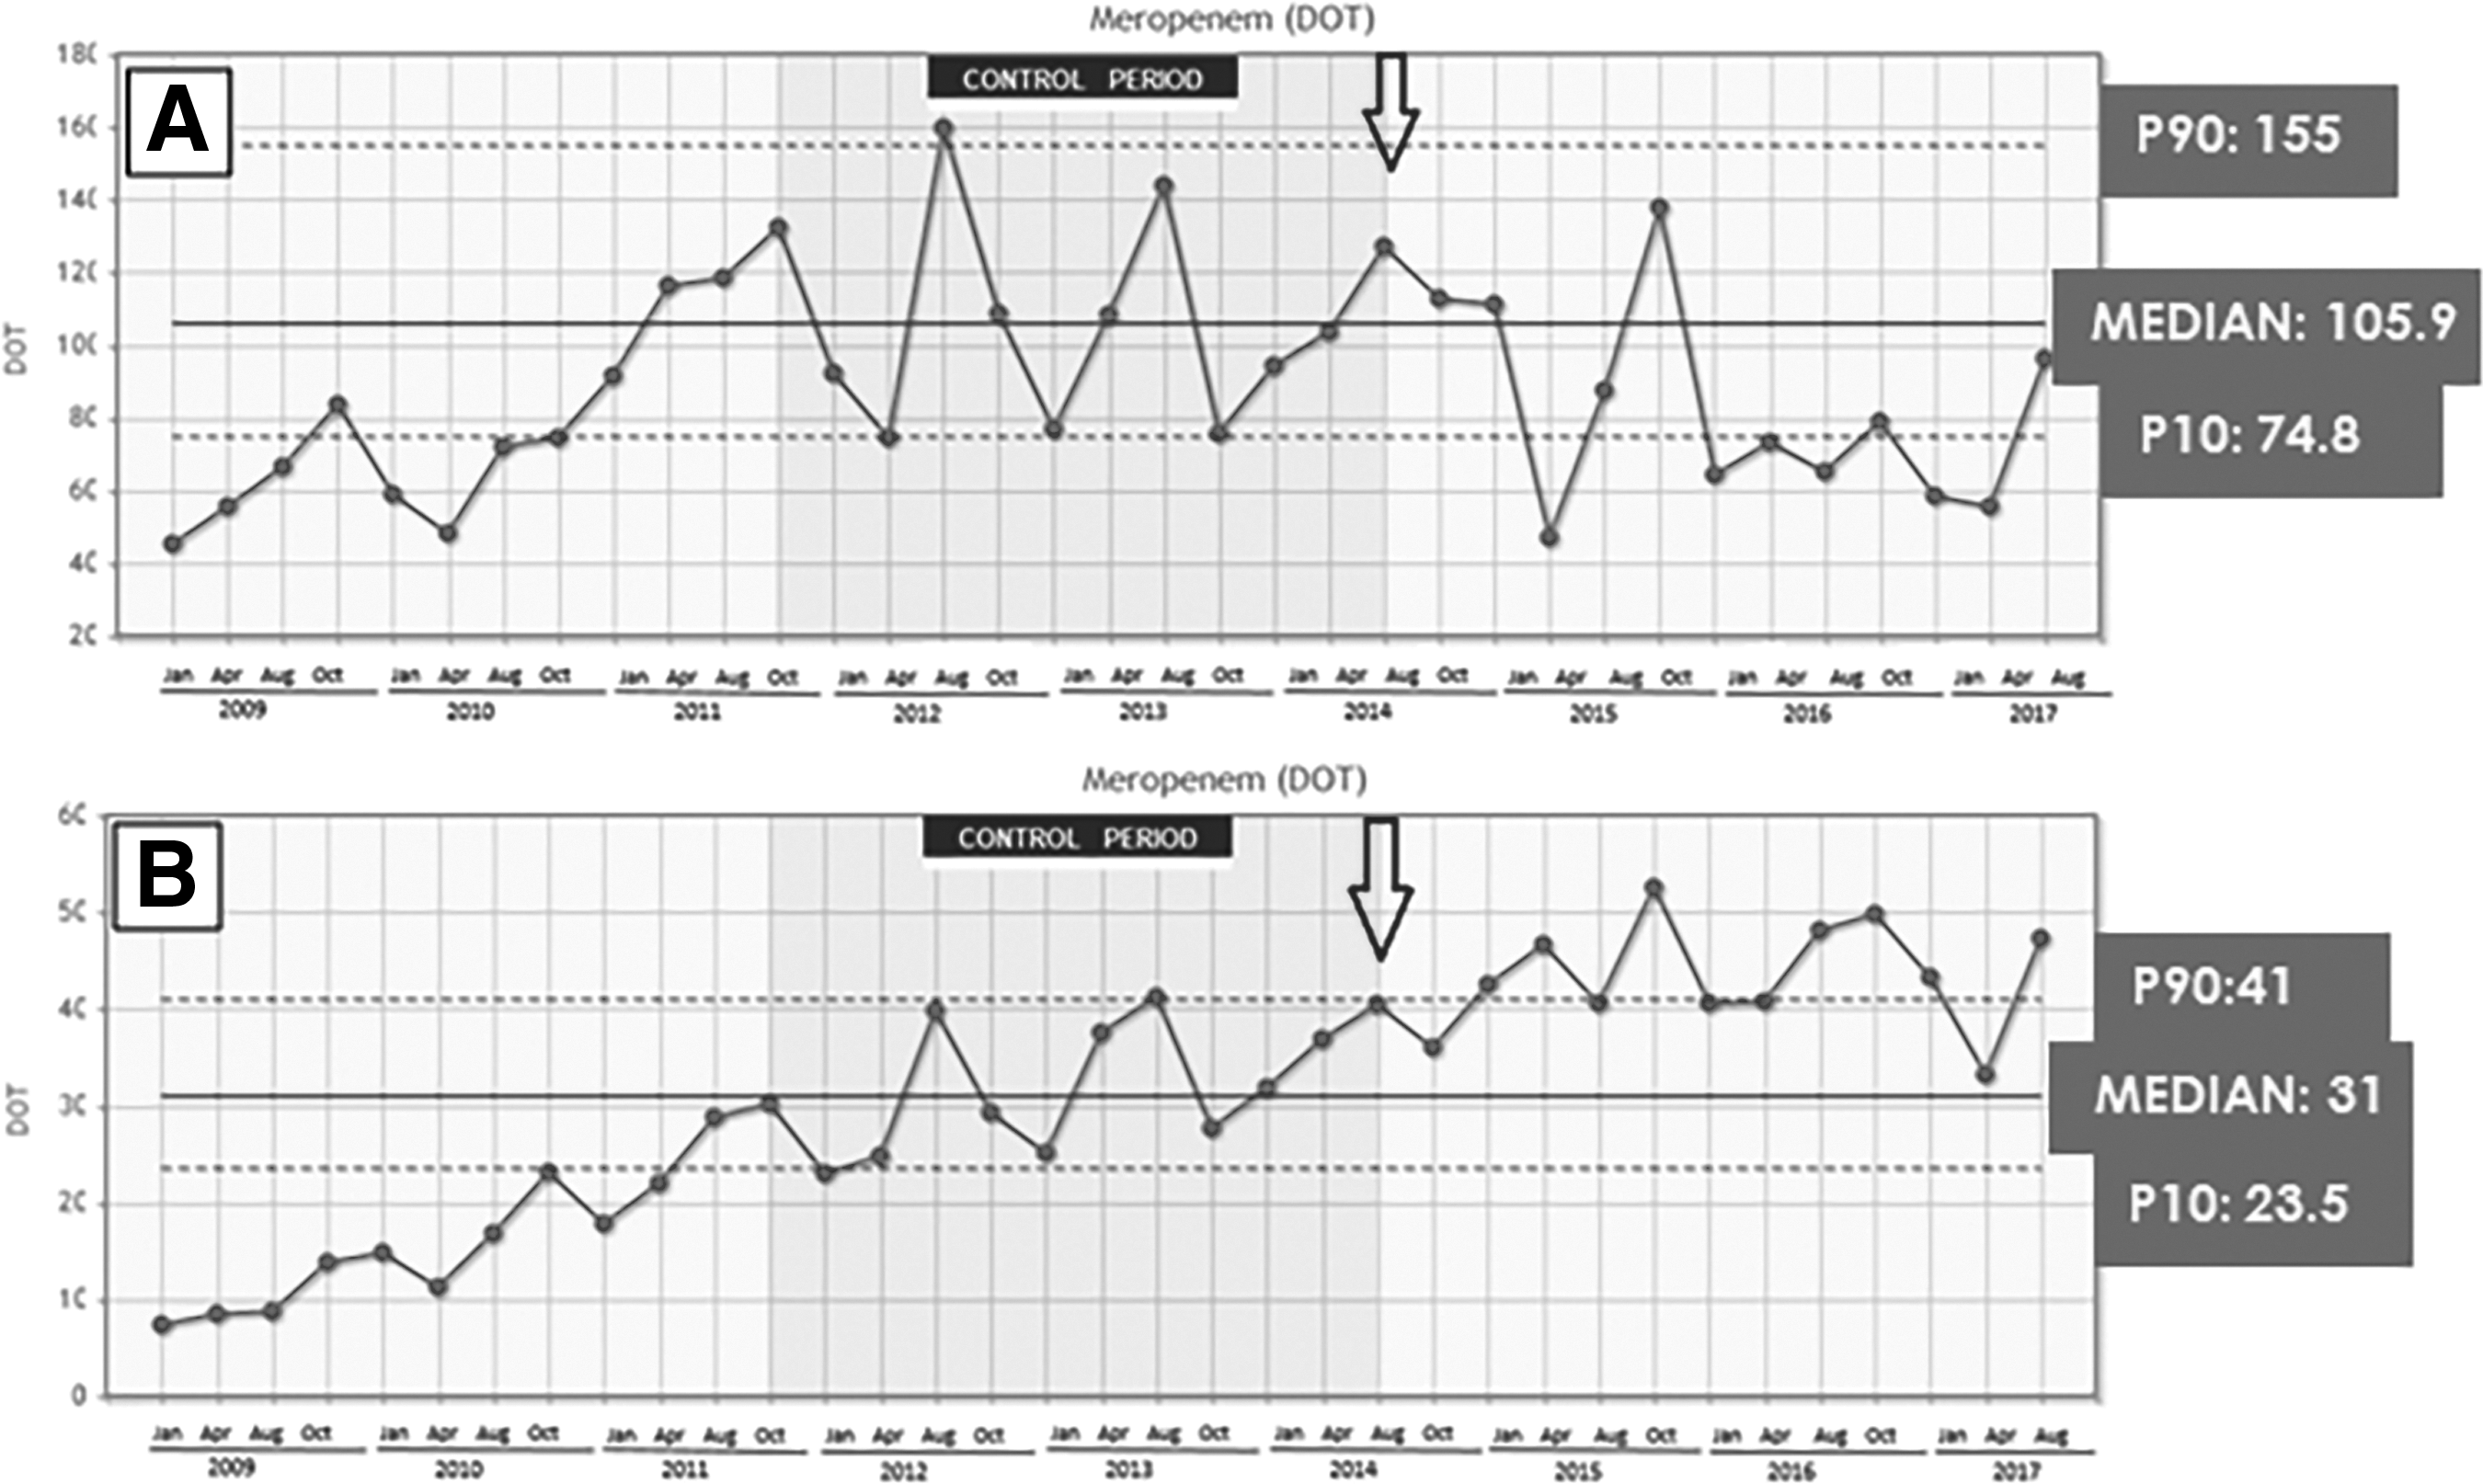
Time series of meropenem days of therapy (2009–2017) in GDS Department (
With a visual analysis, we observe that a DOT peak precedes an increase in resistance, such as the DOT in October 2015 and resistance in January 2016, both in the department and in the hospital, regardless of the existence of any association (Fig. 5).
Discussion
Antimicrobial resistance is a consequence of the selective pressures of antibiotic prescribing. Considering that as many as 40% of antibiotic use is inappropriate regardless of the geographic area [20], the rational use of antibiotics could prevent or slow its emergence.
Evaluating the current situation is essential to select the objective [21]. We chose meropenem as a priority target because prescriptions for it have been increasing, especially in surgical departments. Before ASP implementation, the meropenem DOT in our department was three times higher than in the hospital as a whole. During the intervention period, the decrease in meropenem DOT meant that it almost reached the hospital DOT value (Fig. 5).
Recommendations emphasize the need for ASPs [10,21]. Therefore, as of 2017, all hospitals accredited by the Joint Commission will be required to meet the new quality standards regarding ASPs [22]. Growing evidence suggests that ASPs are effective and reduce antibiotic use, antimicrobial resistance, and costs [11,12,23–31]. However, there is a great variability in the targets and performance criteria.
According to the literature, our ASP had an impact on meropenem prescription, with a decrease in meropenem resistance. These effects became obvious in the initial phase and were sustained up to three years after implementation (see Figs. 3 and 5). This result was accompanied by an LOS and mortality rate decrease, although these changes were not statistically significant. However, it is difficult to determine a cause–effect relation; thus, the effect on prescriptions may be related to LOS and death. More studies to define the impact of LOS and death on DOT are needed. During the intervention period, there were no computer algorithms for prescription or changes in staff, which may have affected our results.
Escherichia coli remained the most prevalent micro-organism after ASP, whereas P. aeruginosa was overtaken by K. pneumoniae. The increasead prevalence of K. pneumoniae isolates in the post-ASP period agrees with the literature; this increase has been reported elsewhere in recent papers on intra-abdominal infection [32].
According to the updated Infectious Diseases Society of America guidelines [33], we choose DOT to measure antibiotic prescriptions and to report the results of ASP strategies. Nowadays, this is the most accurate measure of antibiotic use because of its greater clinical relevance [33] and is used by the CDC and the National Healthcare Safety Network.
Although the literature highlights the importance of ASP, its impact is likely to depend on available resources, leadership, databases for monitoring the results, and reports to staff [31]. So, ASP strategies need both human and material resources and an adequate method for analysis as well as for reporting the results.
About human resources, the team must be multi-disciplinary, and the choice of leadership is critical [21]. The relevance of surgical infections and the surgical prescribing patterns of antibiotics have alerted us to the need for improvement in this area [22]. In the GDS department, ASP literature is limited, with wide variability, focusing mainly on the implementation of prophylaxis/empirical protocols [13,34–36]. Sartelli et al. demonstrated an 18.8% decrease in antibiotic use after an education-based ASP in a general and emergency surgery department [13]. Güerri-Fernández et al. described an ASP in a GDS department, with a PAF model guided by a physician [37]. Campbell et al. reported a 12% decrease in total systemic antibiotic use in a surgical department after a PAF [38]. Our approach singularly includes the active involvement of a surgeon on the ASP team [14–16]; we try to maximize the potential for engagement of surgical staff, which is essential to achieving success [38]. The role of the surgeon includes auditing prescriptions, providing feedback, and teaching in the rational use of antibiotics [39].
Databases are essential tools to implement ASP, to know the current situation, and to report the results [31]. Our software, WASPSS, is based on the daily information obtained from the prescribers, is automatically sustainable, and is supervised by the ASP staff. It allows automatic monitoring of data, one of the relevant points, and identifying new objectives. In our study, we report the relation between the staff supervision of the computer and patient safety. There were no deaths or morbidity events attributable to the ASP intervention, possibly because of the direct supervision of the recommendations by the prescriber.
On the other hand, there is no consensus about the methodology for monitoring the ASP, and the recommendation is to use a method adequate for the objectives. We use median chart representation, which allows evaluation of the effect of an intervention over time, comparing with our own data and rolling out the possibility of a gradual change simultaneously with the intervention [40]. The time series analysis has been used in other studies on the implementation of ASPs [38]. The analysis based on aggregated data involves loss of the information obtained related to time such as trend, seasonality, and variability. The median chart representation has the benefits of using time series versus aggregate data. The possibility of visual analysis by the prescribers makes the control charts (the median chart in our study) into a powerful tool to facilitate feedback between ASP activity and prescribers. Obviously, an internal benchmarking and analysis of the stability of the activity is possible. External benchmarking is possible in fundamental aspects such as trend and variability of the monitored parameters.
Our study is based on local data. Unlike other types of study, this circumstance is not a limitation. All antibiotic policy guidelines share the criterion that recommendations should be adapted to local epidemiologic data. Therefore, for the explicit purpose of our work, in our opinion, the local nature of the data is not a limitation.
There are limitations to our study, however. First, the analysis of data is limited by the quality of the hospital database; data of the baseline period were retrospective and automatically obtained, whereas during the intervention period, the patients were supervised daily by the prescribers. So, the electronic medical record has been identified as a target for improvement. Second, the numbers of patients differ in the two periods. Third, we included all patients, regardless of their reason for surgical admission, and all cultures, regardless of the source of infection. Also, we did not relate time to source control, which could be related to resistance. Our aim was an initial study to obtain the global results after the implementation of an ASP program in a surgical department; thus, no restriction of disease/culture was performed; but further studies stratified by pathology and with time to source control are needed. Finally, we did not perform a cost analysis, and cost advantages are an outstanding aspect for managers. This was not the goal of this study, but the results of LOS, death, re-admissions, meropenem prescription, and the absence of adverse events attributable to the ASP intervention allow prediction of a favorable result in costs.
In conclusion, ASPs have a desirable effect on patients. In our experience, the ASP team should be led by a staff member of the department being reviewed. When human resources are limited, the sustainability, efficiency, and effectiveness of ASP interventions are feasible only with adequate computer support. Finally, the feedback between the prescribers and the ASP team must be based on an ad hoc method such as that provided by statistical control charts.
Footnotes
Acknowledgments
The authors thank Manuel Campos, PhD, leader of the WASPSS project and Assistant Professor in the Department of Information and Systems at the University of Murcia, Spain. We also thank the Ministry of Health for choosing WASPSS as a computer tool within the framework of the National Plan against Resistance to Antibiotics.
The WASPSS project was funded by MINECO ID project TIN 2013-45491-R. The views and opinions expressed herein are those of the authors and do not necessarily reflect those of the funder.
Author Disclosure Statement
All authors report no conflicts of interest relevant to this article.