
Abstract
Background:
Antimicrobial prophylaxis is a cornerstone to preventing surgical site infections (SSIs). Ertapenem, a carbapenem antibiotic, is commonly used for surgical prophylaxis for many different procedures, including patients undergoing colorectal and other gastrointestinal surgeries. Obesity complicates surgical intervention and increases the risk for SSIs. This study aims to describe the pharmacokinetics of ertapenem for surgical prophylaxis using a population pharmacokinetic model.
Patients and Methods:
Ten patients were recruited and given a single dose of ertapenem 1 g intravenous over 30 minutes. Plasma samples were obtained at multiple time points over 24 hours and assayed via validated high-performance liquid chromatography (HPLC). Pharmacokinetic analyses were conducted using a population pharmacokinetic analysis to generate pharmacokinetic parameters used in the subsequent 5,000 patient Monte Carlo simulation. The probability of target attainment (PTA) for free drug concentrations remaining above the minimum inhibitory concentration (MIC) for ≥40% was used.
Results:
The mean maximum plasma concentration and area under the concentration time curve (AUC0-∞) was 40.7 ± 16.5 and 148.8 ± 28.0, respectively, with a half-life of the terminal portion to be 4.3 ± 0.8 hours. Monte Carlo simulations observed PTAs above 90% for MICs ≤0.25 and ≤0.125 mcg/mL in surgeries up to three and four hours, respectively. Sufficiently high PTAs were not attainable for MICs of ≥0.5 mcg/mL.
Conclusions:
Ertapenem given as 1 g single dose may be an appropriate candidate for surgical prophylaxis in obese patients undergoing surgeries of four hours or less.
Obesity is a problem that affects approximately 40% of the U.S. population [1]. Worldwide, 650 million adults are obese and 1.9 billion are overweight. Given the large number of obese patients within the population and the detrimental effects of obesity on a person, it is likely that many patients undergoing surgery will be obese. Unfortunately, obesity is also an independent risk factor for complications from surgery, including surgical site infections (SSIs) [2].
Therefore, the appropriate selection of antimicrobial prophylaxis is imperative, especially in obese patients who are at increased risk of infection after surgery. Ertapenem has been widely used as surgical prophylaxis in patients undergoing many operations including colorectal and other gastrointestinal surgeries. Clinical data published by Itani et al. [3] observed increased SSIs among obese patients with body mass indexes (BMI) ≥30 compared with those with BMI <30 who received both ertapenem and cefotetan. Numerically, ertapenem across all BMIs had less SSI than did cefotetan. A potential reason for this increase could be a reduction in plasma concentrations compared to non-obese healthy volunteers. This study aims to characterize the plasma concentrations of ertapenem in obese patients undergoing surgery who received ertapenem for surgical prophylaxis.
Patients and Methods
Study protocol
This study was reviewed and approved by the Committee on Human Rights in Research of Weill Cornell Medical College. Patients undergoing elective bariatric surgery and with a BMI >40 kg/m2 were screened for enrollment. Patients were excluded if they had an allergy to penicillin or β-lactams, currently pregnant or lactating, chronic kidney disease, or chronic hepatic insufficiency. Ten patients provided informed consent and underwent drug administration and sampling.
One gram of intravenous ertapenem was infused over 30 minutes prior to the surgical procedure. Serum samples were collected 30 minutes, two, six, 12, 18, and 24 hours post-infusion. Once collected, samples were centrifuged at 3,200 rpm for 10 minutes to separate serum. Serum was stored at −80°C until analysis.
Analytical procedures
Ertapenem concentrations in plasma were determined using a previously described validated high-performance liquid chromatography (HPLC) assay at the Center for Anti-Infective Research and Development in Hartford, Connecticut [4,5]. The plasma assay was linear over a range of 0.25–50 mcg/mL (r2 ≥ 0.999). The mean inter-day coefficient of variation for the high (40 mcg/mL) and low (0.5 mcg/mL) check samples was 3.4% and 3.1%, respectively. The mean intra-day coefficients of variation were 3.0% and 5.4%, respectively.
Pharmacokinetic analyses
Pharmacokinetic analyses were conducted using a population pharmacokinetic analysis to generate pharmacokinetic parameters used in the subsequent Monte Carlo simulation. Total concentration data were modeled by non-parametric adaptation grid (Big Non-Parametric Adaptive Grid [BigNPAG]) with adaptive γ in order to derive ertapenem pharmacokinetic parameters [6]. Model selection was determined by Akaike information criteria, the likelihood ratio test, and visual predictive checks. A two-compartment model with zero order input and first-order elimination best fit the data. The mean weighted error was used as the measure of bias and the bias-adjusted mean weighted squared error was used for precision. Bayesian estimates were obtained for each patient using the population-of-one utility within BigNPAG. Model parameters for individual patients were used to calculate model predicted peak concentrations for each patient.
Monte Carlo simulation
A 5,000-patient Monte Carlo simulation (Crystal Ball, Oracle Corporation, Redwood Shores, CA) was conducted to assess the probability of target attainment (PTA) for free drug concentrations remaining above the minimum inhibitory concentration for ≥40% (40%fT>MIC) of the surgical time. Probability of target attainments were assessed over a range of time for surgical procedures at two hours, three hours, and four hours in duration. These times were chosen to cover the average operating time for a bariatric surgery procedure [7]. Probability of target attainments were calculated for a range of minimum inhibitory concentrations (MICs) to capture the ertapenem breakpoint for Enterobacterales (≤ 0.5 mcg/mL and gram-positive pathogens [8]. Parameter estimates and covariance from the population analyses were used during the Monte Carlo simulation to simulate steady-state total drug concentration time profiles for ertapenem 1 g as a 30-minute infusion. Protein binding was applied using a polynomial, y = y0 + a*x + b*x2, where y = % free, y0 = 2.4592, a = 0.003528, b = 0.0001241, and x = total plasma concentration, to each total drug concentration profile to estimate free drug concentrations prior to calculating the fT>MIC [1]. Probability of target attainments were then calculated.
Results
Patients
Informed consent was obtained from 10 individuals who then provided samples. Table 1 describes demographic information for these subjects. Of the 10 subjects, three were male.
Demographic Information for the Ten Participants
BMI = body mass index.
Pharmacokinetic analyses
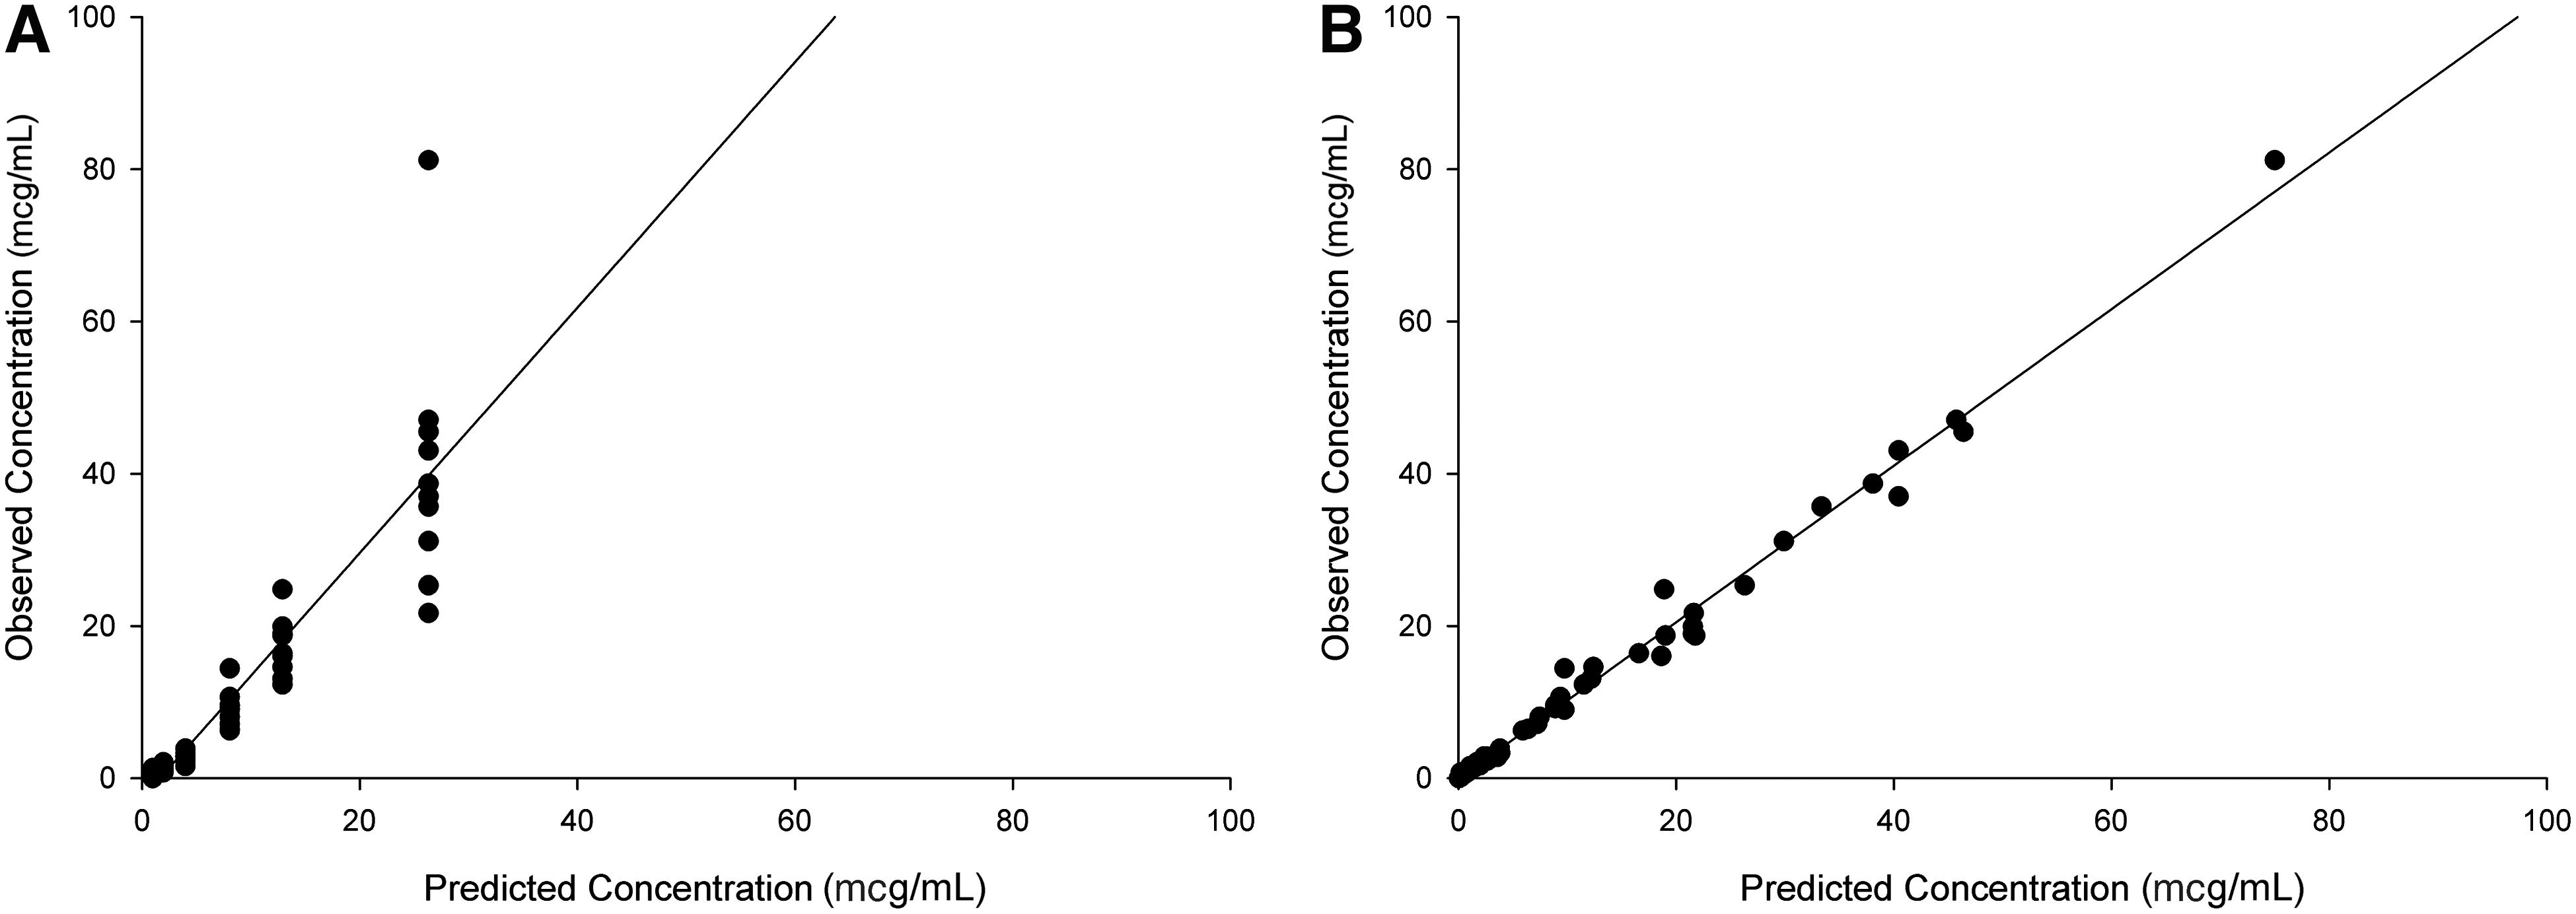
The concentration time profile for all 10 patients is depicted in Figure 1. The mean maximum plasma concentration (Cmax) and area under the concentration time curve (AUC0-∞) was 40.7 ± 16.5 and 148.8 ± 28.0, respectively. The half-life of the terminal portion was calculated to be 4.3 ± 0.8 hours. Mean pharmacokinetic parameter estimates from the population model are described in Table 2. The overall fit for the population predicted versus observed concentrations based on the mean parameter estimates was acceptable with r2 of 0.8149, bias of 3.352, and precision of 127.07 mcg/mL (Fig. 2A). The maximum a posteriori probability (MAP)-Bayesian or individual predicted versus observed concentration plot demonstrated better fit with r2 value of 0.9899, bias of −0.0694, and precision of 1.0136 (Fig. 2B).
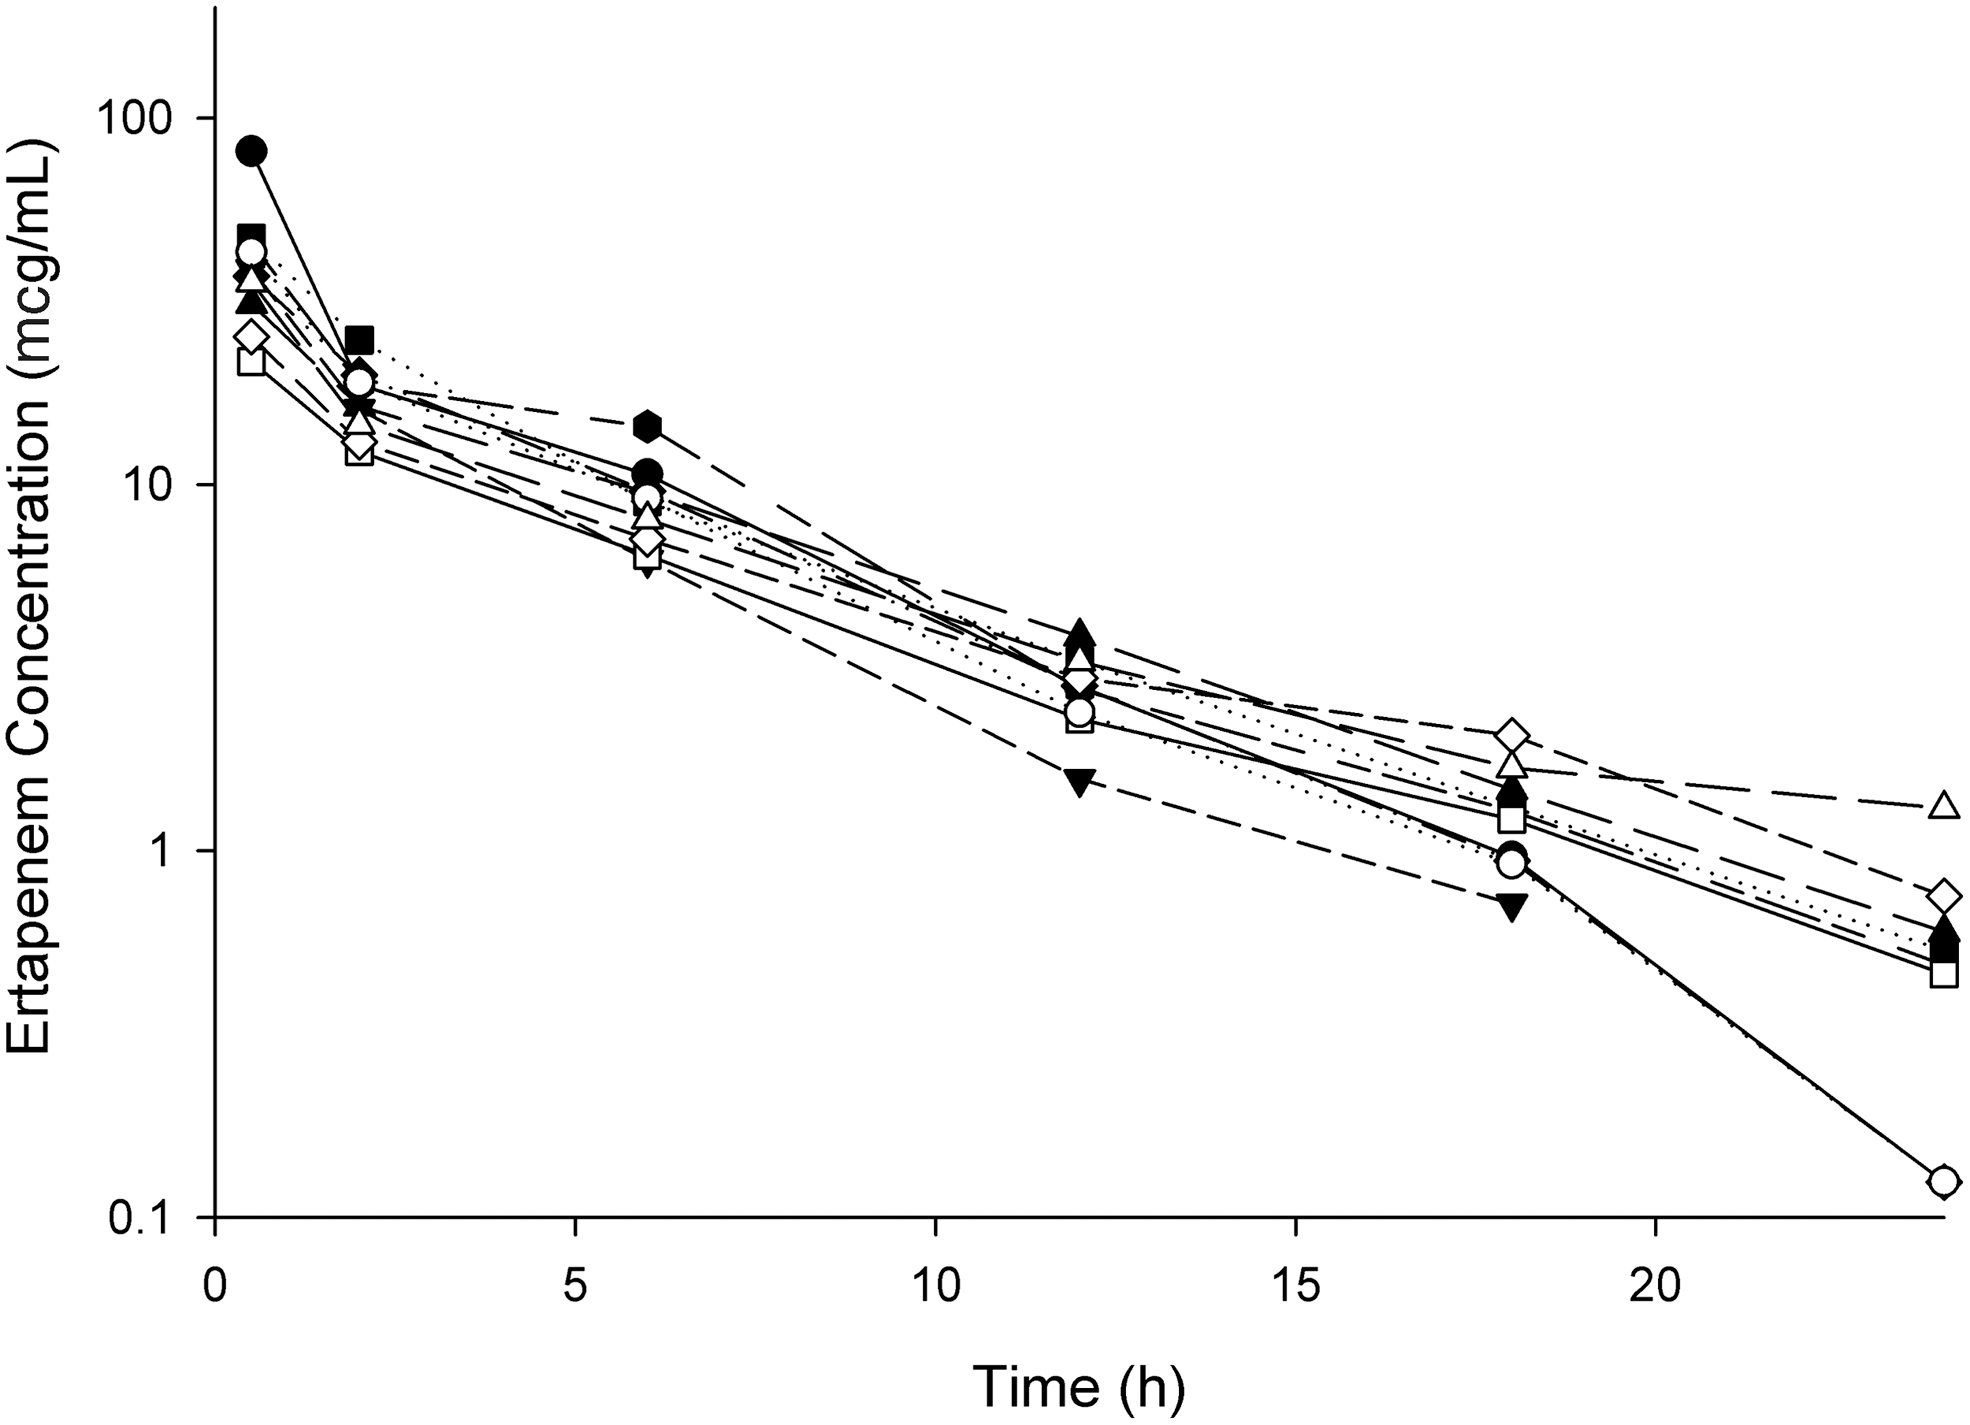
Total ertapenem concentration time profile for individual patients after administration of ertapenem 1 g as a 30-minute infusion. Patient 1, upward facing black triangle; Patient 2, black circle; Patient 3; downward facing black triangle; Patient 4, black square; Patient 5, black diamond; Patient 6, black hexagon; Patient 7, open square; Patient 8, open circle; Patient 9, open diamond; Patient 10, open triangle
(
Population Pharmacokinetic Parameter Estimates and Covariance for the Final two Compartment Model Describing Ertapenem Plasma Concentrations Derived Using BigNPAG
Vc = volume of distribution of the central compartment; CLT = total body clearance; k12 = microtransfer rate constant from the central to peripheral compartment; k21 = microtransfer rate constant from the peripheral to central compartment; SD = standard deviation.
Monte Carlo simulation
The PTAs for two hours, three hours, and four hours remained high over MICs of 0.0625, and 0.125 mcg/mL. At 0.25 mcg/mL, the PTA during a four-hour surgery dropped below 90% to 88%. At a MIC of 0.5 mcg/mL, all PTAs, even for the shortest duration of time simulated, two hours, were not above 40%. The PTA for each of the surgery times simulated is shown in Figure 3.
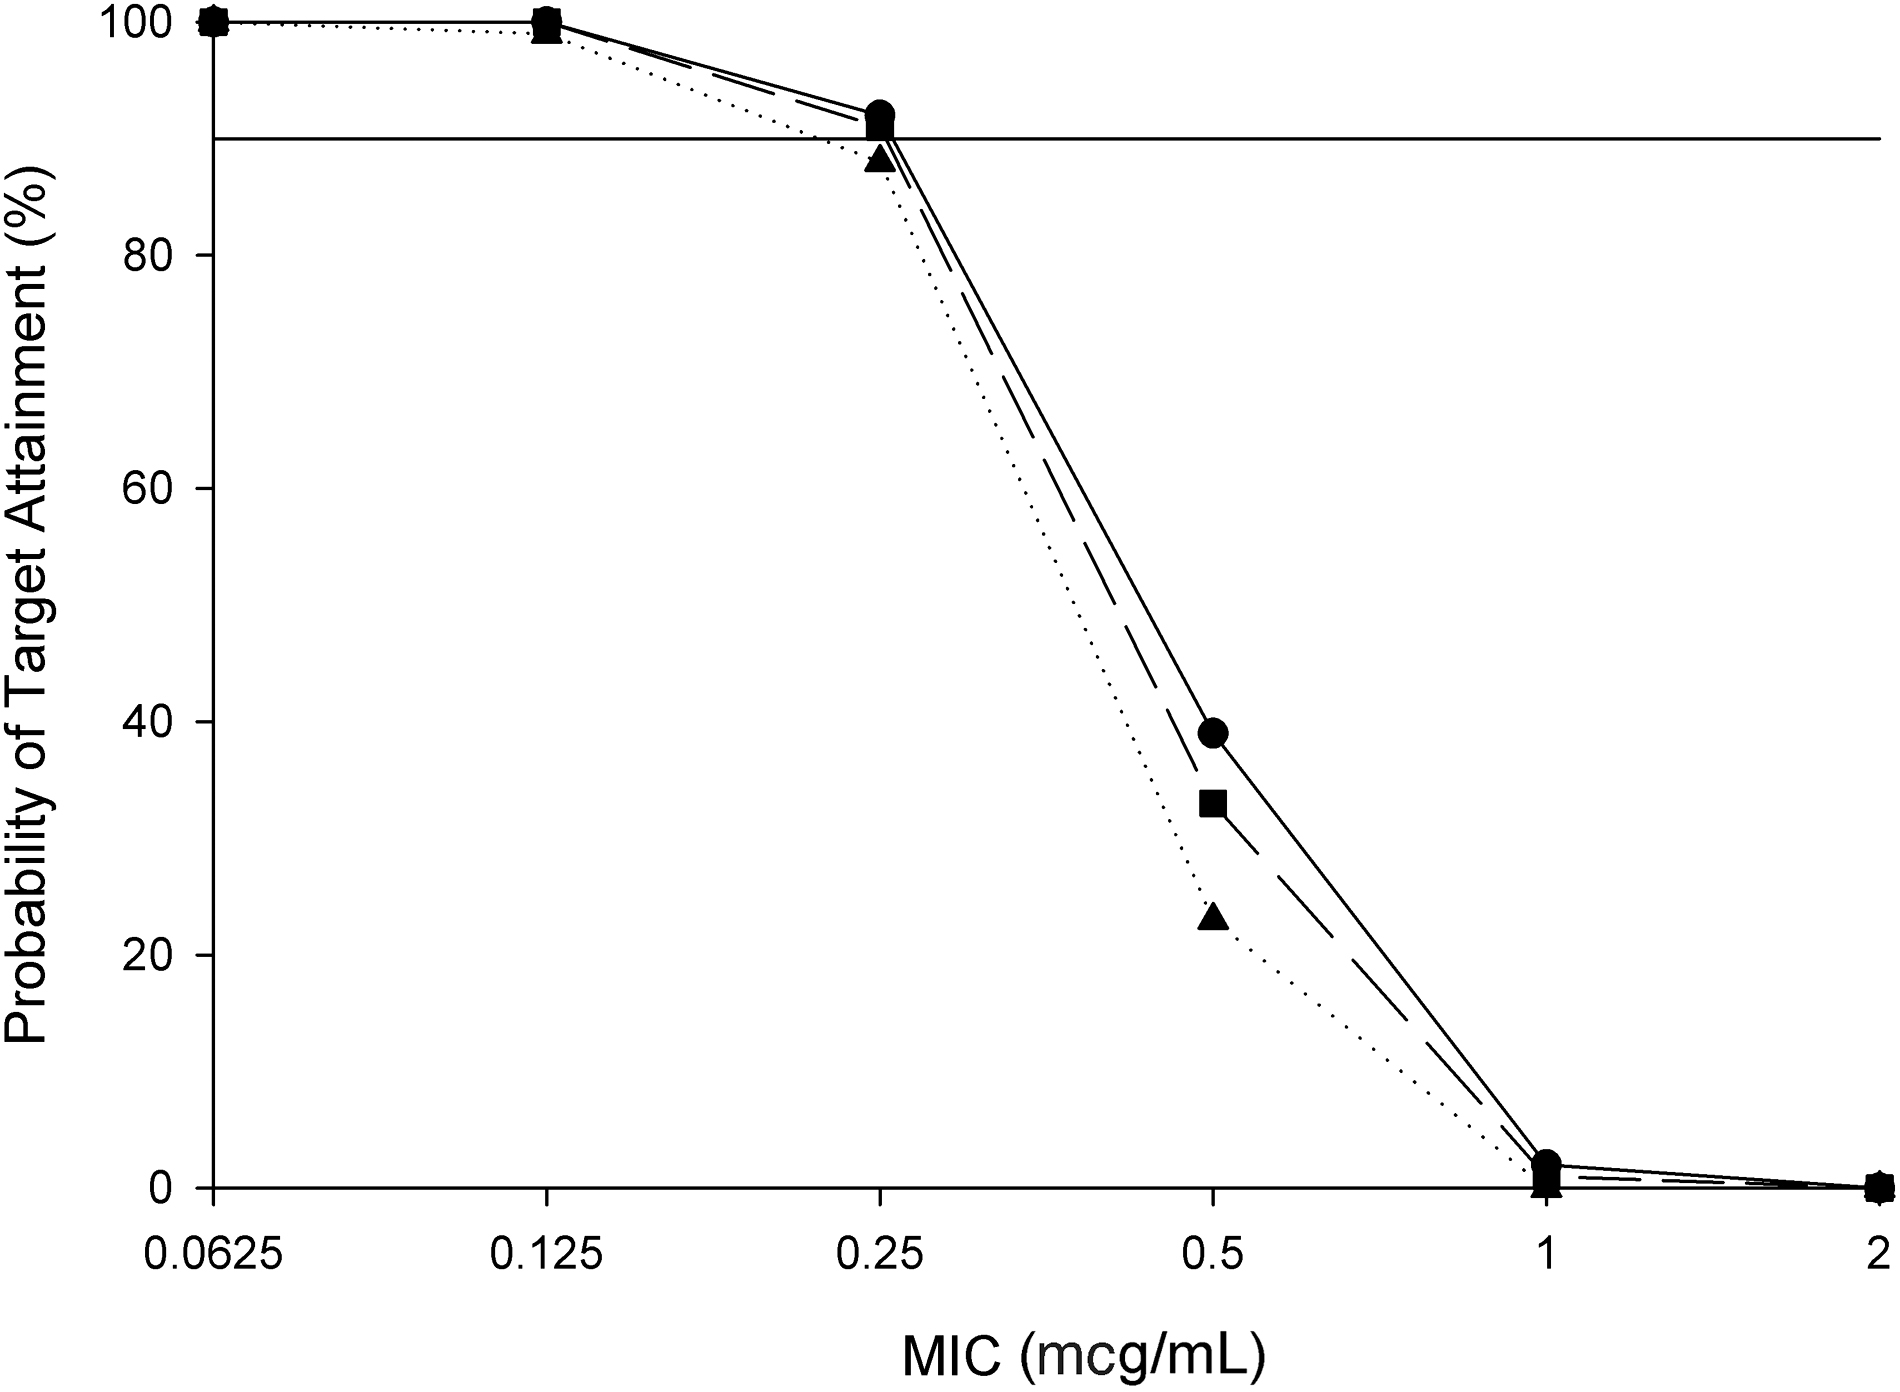
Probability of target attainment (PTA) for ertapenem achieving 40% fT>MIC over a two-hour procedure (circles), a three-hour procedure (squares), and a four-hour procedure (triangles). The solid line is optimal PTA at 90%.
Discussion
Obesity is more commonplace in the United States and the world than in years past. As a direct result, there are more obese patients undergoing surgical procedures. This adds to the necessity of describing pharmacokinetic observations of different antimicrobial agents used in surgical prophylaxis within the obese population. Furthermore, SSIs after bariatric surgery have been reported to be between 1.3% and 22% [2,6,9]. This highlights the continued prevalence of SSIs and the need for continued review of dosing strategies among obese and morbidly obese individuals.
This study aimed to do just that, namely, describe the pharmacokinetic profile of ertapenem in obese patients undergoing elective bariatric surgery. The pharmacokinetic study paired with population pharmacokinetic analysis and Monte Carlo simulations aid the current literature to suggest ertapenem may be an attractive prophylactic medication for this patient population if other alternatives are not suitable given patient allergies, previous history of organisms harboring extended-spectrum β-lactamases, or other reasons. Furthermore, this study aims to determine the PTA within a typical surgical timeframe.
Among patients, there was substantial variability when comparing pharmacokinetic parameter estimates to healthy volunteer data [3,11]. The maximum ertapenem plasma concentration was lower within the obese patient population compared with healthy volunteers. This resulted in lower area under the concentration time curves (AUC). When compared with critically ill patients, volume of distribution and half-life were similar [12,13]. Burkhardt et al. [13] described a volume of distribution during the terminal phase (Vz) of 17.3 ± 5.93 L and half-life of 4.15 ± 1.33 hours compared with 14.9 ± 9.3 L and 4.3 ± 0.8 hours, respectively, for this patient population. Although these values were similar, Cmax and AUC were lower than Burkhardt et al. [13] reported at 90.5 ± 26.1 and 418.5 ± 171.6 (AUC0-∞), respectively. This may be because of the differing patient populations, obese volunteers undergoing elective bariatric surgeries for this study and critically ill, likely non-obese patients in the study published by Burkhardt et al. [13].
Other published literature observing ertapenem pharmacokinetics in obese patients by Chen et al. [14] also described higher Cmax and AUC, however, mentioned PTAs below the optimal 90% at 0.25 mcg/mL for two groups, those with BMIs 30–39.9 kg/m2 and those with BMIs ≥40 kg/m2. This was further described in a study by Borracci et al. [15]. In this pharmacokinetic/pharmacodynamic (PK/PD) study of obese (BMI ≥40 kg/m2) female patients receiving ertapenem for prophylaxis of bariatric surgery, the authors observed higher total concentrations but faster clearances and subsequently PTAs below the 90% goal for MICs at 0.25 mcg/mL. For anything longer than a three-hour procedure, our observations demonstrate PTAs below that 90% level as well.
There are limitations with this study that should be noted. The protein binding estimates used within this study are the most conservative and as such, represent the lower end of unbound drug concentrations. To calculate free drug concentrations, a polynomial equation was used [1]. Given the range of concentration within the concentration time profile of this set of obese patients, the average unbound drug was approximately 2.5% that of the total drug concentration. Other literature has suggested the fraction of unbound drug at these concentrations is closer to 5% [11]. If 5% unbound drug was applied to our patient population, this would result in approximately double free ertapenem concentrations and PTAs over 90% for MICs ≤0.5 mcg/mL during a four-hour procedure. Also, detailed information on the length of surgical procedure was not noted, nor was the estimated blood loss or additional fluids administered during the bariatric surgery. These may have had an impact that was not captures on the pharmacokinetics of ertapenem in this population.
Conclusions
These results demonstrate ertapenem may be an appropriate candidate in obese patients undergoing surgeries of three hours or less in those institutions with a majority of isolates being susceptible to ertapenem. Re-dosing of ertapenem in surgeries that are longer in nature may be needed to keep concentrations sufficiently high. The results from this study are conservative utilizing the strictest protein binding estimates published to date.
Footnotes
Acknowledgment
The authors thank Christina Sutherland of the Center for Anti-Infective Research and Development, Hartford Hospital, for the analytical support of this study.
Authors' Contributions
S.T.H. and P.B.M were involved in development of methodology, investigation/project management, analysis, writing–original drafts, revision, editing. P.S.B. and D.P.N were involved in development of methodology, investigation/project management, analysis, writing–original drafts, revision, editing and supervision.
Funding Information
No funding was received in support of this study.
Author Disclosure Statement
S.T.H., P.B.M., and P.S.B. have no competing or personal financial interests to declare. D.P.N. is a consultant, speakers bureau member, or has received research funding from Abbvie, Cepheid, Merck, Paratek, Pfizer, Wockhardt, and Shionogi.