
Abstract
Background:
The aim of this study was to analyze the diagnostic performance of total platelet count (PC), platelet-to-lymphocyte ratio (PLR), and lymphocyte-to-monocyte ratio (LMR) in pediatric acute appendicitis (PAA).
Methods:
We conducted a systematic review of the literature in the main databases of medical bibliography. Two independent reviewers selected the articles and extracted relevant data. Methodological quality was assessed using the QUADAS2 index. A synthesis of the results, a standardization of the metrics, and four random effect meta-analyses were performed.
Results:
Thirteen studies including data from 4,373 participants (2,767 patients with confirmed diagnosis of PAA and 1,606 controls) were included. Five studies compared PC, and the meta-analysis including three of them showed a non-significant mean difference of −34.47 platelets/1 × 109/L (95% confidence interval [CI], −88.10 to 19.16). Seven publications compared PLR and the meta-analysis of those studies showed significant mean differences between patients with PAA and controls (dif: 49.84; 95% CI, 25.82–73.85) as well as between patients with complicated and uncomplicated PAA (dif: 49.42; 95% CI, 25.47–73.37). Four studies compared LMR and the meta-analysis including 3 of them showed a non-significant mean difference of −1.88 (95% CI, −3.86 to 0.10).
Conclusions:
Although existing evidence is heterogeneous and limited, PLR appears to be a promising biomarker for the diagnosis of PAA and for the discrimination between complicated and uncomplicated PAA. Our results do not support the use of PC or LMR as biomarkers in PAA.
Pediatric acute appendicitis (PAA) is one of the most frequent surgical emergencies in the world. 1 Although developments in recent decades have considerably reduced the morbidity and mortality associated with this condition, the persistence of a high rate of diagnostic error, 2 attributable to the absence of high-performance diagnostic tools and clinical overlap with other conditions, such as mesenteric lymphadenitis, entails substantial social, economic, health, and human cost.
Currently, the diagnosis of PAA is based on anamnesis and physical examination, basic laboratory tests (blood count, biochemistry, and coagulation) and abdominal ultrasound. 1 The definition of specific indexes, such as the Alvarado index, and their version for pediatric population (such as the Paediatric Appendicitis Score) contributed to improve the diagnostic performance, but the reality is that they are far from perfect. 3
In recent years, multiple markers have been explored as potential diagnostic tools in PAA. Prominent examples are Pentraxin-3 and Calprotectin.4,5 Similarly, the capacity of certain biomarkers to discriminate between complicated and uncomplicated PAA, which is a distinction of particular clinical relevance, has also been studied. Interleukin-6 has recently demonstrated its validity in this regard. 6 It should be noted, however, that the processing of those molecules has an important economic and time cost which, although making them interesting for research, limits their application in clinical practice. Therefore, many of the current lines of research focused on improving the diagnostic performance using elements that are available in routine clinical practice.
In this context, ratios derived from basic hemogram, such as the neutrophil-to-lymphocyte ratio (NLR) have been studied extensively and showed an acceptable diagnostic performance in PAA. 7 Following this line of research, we aimed to assess the potential role of total platelet count (PC), platelet-to-lymphocyte ratio (PLR) and lymphocyte-to-monocyte ratio (LMR) in the diagnosis of PAA by performing a systematic review and meta-analysis of recent literature. Platelets are known to be an acute phase reactant and therefore thrombocytosis could be, from a biological plausibility point of view, a valid marker of PAA. 7 The same is true for the PLR, which is a ratio derived from platelet count. As for the LMR, it has shown that immune response patterns in PAA are characterized by an elevation of monocytes, especially in complicated PAA. 8
Methods
Literature search and selection
We followed the Preferred Reporting Items for Systematic Reviews and Meta-Analyses (PRISMA) guidance (Supplementary Figures S1). We specifically designed and implemented a review protocol that was registered in the International Prospective Register of Systematic Reviews (PROSPERO ID CRD42022334421). Eligible studies were identified by searching in main existing medical bibliography databases (PubMed, Medline, OVID, Web of Science, Scopus, Cochrane Library). Search terms used for medical subject headings and keywords were: (appendicitis OR appendectomy) AND (pediatric OR children) AND (complicated OR perforated OR gangrenous) AND (platelets OR total platelet count OR lymphocyte-to-monocyte OR LMR OR platelet-to-lymphocyte OR PLR). The search was last executed on 18.09.2022.
Inclusion and exclusion criteria are shown in Supplementary Table S1. The selection of articles was made by J.A.M. and B.P.R. Disagreement was resolved by consensus.
Quality assessment
Methodological quality and the risk of bias of the selected articles was performed with the QUADAS2. In each selected article patient selection, index test, reference standard, and flow and timing were evaluated. Applicability concerns regarding patient selection, index test, and reference standard were also assessed.
Data extract and synthesis
Two independent reviewers (J.A.M. and B.P.R.) extracted the relevant data from the selected articles following a standardized procedure. Extracted data included author, year of publication, country where the study was conducted, study population (sample size, age range, and gender distribution), PAA group and control group definitions, mean and standard deviation (or median and interquartile range) for PC, PLR, and LMR, statistical p value for the between-group comparison, PC, PLR, and LMR cut-off value (if established), and its associated sensitivity and specificity. There were no disagreements between the reviewers after collating the extracted data. The metrics used in each study were reviewed, and it was determined that standardization was not necessary for the analysis.
For the description of the results and subsequent meta-analysis, the selected articles were divided in three groups depending on the biomarker analyzed: PC, PLR, and LMR.
Meta-analysis
Medians and interquartile ranges of PLR were transformed to means and standard deviations following a standard procedure 10 and four random-effects meta-analyses were performed, one for PC (control group vs. PAA), two more for PLR (control group vs. PAA and complicated PAA vs. uncomplicated PAA), and the last for LMR (control group vs. PAA). The results were plotted in four forest plots. Between study heterogeneity was assessed using the τ 2 and I 2 statistics.
Results
The research resulted in 66 articles. Thirty-five duplicates were removed.
Among the remaining 31 articles, we excluded 18 following the inclusion and exclusion criteria. Therefore, this review finally included 13 studies with data from 4,373 participants (2,767 patients with confirmed diagnosis of PAA and 1,606 controls) (Fig. 1).
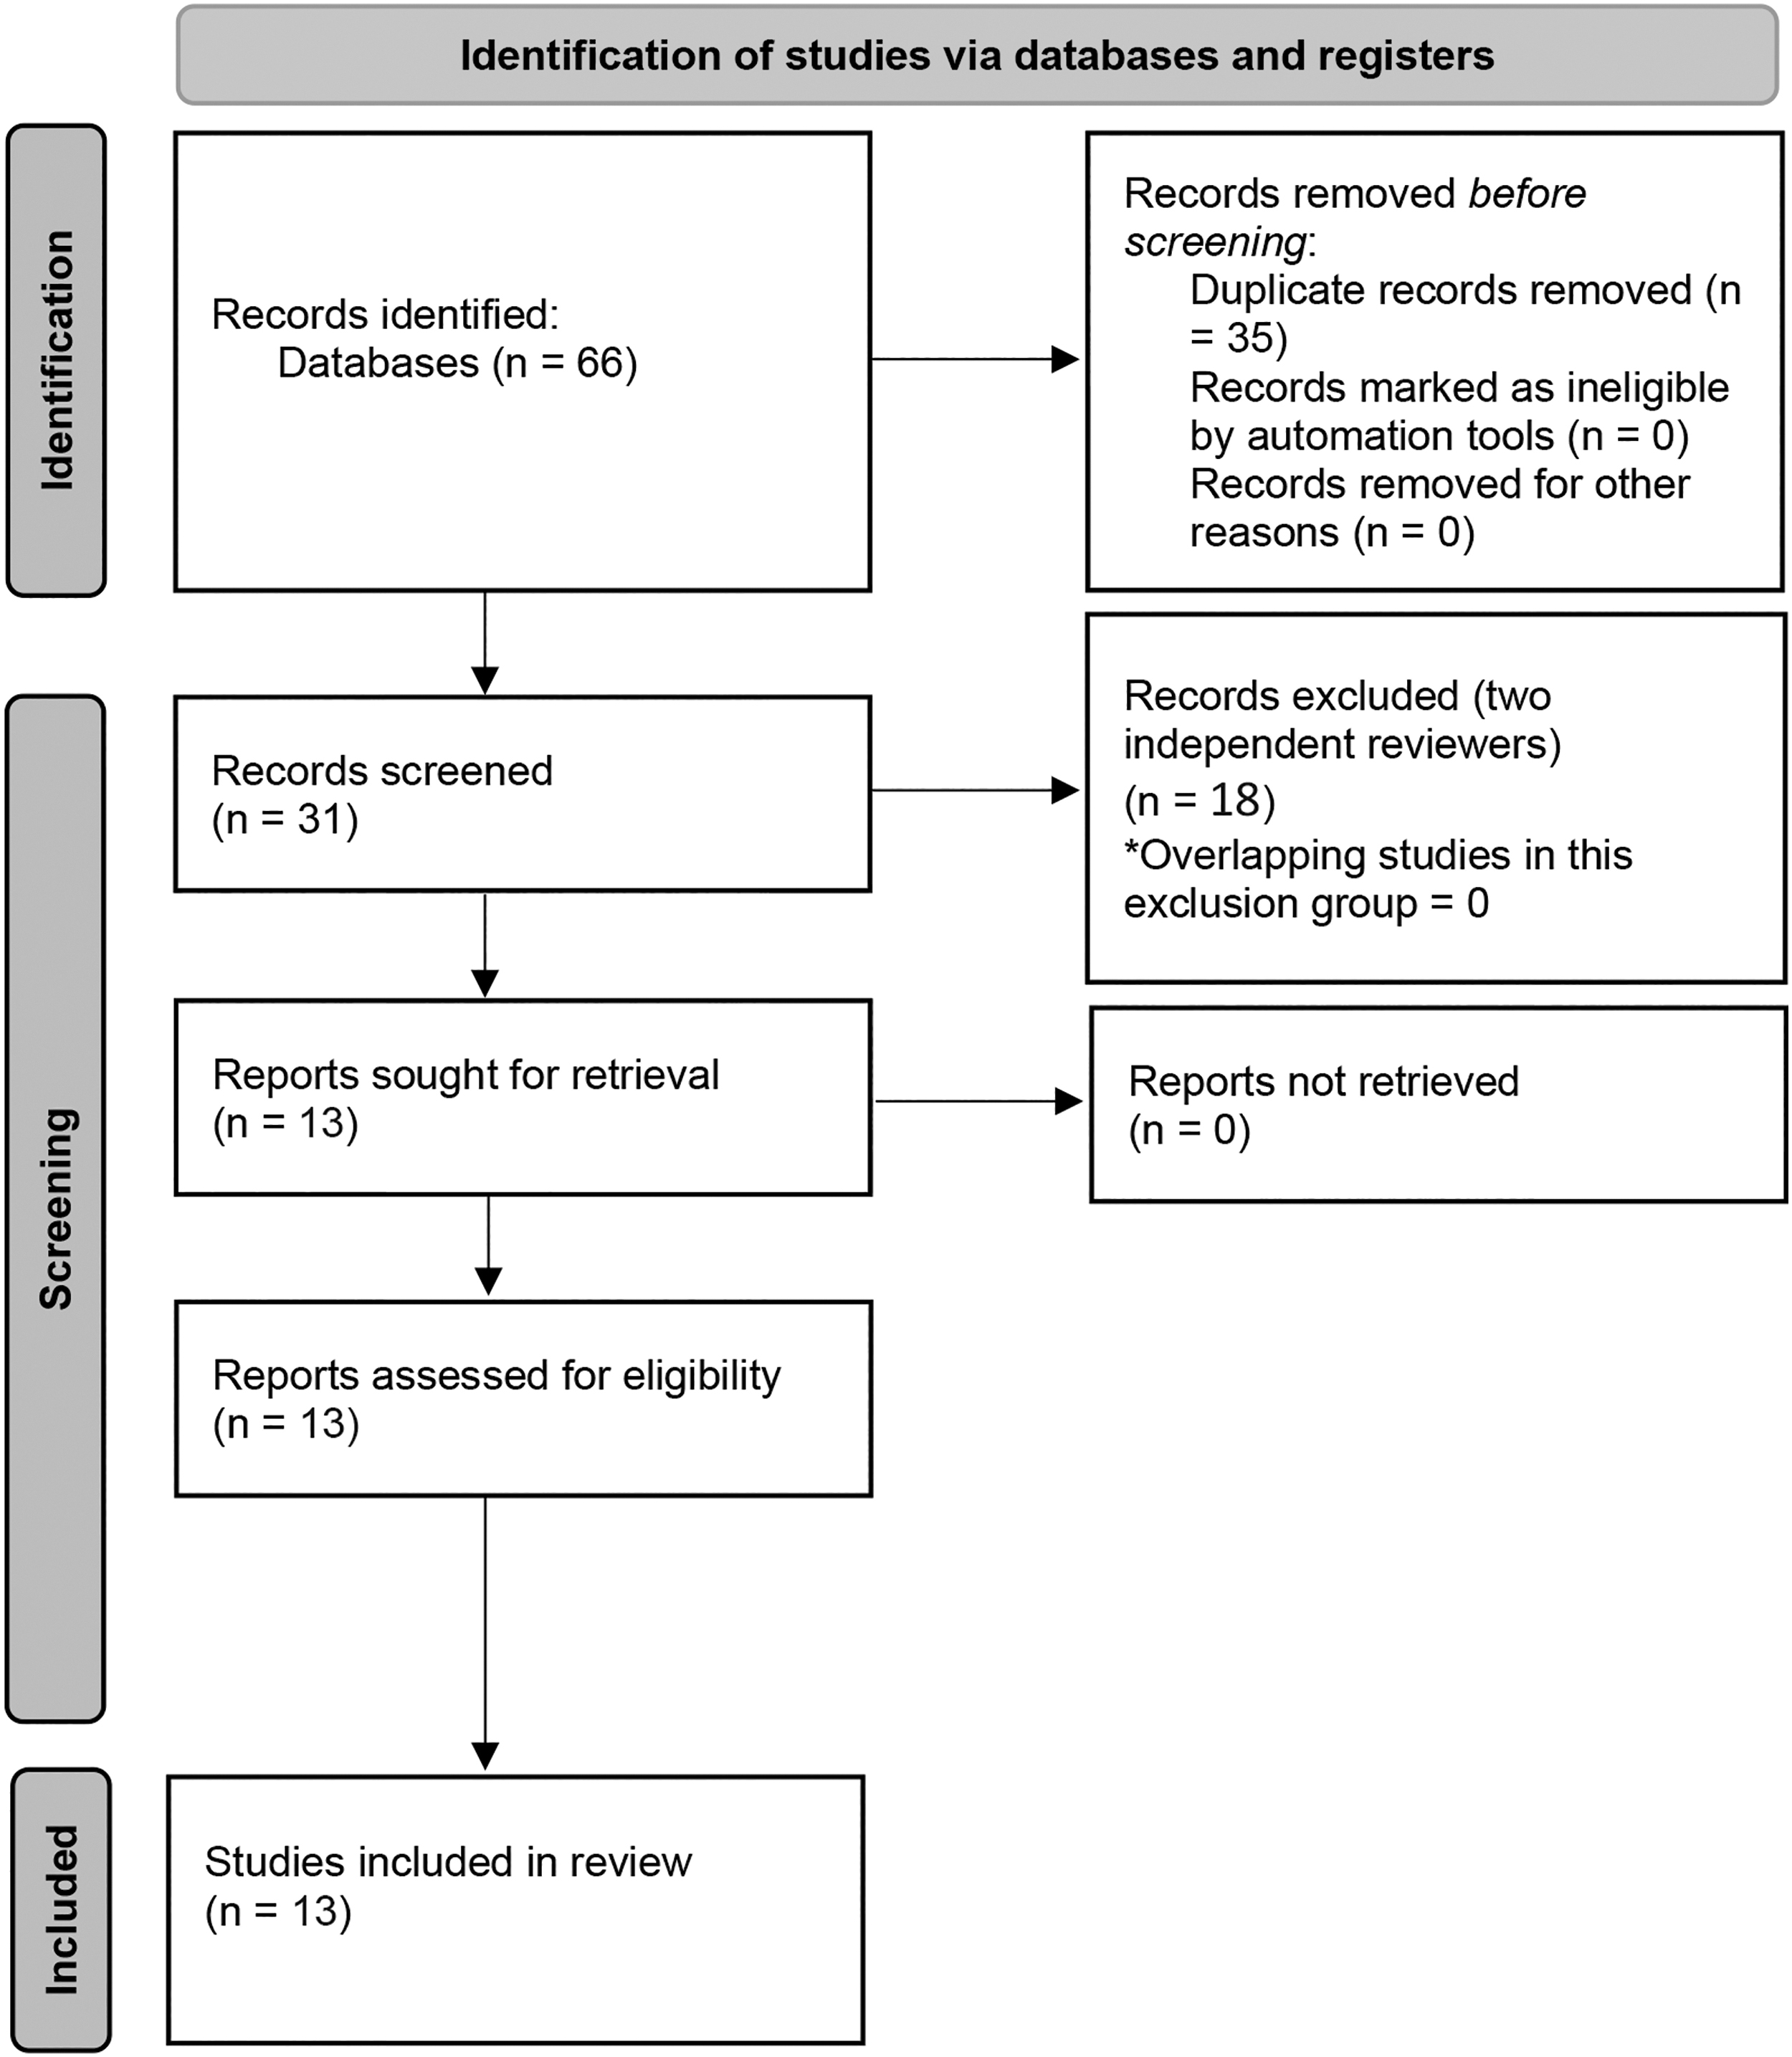
Flowchart of the search and selection process.
Total platelet count
The data extracted from the five studies that compared mean PC levels are summarized in Table 1.9,11–14 All studies were performed between 2011 and 2020. Two were from Turkey,9,14 one from Austria, 11 one from Iran, 12 and one from Malaysia. 13 One study was prospective 11 and the other four were retrospective.9,12–14 All studies only involved a pediatric-aged population between 0 and 18 years old.
Platelet Count Publication Summary Included in the Systematic Review
PC = platelet count; AA = acute appendicitis group; CG = control group; NCAA = non-complicated acute appendicitis; CAA = complicated acute appendicitis.
Mean (standard deviation).
The risk of bias in relation to the selection of patients was considered low in three of the five studies,10,12,14 unclear in one study, 13 and high in another study. 9 The risk of bias in relation to the index test and the risk of bias in relation to the reference standard were considered low in all the studies. The risk of bias in relation to flow and timing was considered low in one study 13 but unclear in the remaining four,9,11,12,14 in which the reference standard was not available in the control group. Regarding applicability concerns, the risk was estimated as low except for patient selection in one study 13 that did not provide sufficient data and therefore was rated as unclear. The results of the QUADAS2 analysis are shown in Figure 2.
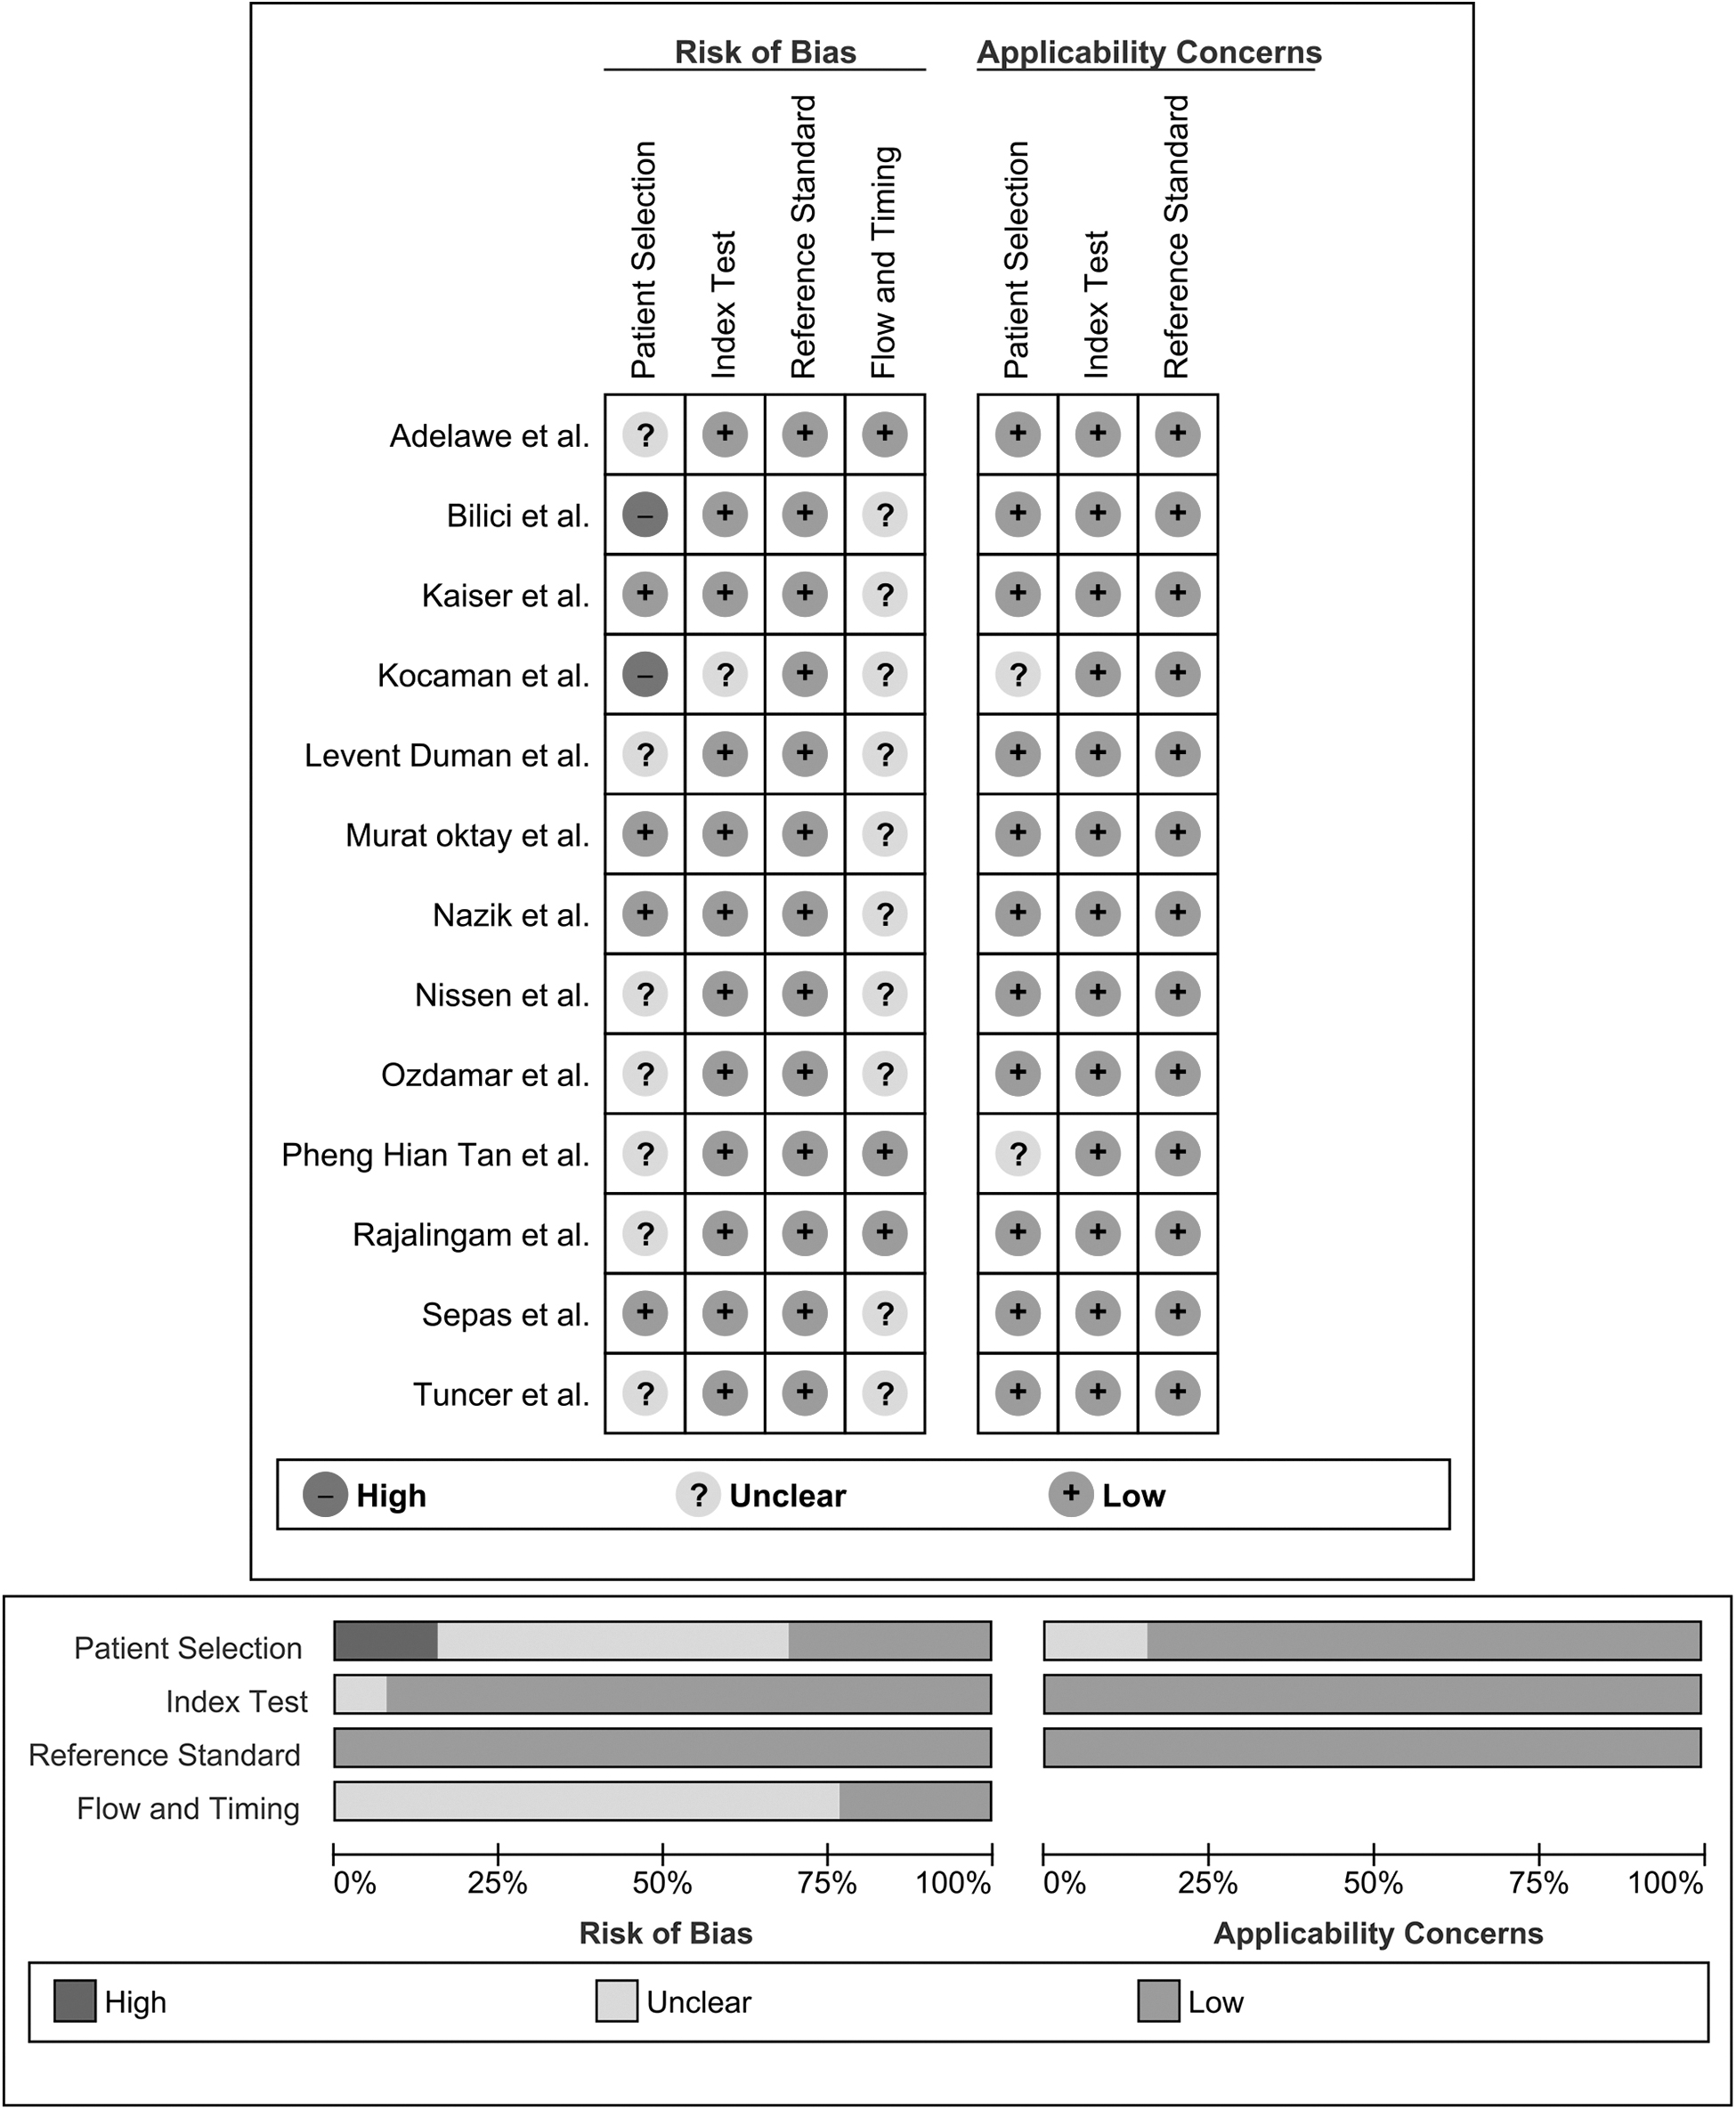
Graphic representation of the quality assessment of the diagnostic accuracy studies included in the review (QUADAS2).
The definition of case as the histopathologic confirmation of appendicitis in the surgical specimen was consistent through the selected studies. This was not the case for the definition of control, which was constituted either by patients with histopathologic-confirmed negative appendectomies,12,14 healthy individuals, 9 or patients with non-specific abdominal pain. 11
All of the studies expressed PC values as number of platelets in 1 × 10⁹/L. The results were presented as mean (standard deviation).[9,11–14] Three of the studies defined a specific cutoff point, that ranged from 221.5 to 328 platelets/1 × 109/L and provided its associated sensitivity (from 15% to 24%) and specificity (from 75% to 80.4%).12–14
Two of the selected studies did not report PC values for the control group.12,13 Among the three studies that did report mean values of PC in both the PAA and the control group,9,11,14 only one reported higher mean levels of PC in the PAA group than in the control group. 9 Three studies presented stratified values of PC according to the histopathological appearance of the appendix (complicated vs. uncomplicated),11,12,14 and although mean PC values were higher in the complicated PAA group, they did not include p values for those contrasts.
The random-effect meta-analysis comprised the three articles that reported mean values of PC in both PAA and control groups.9,11,14 It included 242 cases of PAA and 159 controls (Fig. 3). In the work of Murat Oktay et al., 14 we only included the cases with uncomplicated PAA. The pooled estimate resulted in a non-significant mean difference of −34.47 platelets/1 × 109/L (95% confidence interval [CI], −88.10 to 19.16]. The heterogeneity analysis showed a τ 2 value of 1,960.58 and an I2 value of 88%.
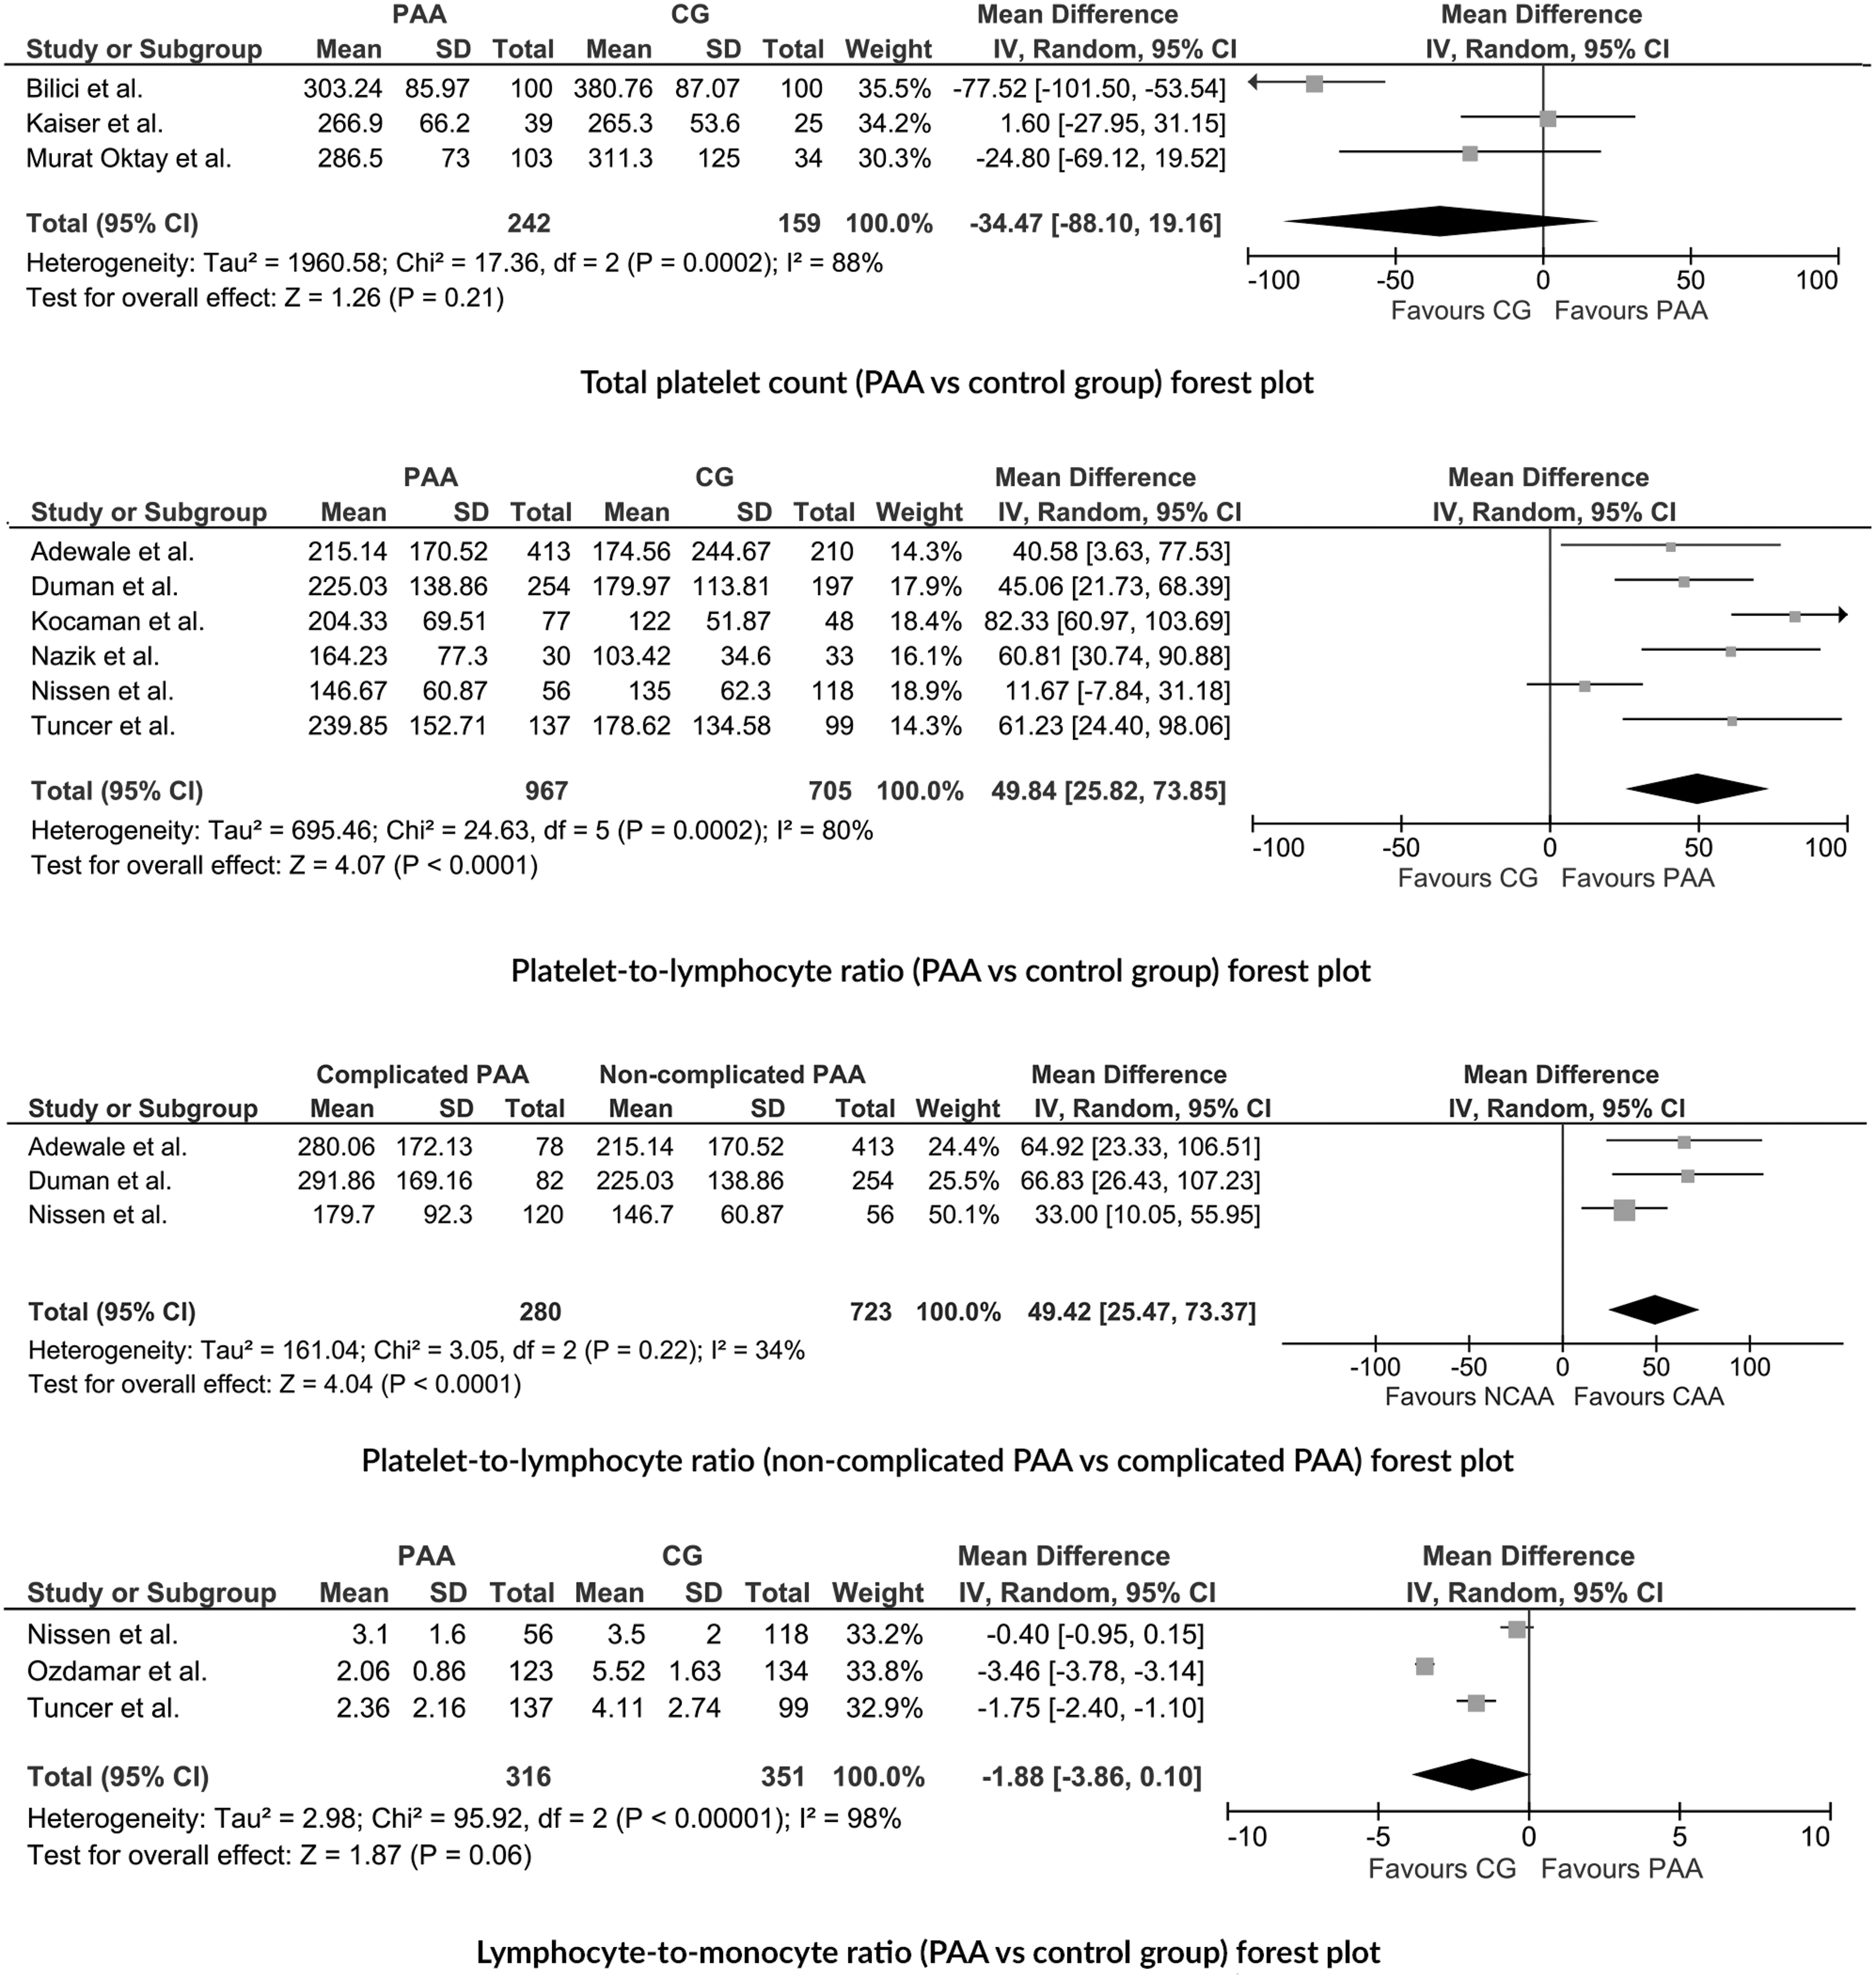
First row: Forest plot of the random-effects meta-analysis performed for total platelet count (PAA group vs. control group). Second row: Forest plot of the random-effects meta-analysis performed for PLR (PAA group vs. control group). Third row: Forest plot of the random-effects meta-analysis performed for PLR (complicated PAA vs. uncomplicated PAA). Fourth row: Forest plot of the random-effects meta-analysis performed for LMR (PAA group vs. control group). PAA = pediatric acute appendicitis; PLR = platelet-to-lymphocyte ratio; LMR = lymphocyte-to-monocyte ratio.
Platelet-to-lymphocyte ratio
The data extracted from the seven studies assessing the PLR are summarized in Table 2.8,15–20 All of the studies were carried out between 2017 and 2022. Of the selected studies, two were from the United Kingdom,19,20 four from Turkey,8,15,16,18 and one from Germany. 17 One study was prospective 15 and six were retrospective.8,16–20 All of the studies exclusively involved a pediatric population between 0 and 18 years of age.
Platelet-to-Lymphocyte Ratio Publication Summary Included in the Systematic Review
PLR = platelet-to-lymphocyte ratio; AA = acute appendicitis; NCAA = non-complicated acute appendicitis; CAA = complicated acute appendicitis; CG = control group; FMF = familial Mediterranean fever; ML = mesenteric lymphadenitis; RUS = right urethral stones; M = male; F = female; NSAP = Non-specific abdominal pain; HC = Healthy controls.
Mean (standard deviation).
Median (interquartile range).
The risk of bias in relation to the selection of patients was considered low in one study, 15 unclear in another five studies,8,16–18,20 and high in the remaining study, 18 in which the control group comprised patients with right ureteral stones. The risk of bias in relation to the index test was considered low in six studies8,15–17,19,20 and unclear in the remaining one. 18 The risk of bias in relation to the reference standard was low in all the selected studies,8,15–20 because histopathologic confirmation of acute appendicitis was performed in all of them. The risk of bias in relation to flow and timing was considered unclear in five studies8,15–18 and low in the other two.19,20 Regarding applicability concerns, the risk was considered low except for one study, in which it was estimated as an unclear, because it did not provide sufficient sociodemographic and clinical data. 18 The results of the QUADAS2 analysis are shown in Figure 2.
The definition of case as the histopathologic confirmation of PAA in the surgical specimen was consistent through the analyzed studies. This was not the same for the definition of control, which comprised patients with non-surgical abdominal pain,8,17 healthy subjects, 15 patients with mesenteric lymphadenitis, 16 familial Mediterranean fever, 16 right ureteral stones, 18 or histologically normal appendix.19,20 Four studies compared cases of complicated PAA versus uncomplicated PAA.8,17,19,20
Six of the studies reported PLR as an absolute adimensional number. Quantitative data were presented as mean (standard deviation)8,15,16,20 or median (interquartile range).17,18 Five of the selected studies8,15,16,19,20 defined a specific cutoff point for the PLR that ranged between 119.64 and 205 and provided its associated sensitivity (from 64% to 86.7%) and specificity (from 40% to 89%).
Six studies found higher levels of PLR in the PAA group compared with the control group (whatever was the definition of control).8,15,16,18–20 In the study that found no differences 17 the PAA group was limited to patients with uncomplicated PAA. 17 Four studies presented stratified values of PLR by the histopathologic appearance of the appendix (complicated vs. non complicated),8,17,19,20 and all of them reported higher levels of PLR in the complicated than in the uncomplicated PAA group.
The median and interquartile range reported by Kocaman et al. 17 and the Nissen et al. 18 were converted to mean and standard deviation following the method proposed by Xiang Wan et al. 10 Calculated mean (standard deviation) was 204.33 (69.51) for the PAA group and 122 (51.87) for the control group in the study by Kocaman et al., 17 and 146.67 (60.87) for the uncomplicated PAA group, 179.66 (92.3) for the complicated PAA group, and 135 (62.30) for the control group in the study by Nissen et al. 18
The random-effect meta-analysis for PLR between PAA and control groups comprised six articles8,15–18,20 that included 967 cases of PAA and 705 controls (Fig. 3). The pooled estimate resulted in a significant mean difference between groups of 49.84 (95% CI, 25.82–73.85]. The heterogeneity analysis showed a τ 2 value of 695.46 and an I2 value of 80%.
The random-effect meta-analysis for PLR between complicated and uncomplicated PAA comprised three articles,8,17,20 which included 280 cases of complicated PAA and 723 cases of uncomplicated PAA (Fig. 3). The pooled estimate resulted in a significant mean difference between groups of 49.42 (95% CI, 25.47–73.37). The heterogeneity analysis showed a τ 2 value of 161.04 and an I2 value of 34%.
Lymphocyte-to-monocyte ratio
The data extracted from the four studies that compared mean levels of LMR are summarized in Table 3. All of the studies were performed between 2019 and 2022.8,16,17,21 Three were from Turkey8,16,21 and one from Germany. 17 All the selected studies were retrospective and involved an exclusively pediatric population aged between 0 and 18 years old.
Lymphocyte-to-Monocyte Ratio Publication Summary Included in the Systematic Review
LMR = lymphocyte-to-monocyte ratio, MLR, monocyte-to-lymphocyte ratio; AA = acute appendicitis; NCAA = non-complicated acute appendicitis; CAA = complicated acute appendicitis; CG = control group; FMF = familial Mediterranean fever; ML = mesenteric lymphadenitis; NSAP = non-specific abdominal pain; HC = healthy controls.
Mean (standard deviation).
These authors used the monocyte-to-lymphocyte ratio instead of the lymphocyte-to-monocyte ratio.
The risk of bias in relation to the selection of patients and the risk of bias in relation to flow and timing were considered unclear in all of the studies.8,16,17,21 On the other hand, the risk of bias in relation to the index test and the risk of bias in relation to the reference standard were considered low in all of them.8,16,17,21 Regarding applicability concerns, the risk was estimated as low in all of the studies.8,17,17,21 The results of the QUADAS2 analysis are shown in Figure 2.
The definition of case as the histopathologic confirmation of appendicitis in the surgical specimen was consistent through the selected studies. This was not the case for the definition of control, which was constituted either by patients with familial Mediterranean fever, 16 mesenteric lymphadenitis,16,21 or non-specifical abdominal pain.8,17
It is noteworthy that while Nissen et al., 17 Tuncer et al., 16 and Özdamar et al. 21 used the lymphocyte-to-monocyte ratio, Duman et al. 8 used the monocyte-to-lymphocyte ratio.
All of the studies reported LMR values as an absolute adimensional number and quantitative data were presented as mean (standard deviation).8,16,17,21 All of the studies defined a specific cutoff point that ranged between 0.478 and 8.9521 and provided its associated sensitivity (from 25% to 89%) and specificity (from 35% to 97%).
Two of the selected studies found higher mean levels of LMR in the control group (whatever was the definition of control) than in the PAA group.16,21 Duman et al., 8 however, reported lower levels in the control group, but additionally, the LMR values reported in that study were outside the range of the rest of studies.
One of the studies provided a single LMR measure for the PAA group but two measures for the control group, which was subdivided in patients with familial Mediterranean fever and patients with mesenteric lymphadenitis. 16 Two studies presented stratified values of LMR by the histopathologic appearance of the appendix (complicated vs. non complicated),8,17 with inconsistent findings probably because Duman et al. 8 compared the control group vs. the PAA group while Nissen et al. 17 compared the control group versus uncomplicated PAA on the one hand and versus complicated PAA on the other hand.
The area under the curve (AUC) ranged between 0.79 and 0.98 for the discrimination between PAA and control and between 0.67 and 0.73 for the discrimination between complicated and uncomplicated PAA. Out of this range, Tuncer et al. 16 found an AUC of 0.26, which indicates that they expected to find higher values of LMR in the PAA group than in the control group and classified as positive (probably case) those above the cutoff point rather than the reverse.
The random-effect meta-analysis comprised three articles (since we decided to exclude the work of Duman et al. for the reasons previously mentioned),16,17,21 and included 316 cases of PAA and 351 controls (Fig. 3). In the work of Tuncer et al., 16 we used as controls the group of patients with mesenteric lymphadenitis, because it fit better with the definition of control in the rest of the studies; in the work of Nissen et al., 17 cases only included patients with uncomplicated PAA, which favors the null hypothesis. The pooled estimate resulted in a non-significant mean difference between groups of −1.88 (95% CI, −3.86 to 0.10). The heterogeneity analysis showed a τ 2 value of 2.98 and an I2 value of 98%.
Discussion
This study included the systematic review of 13 studies and four meta-analyses aimed to determine whether the PC, PLR, and LMR, three parameters that can be calculated from the hemogram, may be useful tools in the differential diagnosis of PAA. Our findings show that only one of the works reported in the literature found differences in PC values between groups, and our meta-analysis, partially limited by the low number of studies and high heterogeneity, found no differences. Based on these findings, we believe that PC is not a potential biomarker for the diagnosis of PAA.
On the other hand, we found that PLR could be a useful biomarker in case of clinical suspicion of PAA. The studies included in this systematic review reported a moderate diagnostic yield (AUC between 0.63 and 0.78) for the discrimination between PAA and controls, and the meta-analysis resulted in a significant mean difference between PAA and control groups. In addition, PLR could be also useful for the diagnosis of complicated PAA, because the reviewed studies reported similar diagnostic yields for the discrimination between complicated and uncomplicated PAA, and the meta-analysis also showed a significant mean difference between groups. Lastly, although most of the studies in this review reported a good discriminatory capacity for LMR, the high heterogeneity between them and the absence of significant differences between groups in the meta-analysis makes it difficult to draw definitive conclusions. The lack of standardization in nomenclature (monocyte-to-lymphocyte ratio, lymphocyte-to-monocyte ratio) should also be considered.
Platelet production increases under physical stress or inflammation, and that new platelets have higher volume, 12 which justifies the existence of lines of research aimed at determining the diagnostic performance of mean platelet volume (MPV) in the context of PAA. On the other hand, lower levels of MPV have been documented in inflammatory bowel disease and has been linked to the sequestration of larger platelets by the inflamed intestine. 22 Following this line of thought, we hypothesized that thrombocytosis, as an acute phase reactant, could be a potential diagnostic tool in PAA.
The present review found only one article reporting statistically significant differences in PC values between groups. 9 The meta-analysis we performed did not result in statistically significant differences between groups. Despite the findings reported by Bilici et al., 9 the meta-analysis does not show PC as a potential diagnostic biomarker in PAA. When we performed stratified analyses to explore potential sources of heterogeneity, that same study 9 was identified as the main source of heterogeneity and we think it could be because of the use of a healthy population as a control group, which may have led to a magnification of the difference in PC mean values between groups. Some authors have proposed the utilization of the MPV/PC ratio, 14 but evidence on its diagnostic performance is still scarce.
The argument for using PLR as a diagnostic biomarker in PAA builds on the pathophysiologic principles outlined above, also taking into account the fact that PAA, because of its inflammatory characteristics and the bacterial infectious component, it is usually accompanied by lymphopenia at expense of an increase in the rest of the hematologic series, especially neutrophils. The results of the two meta-analyses we performed confirm this theory and support PLR as a potential biomarker of PAA. The between-study heterogeneity observed in the meta-analysis performed for PLR (CG vs PAA) was high, probably because of differences in study design and inconsistency in the definition of the control group. As we mentioned in the case of PC, also in the case of PLR, the study that reported a greater difference between groups was the one that used a group of healthy patients as a control group. 18 This, in our opinion, reinforces the importance of using adequately defined and homogeneous control groups, which should ideally be patients with acute abdominal pain and clinical suspicion of PAA. One fact that supports this concept is that we found much considerably less heterogeneity in the meta-analyses restricted to studies comparing PLR between complicated and uncomplicated PAA groups. Although the studies included in this systematic review reported moderate to good AUC values for the PLR, they did not include the data needed to perform a meta-analysis of diagnostic accuracy and, therefore, we were unable to calculate an overall estimator.
Finally, recent studies found that patients with PAA express different immunologic response patterns at a hematologic level, with an upregulation of monocytes in some subgroups. However, the pathophysiologic mechanisms that explain this finding have not yet been elucidated.23,24 This, together with the previously mentioned lymphopenia, justifies the study of LMR as a potential biomarker of PAA.
The result of our meta-analysis resulted in a non-significant mean difference between the PAA and the control groups. It must be acknowledged that the literature on the diagnostic performance of LMR in the context of PAA was scarce and very heterogenenous. Most articles found higher LMR values in the control group, contrary to what occurs with the majority of markers evaluated in the scientific literature. However, Duman et al. 8 found the opposite and reported mean values out of the range of the other studies. We attribute this, as mentioned, to the inverted use of the ratio (monocyte-to-lymphocyte ratio instead of lymphocyte-to-monocyte ratio).
Regarding the cut-off values selected for each biomarker evaluated, we observed that in the case of PC the range was relatively wide (221.5–328), and only three articles reported cutoff values. In the case of LMR, we again found high variability in the reported cutoff points, which ranged from 0.47 to 8.95. However, in the case of PLR, the proposed cutoff points showed some homogeneity, with a relatively narrow range (119.64–154.98) for the distinction between PAA and the control group and for the distinction between complicated and uncomplicated PAA (180.5–205). The existence of a certain homogeneity in relation to the cutoffs reported for PLR is one of the elements that facilitates the clinical implementation of this biomarker, contrary to what occurs in other cases, such as calprotectin, where the ranges and cutoffs reported present extreme variability. 5
In relation to the AUC value reported by Tuncer et al. 16 we believe that they classified as positives those patients with LMR levels below the cutoff point (PAA), obtaining an AUC of 0.26. An AUC below 0.5 indicates that the diagnostic tool should be interpreted specularly. 25 Therefore, if they had classified as positive those patients who had an LMR value above the cutoff point (controls), they would have obtained an AUC of 0.74 (resulting from: 1–0.26), which is more consistent with the results of the rest of the articles and even their own.
An important aspect to comment on is the potential clinical utility of PC, LMR, and PLR. Currently, the reported rates of negative appendectomy are highly variable between centers, but in some cases exceed 10% of patients. 1 Efforts have been made in recent decades to optimize diagnostic yield at the expense of different tools such as novel biomarkers,4–6 but the economic and processing costs associated with their determination are in many cases a major limitation to their implementation in clinical practice, especially in resource-limited centers. In this sense, and in our opinion, the identification of a ratio derived from the basic blood count that contributes to the diagnosis of PAA is a relevant resource because of its simple implementation and low cost. We believe that PLR is a strong candidate to be integrated as a diagnostic element in a score for several reasons. Firstly, because of its low cost, fast processing, and high diagnostic performance. Secondly, because it is one of the few biomarkers that in addition to having a good diagnostic performance in PAA also has a good discriminatory capacity between complicated and uncomplicated PAA. Thirdly, because of its intrinsic characteristics, this ratio may not present the collinearity characteristically present in other analytical parameters evaluated in PAA (e.g., between neutrophils and leukocytes).
Despite our findings, this study has some limitations. The scarcity of published literature, differences in study design and lack of consistency in the definition of the control group may explain the high heterogeneity between studies. This makes it difficult to obtain evidence-based conclusions with clinical applicability. On the other hand, we believe that this study has important strengths, such as the use of a rigorous and solid methodology based on the PRISMA and QUADAS2 guidelines.26,27 Furthermore, the age range and gender distribution of the samples described in this systematic review were reasonably homogeneous and representative of the pediatric population.
Conclusions
In conclusion, our results suggest that PLR could be a promising biomarker of PAA. Our two meta-analyses showed statistically significant mean differences when comparing control versus PAA group and when comparing complicated versus uncomplicated PAA. Despite the lack of data for a diagnostic test accuracy (DTA) meta-analysis, the AUCs reported in the reviewed studies indicate that PLR has a moderate to good discriminatory capacity in the context of PAA. However, it should be noted that the small number of publications regarding PLR diagnostic performance and the high heterogeneity of these publications (partly justified by the variability in the definition of the control groups) limit the evidence in this regard, and therefore these findings should be interpreted with caution. Lastly, our results do not support the use of LMR or PC as diagnostic biomarkers in PAA. Nevertheless, more evidence on LMR is needed to draw definitive conclusions.
Footnotes
Authors' Contributions
Conceptualization and study design: Arredondo Montero. Literature search and selection, data curation and extraction, formal analysis: all authors. Investigation: Arredondo Montero. Methodology: Arredondo Montero, Martín-Calvo Project administration: all authors. Resources: all authors. Validation: all authors. Visualization: all authors. Writing—original draft: Arredondo Montero. Writing—review and editing: all authors.
Acknowledgements
To María Rico-Jiménez, for her excellent help in reviewing this work.
Data Availability
The data used to carry out this systematic review are available upon request from the review authors.
Funding Information
This review did not receive any specific grant from funding agencies in the public, commercial, or not-for-profit sectors. None of the authors have external funding to declare.
Author Disclosure Statement
The authors declare that they have no conflict of interest. This study did not involve the participation of human or animal subjects, and therefore was exempt from formal assessment by the ethics committee for clinical research of our center.
References
Supplementary Material
Please find the following supplemental material available below.
For Open Access articles published under a Creative Commons License, all supplemental material carries the same license as the article it is associated with.
For non-Open Access articles published, all supplemental material carries a non-exclusive license, and permission requests for re-use of supplemental material or any part of supplemental material shall be sent directly to the copyright owner as specified in the copyright notice associated with the article.