
Abstract
Background:
The Georgia Quality Improvement Program (GQIP) surgical collaborative participating hospitals have shown consistently poor performance in the post-operative sepsis category of National Surgical Quality Improvement Program data as compared with national benchmarks. We aimed to compare crude versus risk-adjusted post-operative sepsis rankings to determine high and low performers amongst GQIP hospitals.
Patients and Methods:
The cohort included intra-abdominal general surgery patients across 10 collaborative hospitals from 2015 to 2020. The American College of Surgeons National Surgical Quality Improvement Program (ACS-NSQIP) sepsis definition was used among all hospitals for case abstraction and NSQIP data were utilized to train and validate a multivariable risk-adjustment model with post-operative sepsis as the outcome. This model was used to rank GQIP hospitals by risk-adjusted post-operative sepsis rates. Rankings between crude and risk-adjusted post-operative sepsis rankings were compared ordinally and for changes in tertile.
Results:
The study included 20,314 patients with 595 cases of post-operative sepsis. Crude 30-day post-operative sepsis risk among hospitals ranged from 0.81 to 5.11. When applying the risk-adjustment model which included: age, American Society of Anesthesiology class, case complexity, pre-operative pneumonia/urinary tract infection/surgical site infection, admission status, and wound class, nine of 10 hospitals were re-ranked and four hospitals changed performance tertiles.
Conclusions:
Inter-collaborative risk-adjusted post-operative sepsis rankings are important to present. These metrics benchmark collaborating hospitals, which facilitates best practice exchange from high to low performers.
The Georgia Quality Improvement Program (GQIP) is a multi-hospital regional collaboration of American College of Surgeons National Surgical Quality Improvement Program (ACS-NSQIP) and Trauma Quality Improvement Program (TQIP) participating hospitals established in 2015 that focus on surgical quality improvement projects throughout the state of Georgia. Collaborative post-operative sepsis rates have been consistently elevated above national benchmarks since 2015. Post-operative sepsis is a morbid and costly complication.1,2 It is also associated with a high mortality rate, and the incidence of post-operative sepsis has been increasing for the past two decades.3,4 The average unadjusted cost for surgical patients whose post-operative course is complicated by sepsis is 3.6 times higher than baseline. 1 This led GQIP leaders to focus on reducing post-operative sepsis as a statewide quality initiative.
The GQIP believes there is greater potential for statewide quality improvement when hospitals engage collaboratively.5,6 This collegial environment allows hospitals to rely on the experiences of their peers and to assist in quality improvement at their own institutions. 7 To facilitate best practice dissemination between high and low post-operative sepsis performers we set out to understand how our collaborative hospitals compared regarding post-operative sepsis outcomes for intra-abdominal general surgery procedures. Statewide benchmarking among collaborators promotes best practice exchange, which may be superior to blinded national benchmarking.
The ACS-NSQIP provides risk-adjusted rates of post-operative sepsis for all cases, colorectal surgery, and emergency surgery. We wanted to focus on intra-abdominal general surgery cases, which have a higher clinical association with post-operative sepsis development. How risk adjustment affects hospital rankings for post-operative sepsis is still largely unknown, because most of the literature focuses on mortality. 8 There is also minimal data on risk adjustment using statewide surgical collaborative data. Thus, GQIP aimed to determine statewide hospital post-operative sepsis performance by ranking collaborative hospitals by both crude post-operative sepsis risk and risk-adjusted post-operative sepsis ratios for intra-abdominal general surgery cases.
Patients and Methods
Overview
This retrospective cohort study met criteria for exemption from Institutional Review Board approval at the main institution under 45 CFR 46.104(d)(4), and interhospital data followed GQIP data use agreements. Hospital identities were blinded for analyses, but researchers were aware of hospital identity for quality improvement purposes. This study included intra-abdominal general surgery patients from 10 GQIP hospitals from 2015 to 2020. The ACS-NSQIP case details and custom field reports were aggregated from each center. This data are abstracted at each center by trained surgical clinical reviewers. These methods followed the Transparent Reporting of a multivariable prediction model for Individual Prognosis Or Diagnosis (TRIPOD) checklist for predictive modeling. 9
Study population
Inclusion criteria were adult patients, age ≥18, undergoing open or laparoscopic intra-abdominal general surgery from January 1, 2015 to November 1, 2020. Intra-abdominal general surgery was defined as surgical cases involving the peritoneal and retroperitoneal spaces. Vascular and soft tissue surgeries were excluded. Patients with sepsis or septic shock present at the time of surgery were excluded from analysis. There were five urban and five rural centers included, and two of the centers are fully academic with two hybrid academic/private centers. Missing data were examined and determined to be missing at random, so a complete case analysis was performed.
Outcomes
Post-operative sepsis and septic shock were the outcomes used to calculate crude hospital sepsis risk as well as risk-adjusted sepsis ratios. These outcomes were defined using standard ACS-NSQIP definitions and occurred within 30 days of index surgery. This outcome definition was consistent across all centers. 10
Covariable predictors
Covariables used for prediction and risk-adjustment for the post-operative sepsis model were baseline patient demographics, comorbidities, hospital, and intra-operative variables. Demographics included age, gender, race, and body mass index (BMI) at the time of surgery. Comorbidities included diabetes mellitus, hypertension, dialysis, chronic obstructive pulmonary disease, smoking status, and disseminated cancer. Peri-operative variables included pre-operative infections, emergency case status, American Society of Anesthesiology (ASA) class, surgery type, wound classification, and case complexity. Case complexity was defined as surgery complication rate as validated by the literature. 11 All predictor variables occurred prior to the post-operative care phase.
Statistical analysis
Descriptive statistics were reported as frequencies (percentages) for categorical variables and means ± standard deviations or medians (interquartile ranges) for continuous variables. Data were randomly split into a training set containing 70% of the data, and a validation set containing 30% of the data. A predictive risk-adjustment model for post-operative sepsis was trained and validated. First, using the training set, each covariable was entered separately into a logistic regression model (bivariable logistic regression) with post-operative sepsis as the outcome. Next, all variables from the bivariable analysis were then entered into a multivariable logistic regression model using an automated backward selection technique. Once the final model was trained, it was used on the validation set to assess for overfitting. Model fit parameters such as the Hosmer-Lemeshow test, box plots, calibration plots, and receiver operating curves were assessed. The area under the curve (AUC) analysis was used to quantify the predictive accuracy of the model in predicting sepsis.
Post-operative sepsis risk for each hospital was calculated to rank GQIP hospital using this quality metric. The dataset was stratified by each hospital. Crude post-operative sepsis risk was calculated by dividing the observed post-operative sepsis cases by patients at risk for the outcome. To calculate risk-adjusted post-operative sepsis ratios the prediction model described above was applied to each hospital cohort to calculate expected cases of post-operative sepsis. An observed to expected ratio was then calculated for each hospital to develop risk-adjusted post-operative sepsis ratios.
Each hospital was ranked by both crude and risk-adjusted post-operative sepsis rates. Changes in rankings across quality metrics were documented, displayed graphically, and discussed with each center. SAS 9.4 (SAS Institute, Cary, NC) was used to analyze all statistics. All hypothesis testing was two sided and conducted at a 0.05 level of significance.
Results
The original dataset comprised 58,754 patients, representing 10 hospitals in the state. We excluded 1,204 patients with sepsis present at the time of surgery, and 37,236 patients for non-intra–abdominal general surgery cases. The final study population included 20,314 patients with 595 cases of post-operative sepsis (2.9%) within 30 days of surgery. When performing complete case analysis in the modeling step 95.7% of patients were included and 96.3% of patients with the outcome.
The average patient was 55.3 (41.2–66.9] years old with a BMI of 29.8 ± 7.7. There was a higher proportion of female (53.8%) and caucasian (65.7%) patients in the cohort. The most common comorbidities present were hypertension (44.7%), smoking (18.7%), and diabetes mellitus (15%). Patients tended to be inpatient (55.3%) elective cases (82.8%). The most common surgeries performed were colorectal surgery (30.5%), cholecystectomy (26.7%), and hernia surgery (20.2%). Most cases were ASA class 1 and 2 (47.6%) and were either clean or clean/contaminated in wound class (75.9%).
Patients with post-operative sepsis were older 62.8 (52.5–71.0), had a decreased BMI 28.5 ± 8.5, and had a higher percentage of African American patients (34.7% vs. 28.3%) compared with patients who did not develop sepsis. There was no difference in gender. All comorbidities were significantly higher in the post-operative sepsis group except for smoking status. Pre-operative infections were more common in the post-operative sepsis group, and ASA class was mostly class 3 (60.7%). Cases that resulted in sepsis were also more complex (2.9 ± 0.9 vs. 1.8 ± 1.0), more likely to be inpatient (94.8% vs. 54.1%) and emergency cases (21.8% vs. 17.0%). Dirty wound class was more prevalent in the post-operative sepsis cohort (27.7% vs. 7.1%; Table 1).
Intra-Abdominal General Surgery Patient Demographics, Comorbidities, and Peri-Operative Characteristics from Ten Georgia Quality Improvement Program Hospitals by Post-Operative Sepsis Status, Spanning 2015–2020
Categorical variables presented as n (%).
OR = odds ratio; CI = confidence interval; med = Median; IQR = interquartile range; BMI = body mass index; SD = standard deviation; COPD = chronic obstructive pulmonary disease; Dissem = disseminated; SSI = surgical site infection; UTI = urinary tract infection; ASA = American Society of Anesthesiologists.
Predictors of post-operative sepsis included in the multivariable prediction model were age, case complexity, pre-operative surgical site infection (SSI), pre-operative pneumonia, pre-operative urinary tract infection, inpatient status, ASA class, and wound class (Fig. 1 and Table 2). Hosmer-Lemeshow test p value for the training set was 0.1529 and it was 0.6379 for the validation set. The area under the receiver-operating curves were 0.8395 for the training set and 0.8521 for the validation set.
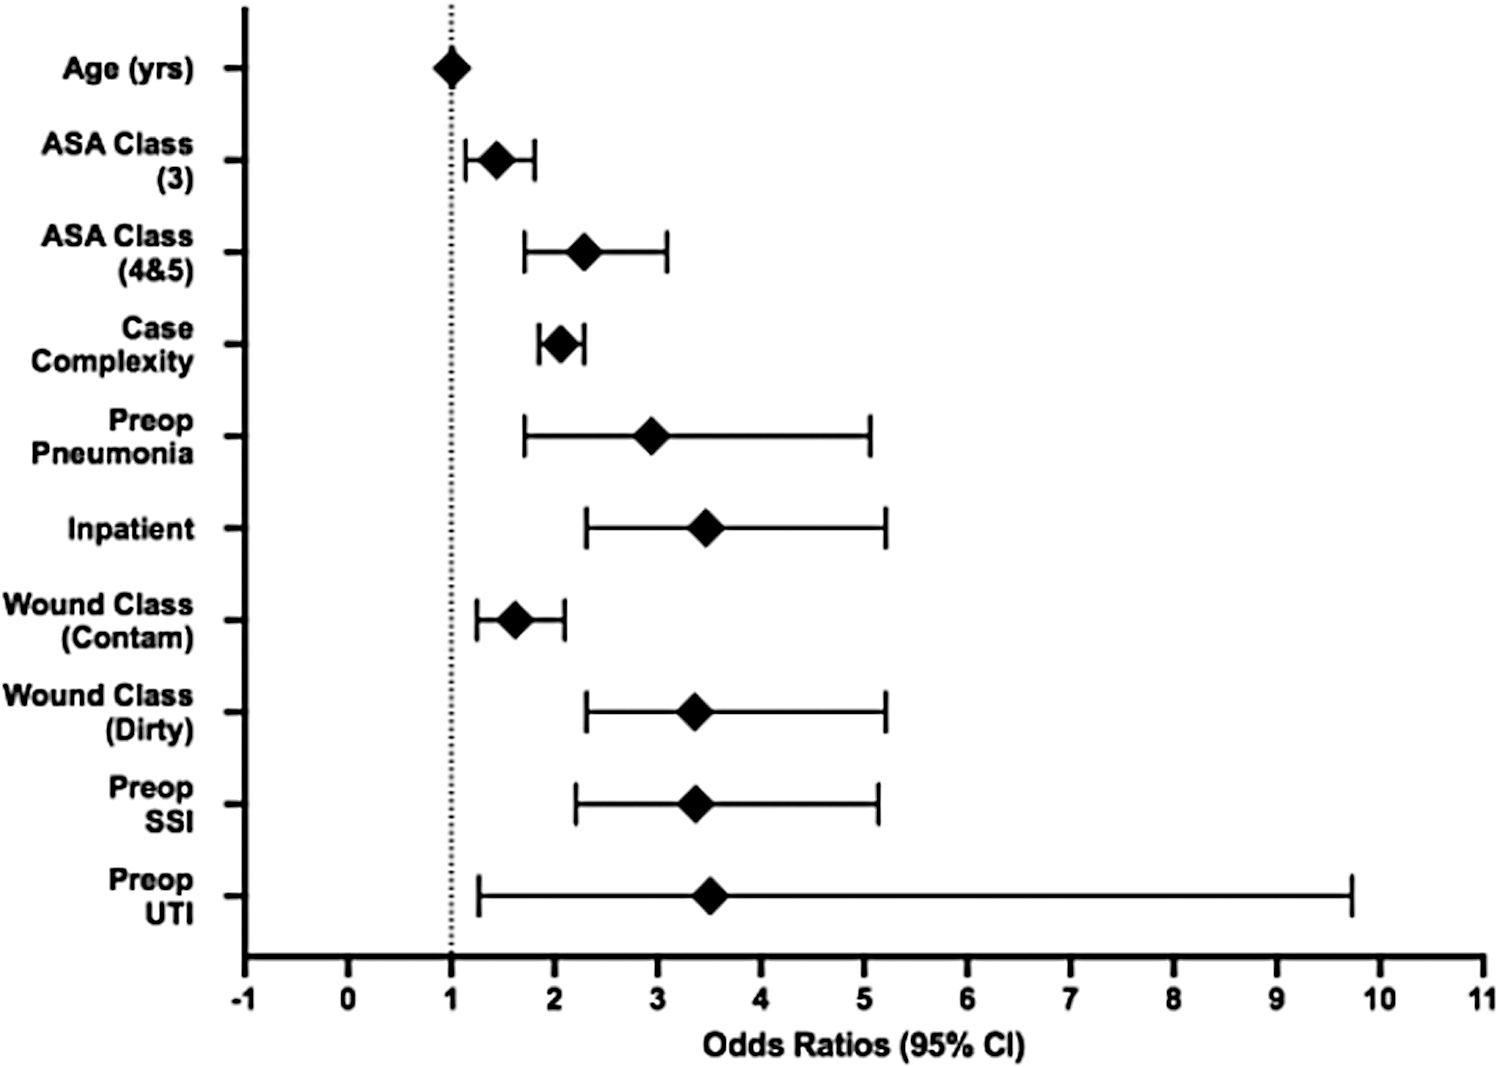
Odds ratio forest plot for post-operative sepsis multivariable prediction model. Forest plot of odds ratios and confidence intervals for each covariable included in the multivariable prediction model for post-operative sepsis. x-axis: odds ratios and 95% CI. y-axis: covariables. Yrs = years; ASA = American Society of Anesthesiologists; Preop = pre-operative; Contam = contaminated; SSI = surgical site infection; UTI = urinary tract infection; CI = confidence interval.
Intra-Abdominal General Surgery Patient Demographics, Comorbidities, and Peri-Operative Characteristics from Ten Georgia Quality Improvement Program Hospitals by Post-Operative Sepsis Status With Bivariable and Multivariable Odds Ratios Modeling Post-Operative Sepsis, 2015–2020
Categorical variables presented as n (%). All dichotomous outcomes without a reference group shown are modeling the odds of post-operative sepsis when the exposure is present vs. when the exposure is not present.
OR = odds ratio; CI = confidence interval; Med = median; IQR = interquartile range; REF = referent group; BMI = body mass index; SD = standard deviation; COPD = chronic obstructive pulmonary disease; Dissem. = disseminated; SSI = surgical site infection; UTI = urinary tract infection; ASA = American Society of Anesthesiologists.
The crude post-operative sepsis risk when stratified by the 10 hospitals ranged from 0.81% to 5.11%. When using the risk-adjustment model post-operative sepsis ratios ranged from 0.46 (0.36, 0.59) to 1.91 (1.47, 2.48). Nine of 10 hospitals were re-ranked after applying the risk-adjustment model (Fig. 2). When grouping rankings into high performers (1–4), average performers (5–7), and low performers (8–10), four hospitals changed groups when adjusting for patient and case-mix factors. This highlights a potential 40% misclassification rate when using crude post-operative sepsis performance metrics (Fig. 2 and Table 3).

Rankings of GQIP hospitals by crude post-operative sepsis risk versus risk-adjusted post-operative sepsis ratios with performance tertiles. The GQIP hospitals ranked by crude post-operative sepsis risk compared with rankings after applying risk-adjustment using patient and case mix factors for post-operative sepsis with corresponding tertile rankings for each quality metric. x-axis: Risk-adjusted post-operative sepsis ratio hospital rankings. y-axis: Crude post-operative sepsis hospital rankings. Avg = average; GQIP = Georgia Quality Improvement Program.
Georgia Quality Improvement Program Hospitals Ranked by Crude Sepsis Risk from 2015–2020, With Risk-Adjusted Sepsis Ratios Displayed and Subsequent Ranking Change
Change in tertile ranking from crude sepsis risk ranking to risk adjusted sepsis ratio ranking among GQIP hospitals; Hospital risk adjustment incorporated: age, case complexity, pre-operative surgical site infection/pneumonia/urinary tract infection, inpatient status, ASA class, and wound classification.
CI = confidence interval; GQIP = Georgia Quality Improvement Program.
Discussion
We used data collected from diverse hospitals throughout the state of Georgia to develop and validate a post-operative sepsis prediction model that showed reasonable predictive power (AUC, 0.8395). All variables included in the model have clinical relevance. Literature on post-operative sepsis prediction is sparse. Risk factors have been studied in specific national patient populations including bariatric surgery, major cancer surgery, appendectomies, spinal tumor surgery, and orthopedic trauma. Consistent predictors included pre-operative transfusion, diabetes mellitus, ASA class >3, and increased operating room time. Our model also included ASA class. These articles attempted to highlight using a prediction model to understand and potentially adjust modifiable risk factors.12–17 It can be difficult to focus quality improvement efforts on modifying patient-specific risk factors. We argue that sepsis performance relies more on hospital factors, specifically post-operative care pathways. This includes things such as infection prevention efforts, sepsis alerts, and sepsis bundles.
Our risk-adjusted model showed re-ranking of nine to 10 hospitals with four hospitals changing tertiles between low, average, and high performance. This highlights the potential importance of using risk-adjustment to level set hospital comparisons in a statewide setting.18,19
Hospital performance metrics and rankings have been increasingly at the forefront because of performance-based reimbursement. These systems potentially disincentivize inter-hospital collaboration and sharing of best practices. We recommend using rankings within a research collaborative setting. This can promote improvement in patients' safety by facilitating the distribution of best practices. Providing reliable statewide hospital quality metrics to the participating institutions is a major goal of GQIP. Unlike standard NSQIP reports, this provides benchmarking among peers who can then discuss management techniques to ensure the best care across our state.
We plan to use this model to perform continued inter-collaborative risk-adjustment rankings for post-operative sepsis performance. Accurate collaborative risk models can be a helpful start to drill down between hospitals on a complication that has been consistently elevated in a surgical collaborative setting. This will assist in defining high and low outliers in our state. We can then highlight differences in the post-operative care pathways between high and low performers to devise an optimal strategy to both prevent and treat post-operative sepsis at the hospital level. We are currently analyzing differences in the post-operative sepsis care pathways across hospitals in Georgia. We also plan to evaluate more in-depth post-operative sepsis quality metrics such as failure to rescue to determine whether complication management quality metrics correlate with the risk-adjusted post-operative sepsis rankings displayed in this study.
The strengths of this study include data accrual via standardized methods using trained surgical clinical reviewers from each hospital across the state. Data were collected from both academic and community centers representing a diverse group in our state and represented a large data set. This study is not without its limitations. We are limited by the imbalance of patients with the outcome versus not having post-operative sepsis. We performed standard logistic regression techniques, so there is no reliability adjustment for statistical noise. Currently, we are limited by no prospective validation on our model.
Conclusions
Post-operative sepsis remains a morbid and expensive complication. Understanding your own sepsis signal as a hospital compared with other statewide collaborators is key to promoting quality improvement culture. Statewide risk-adjusted rankings provide an insight into areas for improvement. These rankings will promote a collegial dialogue between high and low performers on best practices. The GQIP provided a platform to share the sepsis bundles, order sets, education materials, and implementation processes. Coronavirus disease 2019 (COVID-19) presented a unique challenge in educating different health care providers that included but was not limited to nursing staff and residents. These efforts may help decrease preventable post-operative sepsis cases in Georgia.
Footnotes
Acknowledgments
We would like to acknowledge all our partners and collaborators within the Georgia Quality Improvement Program.
Authors' Contributions
Conceptualization (lead): Sharma. Conceptualization (supporting): Codner. Data curation (lead): Codner. Data curation (supporting): Di. Formal analysis (lead): Codner. Formal analysis (supporting): Di. Funding acquisition (lead): Codner. Investigation (lead): Codner. Investigation (supporting): Mlaver, Solomon, Saeed, Shaffer, Dente, Sweeney, Patzer. Methodology (lead): Codner. Methodology (supporting): Saeed. Methodology (equal): Patzer, Sharma. Project administration (lead): Codner. Project administration (supporting): Sharma. Software (lead): Codner. Validation (lead): Codner. Writing (lead): Codner. Writing—review and editing (equal): Mlaver, Solomon, Saeed, Shaffer, Dente, Sweeney, Patzer, Sharma. Supervision (lead): Sharma. Supervision (supporting): Patzer. Resources (lead): Sharma.
Funding Information
This work was supported by the National Institutes of Health (grant numbers TL1TR002382, 2020-2021).
Author Disclosure Statement
The authors of this manuscript have no competing interests, personal financial interests, funding, or employment that creates a conflict of interest for the work submitted.