




Abstract
Background:
The ratio of red blood cell distribution width (RDW) to platelet ratio (RPR) may have prognostic value in several inflammation-related diseases. However, few studies have been conducted on the value of RPR for predicting the severity of pyogenic liver abscess (PLA).
Methods:
Patients receiving the diagnosis of PLA from February 2013 to December 2022 were enrolled in this retrospective study. We collected data related to baseline characteristics and laboratory results within the first 24 hours the of admission. The receiver operating characteristic curve and the area under the curve (AUC) were used to evaluate the predictive ability of different indicators for severity in PLA.
Results:
A total of 278 patients were enrolled. For the prediction of sepsis in PLA, RPR had the highest AUC (0.83; 95% confidence interval [CI], 0.78–0.89) with a sensitivity of 0.78 and specificity of 0.82. For the prediction of septic shock, RPR also had the highest AUC (0.74; 95% CI, 0.60–0.88) with a sensitivity of 0.67 and specificity of 0.79. The best cutoff value for RPR to predict sepsis was 0.08 and to predict septic shock was 0.11.
Conclusions:
An increase in RPR level serves as a useful indicator with a predictive capacity for severity in PLA.
Pyogenic liver abscess (PLA) is an infectious disease caused by a microbial infection with a mortality rate of approximately 2%–31%.1,2 PLA may lead to liver necrosis, septic shock, and other serious consequences. Therefore, effective indicators for predicting PLA severity may allow the rapid detection of PLA sepsis and septic shock.
Red blood cells are the major cellular component of circulating blood, whereas red blood cell distribution width (RDW) reflects the extent of anisocytosis, which may act as a prognostic factor in several diseases. 3 Elevated RDW is associated with an increased risk for morbidity and mortality in many noncommunicable and communicable diseases or conditions.4,5 Decreased platelets predict prognosis in infection-related diseases and a low platelet count is often observed in sepsis. RDW-to-platelet ratio (RPR) is a new marker of inflammation, which is associated with prognosis in several diseases.6,7 RPR was found to predict the severity or prognosis of burns, 8 cancer, 9 acute pancreatitis, 10 and acute kidney injury. 11 However, there is limited evidence on the ability of RPR to predict severity in patients with PLA.
Therefore, this study aimed to explore the association between RPR and severity in patients with PLA and determine whether RPR could be an indicator of the severity of PLA.
Patients and Methods
The Affiliated Dongyang Hospital of Wenzhou Medical University Institutional Review Board approved the protocol, and all participants were provided written informed consent. This retrospective study was conducted from February 2013 to December 2022. PLA was diagnosed when the following criteria were met: (1) at least one of the following symptoms were present: fever, chills, right upper quadrant or epigastric pain, nausea, vomiting, or diarrhea; (2) contrast-enhanced computed tomography and/or magnetic resonance imaging findings were compatible with a liver abscess. The diagnosis of sepsis was applied with the Sepsis-3 definitions: Sepsis is defined as life-threatening organ dysfunction caused by a dysregulated host response to infection; organ dysfunction can be identified as an acute change in total Sequential Organ Failure Assessment score ≥2 points consequent to the infection. 12 Septic shock is identified with a clinical construct of sepsis with persisting hypotension requiring vasopressors to maintain mean arterial pressure ≥65 mm Hg and having a serum lactate level >2 mmol/L (18 mg/dL) despite adequate volume resuscitation. 13 The diagnosis of sepsis and septic shock is limited to the first 24 hours of admission or within 24 hours after the clinical diagnosis of PLA. Patients who met the following criteria were excluded: (1) age <18 years; (2) diagnosis of a parasitic, fungal, or amoebic abscess or an abscess caused by a liver tumor; or (3) treatment in another hospital before admission.
The following information was collected from the patients’ medical records in the electronic data system of our hospital: demographic characteristics (age and gender), vital signs at admission, clinical symptoms, comorbidities, diagnosis, laboratory data, and current medical condition. The laboratory data were collected on the first day of hospital admission or within 24 hours after the clinical diagnosis of PLA.
The inflammatory-related ratios included in this study were RPR, platelet-to-lymphocyte ratio (PLR), and neutrophil-to-lymphocyte ratio (NLR).
Statistical analysis
Statistical analyses were conducted using SPSS software version 26 (SPSS Inc., Chicago, IL, USA). Data were presented as the mean ± standard deviation or median and range. All statistical assessments were two-sided and evaluated at the 0.05 level of significance. Nonparametric variables were analyzed using the Mann-Whitney U test, and categorical-type outcomes were analyzed using the chi-squared test or Fisher exact test. Analysis of variance was performed to assess the trend of mean stratified according to the grade scale. Receiver operating characteristic (ROC) curves were used to evaluate the diagnostic value of the markers.
Results
Baseline characteristics and clinical outcomes
A total of 278 patients were enrolled, with a mean age of 63.45 years. There were 184 males and 94 females. A patient flowchart is shown in Figure 1. Regarding bacterial species, 172 patients (61.8%) had Klebsiella pneumoniae, 10 patients (3.6%) had Escherichia coli, 22 patients (7.9%) had other bacterial species, and in 74 patients (26.6%) the bacterial species was unclear. Sepsis was diagnosed in 100 patients (36.0%). Baseline characteristics and clinical outcomes are listed in Table 1.
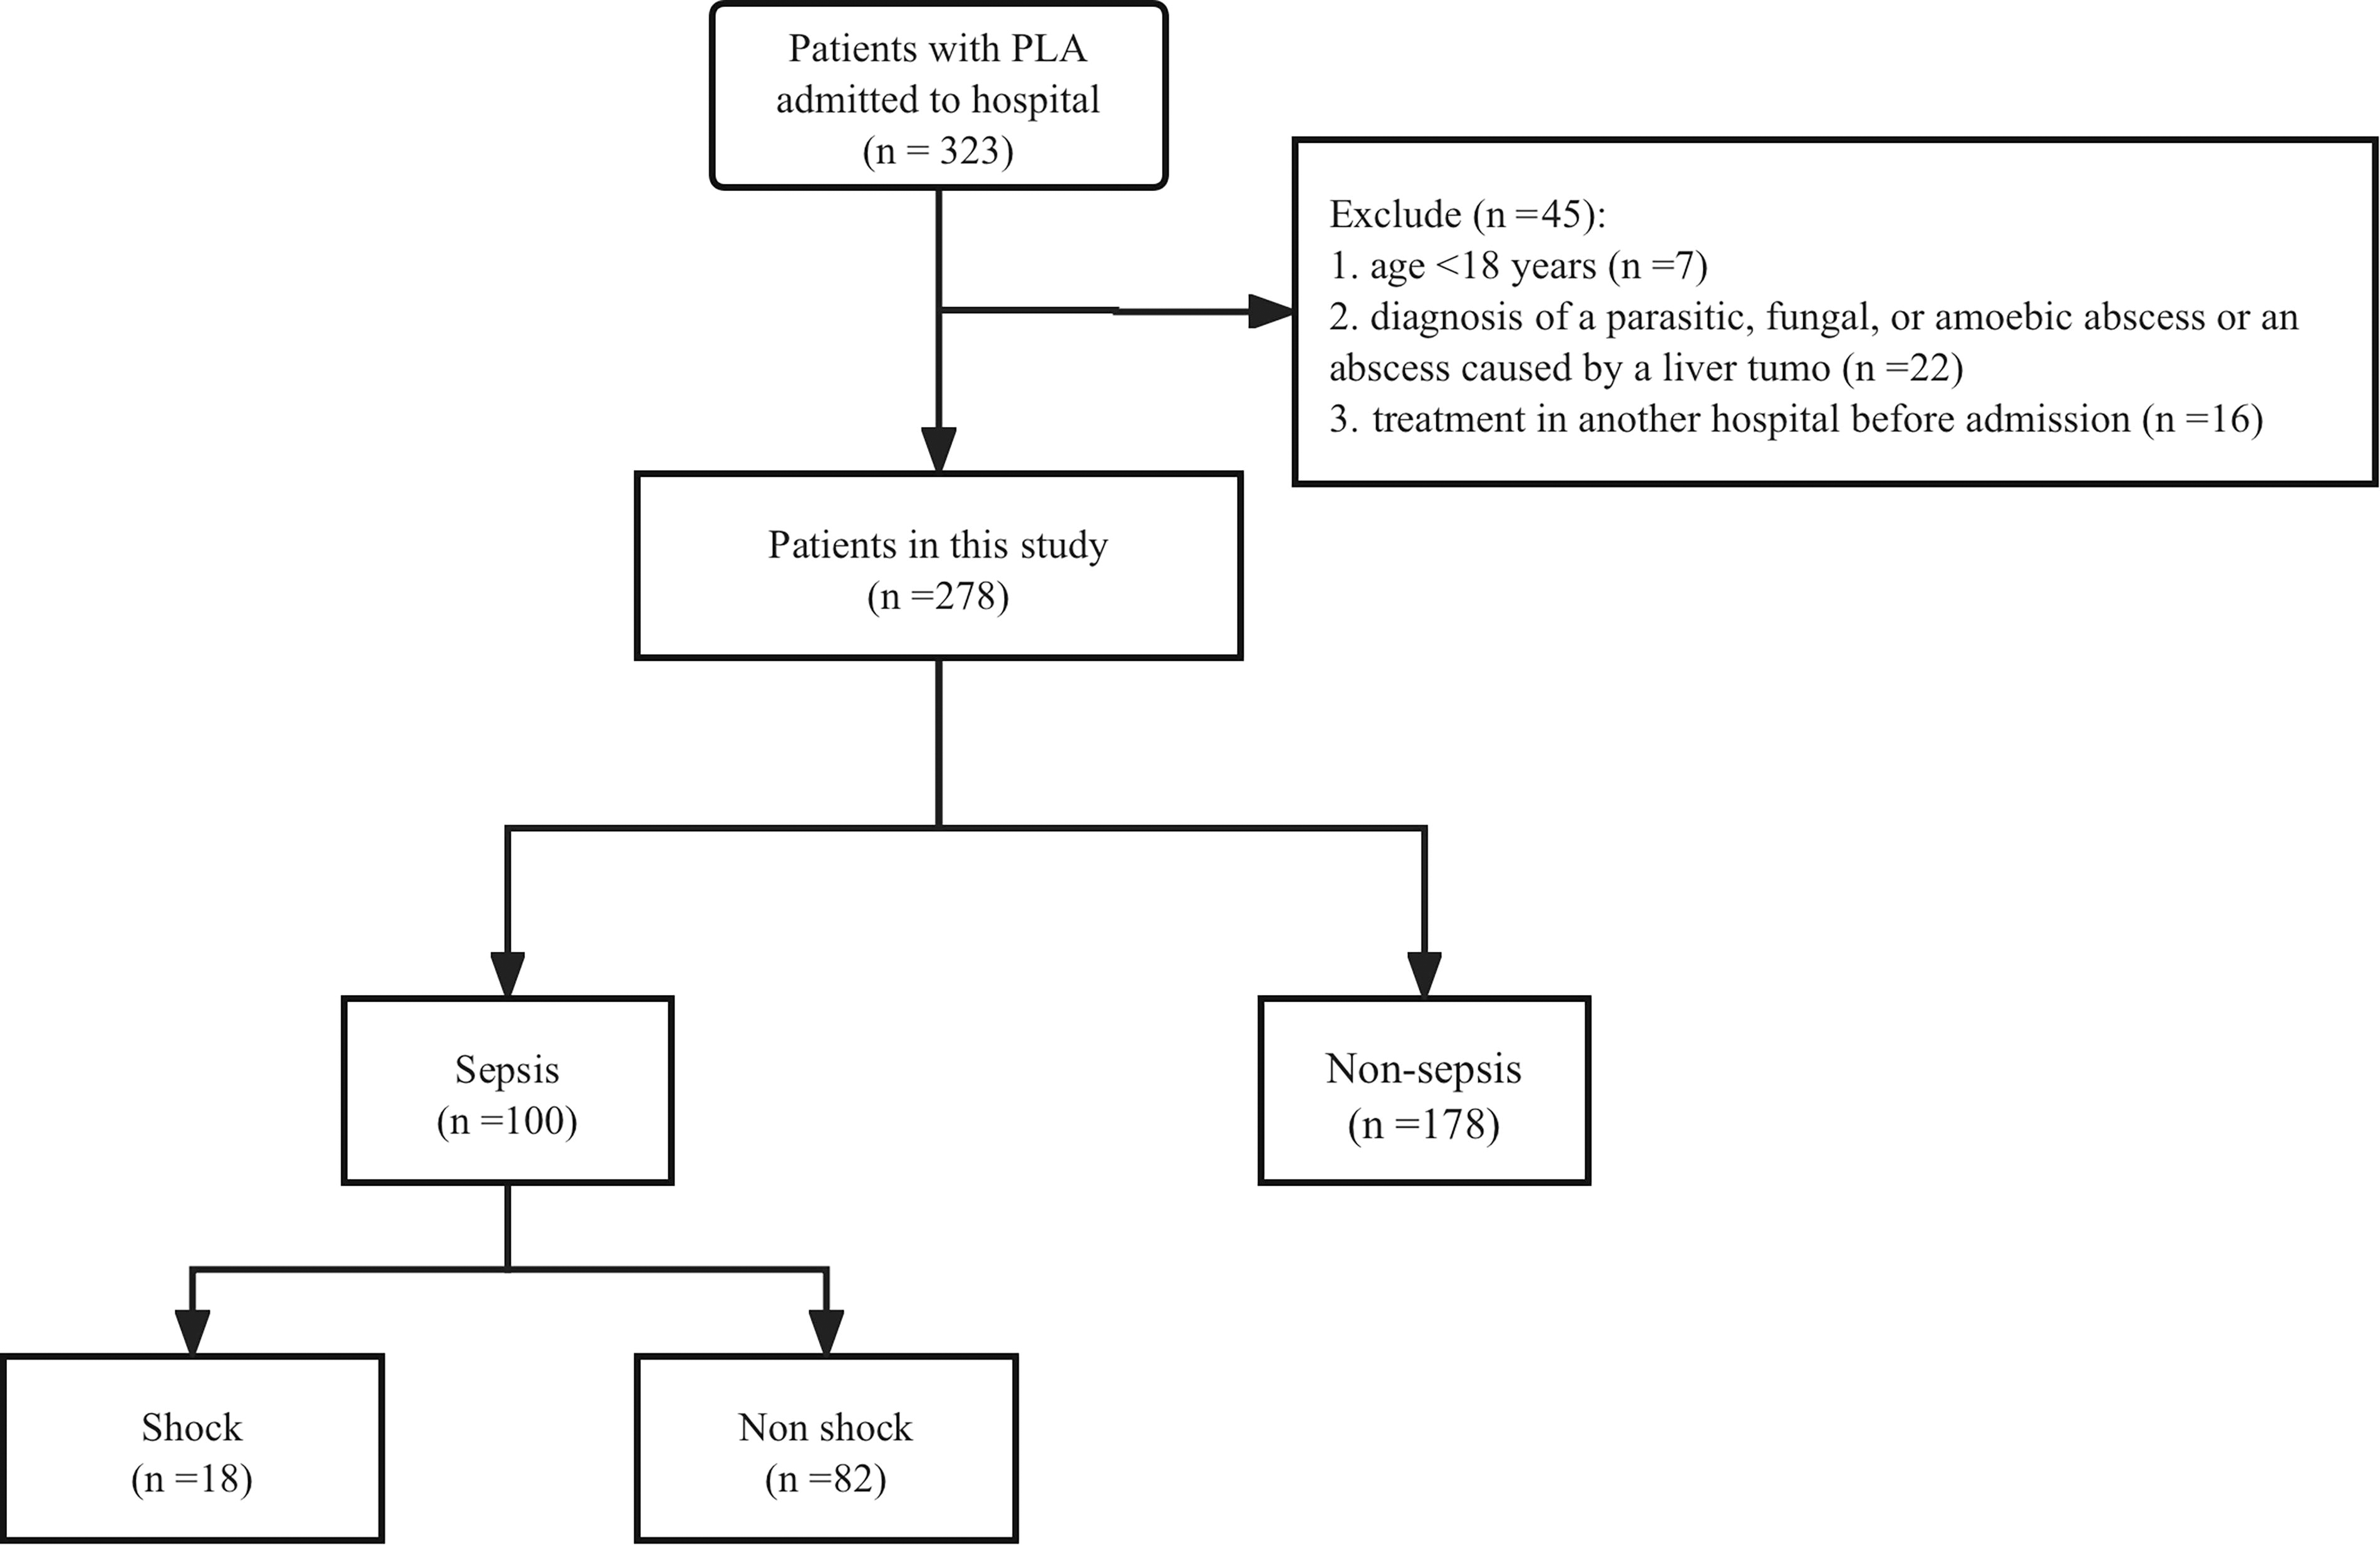
A patient’s flowchart. PLA = pyogenic liver abscess.
The Characteristics of Included Patients
Values are presented as mean (± standard deviation) or number (percentage).
BMI = body mass index; MAP = mean arterial pressure; RDW = red blood cell distribution width.
Patients were separated into two groups based on a diagnosis of sepsis or non-sepsis (Table 2). There was no significant difference between the sepsis and non-sepsis groups regarding the incidence of diabetes mellitus and malignant tumors. There was a significant between-group difference (p < 0.05) in baseline characteristics including age, gender, platelets (PLT), neutrophils, RDW, procalcitonin (PCT), C-reactive protein (CRP), aspartate aminotransferase, alanine transaminase, total bilirubin, direct bilirubin, serum albumin, creatinine, urea nitrogen, total cholesterol, and triglycerides.
Comparison of Baseline Characteristics Between Sepsis and Non-Sepsis
Values are presented as mean (± standard deviation) or number (percentage).
MAP = mean arterial pressure; RDW = red blood cell distribution width.
According to the definition of septic shock, 18 patients had septic shock and 260 patients did not (Table 3). Platelet counts and concentrations of serum albumin and total cholesterol were significantly lower in the septic shock group compared with the non-septic shock group (all p < 0.01). In contrast, neutrophil counts, PCT, and concentrations of CRP and urea nitrogen were significantly greater in the septic shock group compared with the non-septic shock group (all p < 0.01) (Table 3).
Comparison of Baseline Characteristics Between Sepsis Shock and Non-Sepsis Shock
Values are presented as mean (± standard deviation) or number (percentage).
MAP = mean arterial pressure; RDW = red blood cell distribution width.
Predictive value of RPR for sepsis in PLA
The ROC analysis was used to evaluate the predictive value of PCT, CRP, RDW, NLR, PLR, RPR, and PLT for sepsis (Fig. 2a). The analysis showed that RPR had the highest AUC (0.83; 95% confidence interval [CI], 0.78–0.89), with a sensitivity of 0.78 and specificity of 0.82, compared with PCT (0.68; 0.61–0.74), NLR (0.67; 0.61–0.74), CRP (0.63; 0.56–0.7), RDW (0.62; 0.55–0.69), PLR (0.38; 0.31–0.46), and PLT (0.17; 0.12–0.23) (Table 4). The best cutoff value for RPR to predict sepsis was 0.08 (Table 4).

ROC curve for the severity of PLA.
The Predictive Values Several Factors and Ratio in Predicting Sepsis in PLA
AUC = area under the curve; CI = confidence interval; CRP = C-reactive protein; PCT = procalcitonin; RDW = red cell distribution width; NLR = neutrophil-to-lymphocyte ratio; PLR = platelet-to-lymphocyte ratio; RPR = RDW-to-platelet ratio; PLT = platelets.
Predictive value of RPR for septic shock in PLA
The ROC analysis was also used to evaluate the predictive value of PCT, CRP, RDW, NLR, PLR, RPR, and PLT for septic shock (Fig. 2b). The analysis showed that RPR had the highest AUC (0.74; 95% CI, 0.60–0.88) with a sensitivity of 0.67 and specificity of 0.79, compared with NLR (0.72; 0.58–0.86), PCT (0.71; 0.62–0.81), CRP (0.64; 0.55–0.74), RDW (0.47; 0.34–0.61), PLR (0.38, 0.23–0.52), and PLT (0.25; 0.11–0.39) (Table 5). The best cutoff value for RPR to predict septic shock was 0.11 (Table 5).
The Predictive Values Several Factors and Ratio in Predicting Sepsis Shock in PLA
AUC = area under the curve; CI = confidence interval; CRP = C-reactive protein; PCT = procalcitonin; RDW = red cell distribution width; NLR = neutrophil-to-lymphocyte ratio; PLR = platelet-to-lymphocyte ratio; RPR = RDW-to-platelet ratio; PLT = platelets.
Discussion
In this study, we found a significant relationship between increased RPR concentrations and the severity of PLA. Compared with CRP, PCT, RDW, NLR, PLR, and PLT, our study revealed that RPR had the best ability to predict sepsis and septic shock in PLA. The best cutoff value for RPR to predict sepsis was 0.08, and to predict septic shock was 0.11.
Previous evidence has shown that RPR is a useful inflammatory indicator in several illnesses.11,14,15 Recent research showed that elevated RPR is associated with a high risk of short- and long-term mortality in acute ischemic stroke. 16 Another study demonstrated that RPR level is significantly correlated with a high risk of 28-d mortality in patients with sepsis and can predict patient prognosis. 14 However, research on RPR in patients with PLA is lacking. Therefore, we explored the association between RPR and severity in patients with PLA. In the current study, we found that RPR has a good ability to predict the development of sepsis in PLA. Sepsis is a serious clinical condition for patients with PLA, which could lead to impaired organ function. Previous studies showed that RDW may increase in infections because proinflammatory cytokines inhibit erythrocyte maturation, causing an increase in immature erythrocytes circulating in the blood and resulting in greater RDW values. 17 On the contrary, severe inflammatory reactions, especially in infectious diseases, often lead to a decrease in platelets, which may be related to the release of inflammatory factors and bacteria, and various immune cell-related reactions. Thrombocytopenia, one of the most prevalent conditions in sepsis, is a hemorrhagic disease associated with low platelet levels and high mortality.14,18 By combining the prognostic advantages of RDW and PLT, RPR is considered a new indicator reflecting the severity of inflammation. RPR has been increasingly studied as a novel indicator of systemic inflammation in patients with sepsis. Similar studies have demonstrated that elevated RPR was associated with a greater incidence of sepsis. Compared with other biomarkers, RPR has the best capability to predict sepsis and septic shock in patients with PLA.
Thus far, several biomarkers or ratios, such as CRP, PCT, NLR, and PLR, have been applied to predict the severity of several conditions. However, because of poor prediction performance, the application of these indicators is controversial. Previous studies have shown that CRP and PCT may have lower sensitivity and specificity to distinguish sepsis from bacterial infection. 19 Although NLR and PLR have shown a certain ability to predict disease severity, their predictive ability is still controversial compared with RPR.20,21
There were several limitations of this study. First, this was a single-center retrospective study, which could lead to a selection bias. Second, RPR was extracted only at the time of admission, and changes throughout the PLA disease process and the prediction value of prognostic were not considered. Lastly, we did not perform a longer follow-up on patients with PLA to evaluate the risk factors that affected their long-term prognosis.
In summary, this study investigated the potential of routine blood test parameters for predicting the severity of PLA. Our results show that an increased RPR level serves as a useful indicator with a predictive capacity for severity in PLA.
Footnotes
Authors’ Contributions
Y.X.L., H.W., Z.J.Z., and B.W. were involved in study design and the interpretation of the results. All authors had full access to all the data in the study and take responsibility for the integrity of the data and the accuracy of the data analysis. All authors provided direction and comments on the manuscript, made the final decision about where to publish these data, and approved submission to this journal.
Data Availability
The datasets generated and/or analyzed during the current study are not publicly available because of the rules of our hospital but are available from the corresponding author upon reasonable request.
Author Disclosure Statement
The authors declare no competing interests.
Funding Information
This study was supported by