
Abstract
Abstract
Social network analysis makes visible the invisible connections and flows that underlie complex social relationships. Applied organizational researchers have used social network analysis to assess and improve organizational and leadership effectiveness by helping organizations design interventions to overcome siloing, enhance collaboration and productivity, and implement strategic innovations. Some analysts of sustainability in higher education have explicitly called for a similar use of social network analysis to enhance sustainability progress on campuses. Addressing this call and literature gap, this article details the purpose, process, and results of the Mapping Emory's Sustainability Social Network project at Emory University (Atlanta, Georgia). The project had three major components: 1.) researching and creating visual maps of the university's sustainability collaboration networks, 2.) engaging key stakeholders and the wider campus sustainability community in participatory analysis of the results, and 3.) evaluating the effectiveness of this information for community members in deepening their own sustainability thinking and practice. The project demonstrates the power of social network analysis as a critical tool to engage and mobilize staff, faculty, and students in sustainability on campus by supporting evidence-based, strategic decision making among community leaders.
Introduction
Researchers consistently conclude that networks matter. 1 For example, when it comes to humans, mapping social networks has proven important for obtaining vital information, whether about patterns of urban drug use 2 or adoption of agricultural technology. 3 Researchers have also shown that effective networks of all kinds tend to follow similar evolution principles and tend to organize in similar ways. For example, as Valdis Krebs, an established network researcher and management consultant, has pointed out: “people in organizations, routers on the internet, cells in a nervous system, molecules in protein interactions, animals in an ecosystem, and pages on the web are all organized in efficient network structures that have similar properties.” 4 For instance, they tend to be made up of units (nodes) that are similar to each other in some way, but they also need diversity to remain effective. Networks also tend to develop in a similar fashion, becoming more effective as individual units interlink into more cohesive structures, moving from scattered fragments to dense core-periphery structures (Figure 1).

Evolution of effective networks 5 (Reprinted with permission.)
Analyzing a network can help diagnose its structure and assess likely community effectiveness. This article reports on an ongoing participatory project of mapping the sustainability leadership community at Emory University and of using the results to support sustainability action on its campuses. Along with project specifies, including the results of focus groups and an evaluation survey, we provide details of the theory and process of social network analysis to introduce it to firstcomers. (For the complete results of the social network analysis itself, including graphs and metrics for the community and sub-communities, please contact the research team.)
Background
Social Networks in Organizations
In organizations, a large portion of creative and productive work occurs outside formal organizational structures. Rather than always moving top down from bosses and managers to staff, information, communication, and innovation tend to flow through informal social networks. 6 This inherent informal structure often remains hidden from those in charge and this invisibility can lead to two critical organizational shortcomings: 1.) incoming employees often have no way of systematically learning about and connecting into existing “invisible” work; and 2.) top-down initiatives can damage or fail to recognize and support informal networks.7,8 To build truly collaborative organizations, management scholars recommend supplementing traditional operations-improvement methods with the smart use of employee networks.7,8 This can help cut across both functional (across units or departments) and vertical (hierarchical) collaboration barriers.
Social network analysis is the primary theoretical field and methodological tool for studying social networks. 9 Compared to other types of organizational research, social network analysis focuses on relationships as the unit of analysis, while still including valuable information about the positions and roles of individuals and groups. Researchers plot relationship data into network sociograms to illustrate the flows or connections between individuals, groups, and organizations. Several analytic tools—such as Kumu 10 and Gephi 11 —now exist to simplify network analysis and visualization.
Applied organizational researchers use social network analysis to assess organizational and leadership effectiveness and help organizations design interventions to overcome siloing, enhance collaboration and productivity, and implement strategic innovations. 12 As researchers of sustainability in higher education have hypothesized social network analysis of campus sustainability collaboration networks could similarly be used to enhance sustainability programing and progress at universities. 13
Why Map Campus Sustainability Networks?
Collaboration—especially across campus units and research silos—is essential for sustainability progress. Researchers call for greater intra- and inter-university collaboration on sustainability issues because they recognize that while movements start with passionate individuals, they must develop into effective support and community networks in order to reach the tipping point of widespread transformation.14,15 Yet, many institutional, social, and cultural factors can deter sustainability progress and hinder crosscutting collaborative efforts on campuses. Challenges include lack of administrative or community understanding; specific organizational features, such as decentralized management, student turnover, and departmental compartmentalization; and lack of funding, time, and communication.16,17
Mapping a campus's sustainability network can show the composition of the community: who participates, in what numbers, and with whom. It can reveal whether a community is densely and centrally connected, or if it is split into distinct sub-communities with little interconnection. It can also demonstrate the important roles that certain individuals, offices, or groups play in connecting the network as a whole. Once researchers generate network maps and analyze the data, they can consult community members to help generate hypotheses about which institutional, social, or cultural factors support or hinder existing collaborative efforts. This type of reflective network work has been effective at improving practices in various sectors, such as among health practitioners. 18 In turn, network participants could gain information throughout the process that may inspire and equip them to strategically further sustainability action on their campus.
Participatory Network Analysis with Multiple Stakeholder Groups
In theory then, measuring campus sustainability collaboration networks and visualizing the underlying network structures can: 1.) help validate community ideas about factors that inhibit sustainability collaboration, progress, or effectiveness in specific institutions; 2.) highlight the relative importance of certain individuals or groups to the network as a whole (including campus sustainability offices); and 3.) help key stakeholders and community members address structural and social barriers to progress. Projects that engage communities in participatory network analyses have been effective among non-campus groups, including conservation practitioners 19 and farmers, 20 but they have not yet been applied to campus sustainability efforts. To help address this gap in practice and literature, this study extended participatory, applied social network analysis to the sustainability community of Emory University, a mid-sized U.S. higher education institution in Atlanta, Georgia. In particular, this article reports on how the social network analysis project affected community members who were exposed to it, and whether and how it led to further action.
Materials and Methods
During the project's pilot study in the fall of 2014, social network analysis was used to map graduate student involvement in sustainability on the Emory campus. The study was expanded to the entire Emory sustainability network of staff, faculty, and graduate and undergraduate students in the spring of 2015. An “ethnographic sandwich” approach 21 was followed—a method that complements a network survey with community interviews and focus groups both before and after data collection. Surveys carried out before data collection are typically used to gather the names of network members and to get an initial sense of network dynamics; those carried out after data collection are used to generate, in a participatory way, hypotheses that could explain features of the networks, such as dense or siloed structures, and the roles and positions of key groups and individuals.
Initial Interviews
For this study, the network's boundary was delineated to include Emory community members who are actively involved in sustainability on campus. Active involvement was defined to include starting initiatives, running groups, or organizing events. There were 39 initial semi-structured interviews of which six were from the pilot study of the graduate sustainability community in fall 2014. In the interviews and 10 email exchanges, campus sustainability leaders were asked for the names of every individual they considered to be actively involved according to the given definition.
This snowball sampling started with information provided by the Office of Sustainability Initiatives (OSI), which is responsible for the university's sustainability strategy and programming. Because the members of the research team were also actively engaged in sustainability on campus, they were able to provide important feedback during the research process, creating more of an “ethnographic current” than an “ethnographic sandwich.” The interviews were balanced among staff, faculty, and graduate and undergraduate students, and captured Emory's two campuses: the four-year Emory College in Atlanta's Druid Hills neighborhood; and the smaller two-year Oxford College campus, located 45 minutes outside of Atlanta. Oxford College was included in the study since nearly all Oxford graduates continue their courses of study at Emory College, and there are important formal and informal linkages between faculty and staff across the two campuses. Many leaders shared existing lists of participants in sustainability-related groups, committees, and initiatives. Rather than accepting the whole lists, leaders were asked to filter out inactive individuals (i.e., if they had not been active in the groups in the previous year).
In total, a roster of 725 network members was collected from the initial interviews. The research team then conducted extensive searches on Emory's online directory, department websites, and on the professional networking website LinkedIn, gathering as much background information on the network members as possible to minimize survey questions and thus reduce survey fatigue.
Network Survey and Data Analysis
Once name generation was completed, an online survey was developed using Qualtrics. 22 Along with demographic questions, the survey asked participants to indicate which network members they had worked with on a sustainability project or initiative during the previous 12 months. To minimize survey fatigue and inaccuracy of recall (a vulnerability in a large network), 23 a roster of all the people in the network grouped by department and exact position at the university was presented. Three emails were sent over a period of three weeks inviting network members to fill out the survey. A lottery of $10 gift cards (one for every 10 participants) was offered as an incentive.
Social network analysts often conduct initial interviews until each additional interview no longer yields a significant number of new names. 24 Time and resource constraints prevented interviewing until such full saturation. However, in order to mitigate the risk of missing important network members, an additional survey question asked participants to name others who did not appear in the survey roster. After analyzing 300 initial responses, 64 people were added to the roster and then invited to participate. This brought the total network size to 789, 55 percent of whom completed the survey.
Although online surveys tend to produce more mechanical responses from participants than face-to-face interviews, due to time and resource constraints, they are an inevitable choice when dealing with large networks. 25 Online surveys also make it harder to reach higher response rates, and the missing data can significantly impact the results from social network analysis. 26 In the present study, despite capturing a larger network, the results for the graduate student subset were consistent between the pilot and full studies, suggesting that the results for the network as a whole are likely to be trustworthy. In addition, those who completed the survey provided network information about many others who did not fill out the survey, so that the data captured at least some collaborative relationships for 84 percent of the network (N=606).
There are two possible reasons that the other 16 percent were not captured in the data: 1.) the response rate was insufficient for capturing some relationships, and/or 2.) the left-out individuals were peripheral to the network because of low levels of engagement and visibility to others. In addition, it is important to note that the total number of relationships of those who did not fill out the survey is not captured as a result of their non-participation. It should also be pointed out that research participants provided information about others who did not consent to be included in the study. This is one of several ethical challenges involved in social network research. Others include possible breaches of participant privacy and confidentiality. Full ethical consideration of harms and benefits to research participants and full transparency in the research process can help overcome some of the challenges. 27
The research coincided with the creation of the Emory Sustainability Vision and Strategic Plan 2016–2026 developed by a committee of students, faculty, and staff (including the study's principal investigator). 28 To inform the visioning process, survey respondents were asked to name one sustainability goal or action that they would want included in the final Emory vision document. Using Dedoose qualitative analysis software, 29 two coders analyzed 333 responses using the multiple coding method to achieve full inter-rater agreement. 30 Following an initial reading, the first coder developed a codebook of repeating meta-themes and subthemes and coded the responses. The second coder then used the codebook to separately code the same responses. Finally, the two raters compared their code applications and discussed discrepancies until reaching full agreement, changing the codebook accordingly. This process generated 22 main themes, such as waste, climate, energy, food, and water (Figure 2; additional data may be found in the full report.) 31 These results were used to ascertain the degree of connectivity between individuals with similar goals for sustainability at Emory (see the Results section and Figure 5).
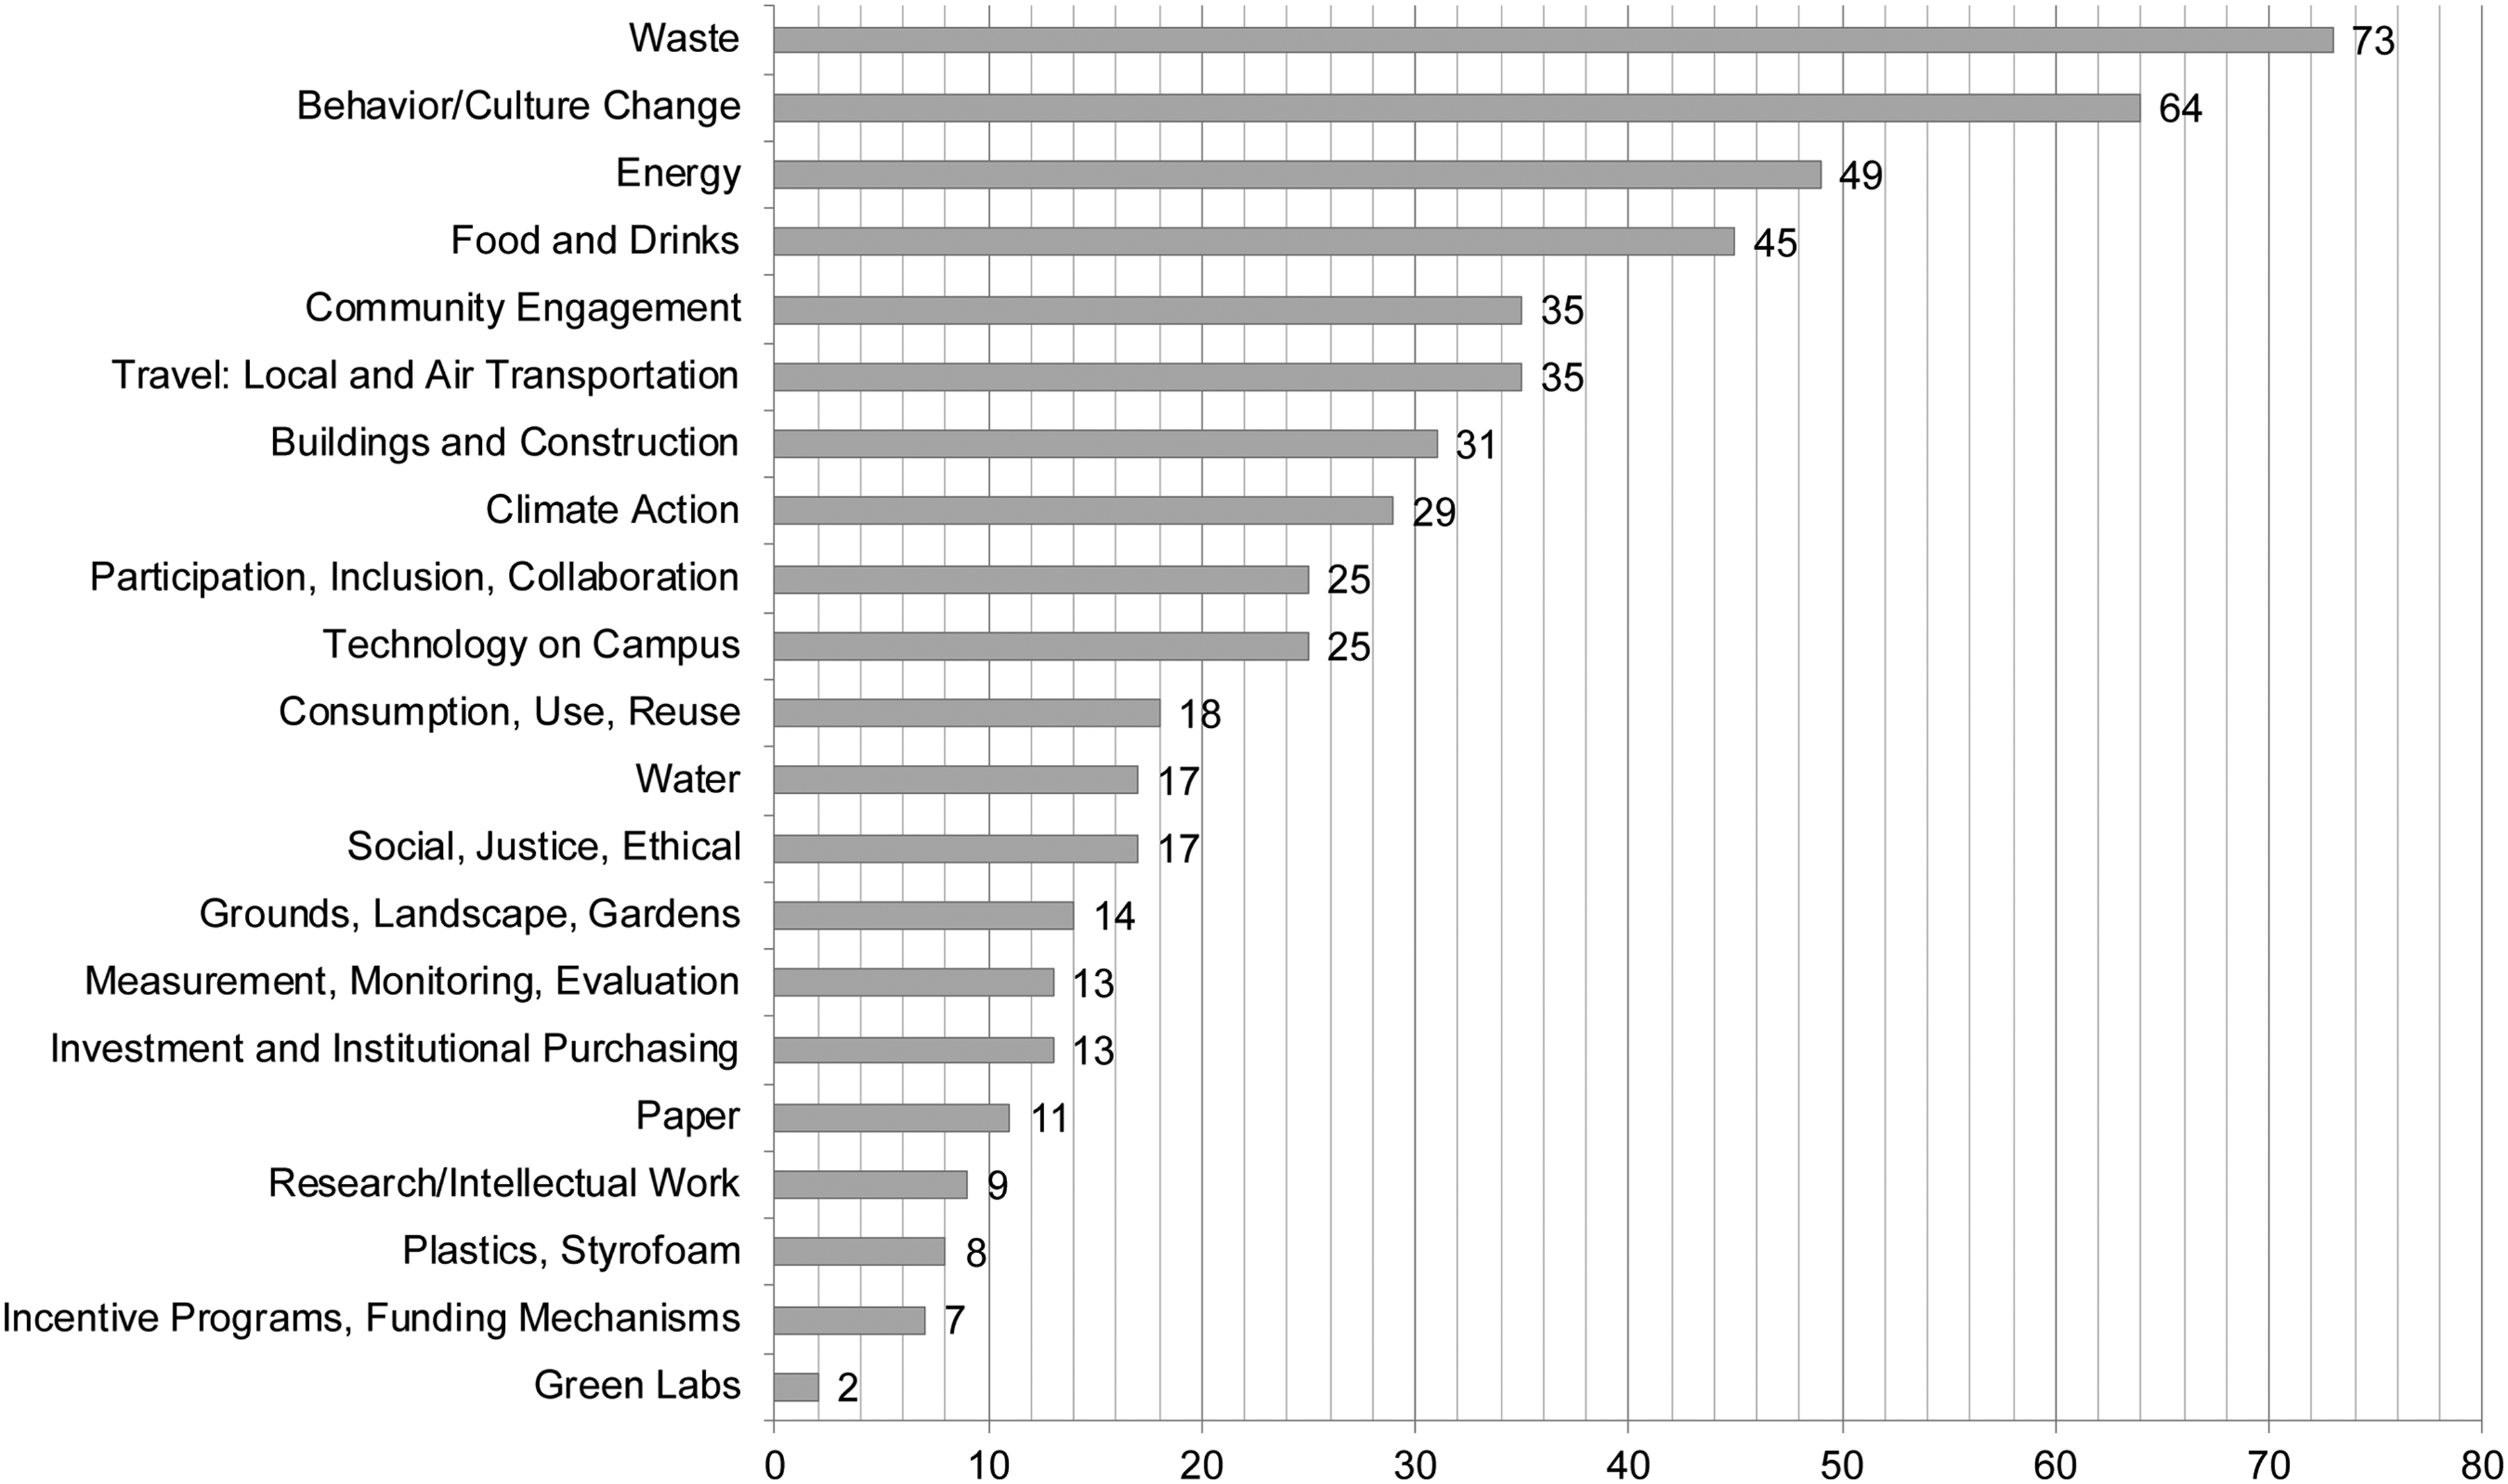
Community-identified priority areas for the future of sustainability at Emory (by theme prevalence)
Participatory Analysis and Community Engagement Sessions
After completing preliminary analyses, three community engagement sessions and two informal meetings were held to share the results with network members, solicit their help in interpreting the findings, and serve as a launch pad for future sustainability work. The sessions lasted approximately one hour and consisted of a presentation of results followed by semi-structured small group discussions (four to 10 people/group). In total, 147 community members participated.
To begin, descriptive network statistics that highlighted information on gender and ethnicity were shared, revealing which groups collaborated most often (i.e., between different schools and faculty, staff, and student sub-communities). One of the most powerful aspects of network analysis is its ability to reveal the key individuals who act as hubs, bridges, or brokers of information, innovation, and collaboration. 32 A presentation of a series of sociograms of networks of the whole community and its sub-groups drove home this point. It included visualizations of: 1.) each of Emory's eight undergraduate, graduate, and professional schools; and 2.) faculty, staff, graduate, and undergraduate sub-communities. These illustrations are particularly useful when working with organizations to design effective network interventions. However, network members must provide consent to reveal their network positions and statistics. Since it is not possible to explain the meaning of these statistics in an online survey to a network of 789 members (especially since 45 percent of the members had not directly participated in the research), to protect the privacy and confidentiality of participants, the presentations centered on revealing overall network structures and statistics rather than naming specific individuals within the networks. However, individual network members were named in subsequent strategy recommendations to the Office of Sustainability Initiatives and different community leaders.
Figure 3 shows the shape of the four communities of faculty, staff, and graduate and undergraduate students. These scatter graphs demonstrate some of the different stages of network evolution (Figure 1): whereas the graduate and undergraduate communities have sparser hub and spoke and multi-hub structures, the faculty and staff communities show denser core-periphery structures.

Structures of Emory collaboration sub-networks of faculty, staff, and students
Each of these graphs was shown alongside graphs that use a community-detection algorithm to identify sub-communities in the data. For instance, Figure 4 shows the graduate student sub-community. The algorithm-defined communities are in the left graph (a); each node (dot that represents an individual) is color-coded based on the community to which it belongs. The graph on the right (b) shows each node color-coded by a sub-group that the researchers and participants identified as important in the graduate student community. The colors correspond with particular schools and/or departments, which are also linked to specific chartered student groups at the university.
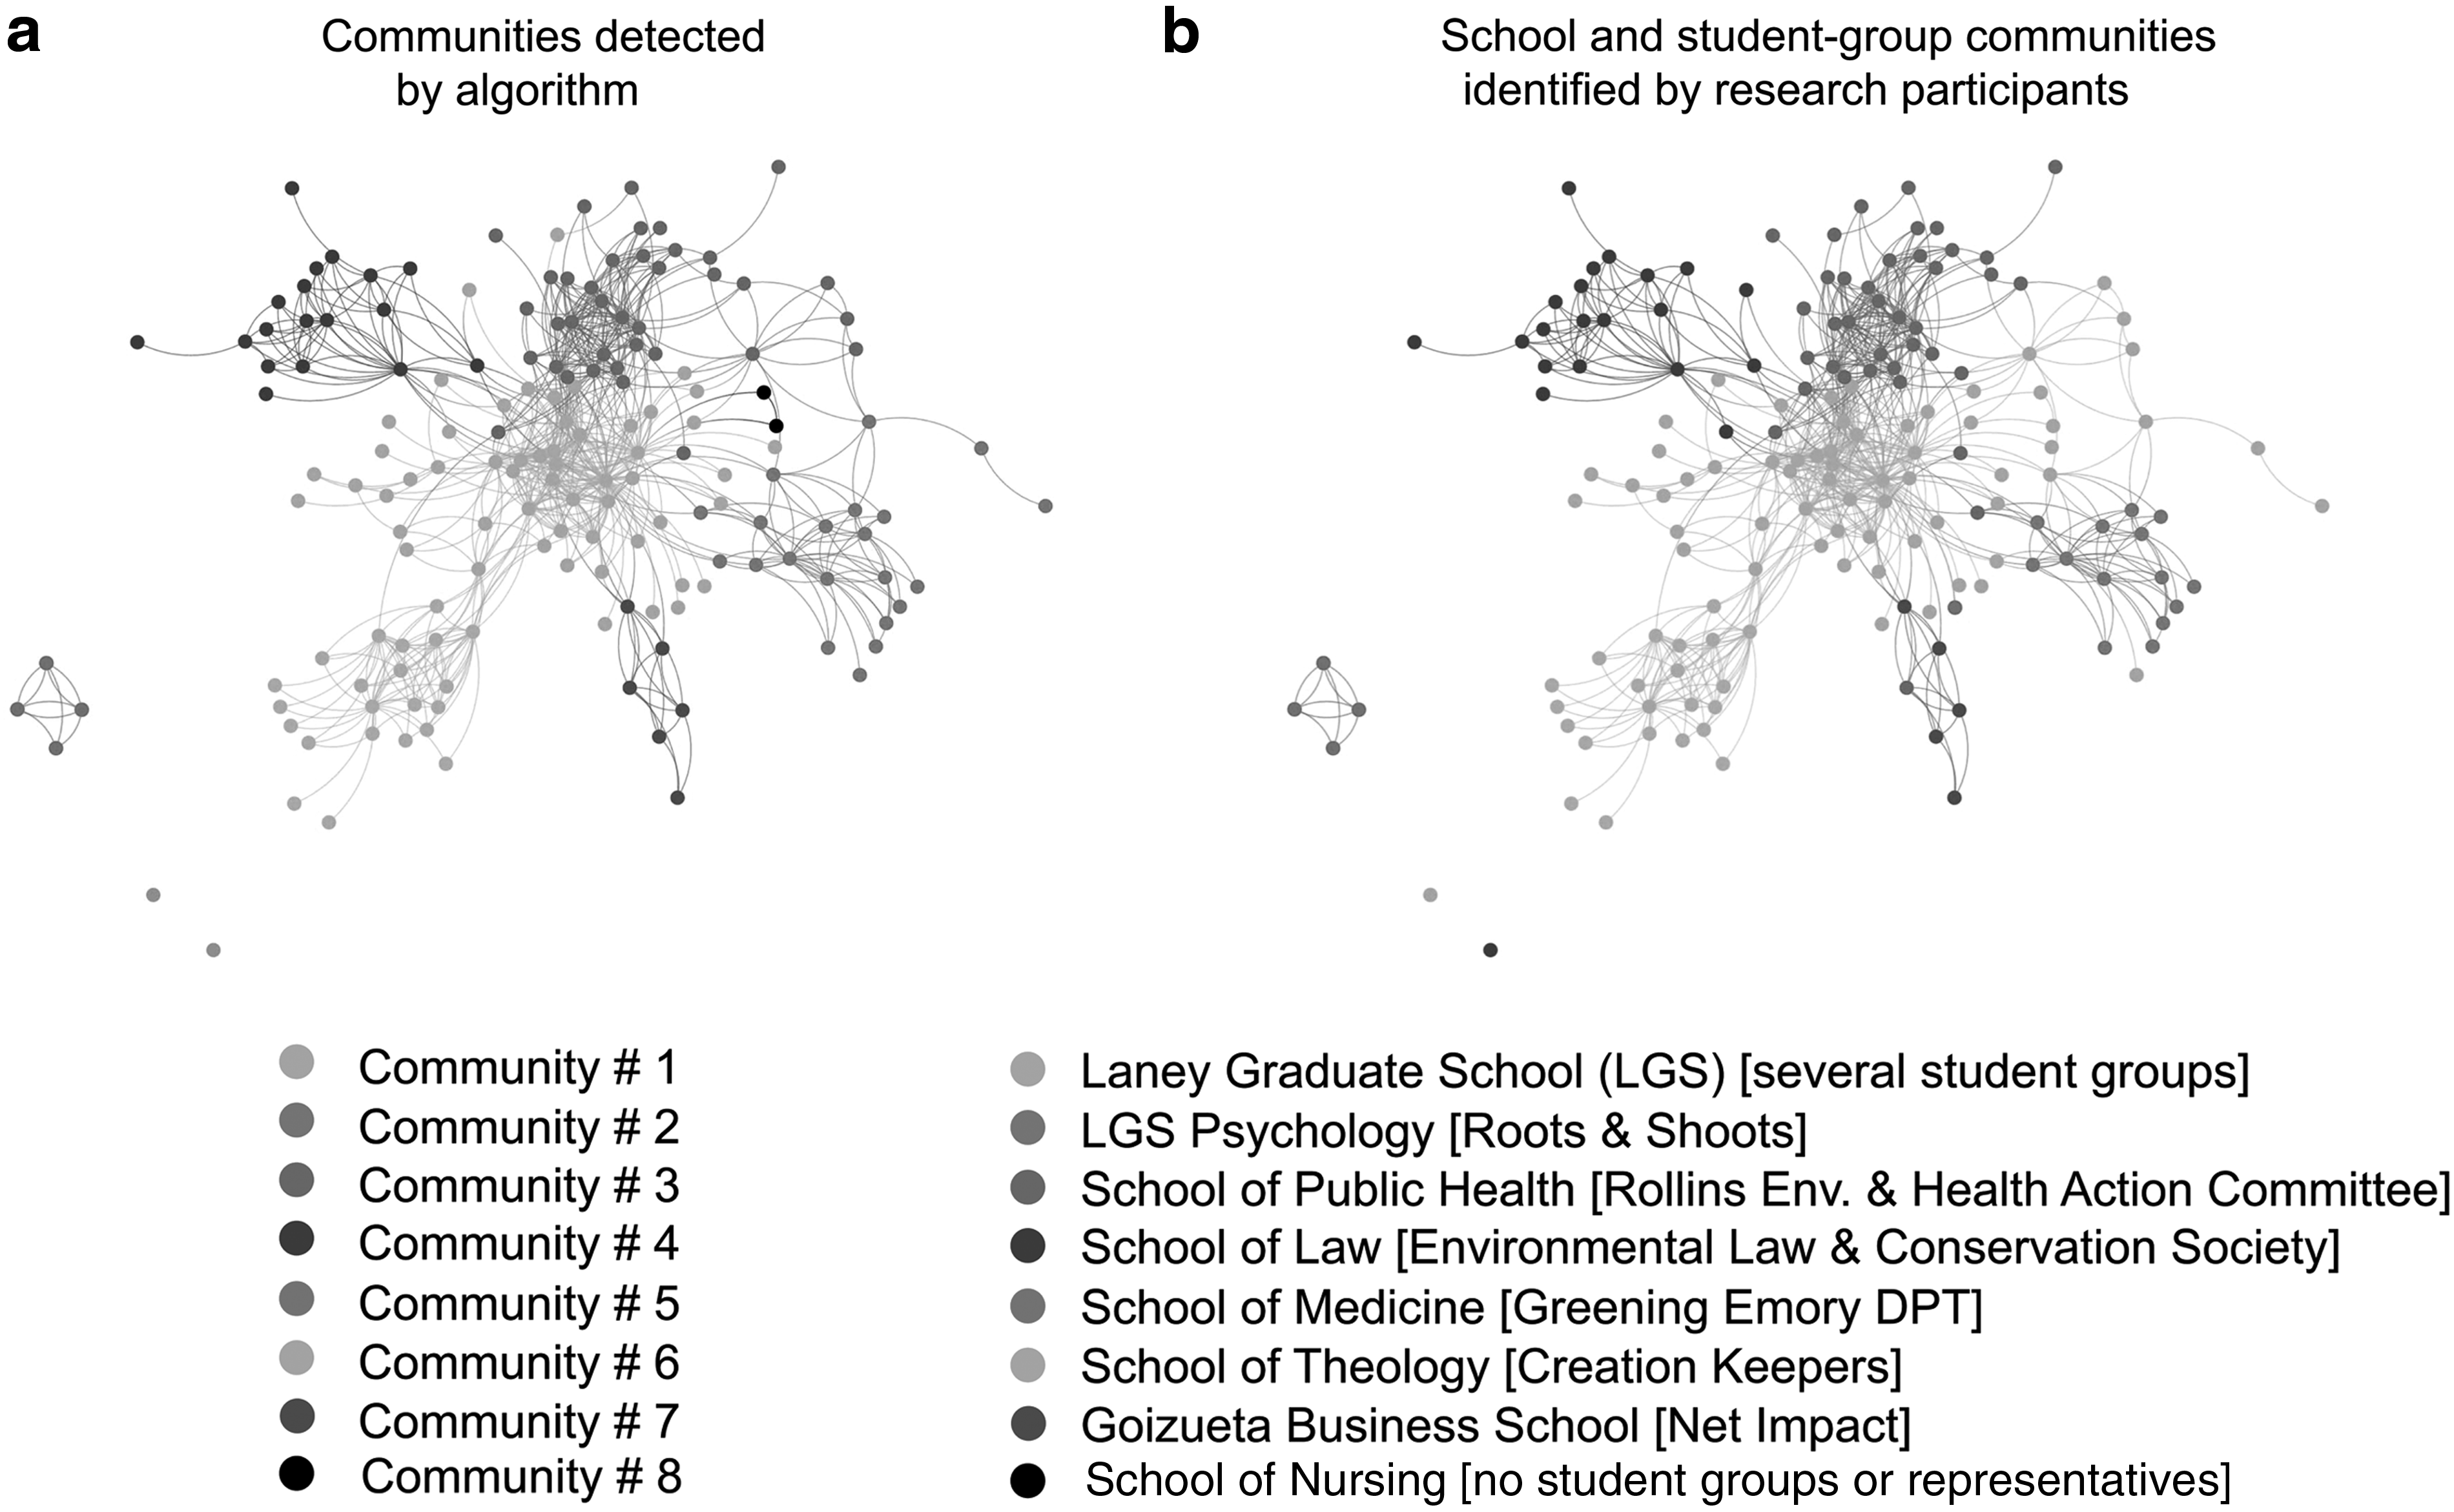
Graduate student sub-communities.
Other graphs showed different degrees of connection between individuals who shared priorities for the Emory Sustainability Vision and Strategic Plan 2016–2026 (Figure 5). These scatter graphs powerfully demonstrate the high potential for new collaboration among individuals who share a priority area for sustainability at Emory but who had not collaborated on sustainability work during the previous year.
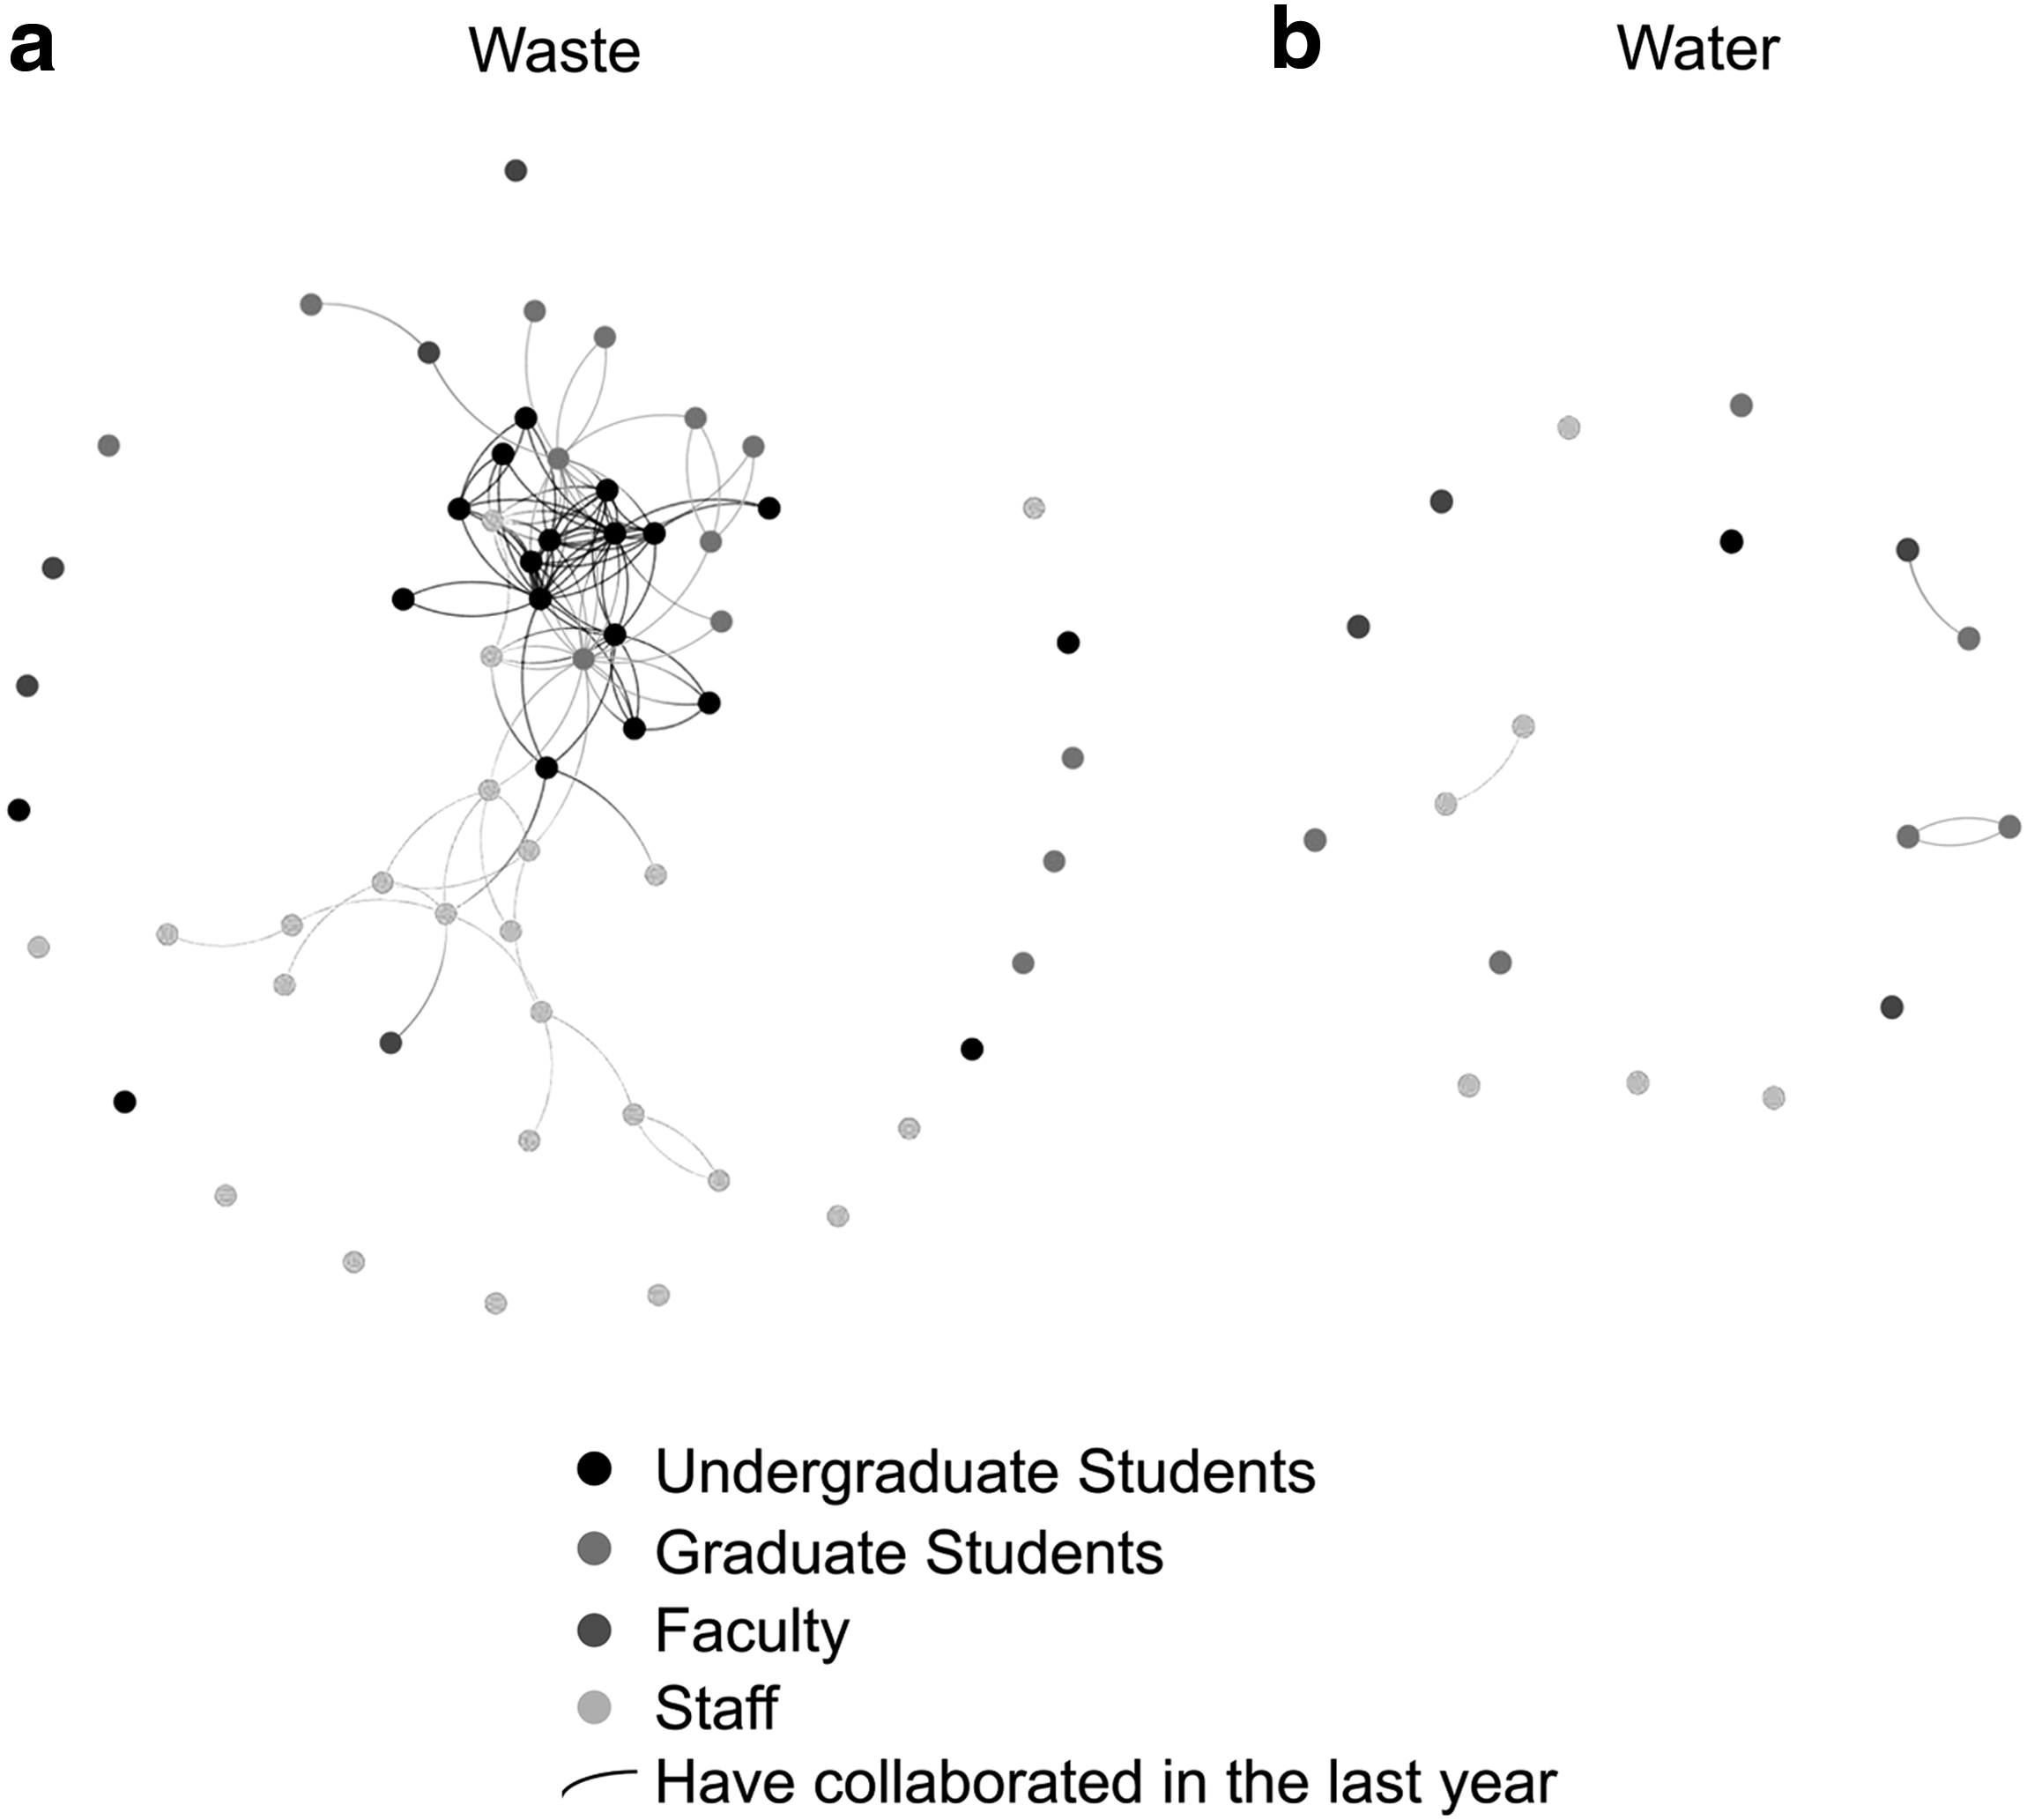
Degree of collaboration between individuals with waste and water as vision priorities.
Other scatter maps removed the Office of Sustainability Initiatives (OSI's) personnel (three full-time and two part-time staff) and their connections from the analysis in order to ascertain their role in the network. (These will be featured in a future publication.)
At the end of the presentation, participants were given a brief demonstration of how to use the Emory Sustainability Ecosystem, a publicly available, interactive, online map of Emory's sustainability initiatives and their leaders. The Emory Sustainability Ecosystem map was developed by the authors using the Kumu visualization platform. The map is updated each academic year and can be viewed on the Emory Graduate Sustainability Group (GSG) website. 33 To continue engaging the community, the research team printed 4′×4′ vinyl posters of a static version of the map that was displayed throughout spring 2015 in two university libraries, at sustainability-related meetings, at a conference, and during the Emory Earth Month Festival. Updated maps will be reprinted annually and shared with key community groups for use in promotional and community engagement activities. The rest of the sessions were used for focus-group style, semi-structured discussion with attendants in groups of four to 10 individuals during which a research team member took detailed notes.
Project Evaluation Survey
Participants were invited to fill out a brief survey two months after the community sessions to determine if the study results had affected their involvement in sustainability. (See Appendix 1 for full survey.) Qualitative questions from the evaluation survey were coded in Excel™ using the multi-coder method previously outlined. Following the survey, the research team continued to work with sustainability administrators and campus leaders to make strategic recommendations for expanding on-campus sustainability engagement.
Results
Many focus group participants wanted to use the study results (particularly the Emory Sustainability Ecosystem map) for recruitment and outreach, as well as to facilitate introductions between sustainability leaders and their projects. Others sought to use the results to fill gaps in collaboration, particularly by engaging upper-level administrators.
In the follow-up evaluation survey, participants were asked to articulate how the research presentation and associated conversations changed their thinking about Emory's sustainability community. More than half of the 57 respondents (54%) said that learning about the university sustainability network affected their perception of their own role, i.e., they realized that they were part of a larger movement/community (93%). Some reported a newfound sense of “fitting in” (16%). Others discovered a renewed sense of opportunity to connect and engage (48%), especially across academic and hierarchical divides (29%); and increased motivation for their own efforts (26%), partially due to their ability to now identify like-minded individuals (13%). Almost one-third of respondents claimed to be more involved in sustainability on campus as a consequence of the project.
More than 90 percent of the respondents took at least one of 10 possible actions presented to them in the survey, with an average of 2.6 actions per individual. These included: sharing information from the project with others (67%); making new connections with other sustainability community members (37%); researching existing sustainability organizations and work (25%); and researching social network analysis for use in their own work (18%). Beyond making new connections, 18 percent planned or started a sustainability project as a result of attending a community engagement session; while 14 percent acted on the information in another way, such as using the evidence to change existing group policies and practices and using the information in a presentation, class, or paper.
The network dataset was updated in the summer of 2016 by researching which community members had left Emory since data collection began at the end of the spring semester 2015, and by adding new sustainability leaders who had since emerged. The research team then followed up on some of the community's suggestions for further usage of the data by sharing portions of the results for strategic decision making and recruitment with administrators and participants. For example, Emory's Office of Sustainability Initiatives was provided with smaller and more manageable lists of individuals who occupy important positions in the network and who could contribute to future sustainability work such as communicating and implementing the Emory Sustainability Vision and Strategic Plan 2016–2026. 28 Additionally, the office was given lists of relevant stakeholders in best- and worst-performing campus buildings rated in terms of energy and water usage, and recommendations for ways to support and strengthen different sub-networks, such as helping undergraduate and graduate students shift their communities from relatively siloed to dense core-periphery structures (Figure 1 and Figure 3). Finally, to help leaders of undergraduate, graduate, and faculty groups strategically engage the wider community, they were provided with network structure information and lists of stakeholders shown to be central and influential in Emory's sustainability networks.
Conclusion
The participatory Mapping Emory's Sustainability Network project impacted the community of sustainability leaders at the university in several ways. The analysis highlighted the multiple stages of network development and different levels of network cohesion of the community overall and its important sub-communities. Community members gained awareness of the larger campus movement for sustainability after reviewing and discussing the research results. These community discussions inspired many of the participants to connect with others and increase their sustainability activity on campus, for example by starting new projects or changing existing group policies. Finally, the research team used the findings to aid the strategic and network development work of different leader groups, including the Office of Sustainability Initiatives. Social network analysis proved to be a powerful tool for assessing Emory University's sustainability movement, engaging and motivating the community, and promoting evidence-based decision making among campus groups.
Footnotes
Acknowledgments
In the spirit of strategic network collaboration, Mapping Emory's Sustainability Network was supported and partially funded by the Office of Sustainability Initiatives at Emory University. The authors thank them for their consistent support through the duration of the project and the opportunity to work with them to strengthen the sustainability movement at Emory. The authors also wish to thank the many leaders across campus who provided various kinds of support and feedback, especially Dr. Kristin Phillips for connecting students to the project, and Dr. Paul Hooper for helping the team learn about and apply social network analysis to the sustainability community. This support embodied the collective thoughtfulness, passion, and interdependence necessary for effective and sustainable movement building.
Author Disclosure Statement
During the research, Ioulia M. Chuvileva (nee Fenton) and Melanie Aleman worked as paid interns at the Office of Sustainability Initiatives at Emory University, which funded different parts of the project. No competing financial interests exist.