
Abstract
Abstract
Students in an undergraduate class for sustainability science majors engaged in a semester‐long project using ESRI ArcGIS Story Maps to conduct a place‐based investigation of the United Nations Sustainable Development Goals (UN SDGs). Coupled with the Doughnut Model of a Safe and Just Space for Humanity, students conducted an in‐depth analysis of social foundations and SDGs for a location of their choice. The project requires understanding each UN goal and synthesizing multilevel data from government, international, and academic sources. The project affords students the opportunity to practice a new form of written and visual communication while creating a finished product that can be presented beyond the classroom.
Introduction
Furman University, a nationally ranked liberal‐arts college located in the Upstate of South Carolina, is committed to sustainability at all levels, from operations to infrastructure to curriculum. Furman is ranked No. 7 (March 2018) among all baccalaureate institutions in the nation, and of those, is the only one in the South that participates in the Sustainability Tracking, Assessment & Rating System (STARS), from the Association for the Advancement of Sustainability in Higher Education (AASHE), which is a framework for colleges and universities to measure and track progress across 17 sustainability impact areas.
Students who major in sustainability science at Furman University are trained to address the wicked problems endemic in a global society that is pushing the Earth's natural systems past safe thresholds. Human Systems is a required midlevel course focused on investigating global frameworks, such as the United Nations Sustainable Development Goals (SDGs), that seek to foster efforts to provide for humanity's most basic needs while protecting natural resources. Required for sophomores in the major, the one‐semester course engages students in a deep exploration of the current state of the world regarding each SDG and its accompanying targets and indicators on both a macro and micro level, including working with global statistics down to local‐level data.
The Story Maps Project
The Story Maps assignment is a place‐based project designed around key competencies for students of higher education regarding sustainable development, including systems thinking. 1 The course requires students to create a project that encompasses three central concepts: 1.) the Doughnut Model for a Safe and Just Space for Humanity, 2.) the United Nations Sustainable Development Goals, and 3.) Coupled Human‐Natural Systems.
The Doughnut Model 2 visually represents a “safe and just space for humanity” by combining essential social foundations (food, water, energy, education, etc.) with the nine planetary boundaries (climate change, land use change, etc.).3,4 It challenges neoclassical economic models that focus on perpetual growth as the answer to social issues, instead emphasizing intragenerational and intergenerational equity, bringing to light the interdependence of social justice and environmental issues.
The Doughnut Model is at the core of all sustainability classes at Furman and is used to facilitate exploring the ways human and natural systems are inseparably intertwined in Coupled Human and Natural Systems (CHANS).5,6 Conceived with the same principles as Raworth's Sustainability Doughnut 2 with the goal of increasing universal well‐being, the UN SDGs for 2030 are now the dominant global framework for sustainable development. The 17 SDGs unite all nations in an attempt to address pervasive global issues such as hunger, lack of clean water, and gender inequality, and to acknowledge the interconnectedness of all the issues addressed within the goals.
The learning objectives of this project are: Students will explain global models of sustainability including the SDGs and the Doughnut model of A Safe and Just Space for Humanity and understand how achievement of goals will move humanity along a sustainable development path. Students will also effectively explain interconnections between the SDGs and local policies, organizational efforts, and CHANS.
Detailed Description
This semester‐long project combines place‐based investigation with application of Raworth's Social Foundations and the United Nations Sustainable Development Goals. Each student creates a Story Map of a location of their choice (city, state, or country). Story Maps, a web‐based open software program developed by ESRI ArcGIS, allows users to combine text, images, maps, and multimedia in a visually appealing format. The program is free and knowledge of GIS is not required, making mastery of the basics relatively easy. Utilizing Story Maps allows students to experiment with different mediums for communication—written, visual, and oral (used with a student's final presentation)—and appeal to a wide audience. Creating the project immerses students in global models of sustainability, helping them articulate their understanding of how achievement of the SDGs will move humanity along a sustainable development path. Additionally, the project aims to enable students to effectively explain the interconnections between the SDGs and local policies, organizational efforts, and CHANS.
Students choose a location (city, state, or country) as the basis for creating their Story Map, which includes their research from academic and governmental sources related to CHANS and progress toward global goals at a local, state, or national level.
Creating the Story Maps
Students begin their project by choosing a location and creating a “place story” that covers historical, economic, political, social, and demographic information about the location, including relevant and appealing photos and appropriately labeled graphs, figures, and maps (Figure 1).
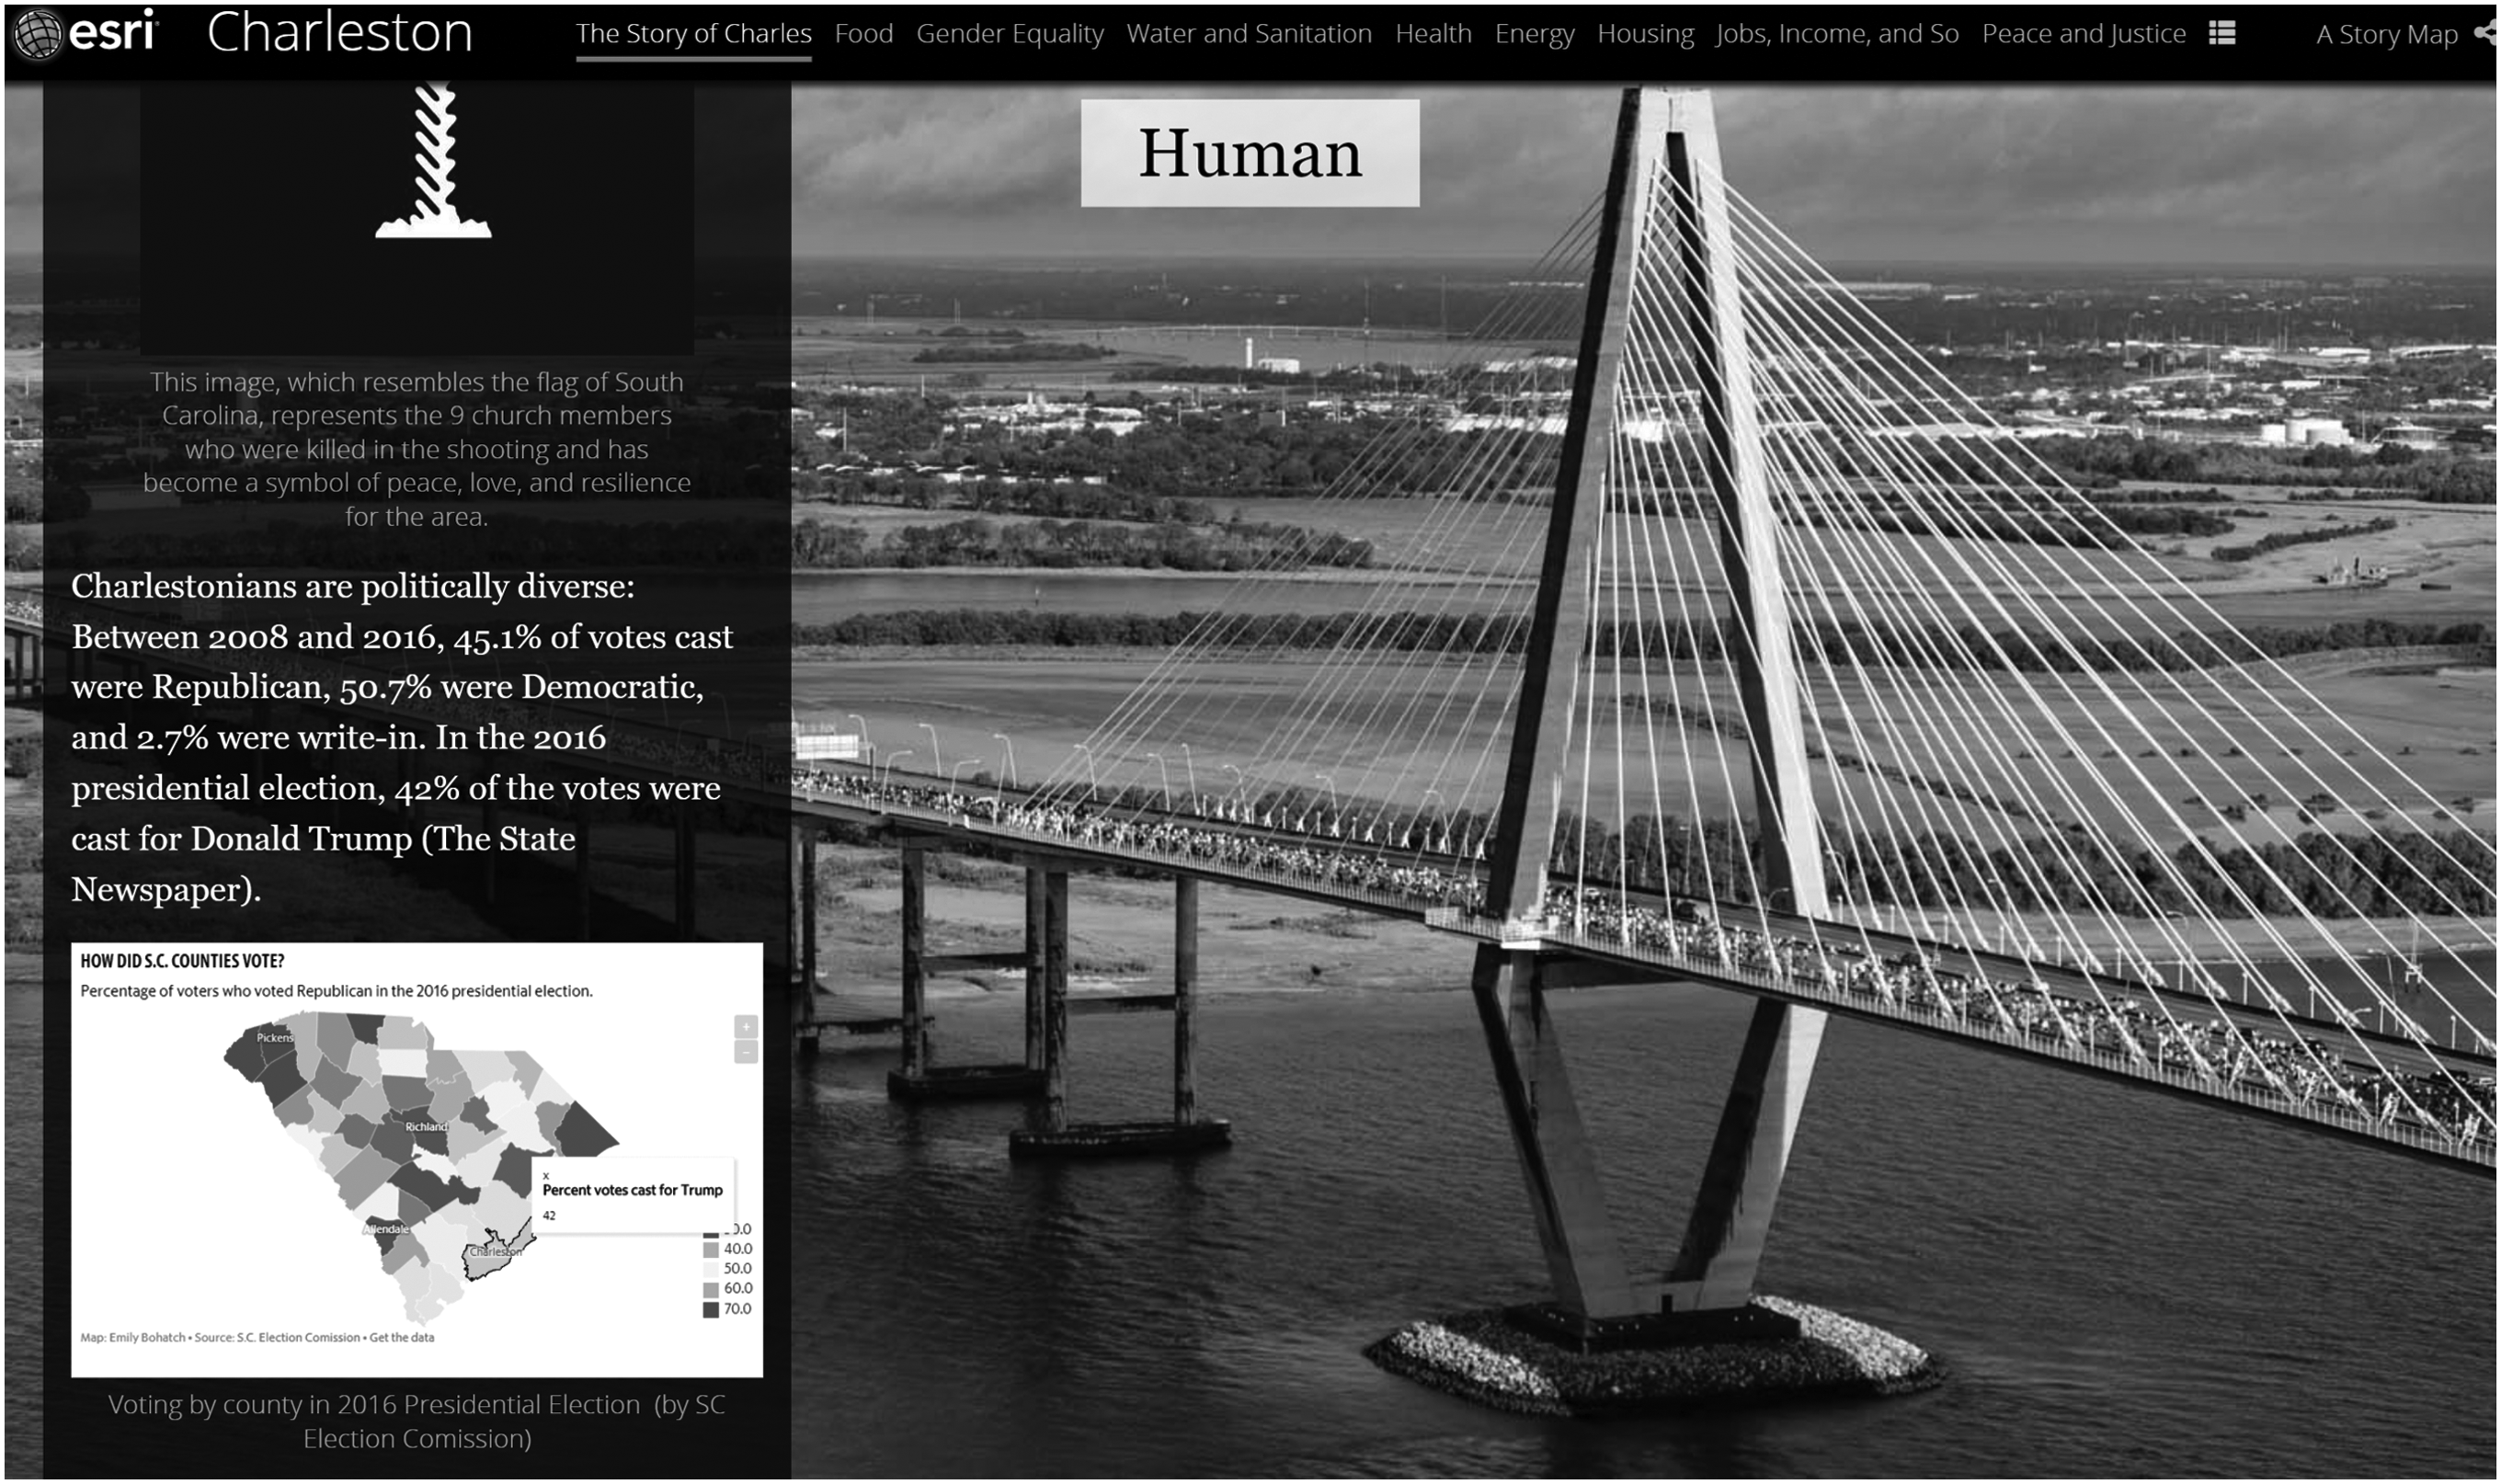
Sample student Story Map showing section on human assets of Charleston, South Carolina
Part of the student's Story Map must include an explanation of Raworth's model 2 ; and an overview of the SDGs, their history, what they are, who created them, and who is participating in enacting them. The Story Map is expected to be clear and concise in applying these concepts to the chosen location, building excitement about possible progress made by the location in achieving the SDGs. The presentation must include three specific examples of progress made between 2000 and 2015 in achieving the Millennium Development Goals (Figure 2).
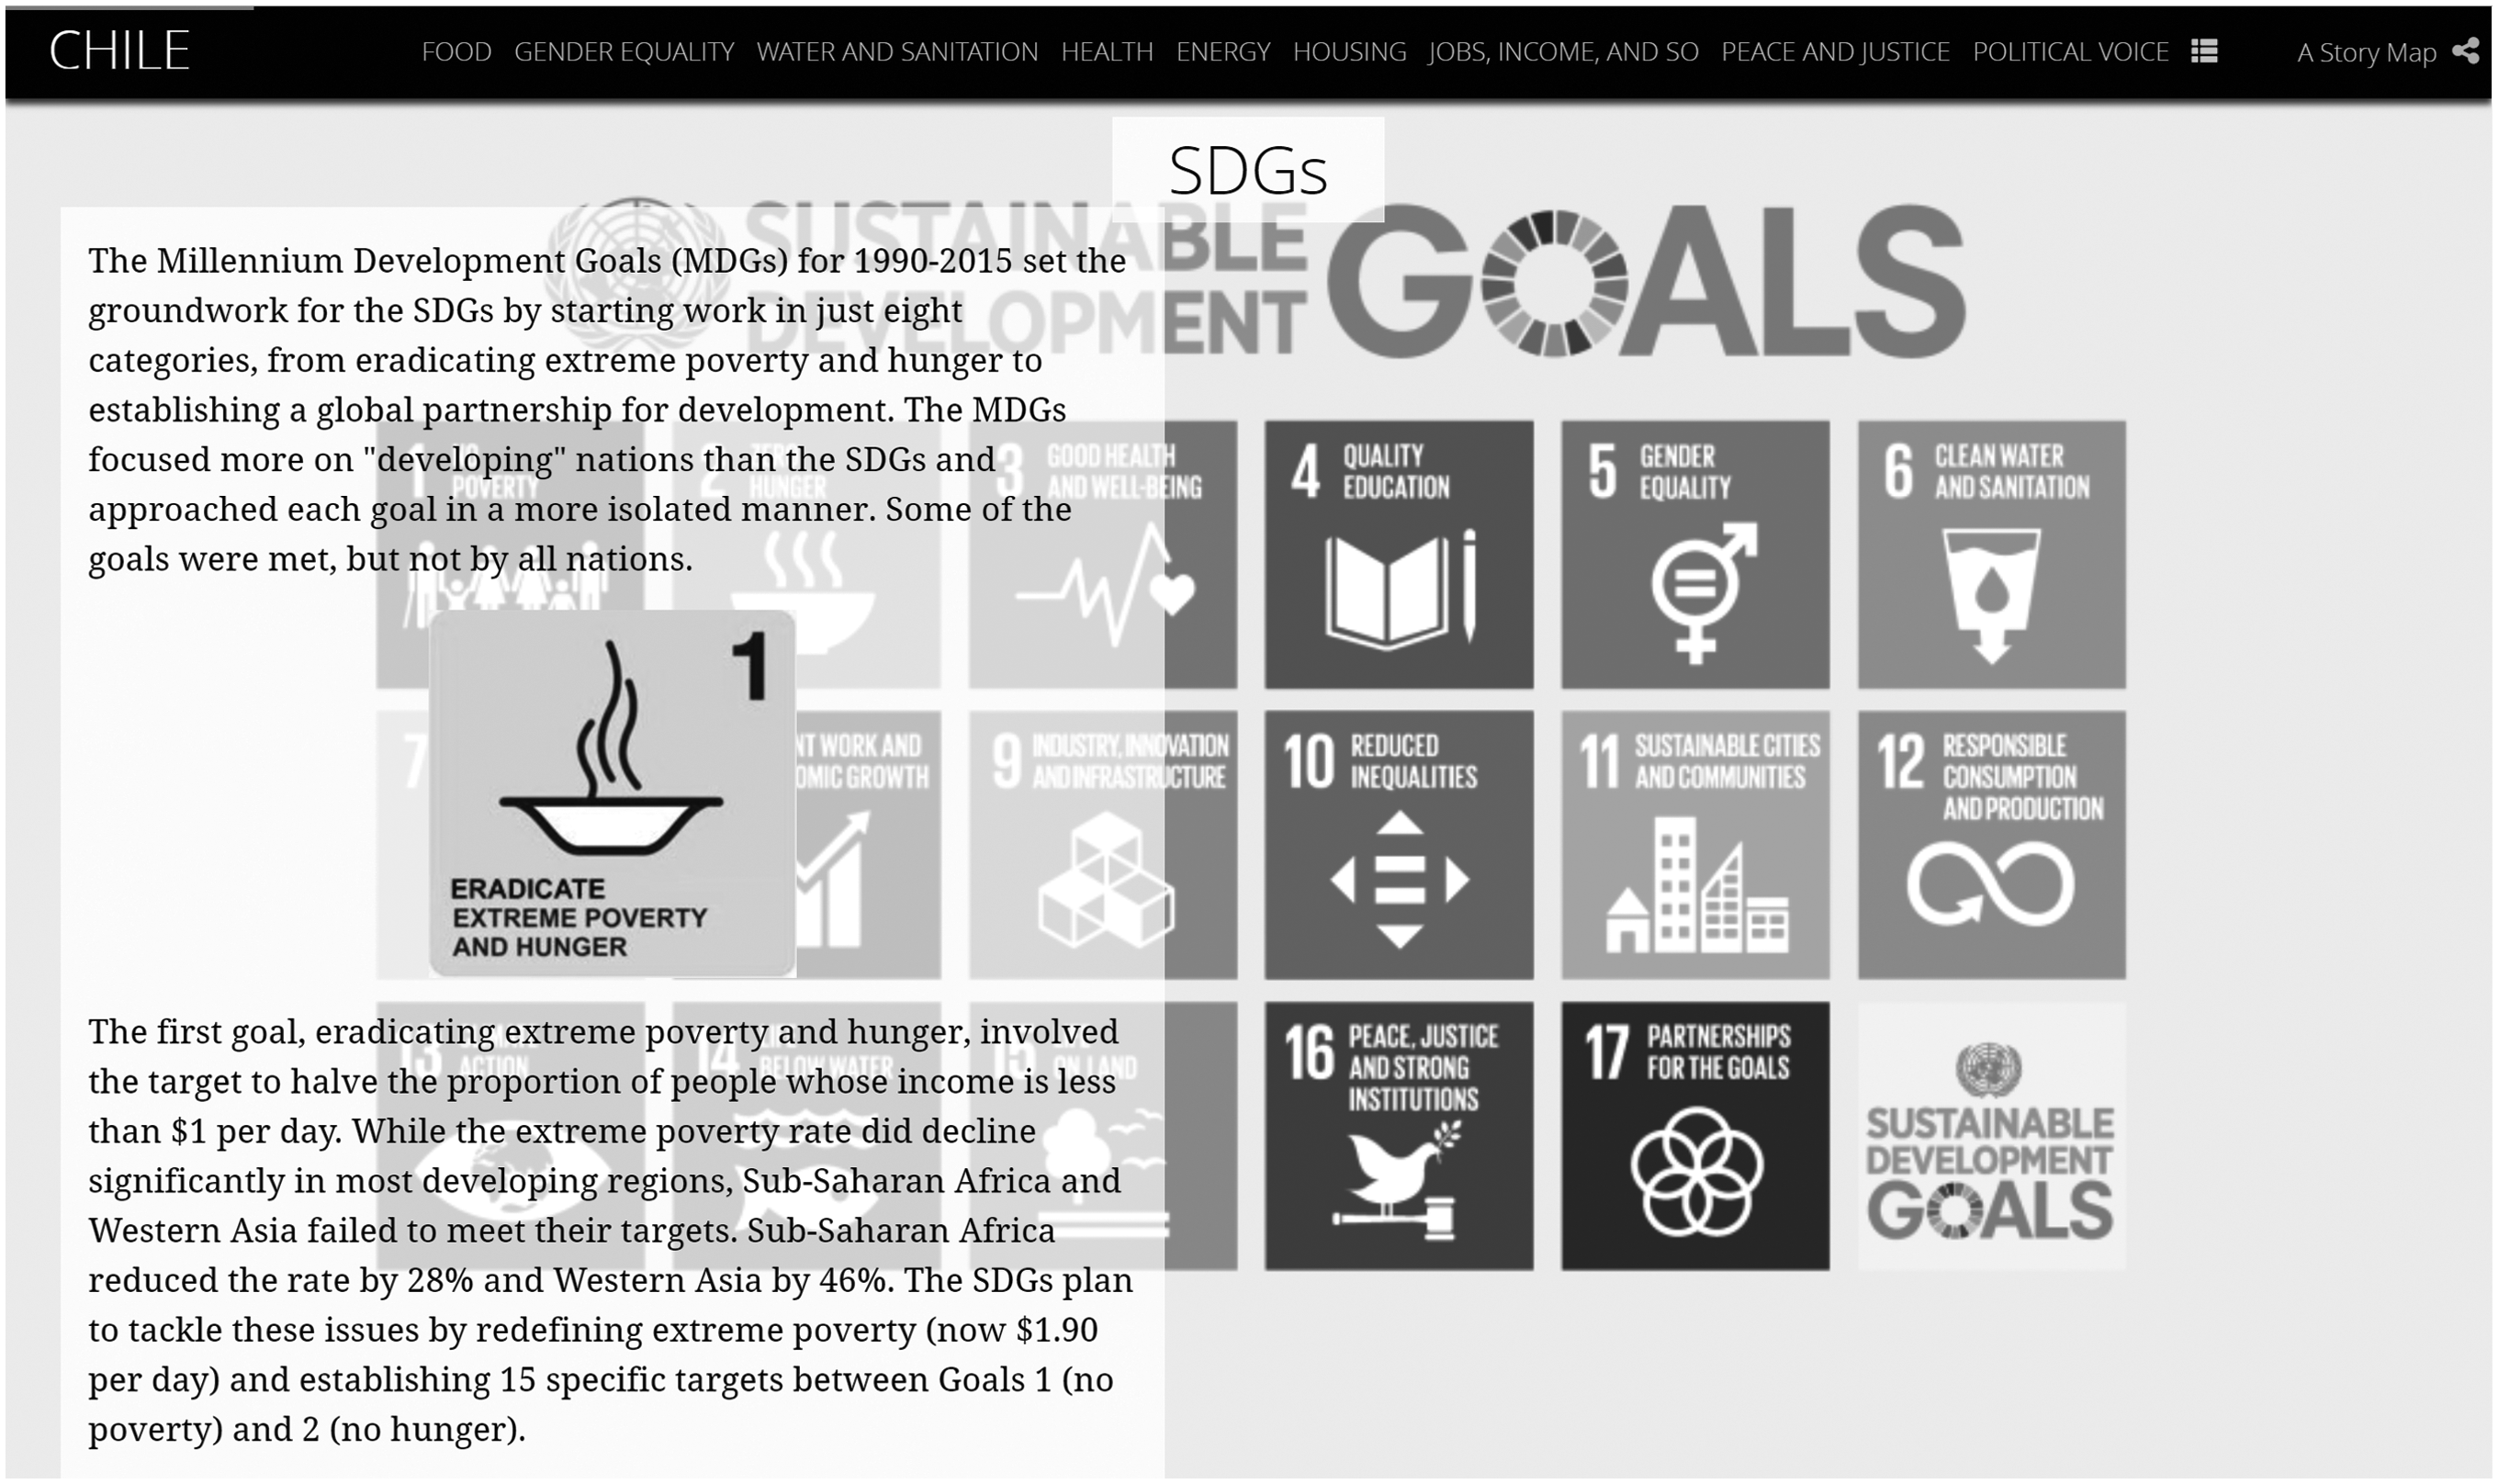
Sample student Story Map showing overview of the United Nations Sustainable Development Goals
After the introductory section is completed, students must meet weekly deadlines that follow class topics on each social foundation (food, water/sanitation, education, jobs, etc.) and each Sustainable Development Goal. Students start the assignment for each week with a detailed explanation of the given social foundation and its related SDG, analyzing why this issue is essential for sustainability at a global scale. This section of the project must include accurately described, labeled, and interpreted graphs and figures of global‐level data (Figure 3).
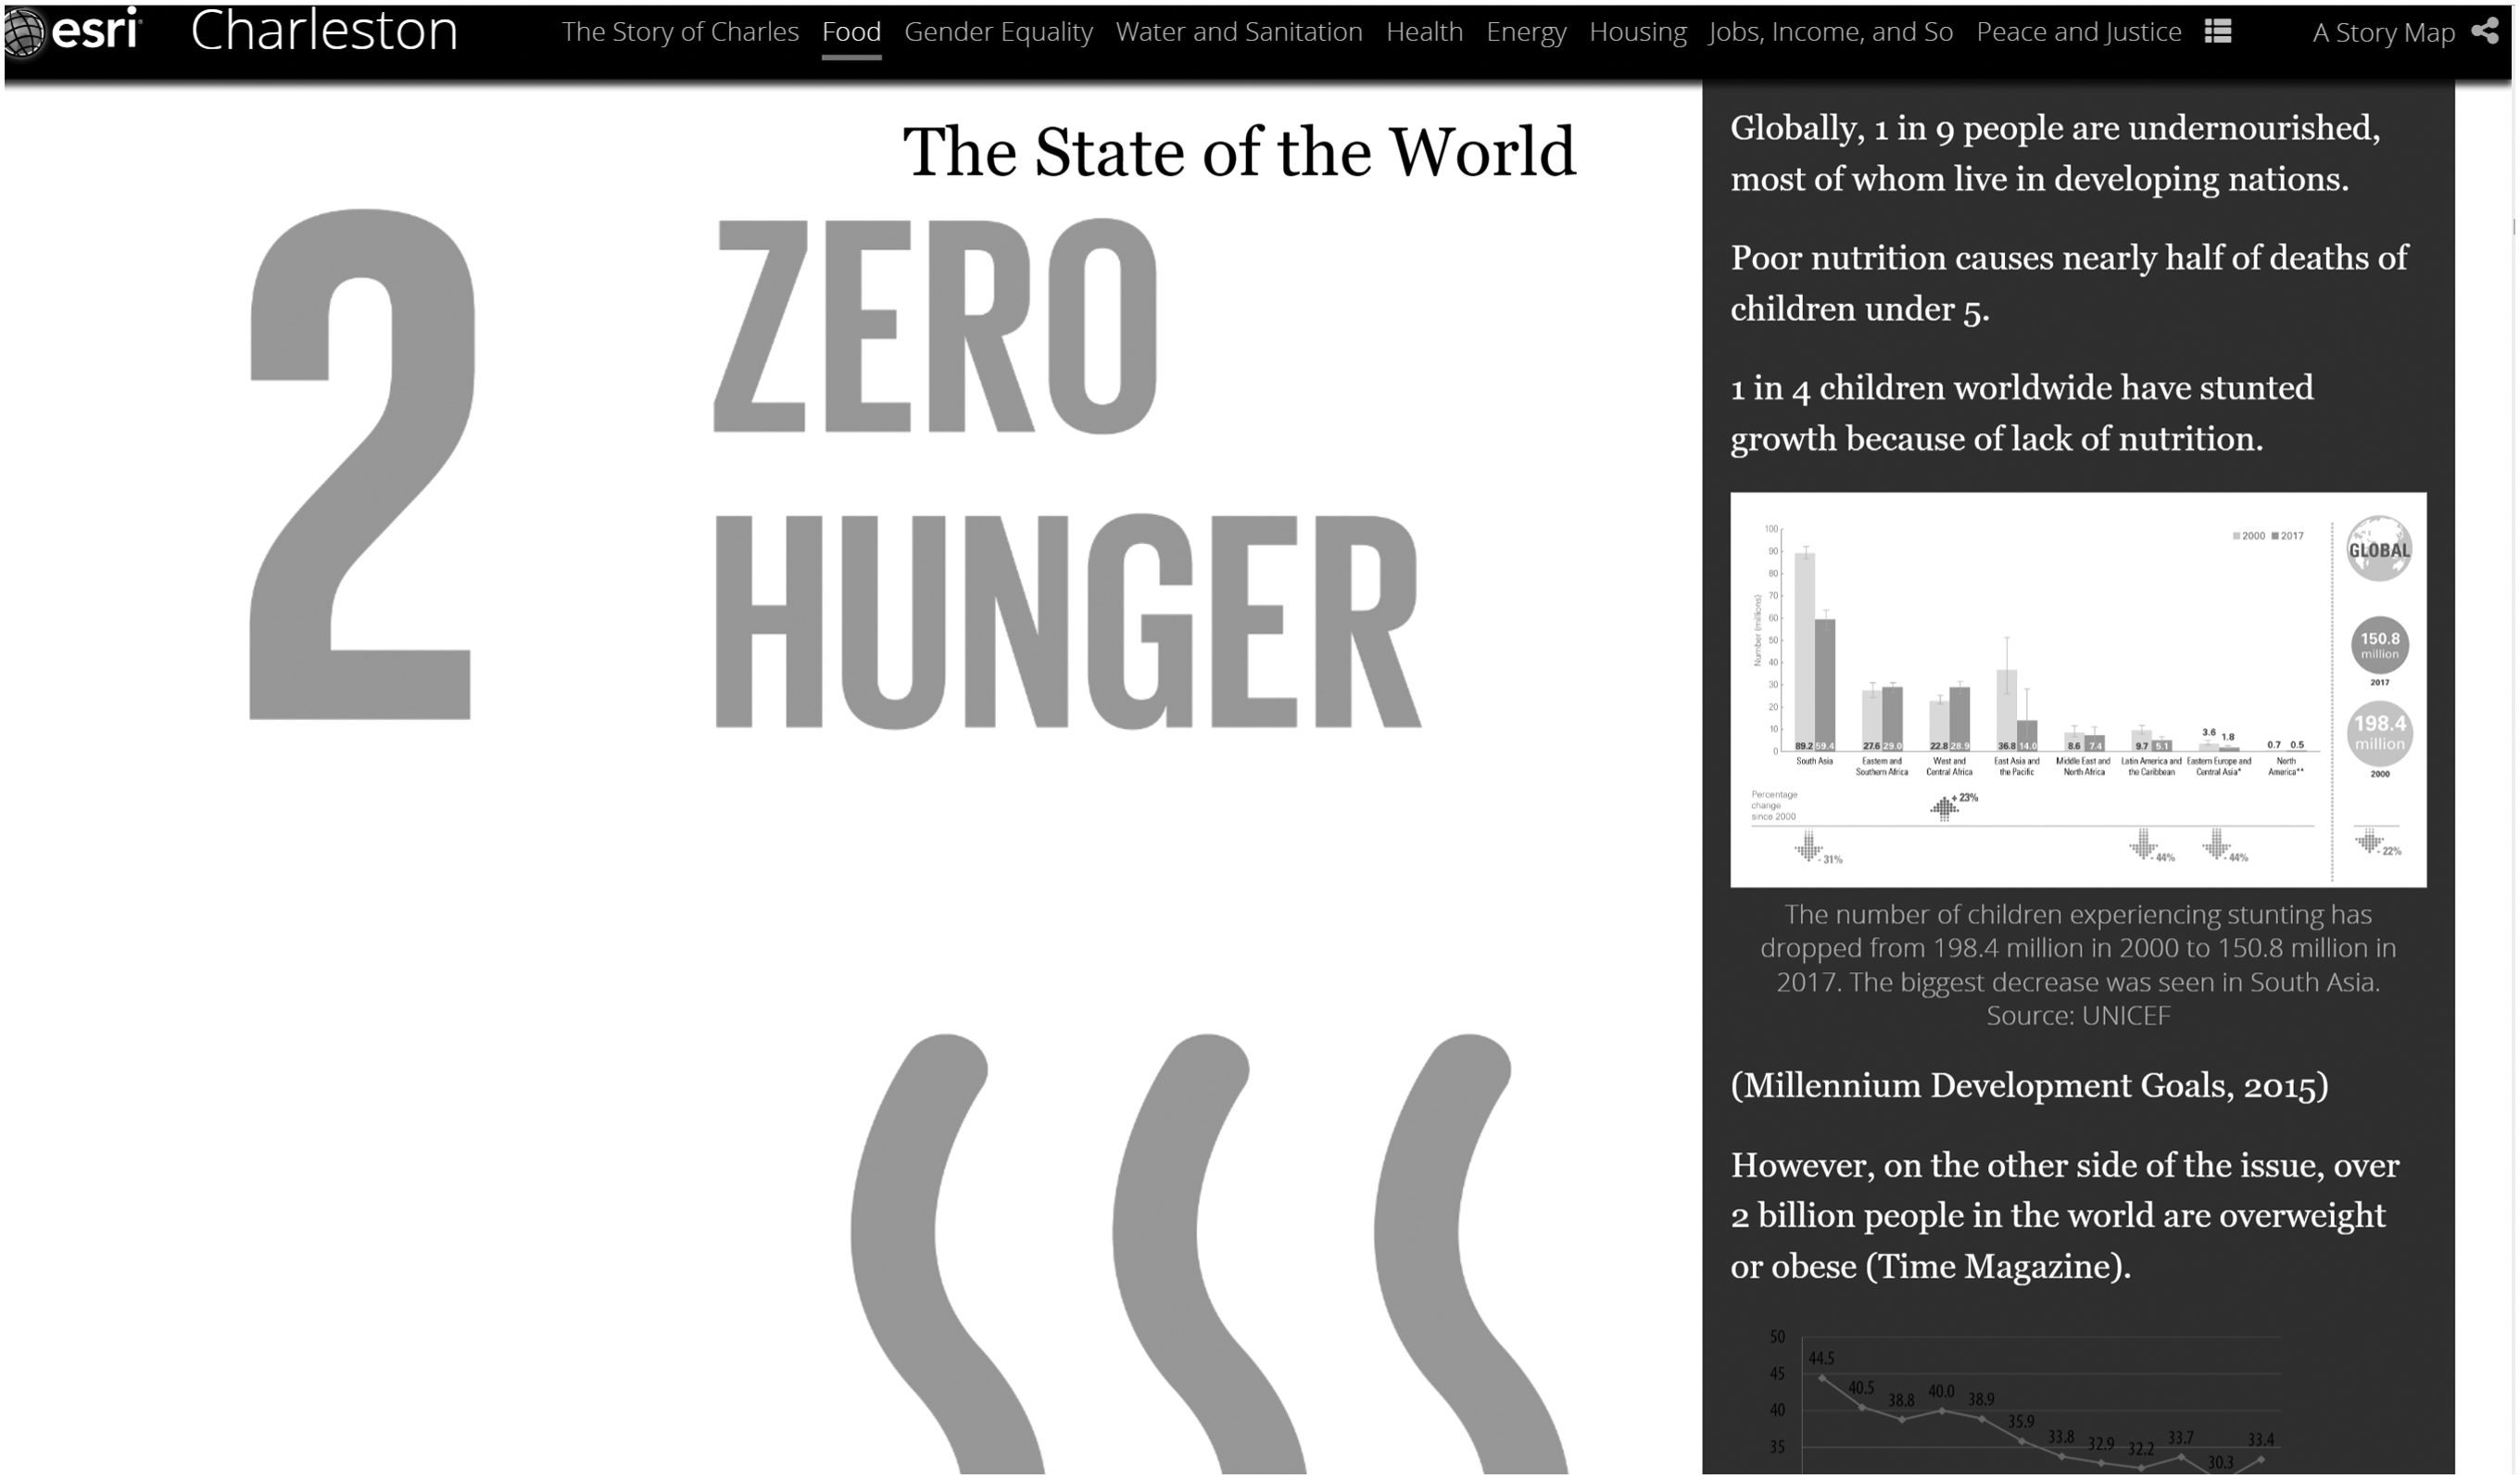
Sample student Story Map showing overview of SDG 2: Zero Hunger
In the main section of the project, students address the progress of the specific SDG as applied to their chosen location using data from appropriate sources (e.g., United Nations, World Bank, Centers for Disease Control, Census Bureau, etc.) and provide documented examples. These examples can describe how human systems are impacting natural systems (e.g., how farming practices in Sweden impact local water quality), and/or how natural systems impact human systems (e.g., how the geographic location of Charleston, South Carolina, is impacted by increases in ocean temperatures that affect fisheries and the local economy) in their chosen location (See Figure 4 and Figure 5.)
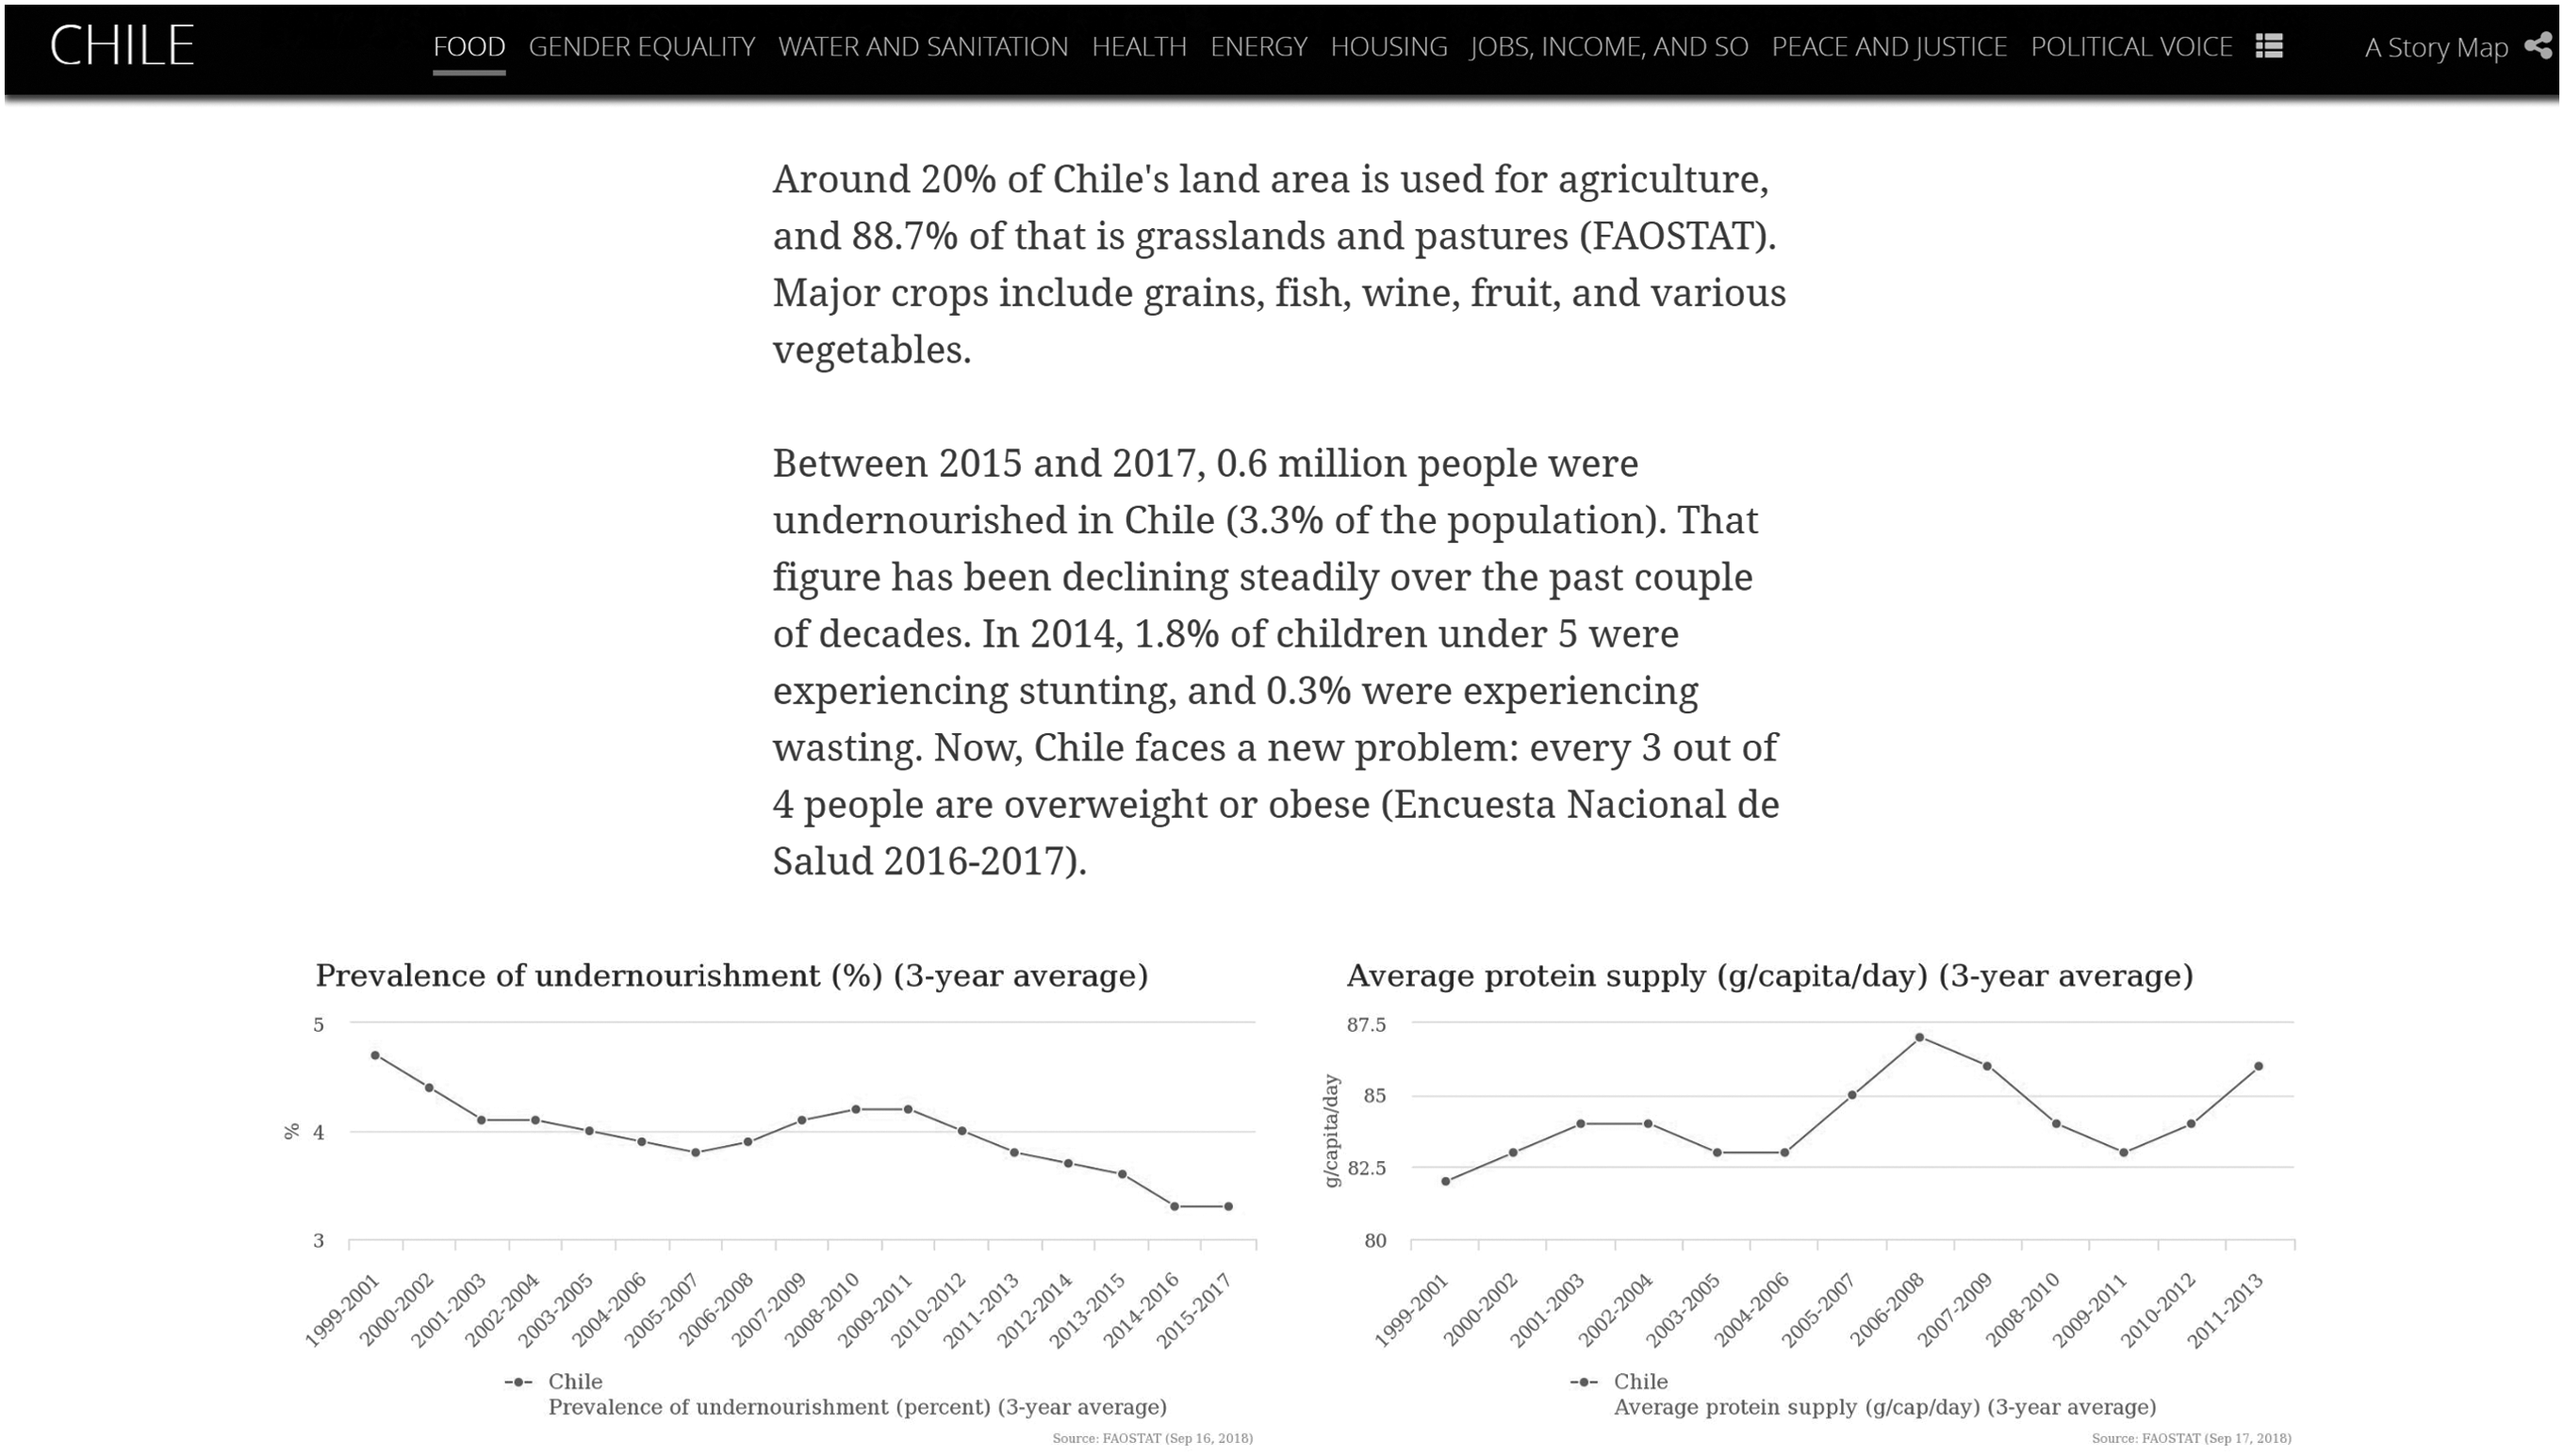
Sample student Story Map showing overview of food and hunger issues in Chile
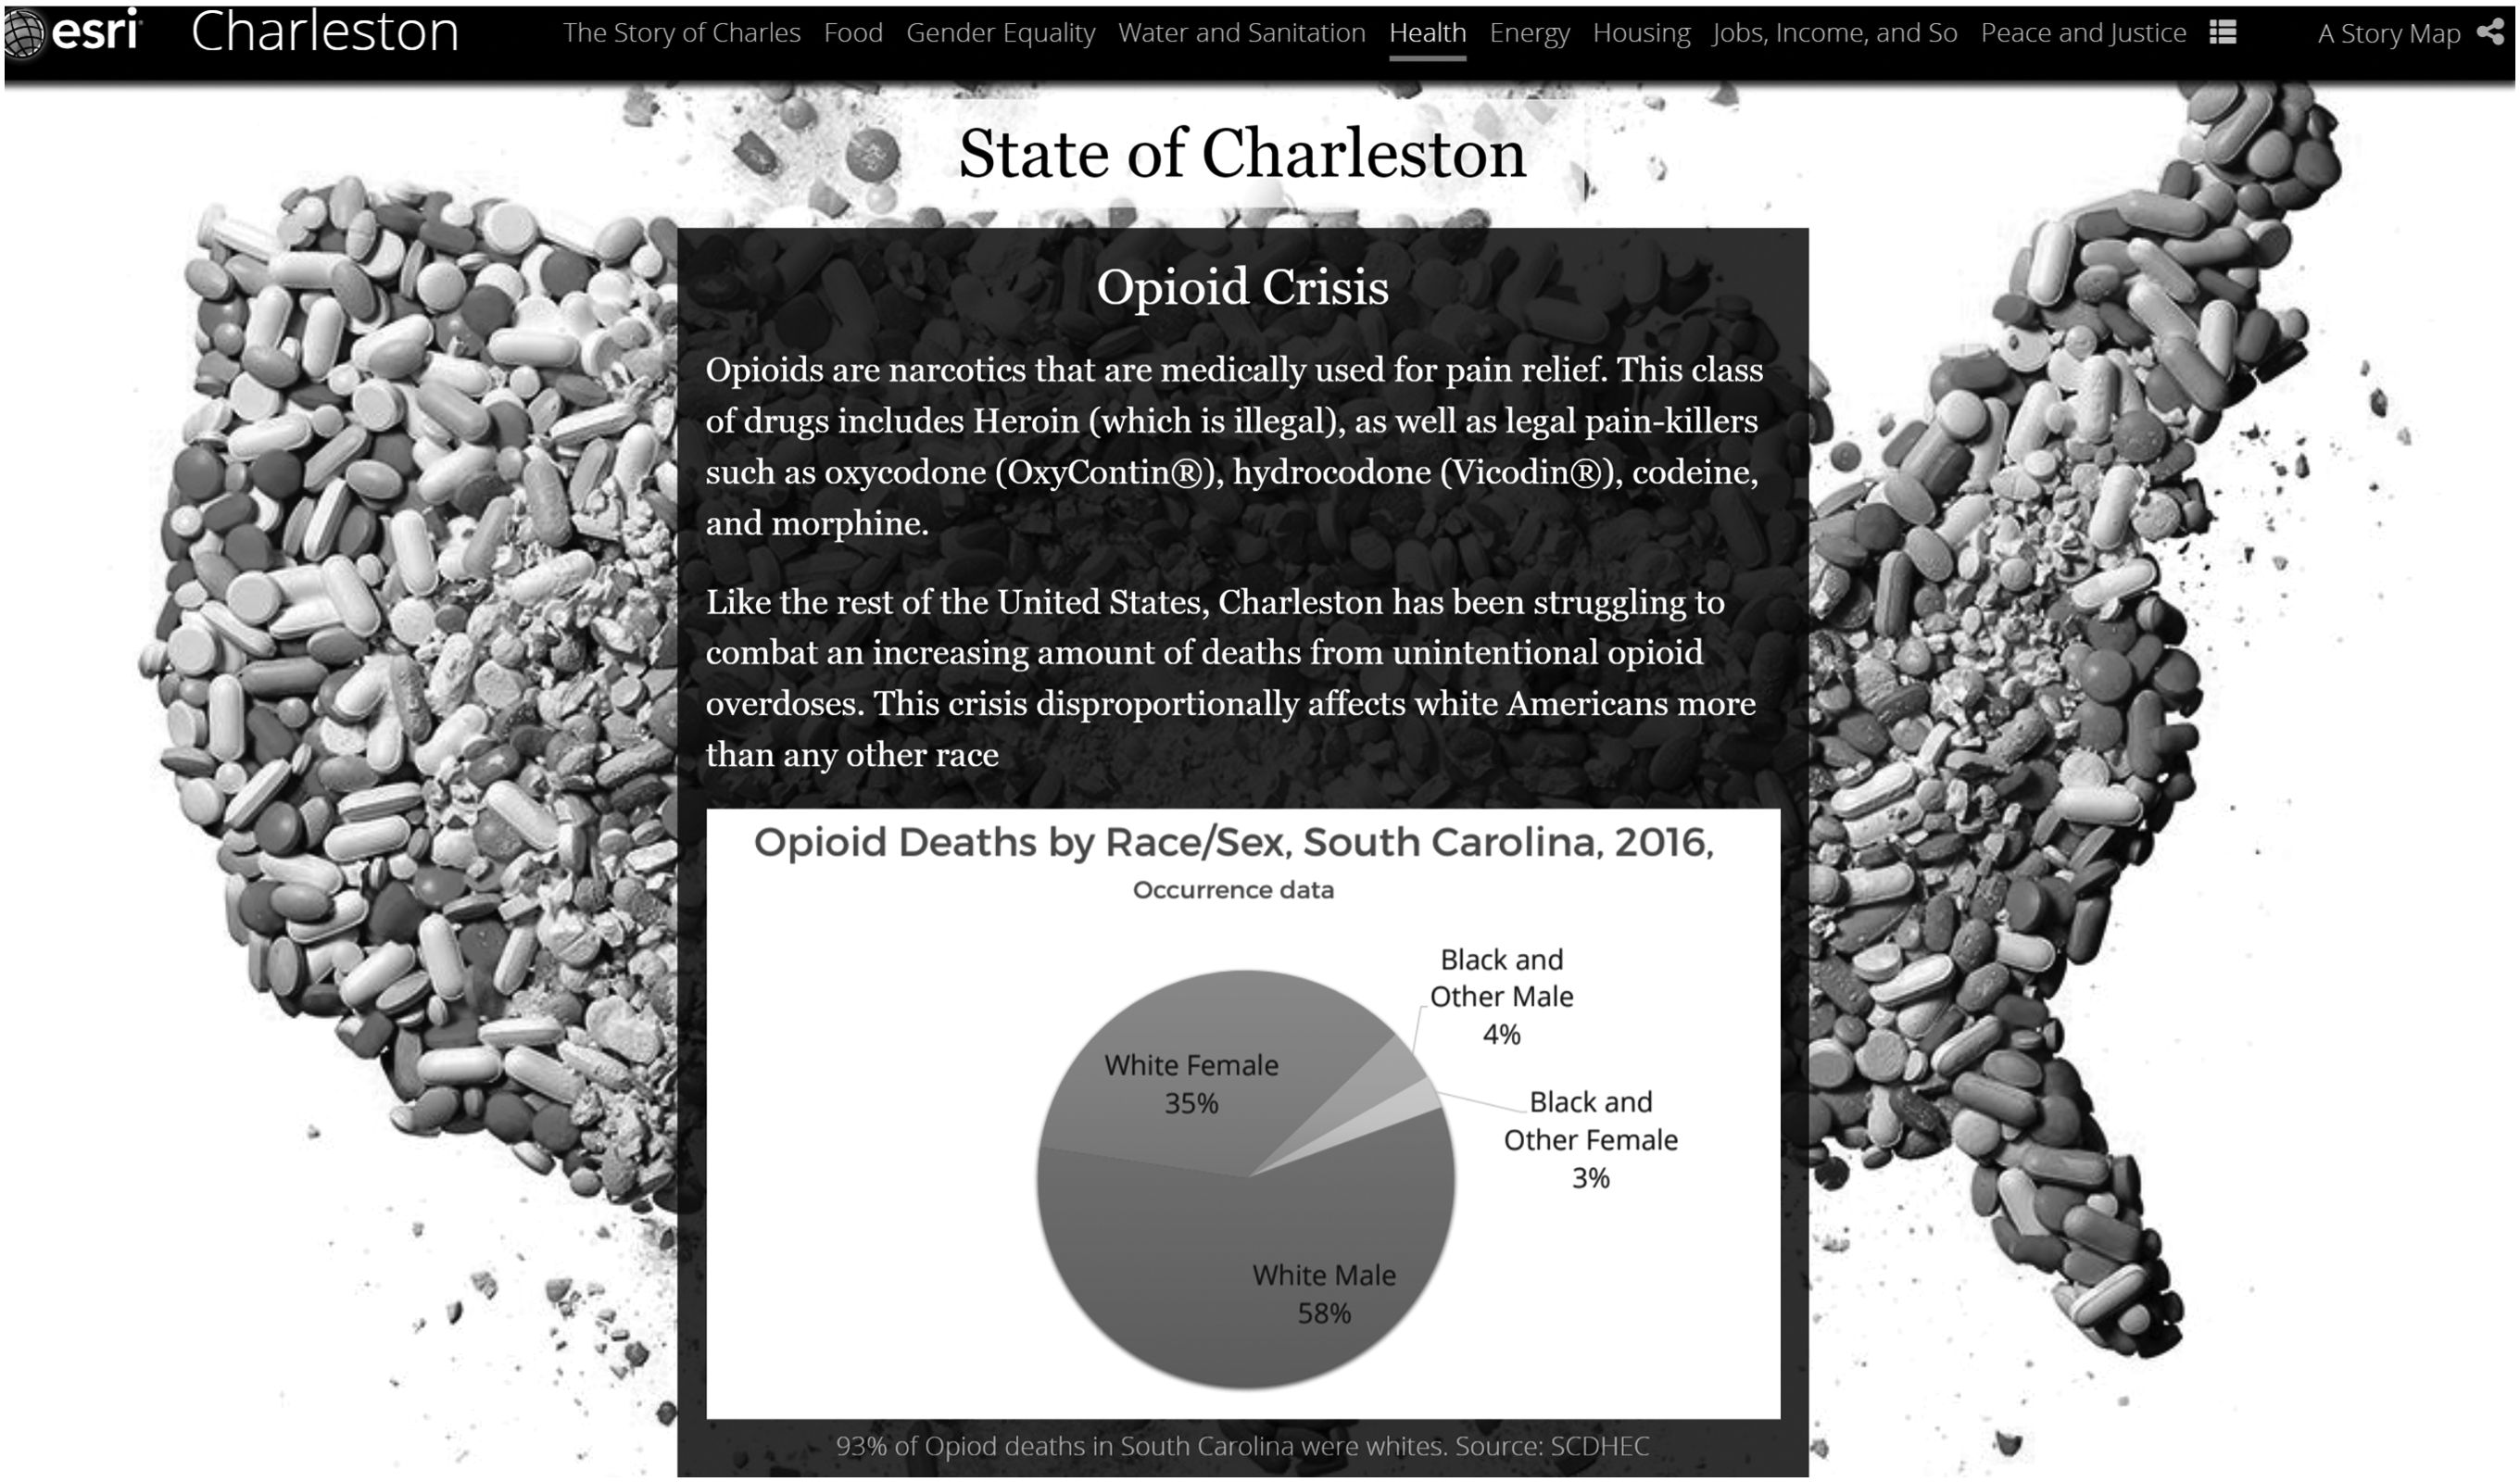
Sample student Story Map showing overview of health issues in Charleston, South Carolina
Finally, students focus on an organization operating in the location and highlight the specific related social foundation or SDG. Then they must design a hypothetical survey for gathering data on the subject (Figure 6).
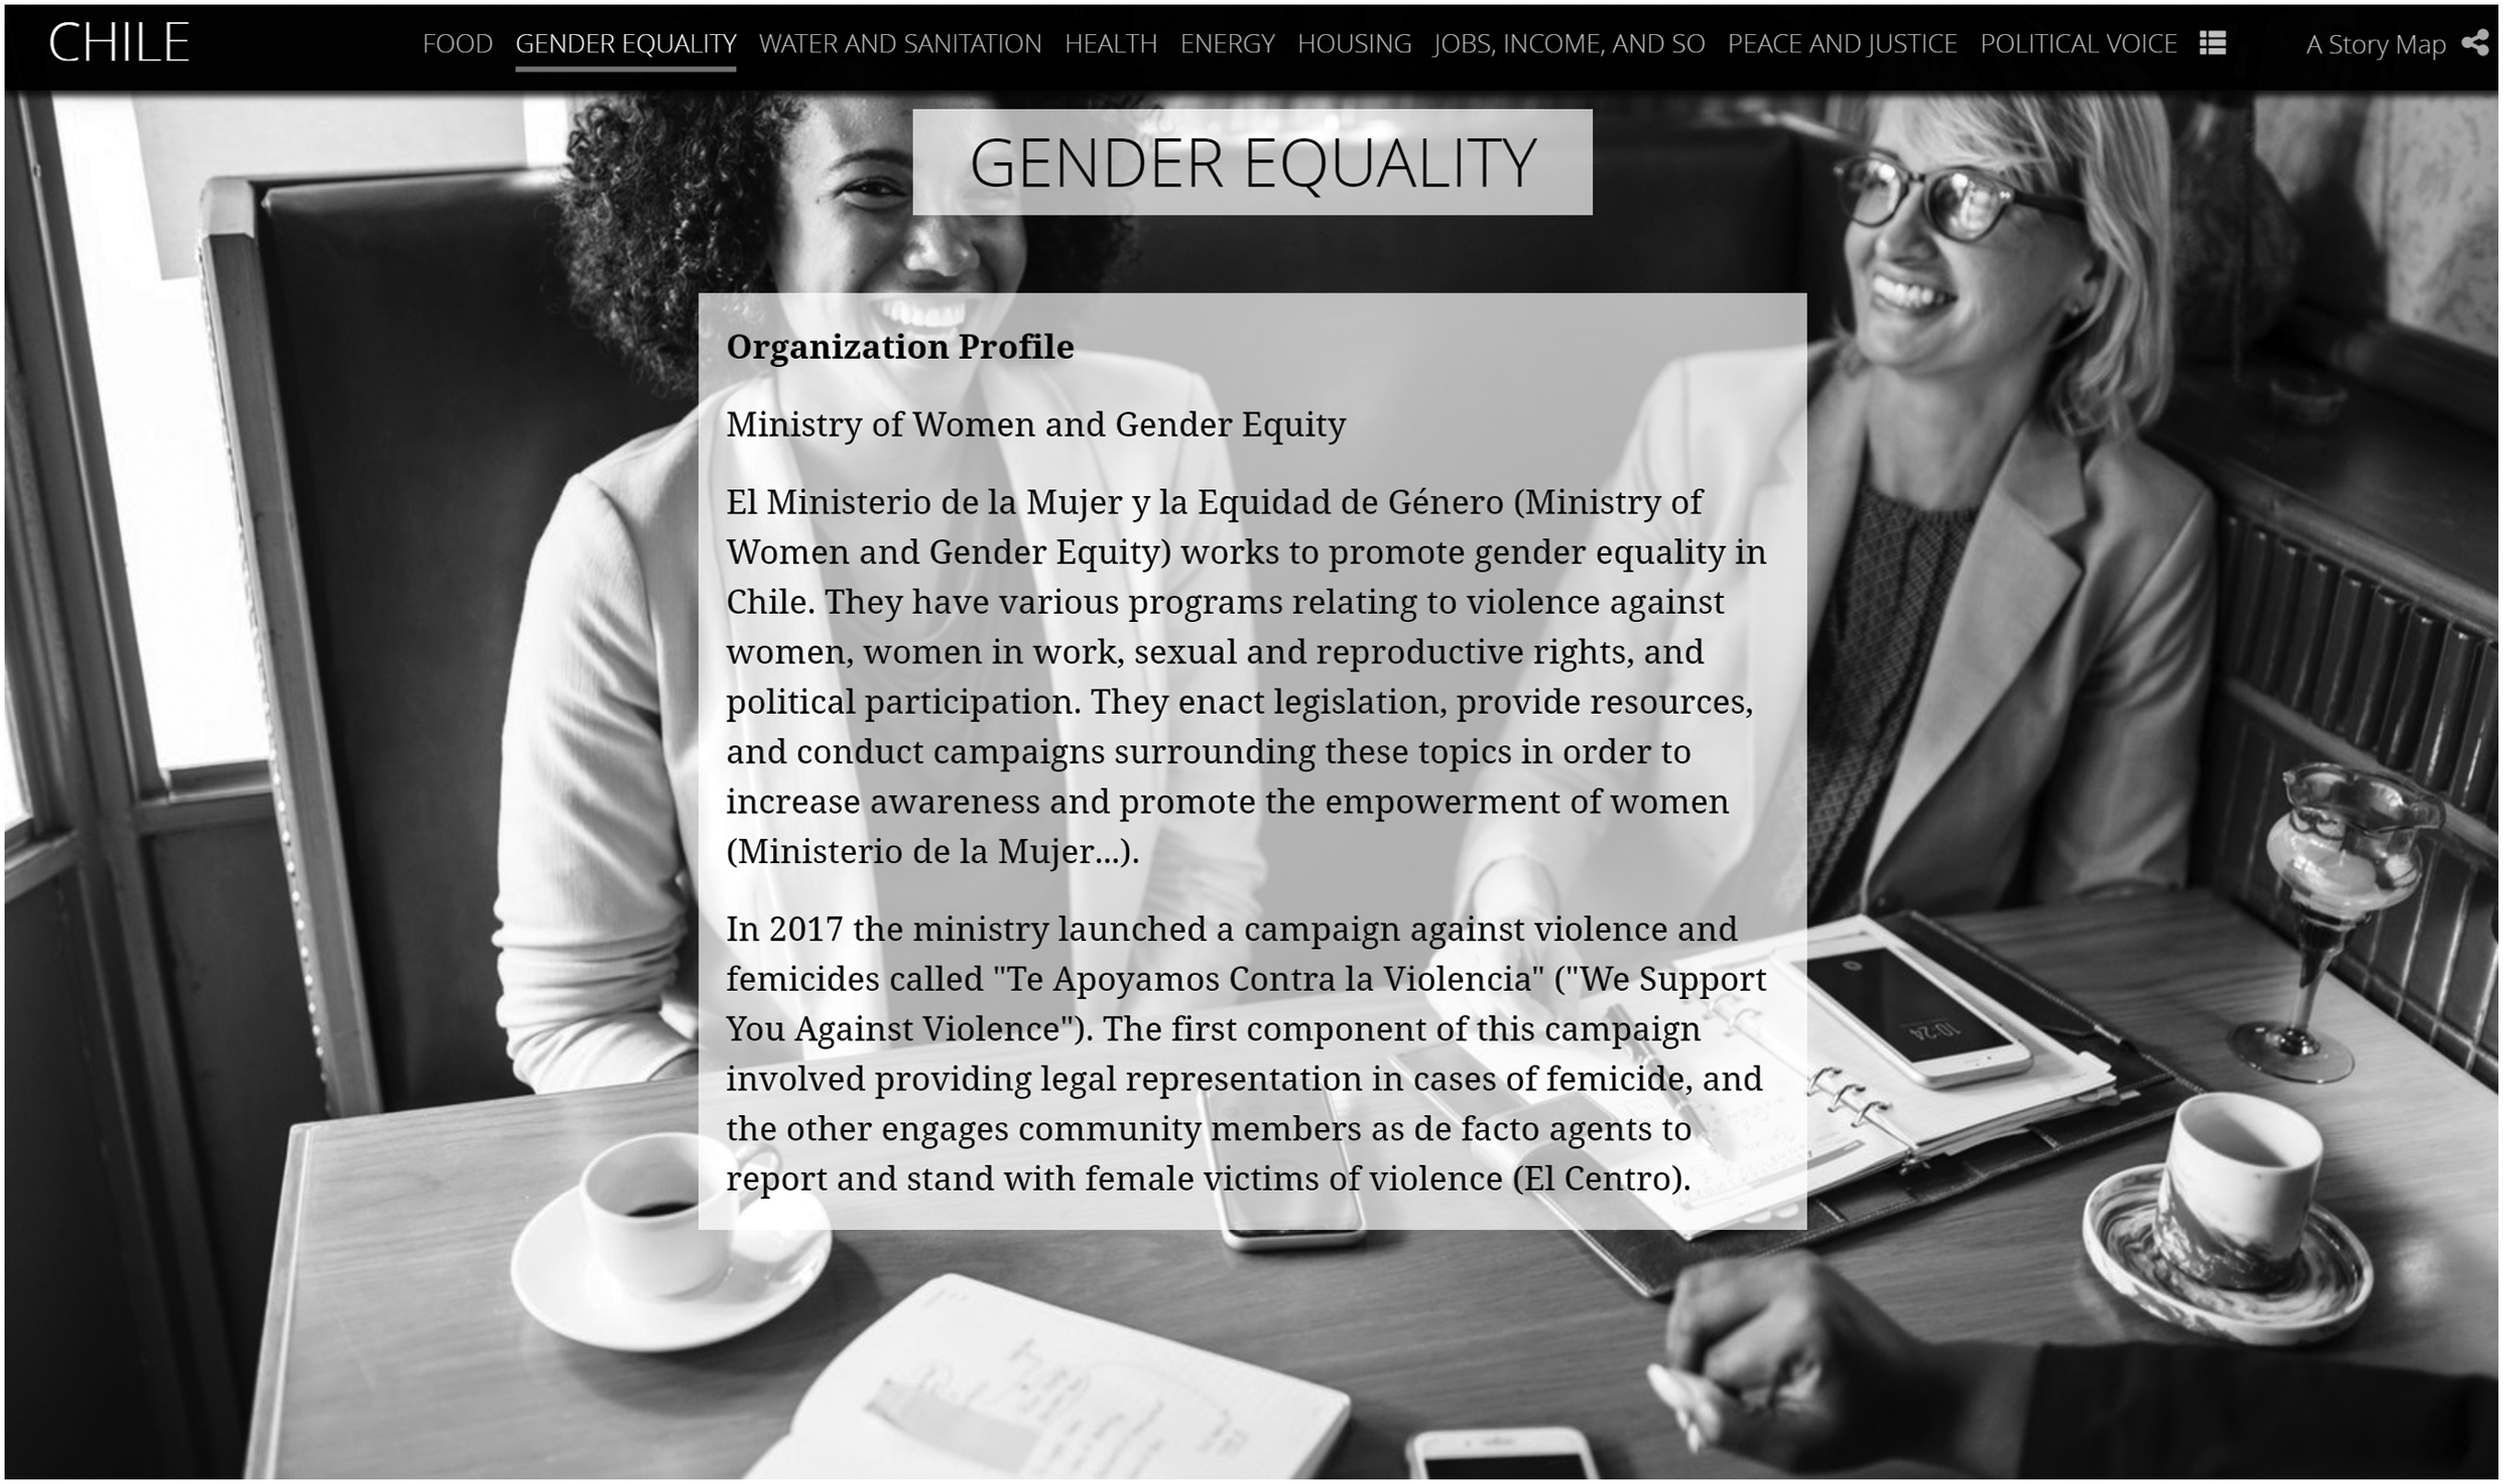
Sample student Story Map showing student's organization profile for Gender Equality in Chile
This project also lends itself to customization, which is encouraged. One student (and contributing author to this article) is combining a sustainability major with a poverty studies minor, an interdisciplinary course of study that combines classes and direct work with people in poverty. She is applying her knowledge of, and interest in, poverty to her project examining Chile. Another student is applying knowledge gained during a summer internship to his project on Cleveland, Ohio. He is highlighting not only the organization he worked for, but analyzing how this organization is working to fulfill, at a local level, the SDG goals. Yet another student is utilizing government documents on sustainable fisheries that she helped to research and write during a summer internship.
Outcomes and Future Planning
Many valuable pedagogical lessons have been learned in the first iteration of this project. Student engagement is heightened through individual choice of location. Given the time and intensity needed for this project, student buy‐in is a must. Whether students choose their hometown or an international location where they hope to work someday, students' commitment to the project stems partially from their ownership of their chosen place. On a contrary note, the majority of students have chosen highly developed Nordic countries. Although student choice is important for ownership of the project, there was little diversity among place choices and investigation of less‐developed countries where progress on the human systems‐focused SDGs (education, water, and sanitation) is needed. This could be an anomaly, though in an earlier similar iteration that did not use Story Maps, students made similar location choices.
Although most students quickly embraced the Story Map format, some struggled with learning a new program. Carving out class time to allow students to engage with the software will allow students to learn tips and tricks for quickly creating a visually appealing project.
Future iterations of this project will further develop students' anticipatory and strategic competencies by asking students to research and include projections of progress on social foundations for their location (such as projections of food or water shortages, increased population size, or housing shortages) in the next 10 to 50 years. Then, students will create a strategy or policy that could mitigate projected future problems.
Footnotes
Author Disclosure Statement
No competing financial interests exist.