
Abstract
Abstract
Genetically modified mesenchymal stem cells (MSCs), overexpressing a BMP gene, have been previously shown to be potent inducers of bone regeneration. However, little was known of the chemical and intrinsic nanomechanical properties of this engineered bone. A previous study utilizing microcomputed tomography, back-scattered electron microscopy, energy-dispersive X-ray, nanoindentation, and atomic force microscopy showed that engineered ectopic bone, although similar in chemical composition and topography, demonstrated an elastic modulus range (14.6–22.1 GPa) that was less than that of the native bone (16.6–38.5 GPa). We hypothesized that these results were obtained due to the specific conditions that exist in an intramuscular ectopic implantation site. Here, we implanted MSCs overexpressing BMP-2 gene in an orthotopic site, a nonunion radial bone defect, in mice. The regenerated bone tissue was analyzed using the same methods previously utilized. The samples revealed high similarity between the engineered and native radii in chemical structure and elemental composition. In contrast to the previous study, nanoindentation data showed that, in general, the native bone exhibited a statistically similar elastic modulus values compared to that of the engineered bone, while the hardness was found to be marginally statistically different at 1000 μN and statistically similar at 7000 μN. We hypothesize that external loading, osteogenic cytokines and osteoprogenitors that exist in a fracture site could enhance the maturation of engineered bone derived from BMP-modified MSCs. Further studies should determine whether longer duration periods postimplantation would lead to increased bone adaptation.
Introduction
Stem cell–based tissue engineering has been shown to be highly advantageous in bone regeneration when adult mesenchymal stem cells (MSCs) are used.4–8 MSC-mediated tissue engineering has proven to have a great potential as an innovative and efficient approach for regenerating bone,7,9–13 tendon,12,14,15 and cartilage12,16,17 tissues. The success and advancement of MSC-based tissue engineering to the clinic will have a far-reaching therapeutic impact enabling drastic improvements in the treatment of congenital diseases, traumatic injuries, and degenerative processes due to aging. One of the strategies of bone tissue engineering is the delivery of the desired gene product via stem cells that have been genetically engineered to overexpress the desired DNA sequence ex vivo. For example, bone formation can be enhanced through the expression of an osteogenic growth factor, such as bone morphogenetic protein 2 (BMP-2) by MSCs, which leads not only to an autocrine effect on the engineered MSCs themselves, but also to a paracrine effect on host MSCs.6,18
In recent years, tissue-engineering strategies are combining various nanotechnological tools, mainly for scaffold design and tissue properties analysis. Highly developed nanoscale techniques, applied in particular to bone, such as atomic force microscopy (AFM) imaging,19,20 high resolution force spectroscopy, 21 and instrumented22–26 and AFM-based nanoindentation,27,28 are providing a wealth of scientific information on the fine details of the structure, intermolecular interactions, and mechanical behavior at extremely small length scales. Nanomechanical experiments can provide an assessment of relative stiffness and inelastic (e.g., viscoelastic/plastic) properties comparing different tissues, since it has been shown that nanoscale trends are accurately reflected in tissue-level data (if the length scale probed is large enough to provide a homogenized/averaged response). 22 Such data can also provide information on the role, contribution, and behavior of different molecular constituents and the types of deformation mechanisms involved in and governing macroscopic behavior, for example, nanogranular friction between mineralites in bone. 22 Hence, nanoscale data are able to offer great insights into the mechanical functionality, quality, and integrity of a given tissue. Additionally, nanoscale methodologies are useful when the volume of material available is too small or irregularly shaped for larger scale analyses, for example with tissue-engineered bone formation in mouse models that are employed in this paper. In the model systems utilized in this study, nanomechanical methods provide the most accurate and sensitive assessment of mechanical properties for comparing different tissues.
We have previously shown that the engineering of MSCs to express the osteogenic growth factor BMP-2 can promote their differentiation in vitro and in vivo into bone forming cells8,29–32 and has led to bone regeneration and fracture healing in various models including radius bone defect and spinal fusion.7,8,32 MSCs that were not engineered to express BMP-2 did not induce bone tissue formation. 8 In spite of the extensive research performed on stem cell–based bone tissue engineering, there was no knowledge of the intrinsic structural and mechanical properties of such bone tissue, until recently. 33 Therefore, in a previous study we have used instrumented nanoindentation and AFM imaging in conjunction with other techniques, that is, back-scattered electron microscopy (BSEM), to estimate mineral content; Raman spectroscopy to identify chemical bonds; and energy-dispersive X-ray (EDX) for elemental analysis, histology, and microcomputed tomography (μCT) scans for morphology and quantitative analysis to compare native mouse femoral bone to genetically engineered bone samples grown ectopically in the thigh muscle of immunocompetent mice for 4 weeks. This multitechnique approach enables a global assessment of the structure–property relationships of engineered tissue compared to native tissue. It was shown that although the ectopically formed engineered bone was quite similar in its chemical composition to the control native bone, the elastic modulus range (14.6–22.1 GPa) was less than that of the native bone (16.6–38.5 GPa), 33 which is a statistically significant difference as assessed by paired t-tests on the mean values for each of six animals. We hypothesized that the inferior mechanical properties of the ectopically engineered bone might have resulted from the site of implantation, which is non-loading bearing and due to the short time (4 weeks) that the bone tissue was allowed to form after cell implantation. In addition, the lack of osteogenic cytokines and osteoprogenitors that can be found in a fracture site might also play a major role in bone maturation. Therefore, in this study we have conducted similar structural and nanomechanical analysis on engineered bone generated in an orthotopic site, a nonunion fracture in the radius bone, using genetically engineered MSCs overexpressing the BMP-2 gene. We allowed the engineered bone to form for 8 weeks in vivo prior to performing nanobiomechanical analysis. BSEM, EDX, and μCT and histological analysis were carried out to further interpret the nanoscale data. We envision that such multitechnique investigations that combine new nanotechnological methodologies with traditional characterization tools will be crucial for the advancement of gene therapy and tissue engineering platforms toward the clinical settings.
Materials and Methods
Genetically engineered MSCs expressing BMP-2
The production of the BMP-2–expressing MSC line used in this study has been described previously. 8 Briefly, cells from the C3H10T1/2 MSC line were transfected with a ptTATop-BMP2 plasmid vector encoding for both a tetracycline transactivator and rhBMP-2. The inducible human BMP-2 expression vector, ptTATop-BMP2, has a bidirectional promoter (TATA sequence) and comprises six tetracycline operators flanked by two transcriptional units with opposite orientations. In this vector, the level of the transactivator, which activates the bidirectional promoter, as well as the expression of hBMP-2 can be regulated by doxycycline, yielding higher levels of gene expression as well as a greater frequency of inducible clones. The engineered MSCs were grown in Dulbecco's modified Eagle's medium supplemented with 2 mM L-glutamine, 100 units/mL penicillin, 100 units/mL streptomycin, and 10% fetal calf serum (Biological Industries, Kibbutz Beit Haemek, Israel). Doxycycline was supplemented to the culture media in order to prevent cell differentiation before implantation.
In vivo orthotopic bone formation
Radial nonunion fracture was created as previously described. 8 Briefly, C3H/HeN female mice aged 6–8 weeks (n = 8) were anesthetized using ketamine–xylazine mixture, injected intraperitoneal, and the skin of the forelimb was swabbed with isopropyl alcohol (70%) and chlorhexidine gluconate (0.5%). The skin was cut; 2.5 mm defect of radius bone was created. After trypsinization, aliquots of approximately 3 × 10⁶ cells were seeded on precut, 1 × 2 mm shaped collagen type I biodegradable scaffolds (DuraGen; Integra LifeSciences Corporation, Plainsboro, NJ) were transplanted into the defect site. Orthotopic bone formation was monitored using in vivo fluoroscopy (Premier Encore Fluoroscan; Hologic Inc., Bedford, MA) once in 2 weeks. Doxycycline was not supplemented to the drinking water of mice in order to induce BMP-2 expression, which would lead to bone formation. The mice were sacrificed 8 weeks posttransplantation, when the formation of substantial bone tissue was verified by fluoroscopy.
Microcomputerized tomography
A quantitative morphometric analysis of the bone formation, in nonunion fractures, was undertaken using μCT. Mice were sacrificed, and the mouse forelimbs, including ulna and radius, as well as native muscle and soft tissue were scanned using a Desktop Cone-Beam Micro-CT Scanner (μCT 40; Scanco Medical AG, Brüttisellen, Switzerland) at a spatial nominal resolution of 20 μm. A constrained 3D Gaussian filter (σ = 0.8 and support = 1) was used to partly suppress the noise in the volumes. The bone tissue was segmented from marrow and soft tissue using a global thresholding procedure. In addition to the visual assessment of structural images, morphometric indices were determined from the microtomographic datasets using direct 3D morphometry. 34 In the nonunion fracture site, the evaluation was done only in the central 2 mm of the bone defect, including only newly formed bone. Evaluation of nonfractured bone was done also in the corresponding central region of 2 mm of the contra-lateral radius. The following morphometric indices were determined for the newly formed bone: (1) total volume of bone (TV, mm3), including new bone and soft tissue cavities; (2) volume of mineralized bone tissue (BV, mm3); (3) bone volume density, the BV/TV ratio; (4) bone mineral density (BMD, mg hydroxyapatite/cm3); (5) connectivity density (1/mm3). The parameter of connectivity density describes the porosity of the bone sample and shows how branched is the bone tissue structure. The connectivity (C) of a two-component system, that is, bone and marrow, is derived directly from the Euler number, by C = 1 E, if all the trabeculae and bone marrow cavities are connected without isolated marrow cavities inside the bone. 35 It is normalized by examined tissue volume and reported as connectivity density.
Histological analysis
Mice radii implanted with engineered MSCs were harvested 8 weeks postimplantation, fixed in 4% formalin overnight, decalcified using Calci-Clear Rapid™ (National Diagnostics, East Riding of Yorkshire, England) for 48 h, passed through increasing concentrations of ethanol, and embedded in paraffin. Five-micrometer-thick sections were cut from each paraffin block using a motorized microtome (Leica Microsystems, Nussloch, Germany). The slides were heated at 65°C for 45 min; this was followed by deparaffinization. Masson's Trichrome staining procedures were performed in a manner's previously reported. 30
Bone sample preparation
The dissected bone samples were rinsed with phosphate-buffered saline (PBS), and embedded in glycol methacrylate using a JB-4 embedding kit (Electron Microscopy Sciences, Hatfield, PA) in vacuum, according to the manufacturer's protocol. Samples for nanomechanical testing stored in aqueous solution (PBS) to ensure maximum hydration and as close to physiological conditions as possible. Blocks were cut with a diamond-impregnated saw (Buehler, Lake Bluff, IL) and then polished on Al2O3 paper (South Bay Technology Inc., San Clemente, CA) from 9 to 0.05 μm grit size.
BSEM, Raman spectroscopy, EDX, and AFM imaging
A low vacuum electron detection environmental scanning electron microscope (ESEM) (Philips/FEI XL30 FEG-SEM, Hillsboro, OR) was employed in back-scattered mode in a water vapor environment to image uncoated samples (electron acceleration = 15 kV, operating current = 180 μA, working distance = 10.0 mm, water vapor = 0.3 torr, depth resolution = ∼3 μm, and spatial resolution = ∼10 μm). Mineral contents were calculated directly from grayscale pixel values, which directly correlate with average atomic number and mineral content. 20 Raman spectroscopy (Kaiser Hololab 5000R, Ann Arbor, MI; depth resolution ∼1 μm, spatial resolution ∼50 mm) was carried out at 785 nm utilizing coherent CW Argon/Ion and Ti/S Lasers using a 100-μm-diameter optical fiber to maximize throughput. Elemental composition analysis was obtained via EDX analysis through a sapphire EDX detector (EDAX, Mahwah, NJ; depth resolution ∼3 μm, spatial resolution ∼10 μm) with LEAP+ crystals for optimal light element performance. Tapping mode (TM) AFM imaging in ambient environmental conditions was employed using a Veeco Digital Instruments (DI, Santa Barbara, CA) Multimode SPM IIIA with an AS-130 “JV” piezoelectric scanner and DI Nano Sensors Tapping Mode Etched Silicon Probes (TESP) cantilevers (nominal resonant frequency ∼250 kHz, nominal spring constant ∼40 N/m, and nominal probe tip end radius ∼10 nm).
Nanoindentation
Load-controlled nanoindentation experiments, performed on six mice, were conducted in ambient conditions using a Hysitron (Minneapolis, MN) Triboindenter and a Berkovich (trigonal pyramid) diamond probe tip following a protocol previously reported. 33 Each experiment involved a four-segment load function; a 3 s hold at zero load, a constant loading rate of 50 μN/s until the maximum set peak load was reached, a hold of 20 s, and finally a constant unloading rate of 50 μN/s. To ensure that creep effects were kept at a minimum, the variation in elastic modulus was calculated 36 for three different experiments: (1) the hold period was varied between 10 and 90 s, (2) after the hold period, the sample was unloaded to 20% of the maximum force and reloaded back to the maximum force for several cycles, and (3) the loading/unloading rate was varied by two orders of magnitude (the limit of the instrument). All three series of experiments found that the variation in elastic moduli was <10%. Values for elastic moduli were calculated from 95% to 20% of the initial unloading curve by fitting these data to contact mechanical theory for isotropic, elastic half-space, that is, the Oliver-Pharr or O-P method. 37 The hardness calculated by the O-P method (H = maximum load/contact area at maximum load, Amax) represents resistance to total deformation (i.e., elastic, viscoelastic, and plastic). There were six pairs tested with ∼80 indents per sample at each maximum load, where the indents were spaced 10 μm apart, much greater than the size of the inelastically deformed area and residual stress zone predicted by elastic-perfectly plastic finite element simulations. 27 Tests were conducted parallel to the cortical long bone axis for the native radius bone and in the cortical-like surface region for the engineered bone. Paired t-tests on the mean values of modulus and hardness for each of the six mice (as independent measurements, n = 6) were employed to compare engineered bone to its native controls (p < 0.05 was assumed to be statistically significant).
Results
μCT analysis
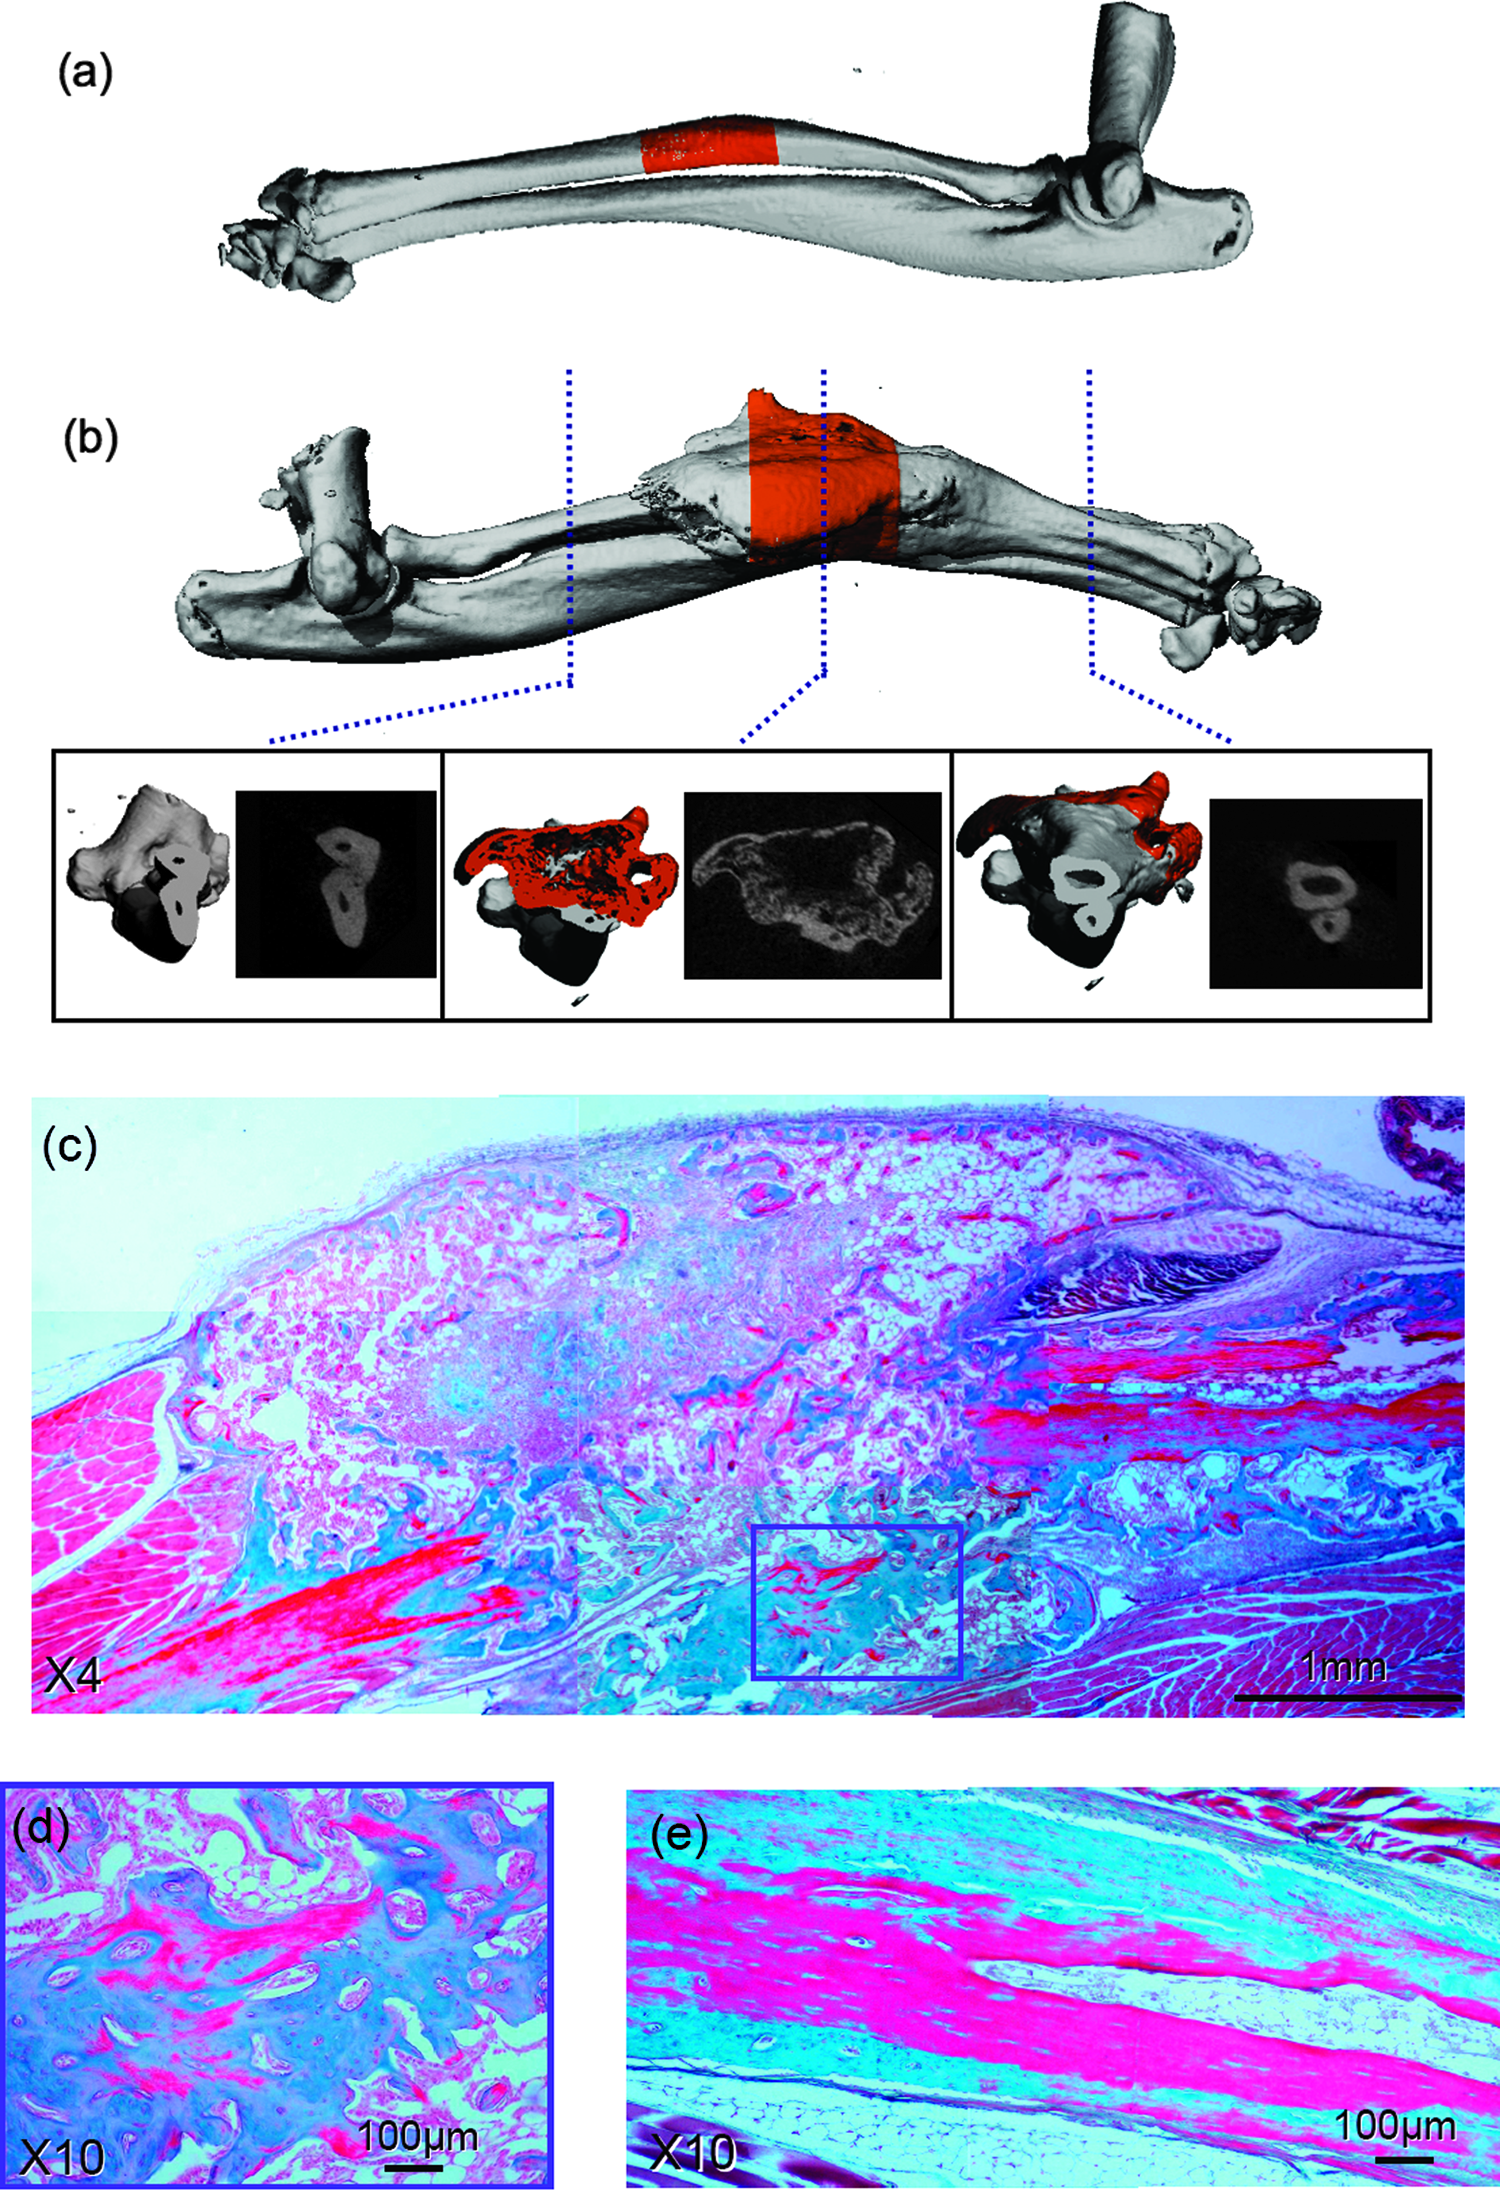
Three-dimensional images obtained from μCT scans shown in Figure 1 indicate substantial growth of engineered bone, indicative of fracture healing at the transplantation site (Fig. 1b). Two-dimensional images demonstrate that the new bone tissue is composed of distinct cortical-like and trabecular-like regions (Fig. 1b), as indicated by the degree of porosity on the outer rim and the inner region, respectively. These images highlight the powerful osteogenic potential of genetically engineered MSCs, which can induce prominent bone formation within a short period of time. Quantitative morphological and structural analysis of the bone tissue was performed using μCT on the scanned engineered bone tissue in comparison to native contralateral radius, and it indicated that the average newly formed total bone volume reached 2.49 ± 0.33 mm3, which was significantly higher than the same segment of native radius 0.72 ± 0.01 mm3 (n = 8, p < 0.005). The actual engineered bone tissue volume reached 1.37 ± 0.11 mm3 comparing to native 0.69 ± 0.01 mm3 (n = 8, p < 0.005). The bone volume density (newly formed bone volume normalized by the total tissue volume) of the repaired radii was found to be 0.6 ± 0.06, which is lower than native radii 0.95 ± 0.003 (n = 8, p < 0.005) (Fig. 2a). BMD was found to be similar in both tissues: 1006.65 ± 11.18 mg hydroxyapatite (HA)/cm3 in the repaired tissue, and 1076.05 ± 14.84 mg HA/cm3 of native radii (n = 8, p > 0.005) (Fig. 2b), indicating that the mineral content of the bone tissues is the same in this stage of tissue formation. The engineered bone showed connectivity density of 27.38 ± 2.58 1/mm3, whereas the control radii showed 3.86 ± 0.64 1/mm3 (n = 8, p < 0.005) (Fig. 2c). This parameter indicates that the engineered bone is more porous and branched than the native one. We believe that the maturation process of the tissue will result in remodeling and the structure of the tissue gradually will resemble more and more to the control one.
Three-dimensional μCT images of (

Quantitative morphological and structural analysis of the bone tissue was performed using μCT. Experimental group stands for the repaired radii, and the control stands for the native radii. The bone volume density was calculated as the ratio of actual bone volume to total tissue volume as revealed by μCT. (
Histological analysis
Histological sections of mice fractured radii implanted with engineered MSCs were stained with Masson's Trichrome and evaluated under a light microscope. Images were taken using a digital camera (DS-Fi1, Nikon, Tokyo, Japan). Sections shown in Figure 1c–e demonstrate that new bone formation has bridged the gap between the two edges of the radius defect (Fig. 1c). The new bone tissue was composed of a thinner cortex, compared to the native radii (Fig. 1e). Bone marrow and bone trabeculae were evident in the central portion of the new bone, as could also be seen in the μCT 2D images (Fig. 1b).
Mineral content, surface morphology, and topography
BSEM indicates the relative mineral content proportions in both types of bone to be similar ∼50–60 weight% (Fig. 3). The bone section shown in Figure 3a is taken from a native radial bone region (outer cortical region), corresponding to the colored (orange) region in Figure 1a. The bone section shown in Figure 3b is taken from an engineered bone region, corresponding to the colored (orange) region in Figure 1b, in the outer cortical-like region shown in the cross-sectional images below Figure 1b. It should be noted that the BSEM image of Figure 3 is a representative sampling of the microscale morphology and degree of mineralization for a region of bone ∼60 μm × 60 μm in area. The μCT measurements of Figure 1 were taken over much larger length scales (macroscopic), in the order of millimeters. Hence, the BSEM images of Figure 3 are a zoom-in higher magnification view of the bone observed by μCT. These images show lacunae from the engineered bone similar in size, shape, and orientation to that of the surrounding native bone. A BSEM image of the native radial cortical bone (view perpendicular to the long bone axis, Fig. 3a) shows a mineralized structure (as reflected by the image gray scale) randomly distributed lacunae and canaliculi. The engineered bone (Fig. 3b) shows a similar degree and uniformity of mineralization as the radial bone, as well as lacunae and canaliculi in orientation and shape. The native radius bone and engineered bone samples were found to exhibit ∼5% and ∼10% porosity, respectively, as calculated from the lacunae visible in the BSE images. After a 1 s demineralization etch in 40 vol.% H3PO4, banded fibrillar structures were visible via TMAFM imaging in both types of bone (Fig. 4). The orientational growth of the fibrils was relatively similar in both types of bone tissue. We have summarized the parameters analyzed in this section, in Table 1.
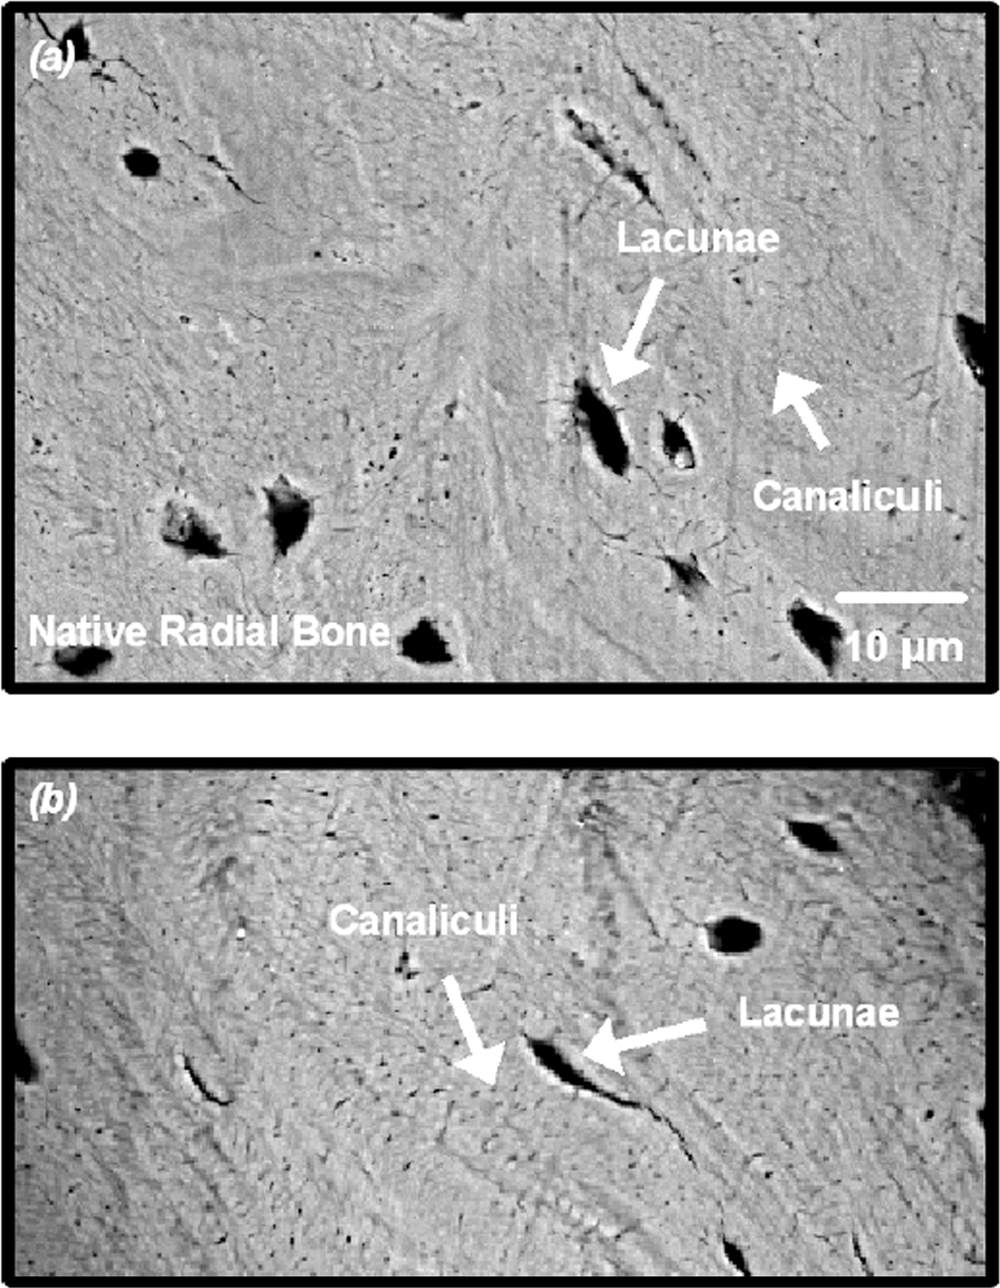
Environmental back-scattered scanning electron microscope images at 500 × magnification of (
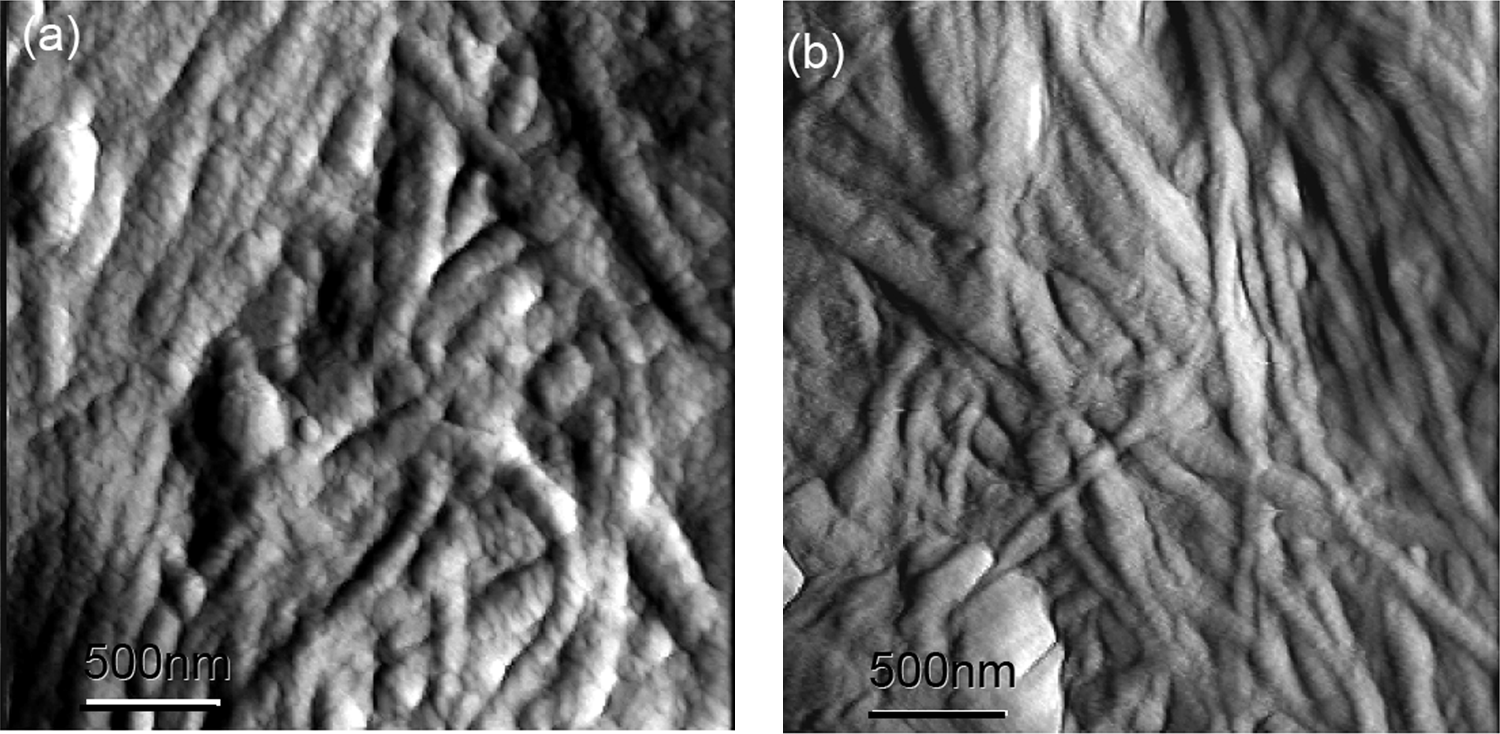
Upon a 1 s demineralization etch using 40 vol.% H3PO4, TMAFM amplitude images of the (
The parameters are compared between the native radial bone tissue and radial defect repaired utilizing genetically engineered MSCs.
Chemical analysis
Raman spectra for the cortical regions of the native and engineered radii showed similar structural compositions (Fig. 5a) and peaks characteristic of the mineral and organic phases for both types of bone. The increase in intensity for the amide I band in the engineered bone has been suggested to be due to an increase in nonreducible pyridinoline cross-link content in collagen. 38 An EDX analysis comparison indicates elemental composition and relative mineral content proportions in both types of bone to be very similar as well (Fig. 5b).
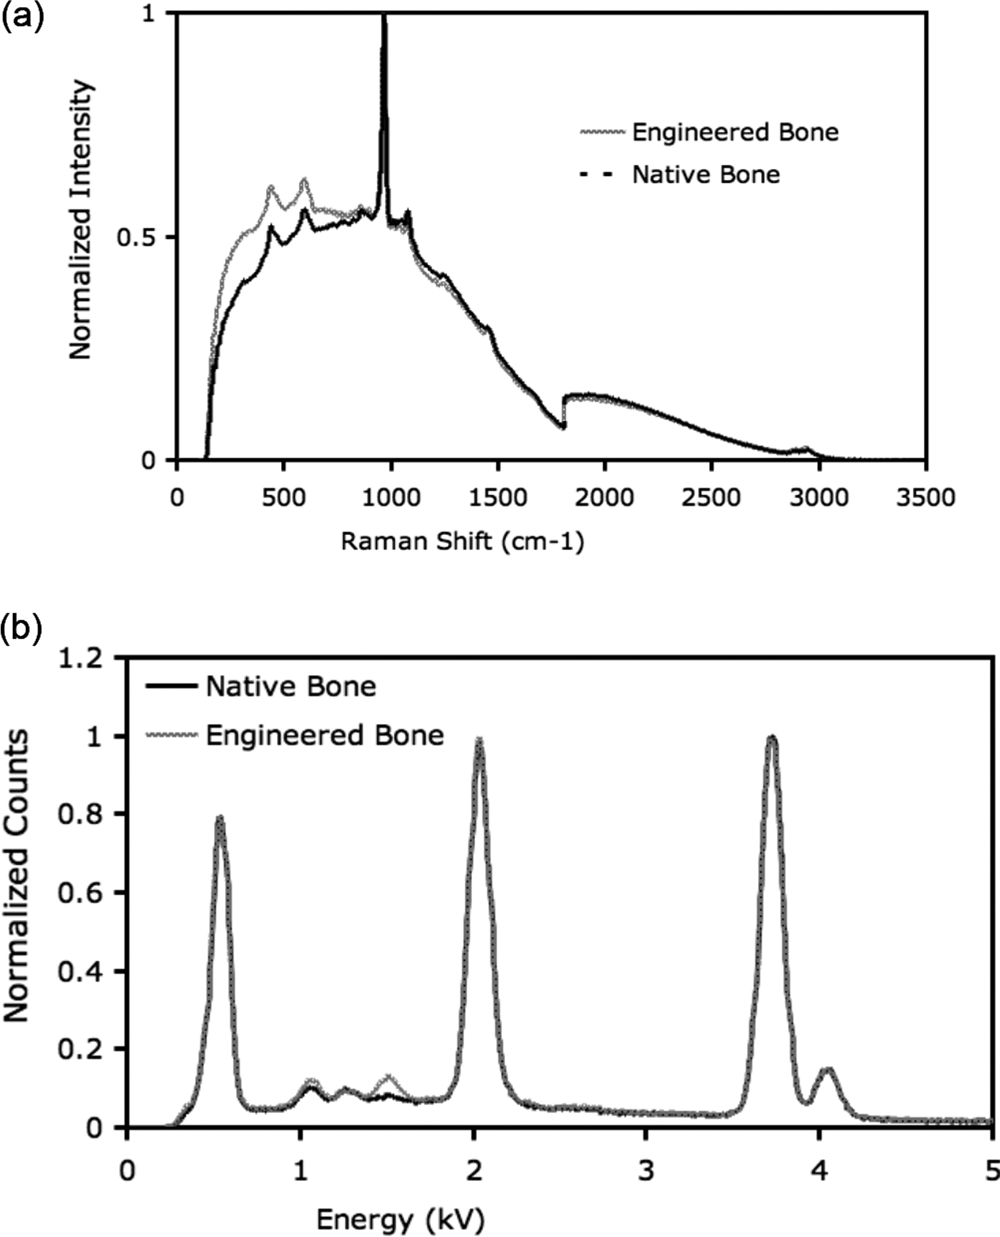
Raman spectra for the native radii and genetically engineered bone between 0 and 3500 cm−1 and expanded region between 1400 and 1700 cm−1. The notable peaks at 1080, 960, 595, and 435 cm−1 correspond to typical phosphate and carbonate bonding40,41 from the mineral phase. The most prominent peak at 960 cm−1, which corresponds to the phosphate ion P-O υ1 symmetric stretch, is observed in both bone materials. Peaks at 1445 and 1655 cm−1 specify the presence of a CH2 wag and amide I bond, respectively, from the organic phase (
Nanoindentation
Force versus indentation depth data on loading and unloading for one pair of the native radius and repaired radius (animal 4) were averaged and plotted together for two maximum loads 1000 (Fig. 6a) and 7000 μN (Fig. 6b) and showed inelasticity, as indicated by the finite residual depth after unloading, and energy dissipation, as indicated by the finite area between the loading and unloading curve (Fig. 6). Modulus values for the engineered and native bone ranged from 11.0 to 20.3 GPa and from 14.3 to 22.3 GPa, respectively, while hardness values for the engineered and native bone ranged between 0.65 and 1.0 and between 0.71 and 1.3 GPa, respectively (Fig. 7). Paired t-tests on the mean values of modulus and hardness for each of the six mice (as independent measurements, n = 6) at each maximum load showed that moduli at both 1000 and 7000 μN were statistically similar (p = 0.45 and p = 0.48) comparing the engineered and native radial bone. Hardness values at 1000 μN were found to be marginally statistically different (p =0.0428), while at 7000 μN the engineered and native radial bone were statistically similar (p = 0.48). The distribution of calculated modulus and hardness values (Fig. 8) for both types of bone has a wider distribution at 1000 μN maximum loads as compared to 7000 μN loading. Stiffness values exhibited a more bimodal distribution in the engineered bone as compared with the native radial bone.
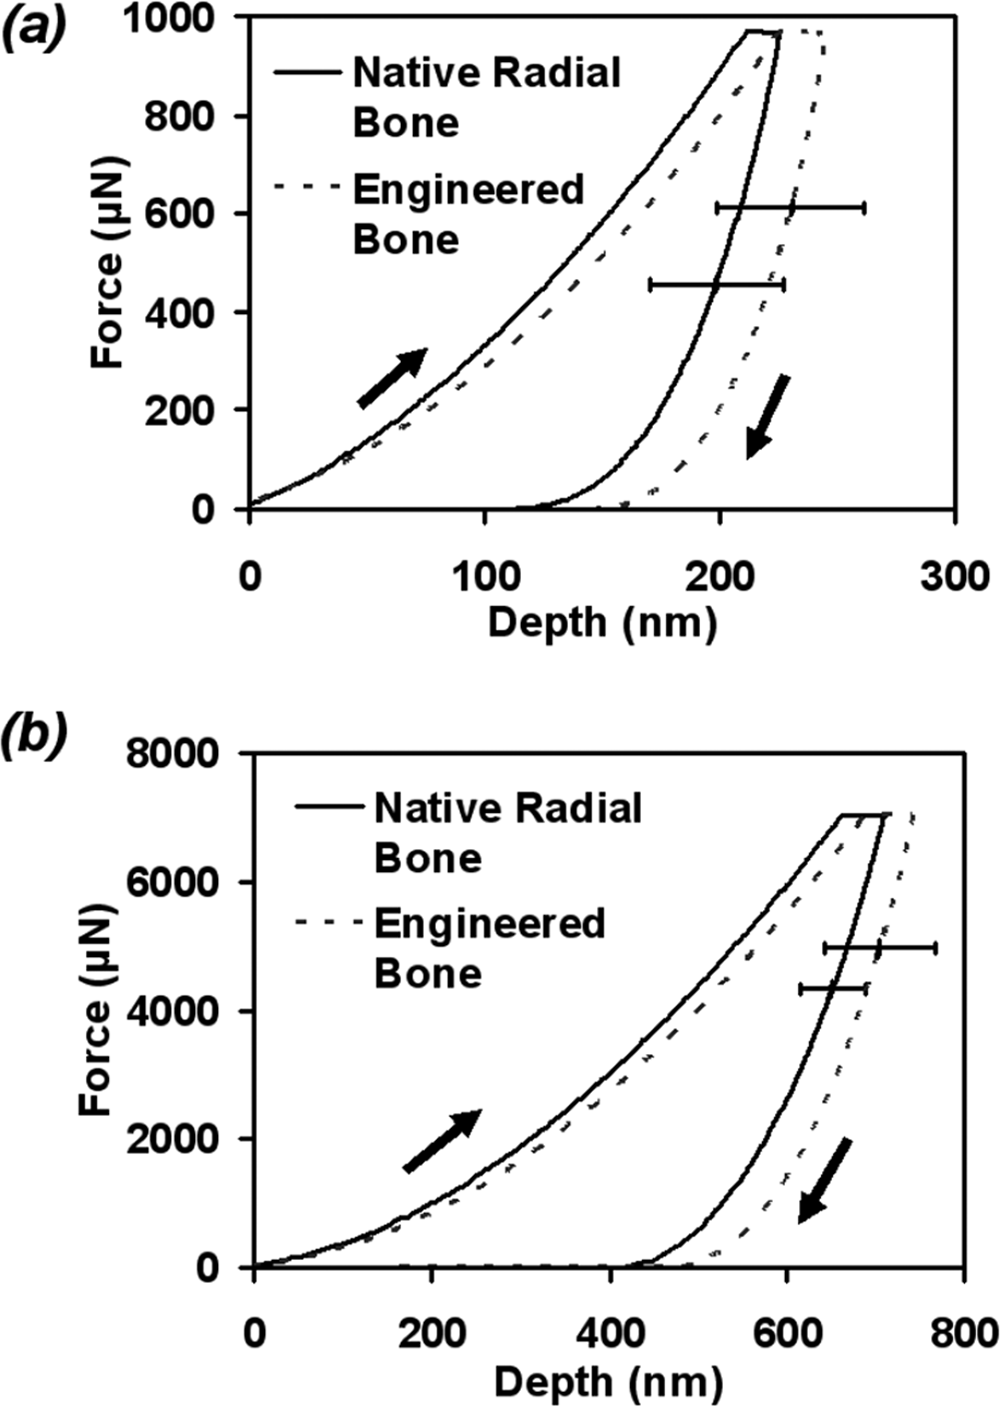
Typical nanoindentation data on loading (arrow pointing upward) and unloading (arrow pointing downward) using a Berkovich probe tip comparing native radial and genetically engineered bone from one particular mouse (#4). Nanoindentation experiments involve the controlled compression of a relatively rigid diamond probe tip into a softer sample of interest (in this case, bone tissue), while simultaneously recording the penetration force required for the probe tip to elastically and plastically deform the bone (plotted on the ordinate) and the corresponding depth of penetration (plotted on the abscissa). The greater the magnitude of the depth for a given force, the more deformable the tissue is. The indentation stiffness and hardness were estimated from these data according to the Oliver-Pharr method.
36
Maximum loads of (
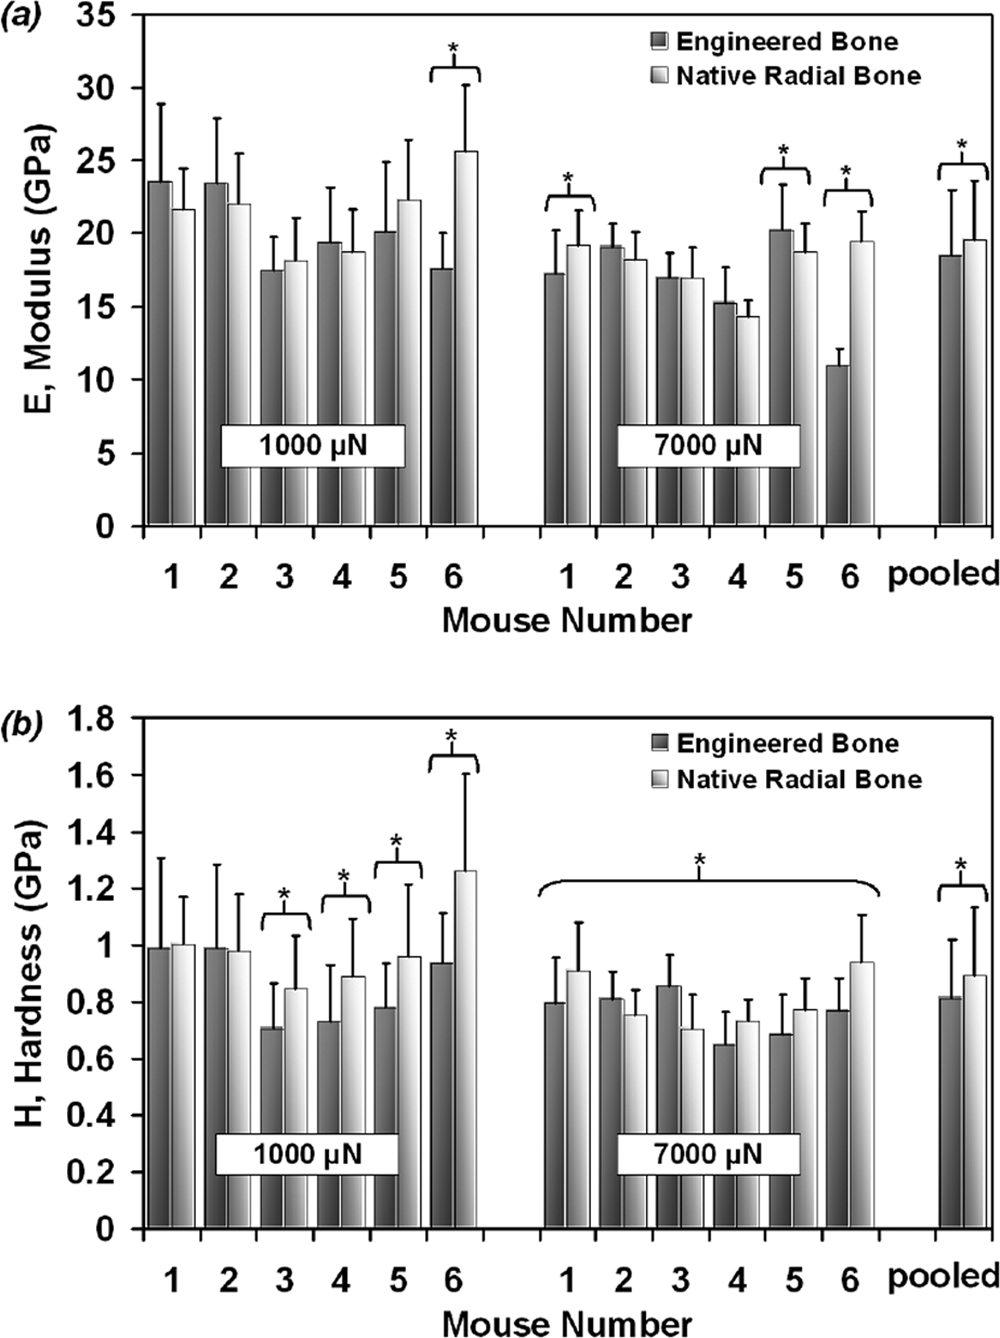
Indentation (
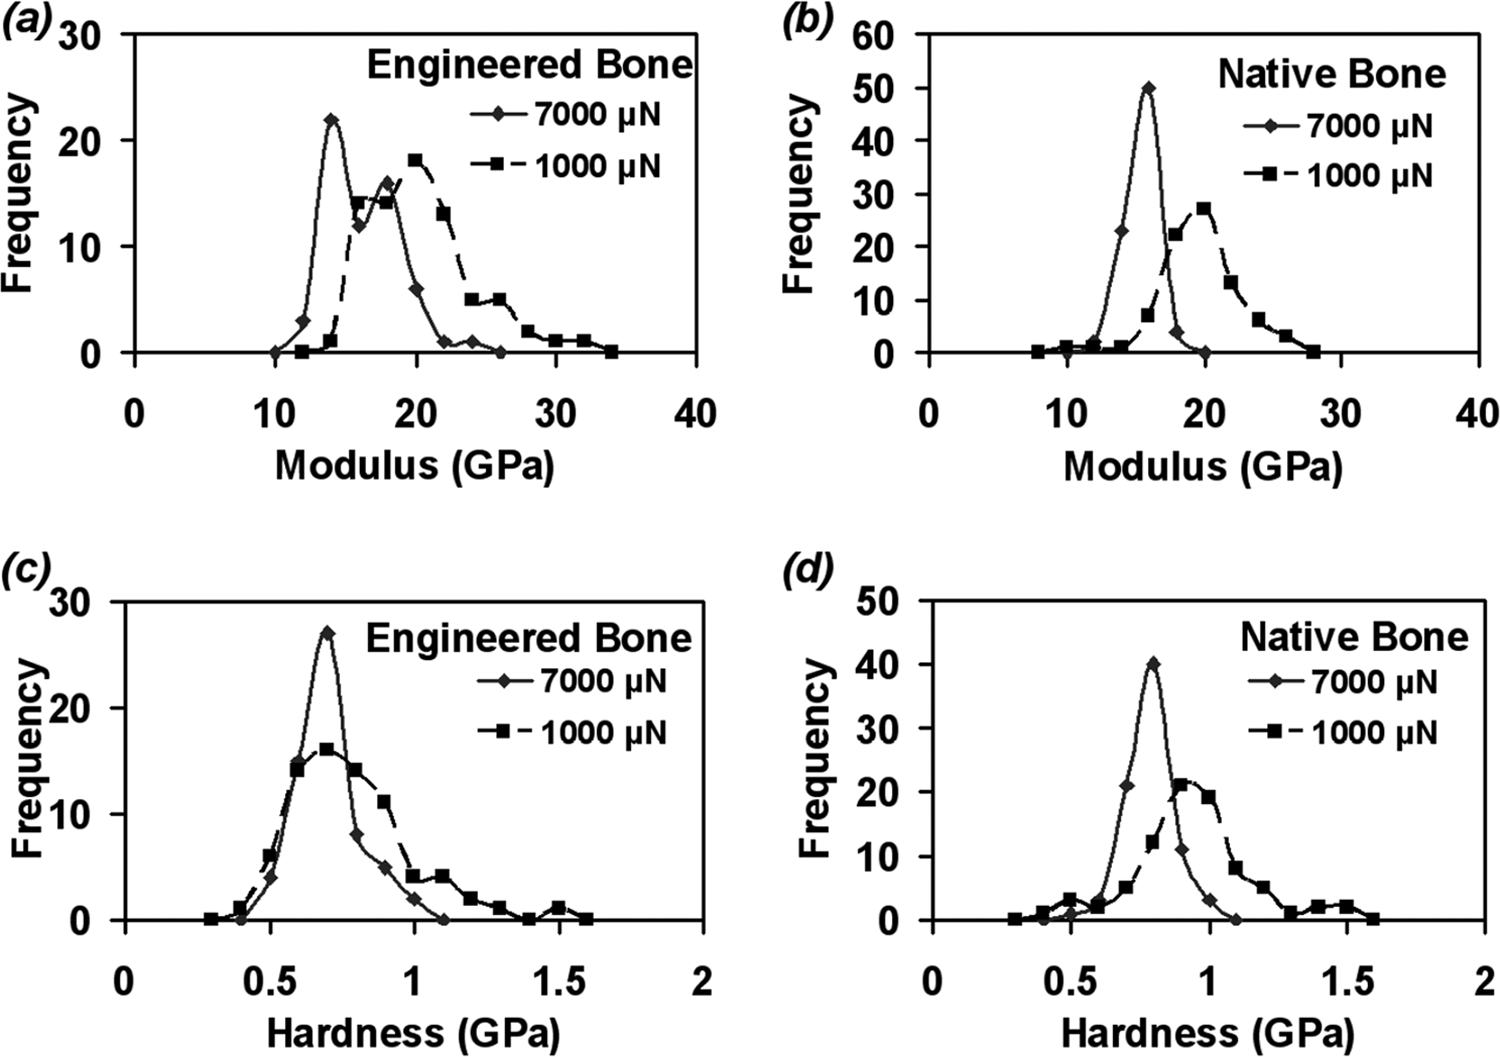
Histograms of calculated (
Coefficient of variation (COV) analyses were also performed, comparing the COV of modulus and hardness values for indentations for both the native radial and engineered bone at 1000 and 7000 μN maximum loadings (Fig. 9). Modulus COV values ranged between 0.09 and 0.24 for the engineered bone and 0.08 and 0.19 for the native radial bone. Hardness COV values ranged between 0.12 and 0.32 for the engineered bone and between 0.11 and 0.28 for the native radial bone. For indentations at 1000 μN maximum load, the modulus COV was greater for mouse numbers 1, 2, 4, and 5. For indentations at 7000 μN maximum load, the modulus COV was greater for mouse numbers 1, 4, and 5. In general, the modulus COV values were greater for engineered bone as compared to native radial bone. The modulus COV values were also generally greater for indentations at maximum loads of 1000 μN as compared to 7000 μN. For indentations at 1000 μN maximum load, the hardness COV was greater for mouse numbers 1, 2, 3, and 4. For indentations at 7000 μN maximum load, the hardness COV was greater for mouse numbers 1, 2, 4, and 5. Similar to the modulus COV values, the hardness COV values were typically greater for engineered bone as compared to native radial bone. All parameters retrieved from the nanoindentation and nanomechanical tests are also summarized in Table 1.
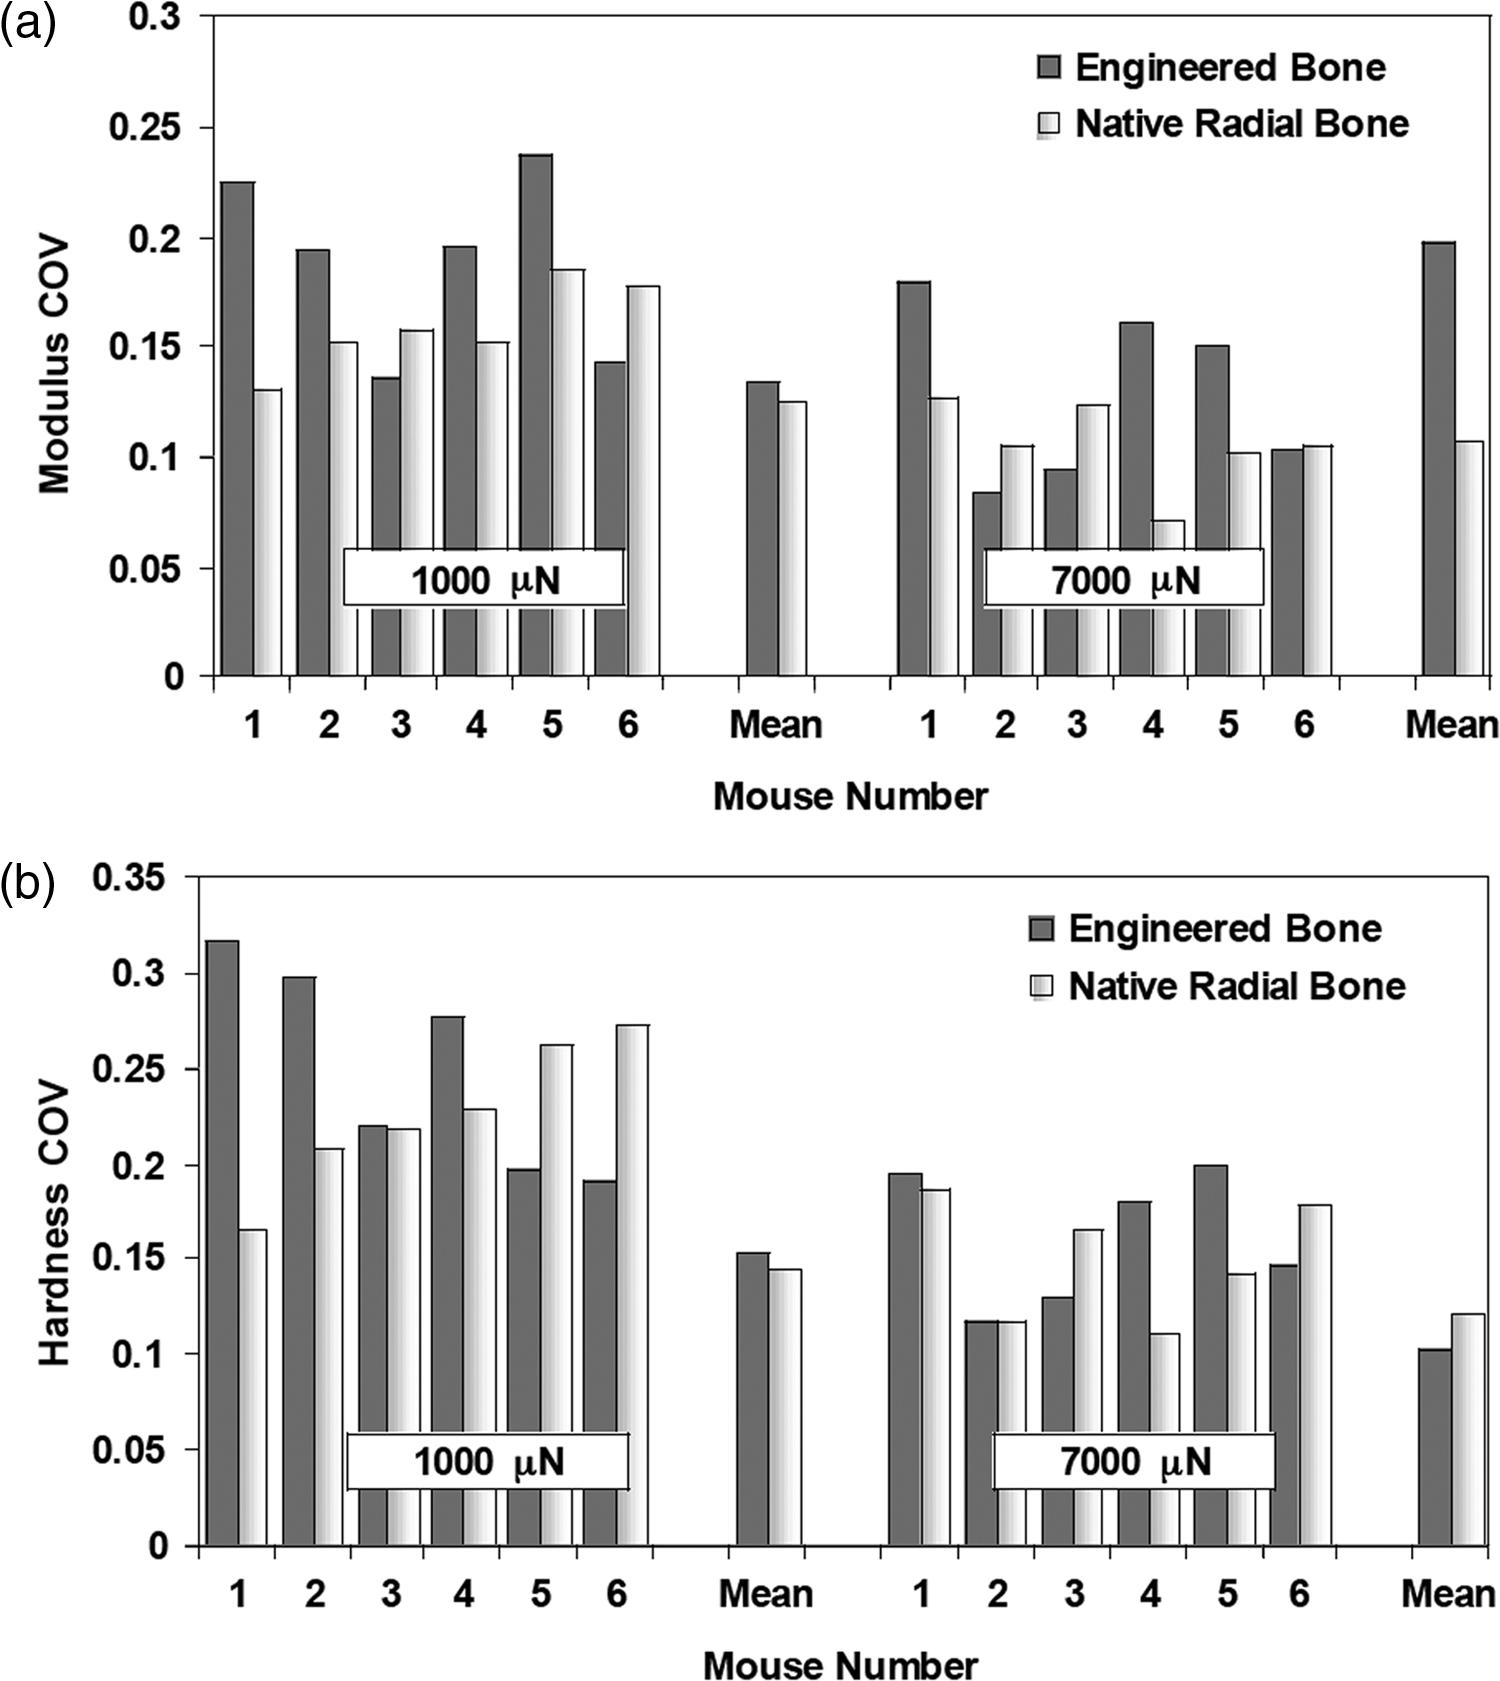
COV plotted for six different bone sample pairs for (
Discussion
Nanomechanical methods have previously been shown to be viable for quantification of small volumes of tissue-engineered bone produced in vivo. A previous study utilized similar nanomechanical technique to that reported in analyzing engineered bone grown in an ectopically implanted (thigh muscle) site. 33 This study is a step further in assessing a system that mimics a massive nonunion bone defect in a weight-bearing site. Mineral content, chemical structure, and elemental composition were found to be similar for the engineered bone compared to its corresponding native control. Nanoindentation data in this study showed that, in general, the native bone exhibited a statistically similar elastic modulus values compared to that of the engineered bone. This result is different from our previous study on engineered bone that was formed in an ectopic implantation site, and was found to have statistically different elastic moduli compared to native radius bone. 33 The values obtained for the radius bone (14.3–22.3 GPa) is somewhat lower than that reported in the literature for native radius mouse cortical bone loaded in the same direction using nanoindentation that was found to be 35.2–43.5 GPa 33 and may be due to the effects of alcohol and/or dehydration used in these studies. 20 Nanoindentation measurements both here and in our previous study 33 were carried out in cortical-like regions away from lacunae (Fig. 3, and Figs. 3, 4, and 10 of our previous study 33 ), so smaller length scale structural features (less than the size of the maximum contact area ∼1 μm2) are likely responsible for the differences observed in the ectopic system between the native and engineered bone, for example, the fine details of the mineralized collagen fibrils. Since the mineral content and nanoscale morphology were similar for both types of bone, these parameters are not expected to be responsible for these material property trends. Hence, differences (in the ectopic system) could arise from (1) variations in the overall organization and interactions between the organic and mineral constituents and/or (2) variation in the composition and/or supramolecular structure of the organic component. We speculate that the similarity in mechanical properties described in this study could be caused by a difference in either mechanical loading or the environmental conditions of the bone defect site opposing to the intramuscular ectopic site. Even though the radius is not as weight-bearing bone as the neighboring ulna, the engineered bone would most certainly receive some load, stimulating cell migration and subsequent orientational bone growth. Ongoing nanotechnological studies provide a promising pathway to further investigate both of the above hypothesis, including high resolution TMAFM imaging as a function of acid demineralization 20 and chemically and spatially specific high resolution force spectroscopy. 39 Lastly, the engineered bone also exhibited a more heterogeneous distribution of material properties likely because the overall structure seems to exhibit a lesser degree of regularity than the radial bone. It is expected for modulus COV values to be generally greater for engineered bone as compared to native radial bone since a greater biological heterogeneity tends to be exhibited in engineered bone. Similarly hardness COV values are typically greater or the same for engineered bone as compared to native radial bone.
Coupled with the appropriate chemical analyses, the nanomechanical methods presented here have been shown to probe and measure the fine nanoscale details not accessible by traditional biomechanical techniques and have a great potential for evaluation of optimization of site-specific bone formation and healing for the treatment of fracture- and disease-induced defects. Future studies can involve the analysis of engineered bone generated in membranous and endochondral bone defect sites, such as the calvaria and the femoral bone, or in different therapeutic models like spine fusion. In addition, various approaches in bone tissue engineering such as protein or direct gene therapy can be assessed in terms of the bone tissue quality that can be induced in vivo. Moreover, the results obtained by nanoscale analysis should be correlated to macro scale biomechanical analysis. Indeed, ongoing studies in our laboratories are focused on the use of biomechanical evaluation of engineered bone in a radius defect using μCT-based finite element model.
Footnotes
Acknowledgments
The Whitaker Foundation and the MIT Institute for Soldier Nanotechnologies (Contract No. DAAD-19-02-D0002) via the U.S. Army Research Office provided funding for this research. The content does not necessarily reflect the position of the government, and no official endorsement should be inferred. The authors would like to thank the Center for Materials Science and Engineering at MIT and the MIT Nanomechanical Technology laboratory for facilities use.