
Abstract
Endothelial progenitor cell (EPC) transplantation is a promising treatment option for ischemic diseases, and understanding the mechanism mediating angiogenic effects of EPCs is essential to further improve its effectiveness as well as their application to in vitro tissue engineering. Here we investigated EPC contribution on network formation using an in vitro three-dimensional network model. Bovine microvascular endothelial cells (ECs) were seeded on collagen gel to create a three-dimensional network model. Subsequently, EPCs isolated from rat bone marrow were seeded on top of a confluent endothelial cell (EC) monolayer to create EPC + EC model. In this model, EPCs promoted EC network formation. Quantitative analyses revealed that the total length, number, and depth of networks were significantly enhanced with the addition of EPCs. EPCs tended to localize in networks formed inside collagen gel rather than on a confluent monolayer with increasing experimental duration. In addition, EPCs preferentially distributed near sprout positions in a confluent monolayer. Furthermore, EPC-conditioned medium promoted network formation, and vascular endothelial growth factor was detected in the conditioned medium. Taken together, EPCs contributed to network formation by direct incorporation with on-site growth factor secretion. The angiogenic ability of EPCs offers a possible cell source to reconstruct vascularized tissues in vitro.
Introduction
In 1997, endothelial progenitor cells (EPCs) were identified in adult human peripheral blood as mononuclear hematopoietic progenitor cells that differentiated into ECs in culture. 4 EPCs originate from bone marrow and are released into the peripheral circulation by a variety of physiological or pathological signals.5–7 Because the cells can be isolated from peripheral blood, bone marrow, and umbilical cord blood,8,9 EPCs have been utilized for the treatment of ischemic diseases to promote neovascularization. Previous studies demonstrated that intravenous injection of cultured EPCs into animal models of ischemia resulted in EPC incorporation to the ischemic tissue and remarkable regeneration of blood vessels with improvement of regional blood flow.4,5,10 Transplantation of EPCs into cardiac tissues was also effective to ischemic heart diseases. 11 These phenomena suggest that in addition to the vascular sprouts from preexisting blood vessels (angiogenesis), recruitment of EPCs from the circulation and their in situ differentiation (vasculogenesis) also play an important role in adult neovascularization. 12
Although EPC transplantation has shown promises in the treatment of ischemic diseases, the treatment presents several limitations. First, large amounts of blood or bone marrow are required to achieve an effective treatment.10,13 For example, a blood volume of as much as 12 L was estimated to obtain adequate numbers of EPCs to treat critical limb ischemia in patients. 8 Second, the number of EPCs is reduced in patients with cardiovascular risk factors and diabetes. In addition, the abilities of EPCs for proliferation, adhesion, and tube formation are attenuated in such patients.14,15 Consequently, current approaches for the EPC transplantation focus on local cell delivery to ischemic tissues, culture-expansion of EPCs, and enhancement of EPC functions. 8 To improve EPC transplantation technique, understanding the mechanism mediating angiogenic effects of EPCs is essential. However, detailed mechanisms of EPC contribution remain to be clarified. It is therefore important to investigate EPC behaviors in the process of network formation using an in vitro three-dimensional (3D) culture model.
The EPC culture model is also important in the field of tissue engineering because vascularization of tissue-engineered constructs has been increasingly important. EPCs have ability to promote neovascularization, which suggests their potential for vascular tissue engineering. Kaushal et al. 16 reported that EPCs replaced arterial ECs and promoted the survival of tissue-engineered small-diameter (4 mm) blood vessels. Sieminski et al. 17 reported that EPCs formed more 3D capillary-like structures than mature ECs when they were embedded in collagen gel. Emerging evidence suggests that the beneficial effects of EPCs on vascular growth can be attributed to the paracrine activation of preexisiting ECs and their direct incorporation to vascular formation in animal models of ischemia. 7
Here we investigated contribution of EPCs on capillary formation with an in vitro 3D network model. EPCs were isolated from rat bone marrow and added to the 3D network model composed of bovine pulmonary microvascular ECs. Because EPCs promote neovascularization in vivo, the cells also promoted network formation in vitro. ECs formed extensive networks with EPCs, which localized near networks. Furthermore, conditioned medium (CM) of EPCs promoted network formation, and vascular endothelial growth factor (VEGF) was detected in CM. Our finding demonstrated that EPCs contribute to network formation by creating local growth factor concentration with direct incorporation. This culture model is useful not only for understanding the mechanism of EPC contribution to the neovascularization, but also for investigating its application to vascular tissue engineering.
Materials and Methods
EPC isolation and culture
Bone marrow was obtained by flushing tibias and femurs of Sprague-Dawley rats (8–12 weeks old). Mononuclear cells were isolated from the bone marrow by density gradient centrifugation using Histopaque-1083 (Sigma-Aldrich, St. Louis, MO). The cells were seeded on a vitronectin (Sigma-Aldrich)–coated culture dish (2.5 × 10⁷ cells/35-mm dish), and cultured in a humidified, 5% CO2 incubator at 37°C. The culture medium used for the EPC isolation is referred as “EGM-isolation,” which is modified microvascular EC growth medium-2 (EGM-2MV; fetal bovine serum [FBS] and hydrocortisone in the supplement kit were not used; Lonza, Walkerville, MD) supplemented with 20% FBS. After 5 days of culture, nonadherent cells were removed by rinsing with PBS, and the attached cells were cultured with replacing the medium twice a week.
EPC characterization
The phenotype of the isolated EPCs was confirmed by lectin binding and uptake of acetylated low-density lipoprotein (acLDL). EPCs were incubated with DiI-conjugated acLDL (DiI-acLDL; Invitrogen, Carlsbad, CA) for 1 h. After fixation with 2% paraformaldehyde for 10 min, the cells were incubated with FITC-conjugated lectin (UEA-1 lectin; Sigma-Aldrich) for 1 h. The cells were photographed with a phase-contrast microscope equipped with a fluorescent device. To further confirm the EPC phenotype, the adherent cells were trypsinized at day 7 and seeded on Matrigel (BD Biosciences, Bedford, MA). The cells were observed for the formation of two-dimensional (2D) capillary-like structures. The cell population that was positive for both DiI-acLDL and UEA-1 lectin and that formed 2D networks on Matrigel were deemed to be EPCs.6,10
EC culture
Bovine pulmonary microvascular ECs were obtained from Cell Systems (Kirkland, WA). The cells were expanded with DMEM supplemented with 10% FBS, 15 mM HEPES, and antibiotics, and used for experiments at passages 5–10.
In vitro 3D network models
An in vitro 3D network model was prepared as described previously. 18 Collagen gels were prepared as follows: 8 volumes of 3 mg/mL type I collagen solution (Cellmatrix Type I-A; Nitta Gelatin, Osaka, Japan) were mixed with 1 volume of 10 × minimum essential medium (Invitrogen) and 1 volume of 0.08 N sodium hydroxide on ice. The mixture was then poured into a 35-mm culture dish and placed in a humidified, 5% CO2 incubator at 37°C. After incubating for 3 h, ECs were seeded on the collagen gel at the density of 2 × 10⁵ cells/dish. The cells reached 80% confluency in 48 h, and then culture medium was switched from the DMEM to EGM-model, which is the modified EGM-2MV supplemented with 10% FBS and 20 ng/mL basic fibroblast growth factor (bFGF; PeproTech, Rocky Hill, NJ). bFGF is a major angiogenic growth factor and induces capillary formation by the induction of collagenase production in cultured ECs.19,20 The cells reached confluency in 12 h after switching media and were used for experiments. The 3D network model is referred as “EC model” (Fig. 1A).
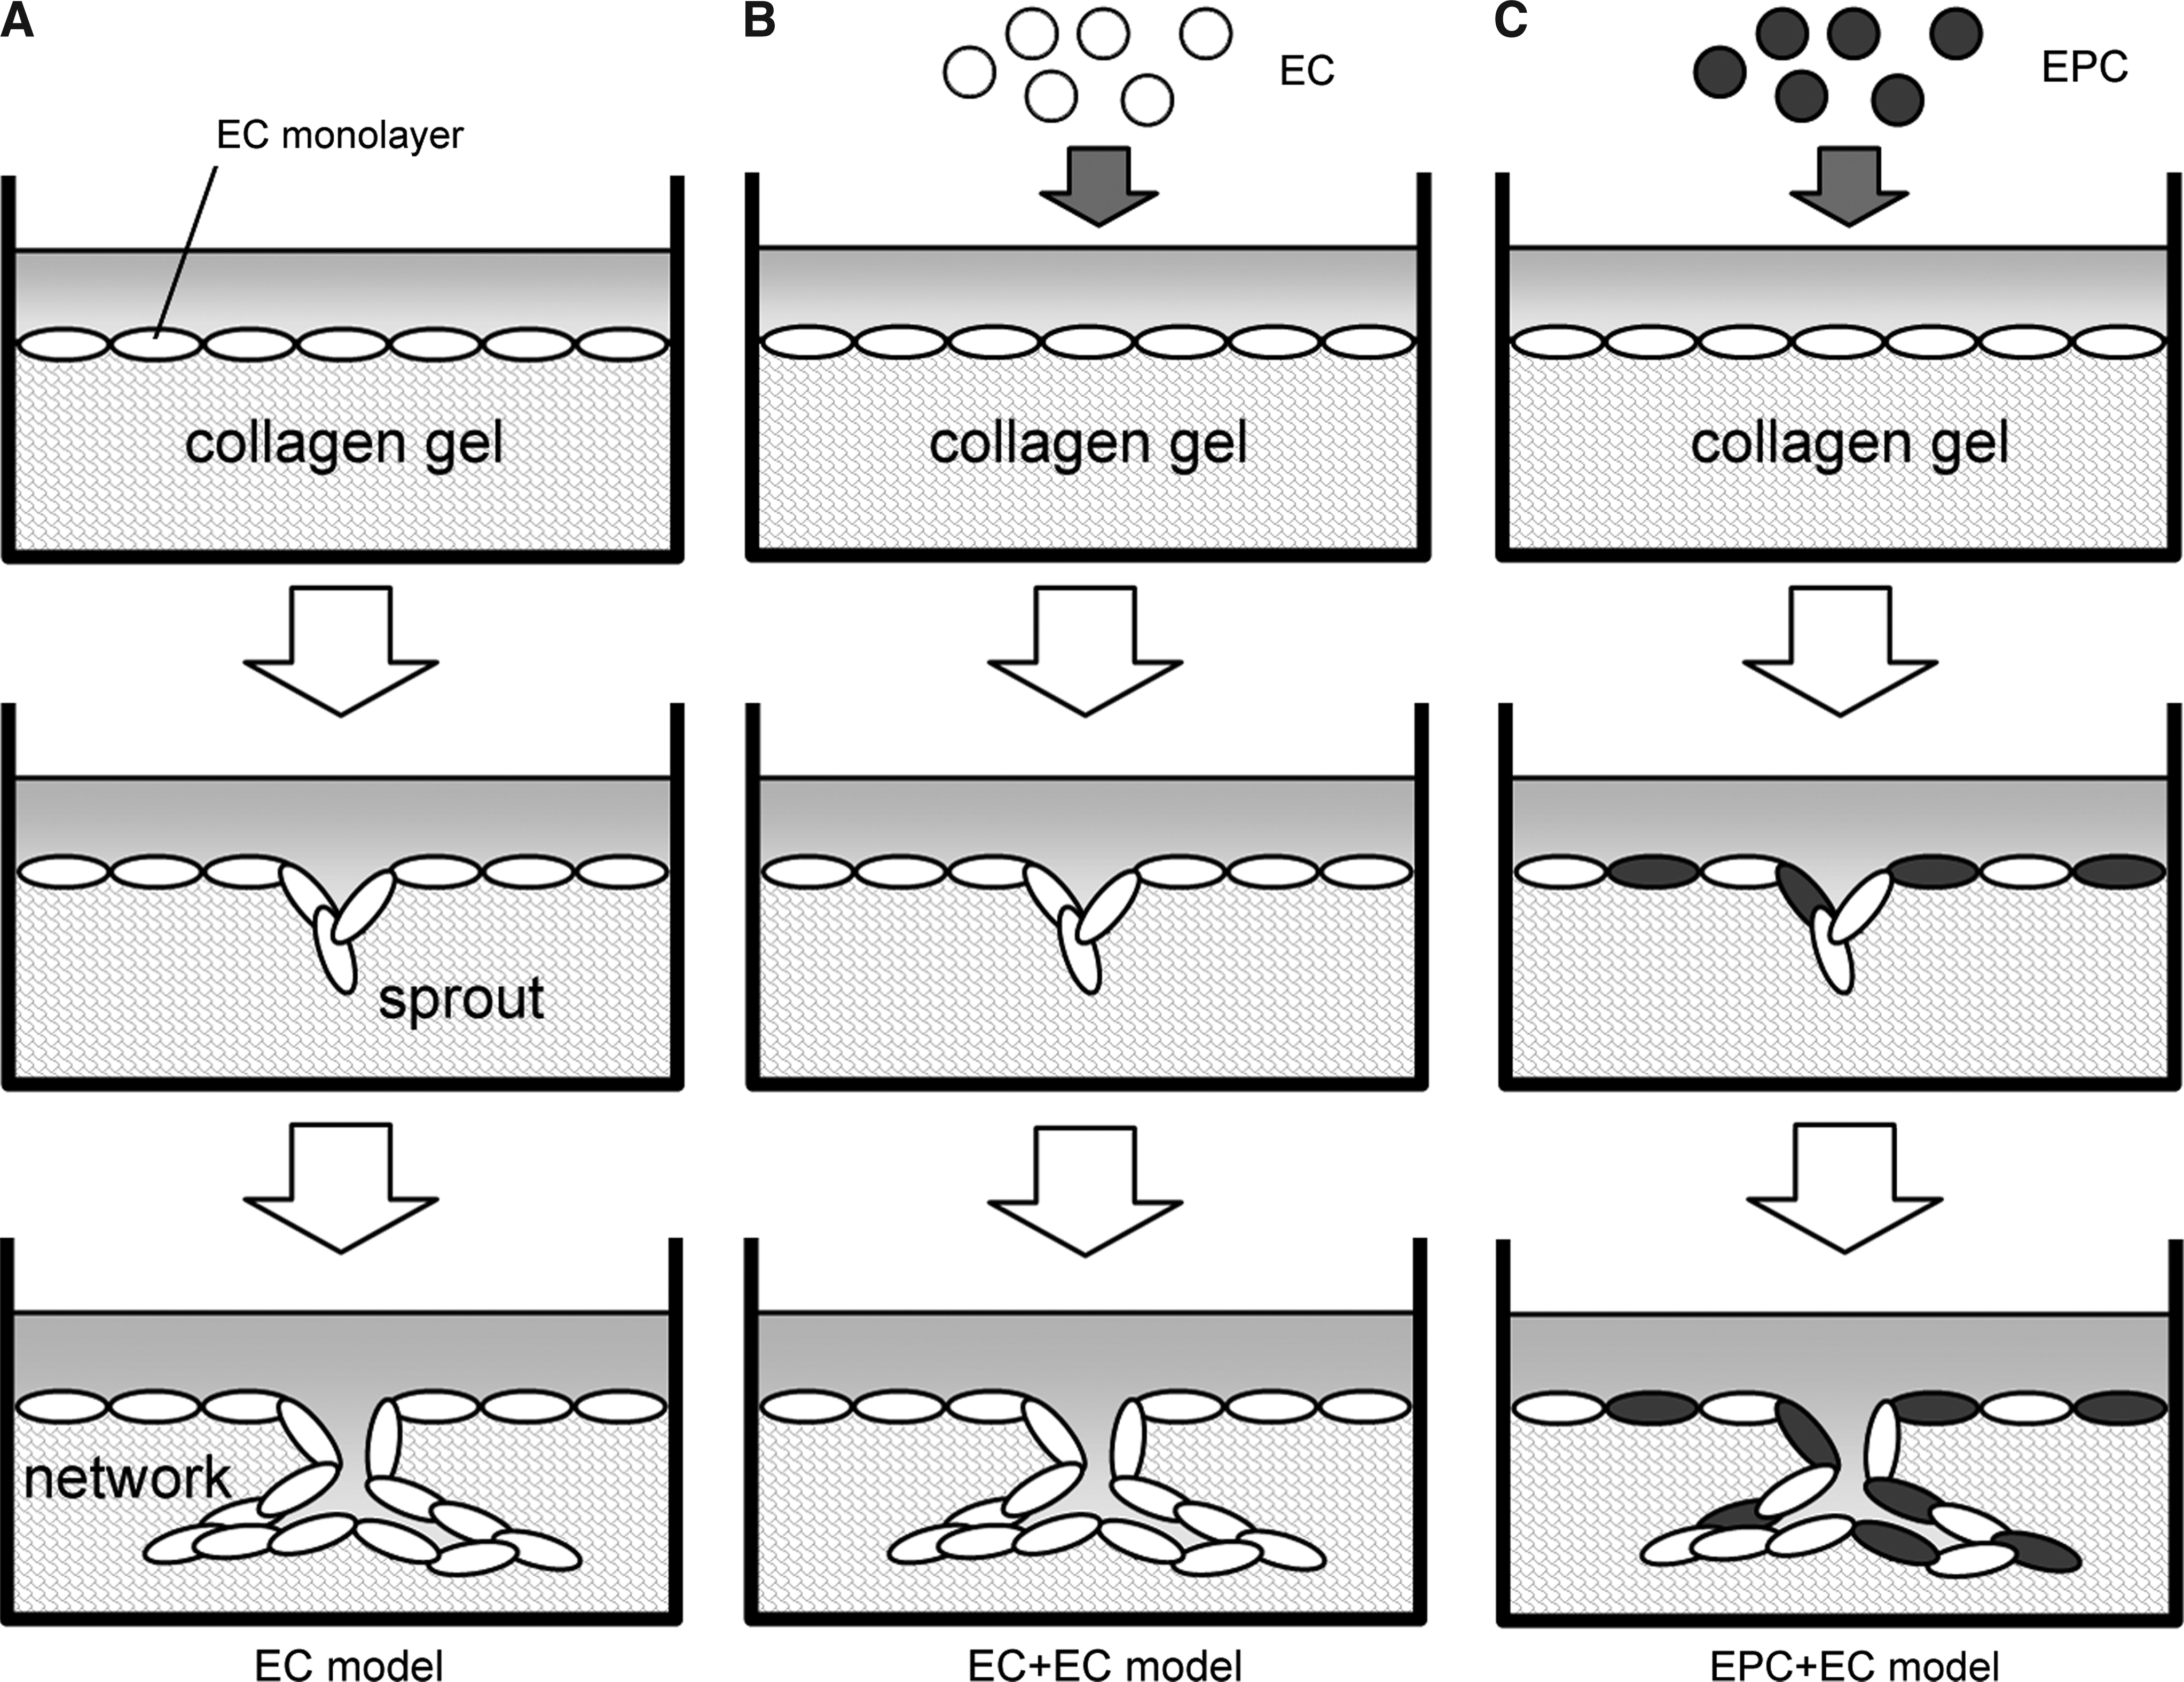
Three-dimensional network models. (
To investigate the effect of EPCs on EC network formation, EPCs were added to the EC model. Although we added rat EPCs to the 3D network model of bovine ECs, it was reported that heterologous EPCs promoted neovascularization in animal models.4,15 EPCs, cultured for 7 days, were labeled with DiI cell-labeling solution (Invitrogen) and seeded on top of an EC confluent monolayer at the density of 2 × 10⁵ cells/dish (EPC + EC model; Fig. 1C). As a control experiment, ECs, instead of EPCs, were also added to the EC model (EC + EC model; Fig. 1B). In these models, cells were cultured in the EGM-model and the medium was changed every other day.
Analysis of network formation in 3D network models
Cells in the 3D network models were monitored for 5 days by bright-field and phase-contrast microscopy. The image fields were randomly selected, and the total length and number of networks in each field were measured using ImageJ software. 21 For 3D analysis, cells in the 3D network models were stained with CellTracker Green BODIPY (CellTracker; Invitrogen) to observe cells in a confluent monolayer and in networks. After cells formed 3D networks, the cells were incubated with 25 μM CellTracker for 45 min at 37°C. The cells were then photographed at 5 μm depth intervals using a confocal laser scanning microscope (MRC-600; Bio-Rad Laboratories, Hercules, CA).
Effect of EPC CM on network formation
To investigate the effect of soluble growth factors secreted by EPCs on network formation, we collected CM of the EPC + EC model at days 3 and 5. As a control experiment, CM of the EC model were also collected. The CM were mixed 1:1 with fresh medium (DMEM supplemented with 20 ng/mL bFGF) and used for the culture of the EC model. Cells were photographed at day 5, and analyzed to measure the total network length in each image.
Measurement of VEGF secretion
Rat VEGF concentration in CM of the EPC + EC and EC + EC models, and the EGM-model medium was measured using an enzyme-linked immunosorbent assay (ELISA) kit, which detects various isoforms of rat VEGF (RayBiotech, Norcross, GA). Because we added rat EPCs to the 3D network model of bovine ECs, it is possible to detect VEGF secreted by EPCs in the EPC + EC model with a specific antibody against rat VEGF.
Effect of VEGF concentration on network formation
To investigate the effect of VEGF concentration on network formation, the EC model was performed with the EGM-model supplemented with 1, 5, and 20 ng/mL VEGF (Recombinant human VEGF; PeproTech). After 5 days of culture, the cells were photographed and analyzed to measure the total length and number of networks in each image.
EPC distribution in the EPC + EC model
To examine how EPCs physically incorporated into the EC network, we measured the amount of EPCs in a confluent monolayer and that in networks. At days 3 and 5, the cells in the EPC + EC model were stained with CellTracker, and were photographed at 5 μm depth intervals using a confocal laser scanning microscope. All cells, including EPCs and ECs, were stained with CellTracker (green), while EPC location was identified by detecting DiI-labeled cells (red). The ratio of the EPC area to a confluent monolayer or networks was measured using z-axis projection images focusing on a confluent monolayer or networks, respectively.
The EPC distribution in a confluent monolayer was also analyzed focusing on the correlation between the EPC and network distributions. Phase-contrast and fluorescent images of the same field in the EPC + EC model were daily taken until day 5. Phase-contrast images at days 1–3 were used to determine sprout positions, where cells began to invade into underlying collagen gel. Fluorescent images were used to monitor the distribution of DiI-labeled EPCs on a confluent monolayer. To quantify the co-localization of EPCs and networks, we measured the density of EPC area in regions near networks and far from networks, separately. The area near networks was defined as a region within 50 μm from the sprout positions, and the remaining region was defined as the area far from networks. The network areas were not included in measuring areas not to count the EPCs embedded in networks.
VEGF neutralization in the EPC + EC model
To investigate the effect of VEGF secreted by EPCs on the network formation, the bioactivity of the secreted VEGF was neutralized by recombinant mouse VEGF receptor 1 (Flt-1/Fc chimera; R&D Systems, Minneapolis, MN). The VEGF receptor 1 was added to both culture medium and collagen gel in the EPC + EC model at the concentration of 5 μg/mL as measured in a previous study. 22 The EC model was cultured as a control experiment. The total length of networks in each field was measured as described above, and a network length was normalized to that in the EPC + EC model.
Statistical analysis
Data are presented as means ± SD. Student's t-test was used to test for differences, which were considered significant at an error level of p < 0.05.
Results
Isolation and characterization of EPCs
Mononuclear cells isolated from rat bone marrow adhered on a vitronectin-coated surface in 5 days. The attached cells exhibited spindle shape (Fig. 2A) and formed loosely associated colonies. The cells proliferated and formed a cobblestone-like monolayer in 10 days (data not shown). The phenotype of the attached cells was confirmed by the DiI-acLDL uptake and UEA-1 lectin binding. As shown in Figure 2, the attached cells were positive for both DiI-acLDL and UEA-1 lectin, the markers of EPCs. In addition, we confirmed the capillary formation capability of the attached cells using the Matrigel network formation assay. When the attached cells were collected at day 5 and seeded on Matrigel, they formed 2D networks on Matrigel within 2 days (Fig. 2E).

EPC characterization. (
Network formation in 3D network models
To investigate the effect of EPCs on network formation, an in vitro 3D network model with ECs and EPCs was used. First, ECs were seeded on collagen gel, and culture medium was switched from the EGM-isolation to the EGM-model when they reached subconfluency. When ECs formed a confluent monolayer (Fig. 3A), DiI-labeled EPCs were added on top of the monolayer. Both EPCs and ECs started to invade the underlying collagen gel and formed vascular sprouts on the next day (Fig. 3B). The vascular sprouts extended into the gel and developed into branching networks (Fig. 3C). Small networks were connected to one another, resulting in a larger network (Fig. 3D, E).

Network formation in the 3D network model. (
The growth of the networks in the EPC + EC model was monitored daily until day 5, and the total length and number of the networks were measured (Fig. 4). As a control experiment, the EC model and the EC + EC model were cultured. In the EPC + EC model, cells formed anastomosing networks in 5 days (Fig. 4D–F). In contrast, cells in the EC + EC model only established small networks at day 5 (Fig. 4A–C). The network formation in the EC model was similar to that in the EC + EC model (data not shown). Quantitative analysis clearly delineated the different growth of the networks in these models. In the EPC + EC model, the total length of the networks increased significantly more than that in the EC + EC and EC models (Fig. 4G). The networks in the EPC + EC model extended approximately four times greater than those in the EC + EC and EC models at day 5. The number of the networks also increased over time in culture (Fig. 4H). The number of the networks formed in the EPC + EC model was 43.7 ± 9.8 at day 4, while the number in the EC + EC model was 24.9 ± 6.0. However, the number of the networks in the EPC + EC model decreased from day 4 to 5 (Fig. 4H). We detected no different morphogenesis between the EPC + EC model and the EC model.

Different network formation in the EC + EC and EPC + EC models. (
To further investigate the 3D structure of the network, the cells in the EPC + EC model were labeled with CellTracker at day 5 and fluorescently imaged with a confocal laser scanning microscope. The cells formed 3D capillary-like structures expanding within collagen gel (Fig. 5B) as well as a confluent monolayer (Fig. 5A). Filopodia were often observed at the tip cells of networks (Fig. 5B, arrowheads). In addition, the cross-sectional image of the networks revealed that some cells invaded ∼100 μm into the gel, while most of the invading cells migrated 30–50 μm below the confluent monolayer (Fig. 5C). In the EPC + EC model, the deepest network reached a depth of 85 ± 15 μm and that in the EC model reached a depth of 47 ± 8 μm (Fig. 5D). Only the EC model was used as a control experiment because there was no significant difference between the EC model and the EC + EC model as shown in Figure 4.

Representative 3D projection image of networks. Cells were labeled with CellTracker, and z-axis sequential images were taken by confocal laser scanning microscopy. (
Effect of EPC CM on network formation
To investigate whether or not EPCs produced angiogenic soluble factors, ECs were cultured with CM from the EPC + EC and EC models. When ECs were cultured with CM from the EPC + EC model, they formed larger networks than those formed by ECs cultured with CM from the EC model alone (Fig. 6). Quantitative analysis of the network formation at day 5 revealed that the total network length with CM from the EPC + EC model was ∼2.5 times greater than that with CM from the EC model. Although CM from the EPC + EC model promoted network formation, the network formation activity was smaller than that in the EPC + EC model.
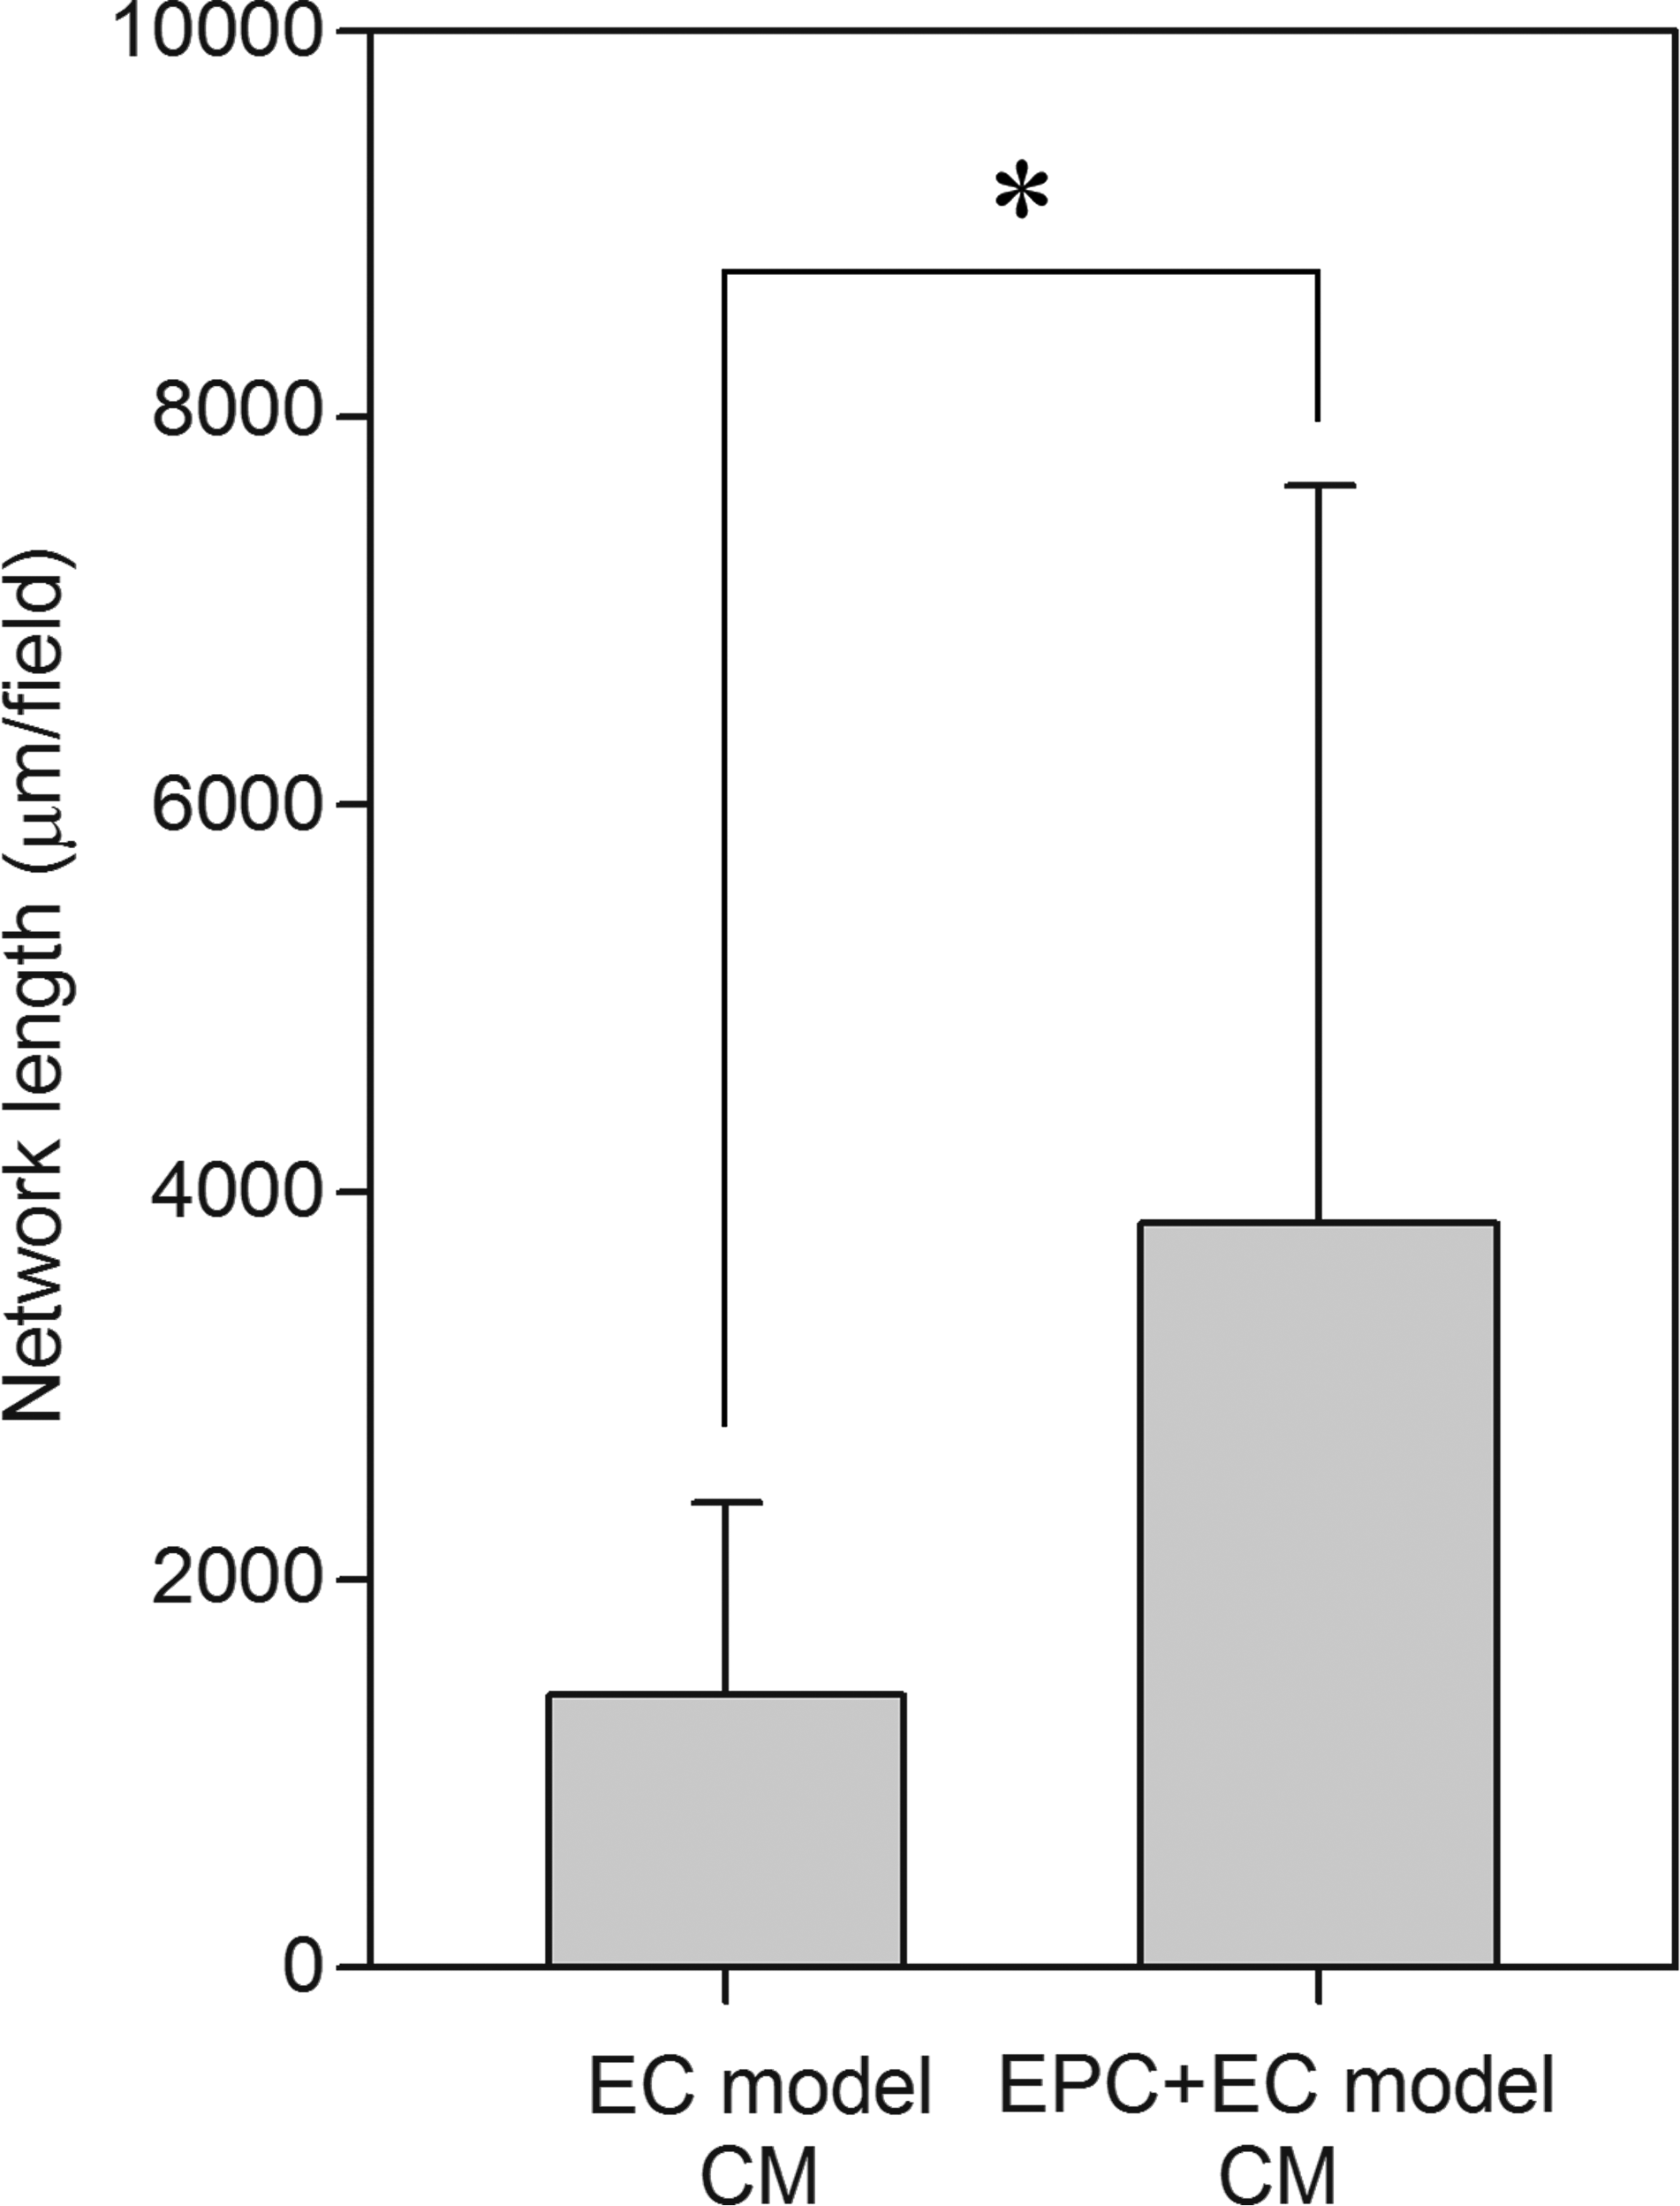
Effect of soluble factors secreted from EPCs on network formation in the EC model. ECs were cultured with CM from the EPC + EC model or EC model, and the total network length was measured at day 5. Data are means ± SD (n = 41–43; *p < 0.05).
Rat VEGF concentration in EPC CM
VEGF is a powerful angiogenic factor, produced by the cells around ECs such as smooth muscle cells, myocardial cells, and mesenchymal cells. We therefore performed ELISA for rat VEGF to investigate how much VEGF was produced in the EPC + EC model. The results showed that VEGF was detected in the medium, and the concentration was 21.0 pg/mL (Fig. 7). In contrast, VEGF concentration in CM from the EC model and that in the EGM-model medium were negligible, smaller than the minimum detectable VEGF concentration of the kit (3 pg/mL).
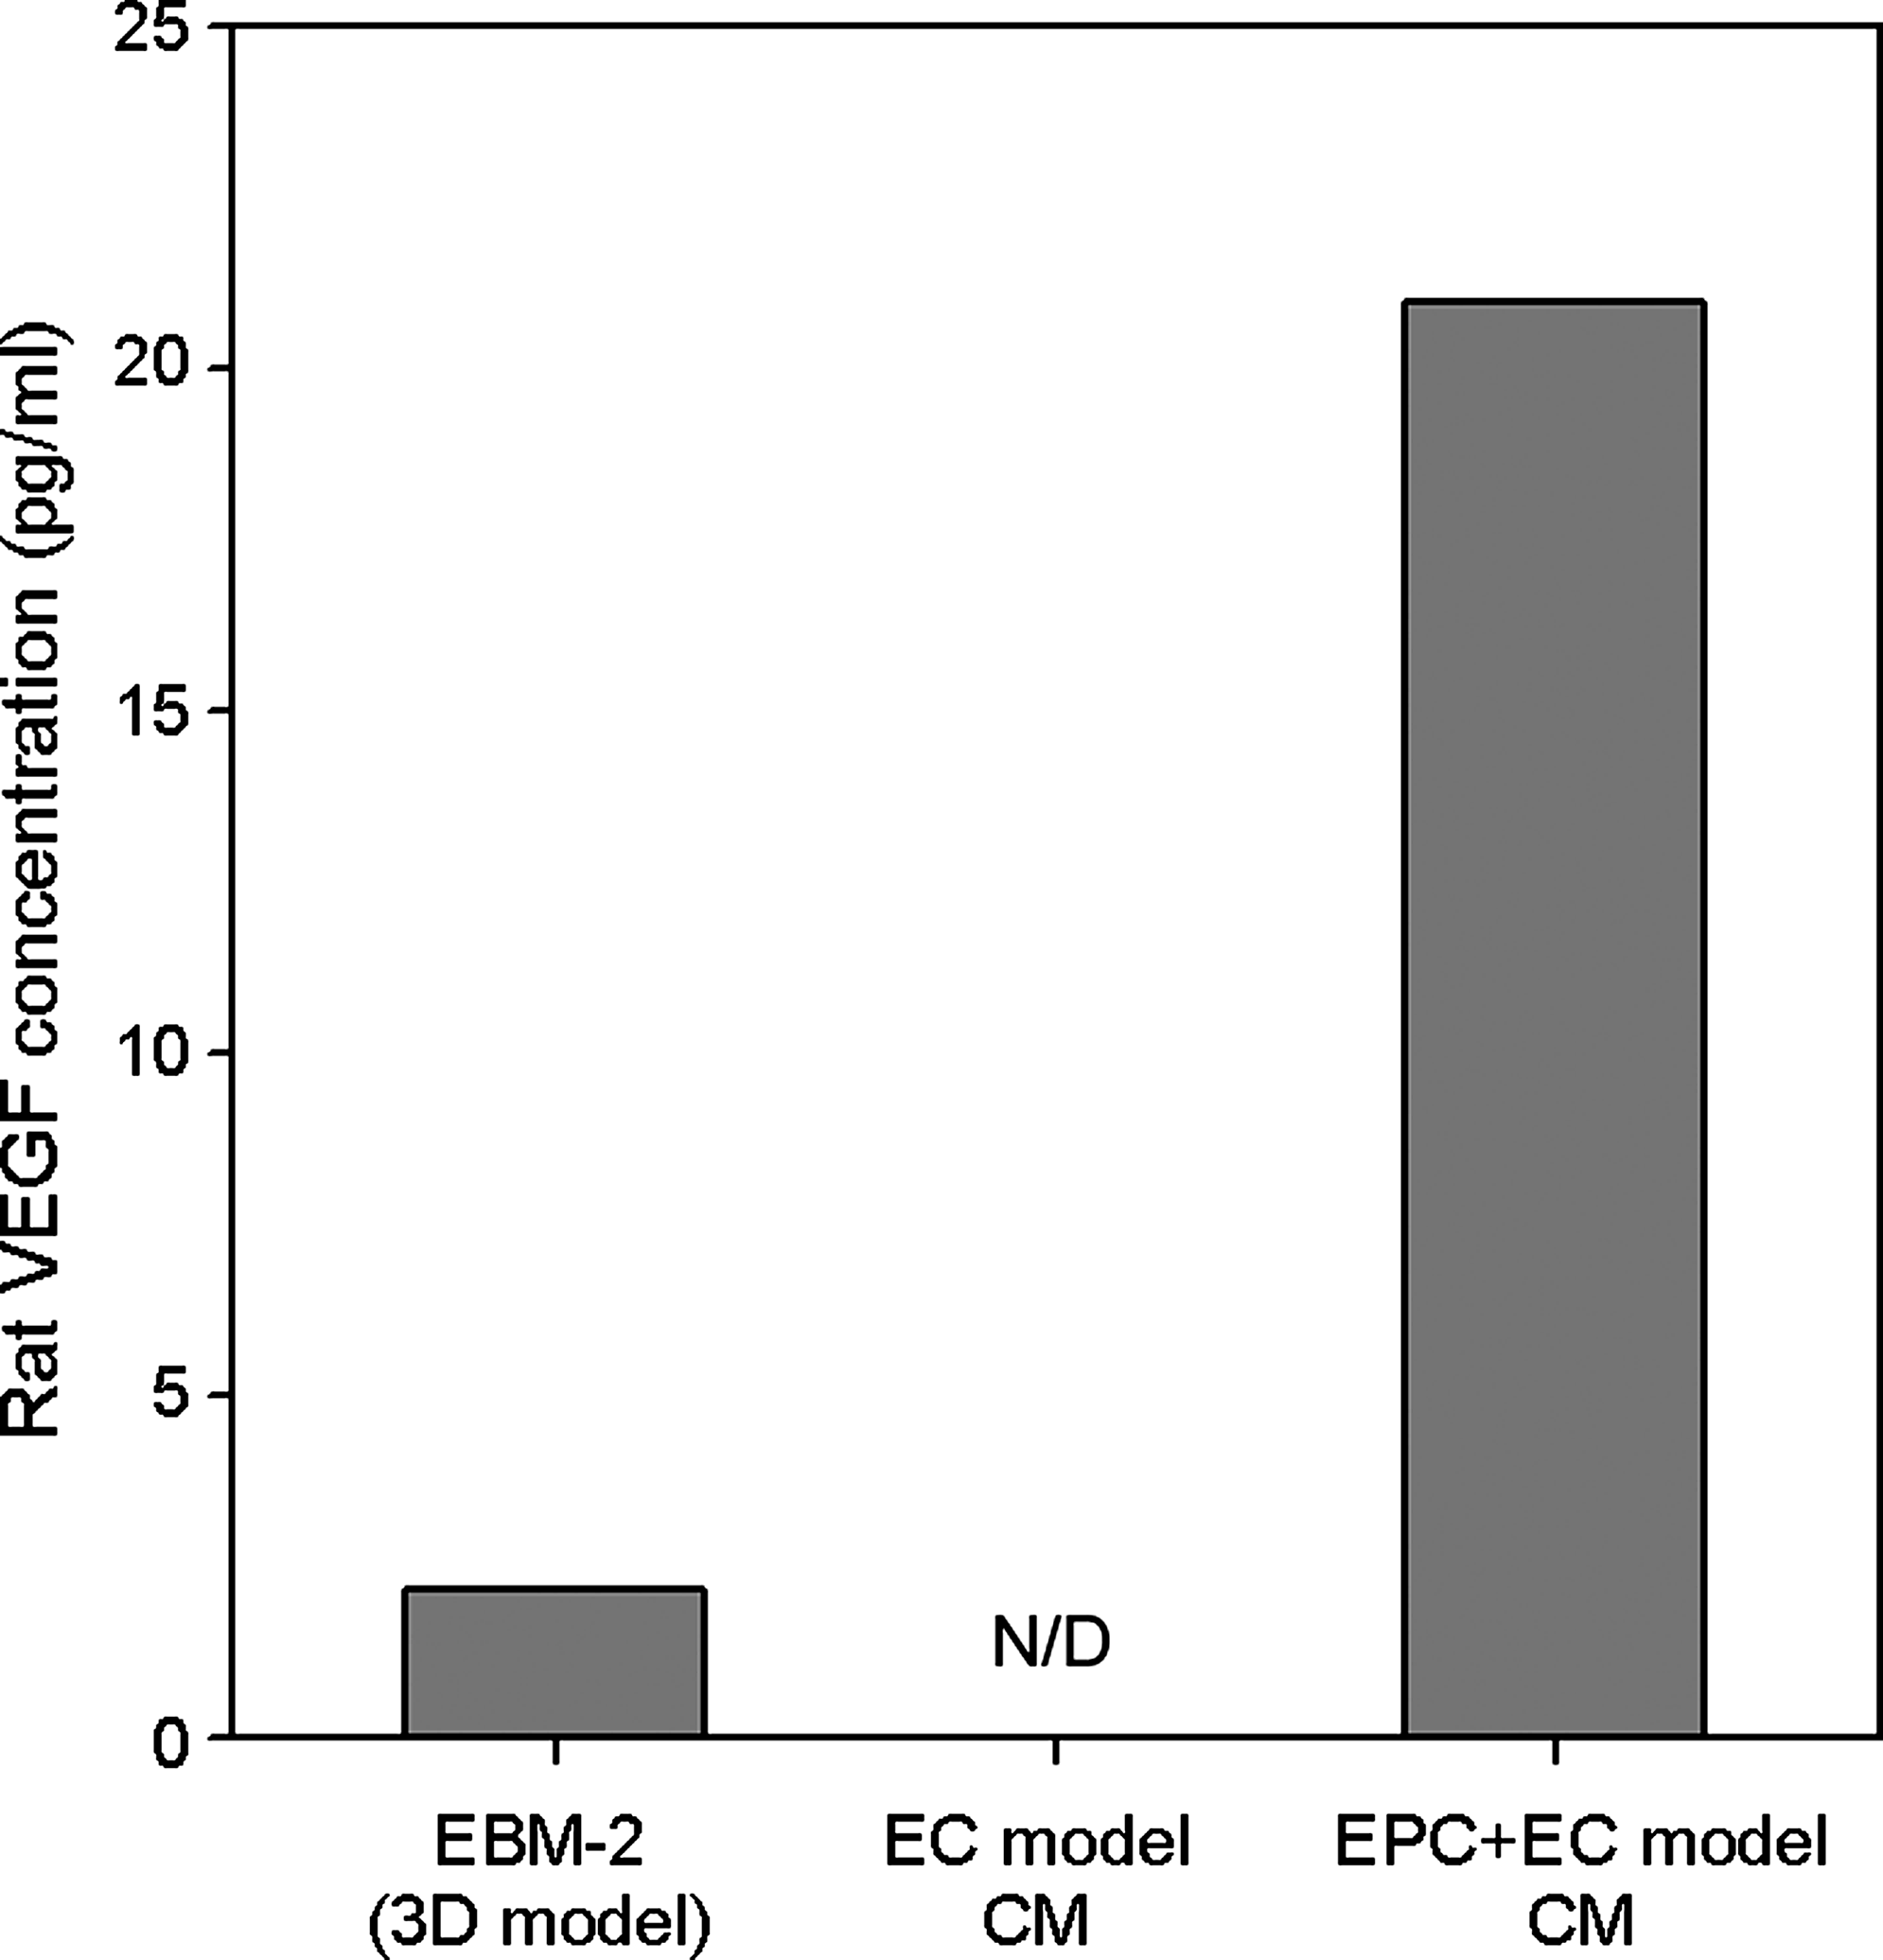
VEGF concentration in CM. Rat VEGF concentration in CM and the EGM-model was measured using a rat VEGF ELISA kit. VEGF secretion by rat EPCs was detected in CM from the EPC + EC model, whereas the VEGF secretion was not detectable (N/D) in CM from the EC model. VEGF concentration in the EGM-model was smaller than the minimum detectable VEGF concentration of the kit (3 pg/mL). Data are means (n = 2).
Effect of VEGF concentration on network formation
We examine the effect of VEGF concentration on network formation to investigate if the angiogenic effect of CM from the EPC + EC model could be replaced with the addition of VEGF. The quantitative analysis of the total length and number of networks revealed that VEGF promoted the growth of EC networks (Fig. 8). The network number increased in proportion to VEGF concentration (Fig. 8B), while the total network length did not linearly increased with VEGF. The addition of 20 ng/mL VEGF increased the total network length to 18438 ± 1801 μm/field at day 5 (Fig. 8A), which was much smaller than that in the EPC + EC model (24104 ± 6217 μm/field at day 5; Fig. 4G).
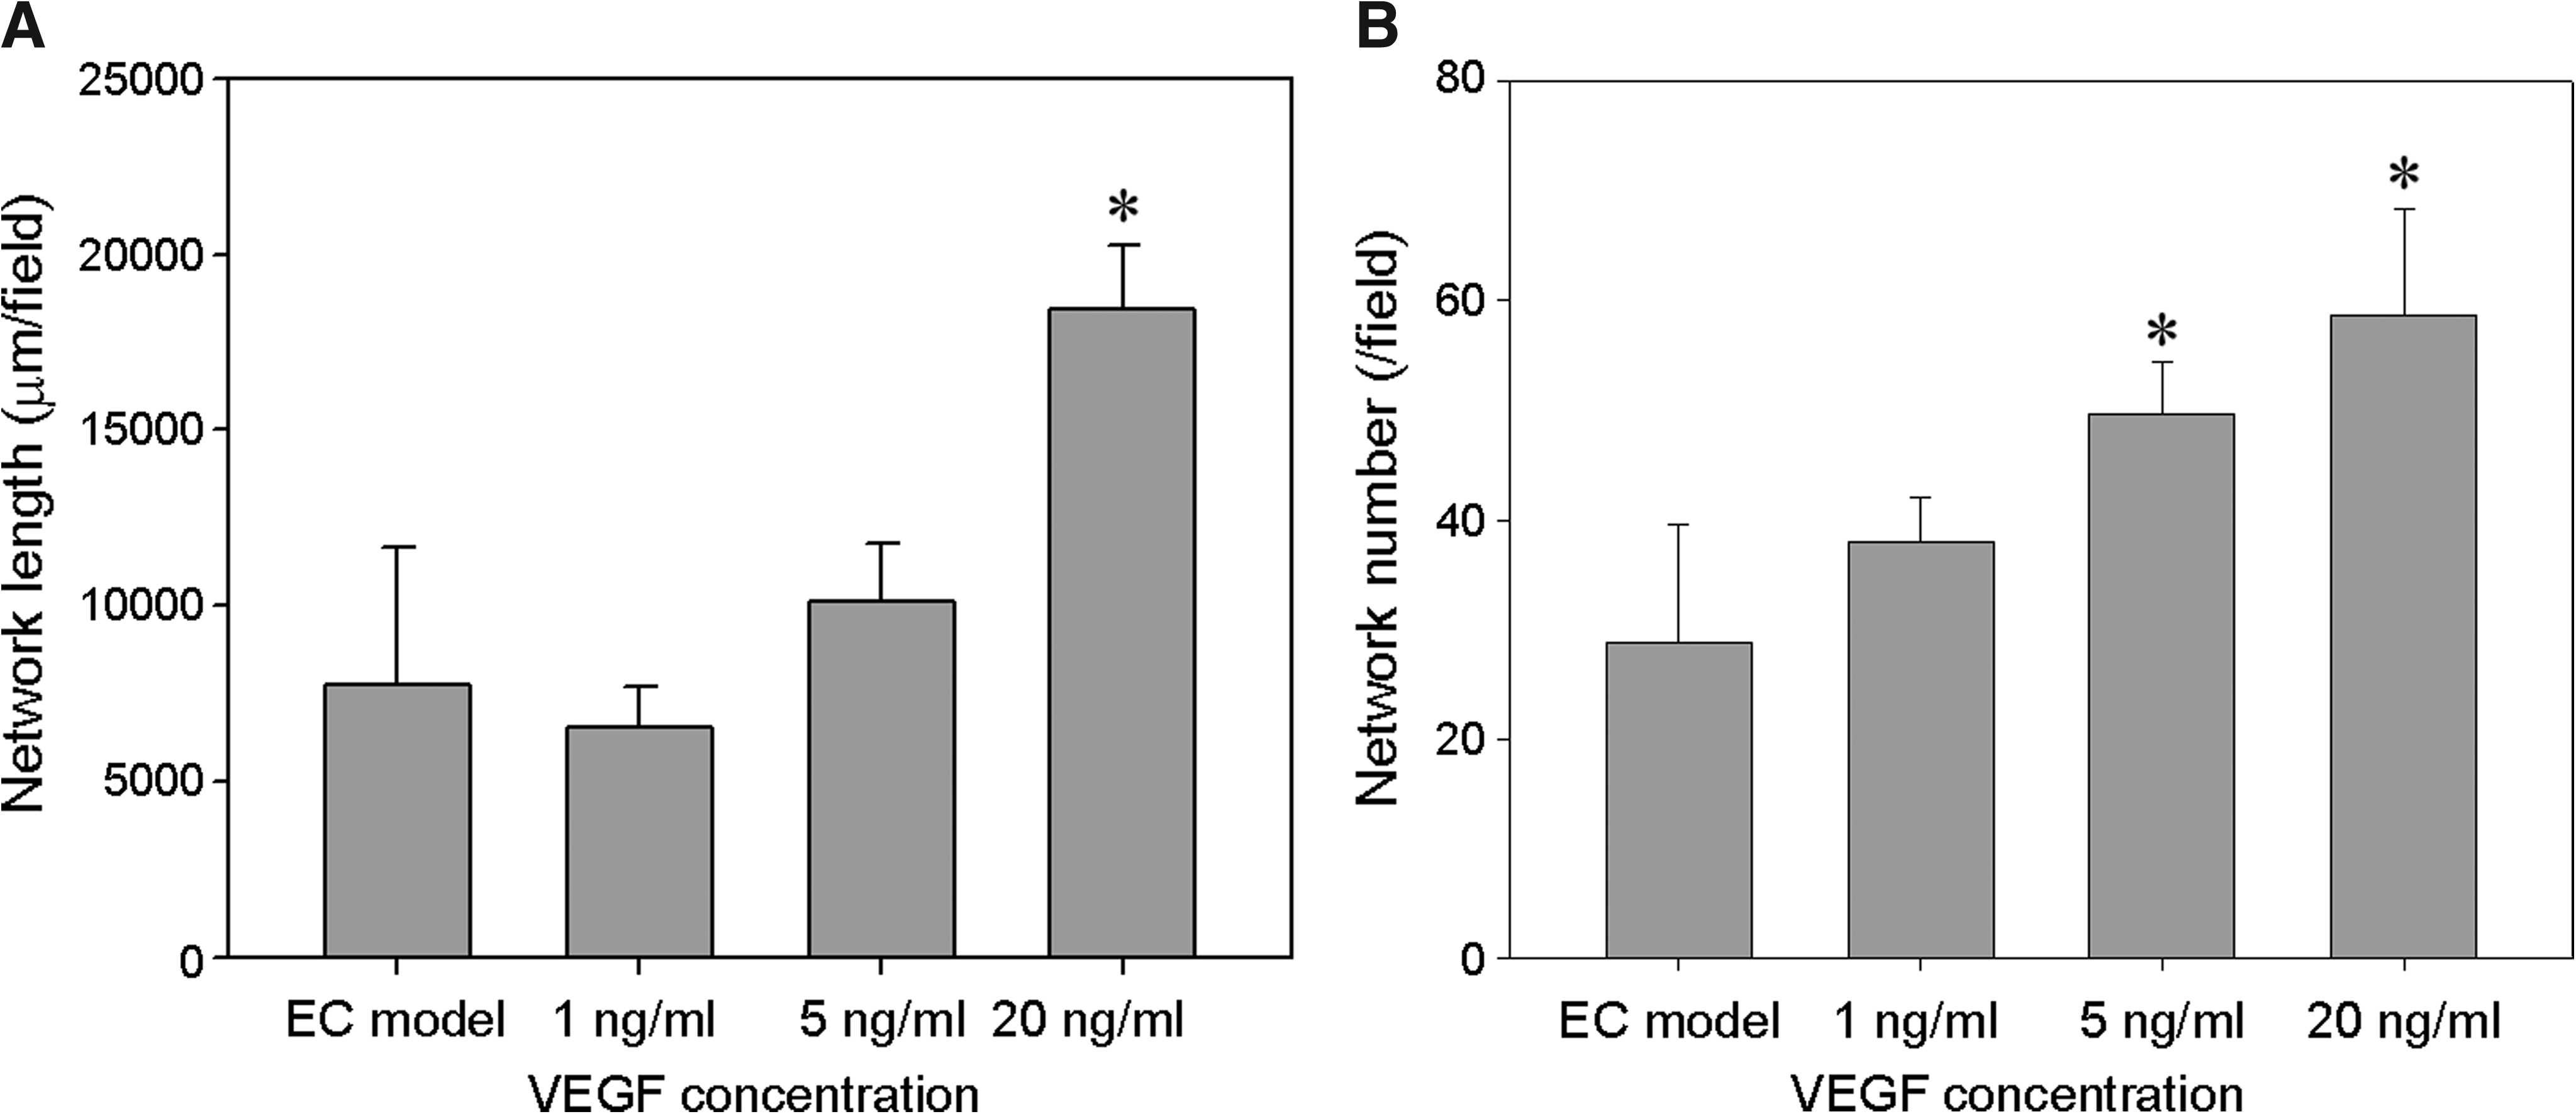
Effect of VEGF on network formation in the EC model. ECs were cultured in the EGM-model supplemented with 1, 5, and 20 ng/mL VEGF. (
EPC distribution in the EPC + EC model
To further investigate how EPCs incorporated into the network, we focused on the EPC distribution in the EPC + EC model. Because EPCs were labeled with DiI before adding onto an EC monolayer, the EPC could be detected by red fluorescence (Fig. 9A, C). On the other hand, all cells, including ECs and EPCs, were stained with green-fluorescent CellTracker to view both a confluent monolayer and networks (Fig. 9B, D). To examine the EPC distribution three-dimensionally, cells were photographed with a confocal laser scanning microscope. The 3D projection images revealed that the DiI-labeled EPCs distributed both in a confluent monolayer and in networks. EPCs sparsely distributed in a cobblestone-like monolayer on collagen gel (Fig. 9A, B). Some cells were also incorporated in networks formed within collagen gel (Fig. 9C, D). To quantify the EPC localization, we measured the EPC density in networks and in a confluent monolayer. The ratio EPC density in networks/EPC density in a monolayer was 1.1 ± 0.4 at day 3, indicating that the added EPCs were evenly distributed in a monolayer and in networks (Fig. 9E). However, the ratio increased to 1.7 ± 0.3 at day 5 (Fig. 9E), larger than 1.0, indicating that EPCs tended to localize in networks compared to the incorporation into a confluent monolayer.

Localization of EPCs in the EPC + EC model. EPCs were labeled with DiI (red) before adding onto an EC monolayer. All cells, including EPCs and ECs, were stained with CellTracker (green) and photographed with a confocal laser scanning microscope. (
The EPC distribution in a confluent monolayer was also monitored at days 1 and 5. Corresponding phase-contrast (Fig. 10A) and DiI-labeled fluorescent EPC (Fig. 10B) images appeared to have a correlation between EPC and network distributions. The quantitative analysis revealed that EPCs tended to localize near networks (<50 μm from sprout positions). This tendency was enhanced with an increasing culture period (Fig. 10C).
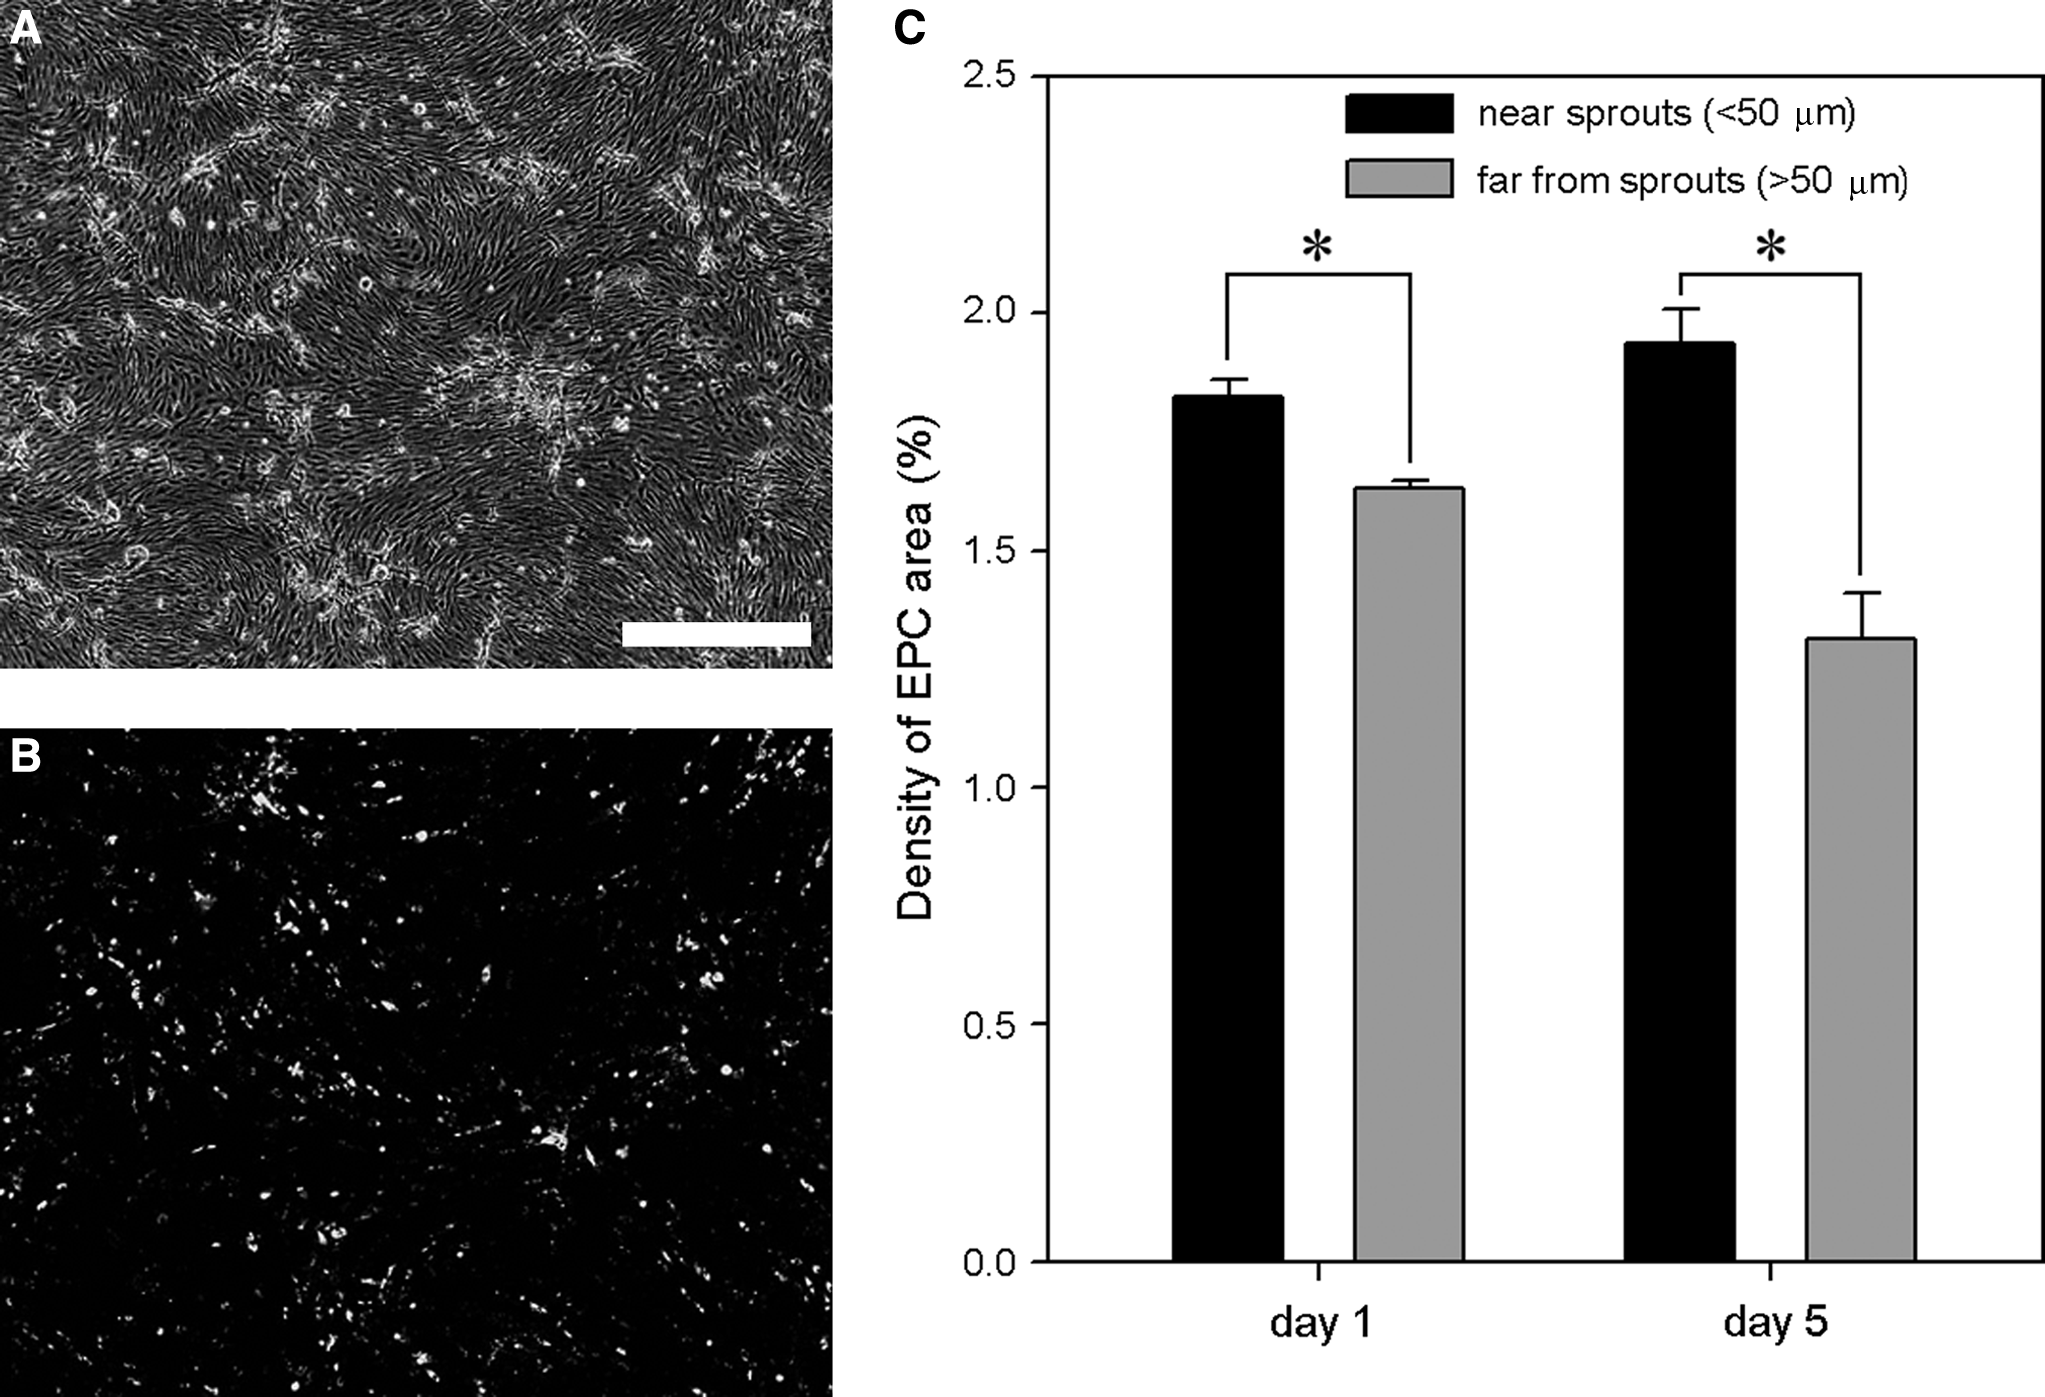
EPC distribution within a confluent monolayer. DiI-labeled EPCs were monitored in the EPC + EC model. (
The effect of VEGF neutralization on the network formation in the EPC + EC model
To further investigate the effect of VEGF secreted by EPCs on the network formation, the bioactivity of the secreted VEGF was neutralized in the EPC + EC model. The network formation in the EPC + EC model was significantly attenuated by the VEGF neutralization. The total network length in the EPC + EC model was reduced by 55% when VEGF was neutralized (Fig. 11). The network length in the EC model was 30% of that in the EPC + EC model.
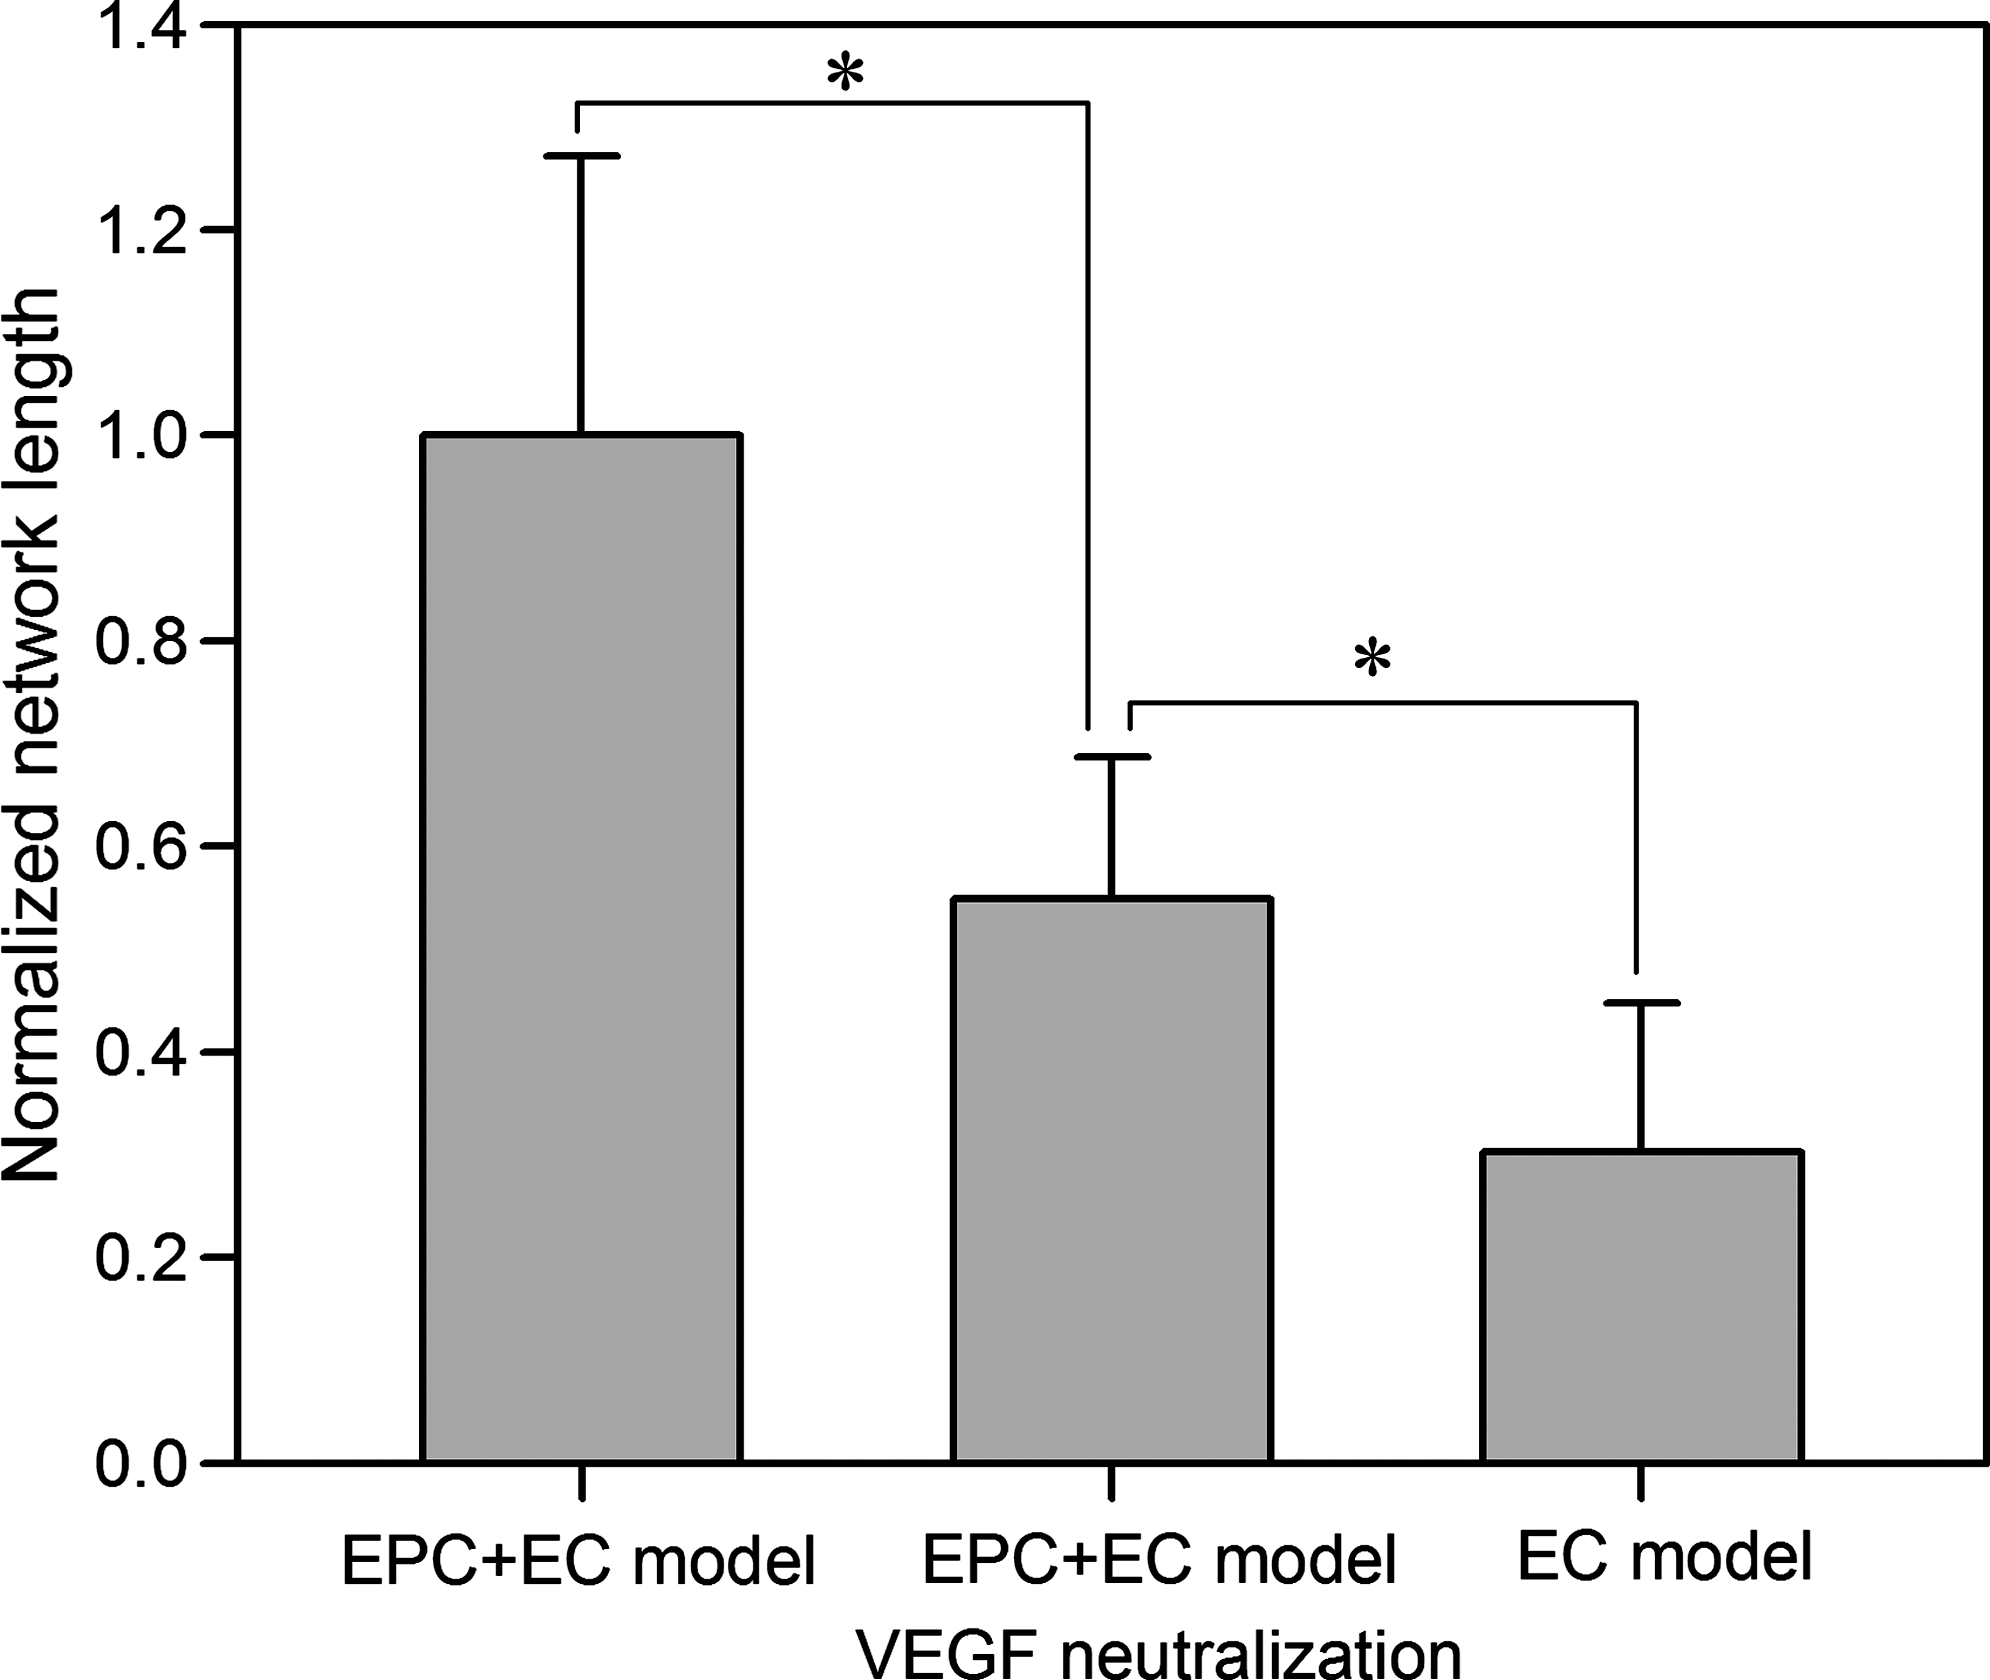
The effect of VEGF neutralization on the network formation in the EPC + EC model. The network length was normalized to that in the EPC + EC model. VEGF neutralization results in a decreased network length by 55%. The network length in the EC model is 30% of that in the EPC + EC model. Data are means ± SD (n = 10; *p < 0.05).
Discussion
EC network formation promoted by EPCs
We demonstrated that the addition of EPCs onto an EC confluent monolayer promoted EC network formation in the 3D network model. Quantitative analysis showed that total network length in the EPC + EC model was significantly longer than those in the EC + EC and EC models. The network number was also greater in the EPC + EC model than that in the EC + EC model until day 4. However, the network number in the EPC + EC model decreased at day 5. The decrease in the network number suggests that small networks are connected to each other and became a larger network. This is consistent with the result that the connection of networks was observed in the process of network formation (Fig. 3D, E).
EPCs can promote network formation by direct incorporation and growth factor secretion. First, ECs were cultured with CM from the EPC + EC model to investigate the effect of soluble factors secreted by EPCs on the EC network formation. ECs formed more networks with CM from the EPC + EC model than that from the EC model, suggesting that EPCs secreted angiogenic growth factors that promoted EC network formation. These results are consistent with previous studies that EPCs secreted angiogenic growth factors such as VEGF, interleukin-8, and hepatocyte growth factor to stimulate preexisting ECs.23,24 VEGF seems to be the most important angiogenic growth factor because it is essential for both embryo and adult physiology, and the absence of VEGF causes regression of blood vessels. 25 VEGF gene transfer enhanced EPC proliferation, adhesion, and incorporation into an EC monolayer in vitro and neovascularization in an animal model of ischemia. 26 In the present experiment we also confirmed that VEGF was detected in CM from the EPC + EC model, while it was not detectable in CM from the EC model.
Because VEGF secreted by EPCs appeared to play an important role in network formation, we further investigated whether or not the network formation promoted by EPCs could be reproduced with VEGF addition. The number of networks increased with increasing VEGF concentration. Interestingly, the VEGF concentration (21 pg/mL) in CM from the EPC + EC model was much smaller than that required for promoting network formation (5–20 ng/mL). This can be explained by the accumulation of VEGF around EPCs/ECs. VEGF secreted from EPCs may be accumulated around ECs and EPCs because heparan sulfate proteoglycans around these cells can serve as extracellular deposits for angiogenic factors such as VEGF.27–29 Consequently, the effective VEGF concentration around the networks becomes much higher than that in culture medium. Therefore, EPCs might promote the EC network formation through the accumulation of secreted VEGF around EPCs and ECs in the EPC + EC model. However, the effect of other angiogenic factors secreted by EPCs cannot be excluded. To further investigate the effect of VEGF secreted by EPCs in the EPC + EC model, the secreted VEGF was neutralized by a soluble VEGF receptor 1. The VEGF neutralization significantly attenuated the network formation in the EPC + EC model by 55%. However, the network length with the VEGF neutralization was still greater than that in the EC model. These results suggest that VEGF secreted by EPCs predominantly promotes network formation in the EPC + EC model, while the other angiogenic factors play a minor role.
EPC incorporation into EC networks in the EPC + EC model
EPCs can promote network formation by direct incorporation in addition to growth factor secretion. To investigate EPC incorporation into networks, we labeled EPCs with red fluorescent DiI and monitored the location of the DiI-labeled EPCs in the EPC + EC model. The result revealed that EPCs directly incorporated into networks although some cells also remained on the confluent monolayer. The EPC localization into networks enhanced with increasing experimental duration. Because EPCs directly incorporated into networks and secreted angiogenic growth factors, the localized higher concentration of the growth factors might be created. Although the VEGF concentration in CM from the EPC + EC model was small, local concentration of VEGF appeared to be higher than the average concentration in the medium as described above. Local VEGF concentration might play an important role in network formation in the EPC + EC model.
Migration of endothelial tip cells of networks was regulated by VEGF gradient, while EC proliferation was dependent on VEGF concentration. 30 In the EPC + EC model, EPCs incorporated into networks and secreted growth factors, including VEGF, which probably created growth factor gradient between adjacent networks. The gradient might induce the connection of adjacent networks in the EPC + EC model, resulting in increase in the total network length. In fact, the EPC incorporation into networks became significant at day 5, and the total network length significantly increased between days 4 and 5, while the network number decreased during the same experimental period.
In the EPC + EC model, EPCs tended to localize in networks with increasing experimental duration. Possible mechanisms of the EPC localization are either EPCs migrate toward networks or EPCs proliferate in networks. Because EPCs sparsely distributed in networks, the cells did not seem to proliferate in networks. To confirm if EPCs migrated toward networks, we analyzed the EPC distribution in a confluent monolayer at days 1 and 5. EPCs located preferentially near networks and the tendency became more prominent with increasing experimental duration. These results suggest that EPCs have ability to migrate toward the site of network formation. Similar migration of ECs toward networks was observed in our previous study. ECs that were stimulated with shear stress migrated toward networks, whereas the cells in static culture migrated randomly. 18
EPC characterization
Phenotype and function of EPCs are heterogeneous because of their diverse origin.7,31–37 Although adherent cells derived from peripheral blood, umbilical cord blood, and bone marrow have been classified as primary EPCs after 3 to 7 days of culture on the basis of endothelial-like morphology, the EPC population contains two types of EPCs.24,38,39 The majority of attached endothelial-like cells express monocyte/macrophage markers such as CD14, and the cell population is called “early EPCs.” The cells exhibited spindle shape, showed peak growth at 2–3 weeks, and died at 4 weeks. 24 On the other hand, the EPC population also contains CD14-negative cells, which appeared late at 2 to 3 weeks and therefore called “late EPCs.” The cells exhibited cobblestone shape and formed colonies with extraordinary proliferative activity. Transplanted EPCs appeared to promote vascular reconstruction in ischemic tissues in part through direct incorporation into capillaries formed by ECs and indirect paracrine mechanisms. Previous studies suggest that early EPCs contribute to enhance angiogenic processes by releasing angiogenic growth factors.7,23,40,41
The EPCs used in the present study were isolated from rat bone marrow and positive for both DiI-acLDL uptake and UEA-1 lectin binding. The cells were cultured for 7 days before using for the EPC + EC model, suggesting that the cells were early EPCs. This is consistent with our observation that the cells did not exhibit remarkable proliferation in our culture system. Rehman et al. 23 reported similar results that EPCs were positive for both DiI-acLDL uptake and UEA-1 lectin binding and showed low proliferation activity. As the early EPCs promoted angiogenic processes by paracrine mechanism in animal models, CM from the EPC + EC promoted network formation and contained VEGF.
In conclusion, we demonstrated that EPCs promoted network formation using an in vitro 3D network model. The EPCs, presumably early EPCs, significantly promoted EC network formation. While majority of the networks were composed of ECs, EPCs tended to localize in the networks in collagen gel rather than on a confluent monolayer with increasing experimental duration. In addition, CM from the EPC + EC model promoted network formation, and VEGF was detected in the CM. Further, VEGF neutralization led to attenuation in the network formation in the EPC + EC model. Taken together, the EPCs contributed to network formation predominantly by creating local growth factor concentration with direct incorporation. This culture system is useful to investigate the behavior of EPCs in the process of network formation. In addition, the angiogenic ability of EPCs offers a possible cell source for reconstructing vascularized tissues in vitro.
Footnotes
Acknowledgments
We thank Mr. Yoshiyuki Ozaki, Akinori Ueda, and Ms. Nahoko Yamamura for helpful discussions. We would also like to thank Ms. Chen-rei Wan and Tharathorn Rimchala at the Massachusetts Institute of Technology for their help with the manuscript. This study was financially supported by the Grants-in-Aid for Scientific Research (A) from Ministry of Education, Culture, Sports, Science and Technology of Japan.
Disclosure Statement
No competing financial interests exist.