
Abstract
Small intestinal submucosa (SIS) is a biodegradable scaffold that supports bladder regeneration after partial cystectomy. We sought to define the inflammatory response present in a rat bladder augmentation model using distal ileal SIS. Fifteen Sprague-Dawley rats underwent hemi-cystectomy followed by anastomosis of a bladder patch of SIS. Bladders were excised after days 2, 7, 14, 28, and 56. Tissue regeneration was evaluated by standard hematoxylin and eosin. Immunohistochemical staining was used to quantify neutrophils, macrophages, eosinophils, and mast cells. Total cell counts per unit area were compared between native and graft portions of the bladder for each cell type across the entire time course. Statistical analyses were conducted with the Wilcoxon Rank-Sum and Kruskal–Wallis tests. All tests were two-sided with significance set at p < 0.05. These inflammatory responses evolved consistently across all bladders over time. Neutrophil and eosinophil numbers were highest at day 2 and decreased over the 56-day period. In contrast, macrophage and mast cell numbers were low at days 2, 7, and 14; peaked at day 28; and decreased once again at day 56. Cell counts at native and graft sites were equivalent for all cell types, except neutrophils, which were more commonly found in the graft (124 vs. 24 cells/mm2, p = 0.009). Thus, the inflammatory processes change over time during SIS-mediated bladder regeneration. Similar cell densities are present between the native and SIS portions of the bladder, but neutrophils predominate in the graft areas.
Introduction
The biologic events involved in tissue regeneration are markedly more complex than cutaneous wound healing. In urinary bladder reconstruction, several injuries and insults to the animal's body have occurred. For example, the bladder has been incised and partially resected, urine has extravasated, a new material has been applied as a scaffold to fill the void, and suture has been used to close the surgical defects. All events incite a marked inflammatory response that coexists with ongoing efforts of the organ to regenerate under the guidance of the biologic scaffold. Numerous studies have explored the interplay between the urothelium, smooth muscle, and cytokines involved in bladder regeneration. 3 However, the temporal changes of inflammatory responses within the native and graft portions of the bladder have not been fully defined or quantified. This study sought to characterize the inflammatory cell influx and detail that time course within the native and SIS-graft portions of a rat bladder augmentation model to better understand the inflammatory response occurring alongside the regeneration process.
Materials and Methods
Animals
This study was performed in accordance with the Institutional Animal Care and Use Committee. Fifteen Sprague-Dawley adult female rats weighing between 275 and 300 g were obtained from Harlan Laboratories (Indianapolis, IN). Animals were kept in the University of Oklahoma Health Sciences Center animal care facility with free access to food and water and standard light/dark cycles.
Preparation of SIS
SIS was prepared from the distal ileum (300–400 cm proximal to the ileocecal valve, devoid of Peyer's patches) of greater than 3-year-old sows. The tunica mucosa and the serosa muscularis of the small intestine were manually stripped as previously described. 4 The grafts were sterilized by exposure to 0.1% peracetic acid in absolute ethanol (pH 1.10) (Sigma-Aldrich, St. Louis, MO) for 1 h followed by three washes in sterile distilled water for 5 min each. The SIS was stored in sterile distilled water at 4°C for use within 6 months of processing.
Surgical procedure for bladder augmentation
Rat bladder augmentation was performed as previously described. 2 Briefly, rats were anesthetized with ketamine (Vedco, St. Joseph, MO) based on rat weight (75–100 mg/kg). Abdominal hair was removed, and skin was prepared in sterile fashion. A 3-cm low midline abdominal incision was created, and the peritoneal cavity was entered. A 1-cm2 segment of the bladder was removed, and a 1-cm2 square section of single-layer SIS was sutured to the native bladder with 7-0 Vicryl (Ethicon, Somerville, NJ) in a water tight fashion. Permanent 6-0 Ethilon marking sutures were used to delineate the graft in later studies (Ethicon). The abdominal wall and skin were closed sequentially with 5-0 Vicryl suture, and animals were then quarantined. No intervention was performed in three extra rats that served as day zero, baseline controls.
Immunohistochemical staining
Rat bladders were harvested in groups of three on postoperative days 2, 7, 14, 28, and 56. Tissue harvest and histological staining were performed as previously described. 5 Briefly, the bladders were inflated with 10% formalin and fixed in the same for at least 24 h before longitudinal incision and paraffin embedding. Paraffin sections were cut at 5 μm and mounted on glass slides, baked at 60°C for 60 min, and stored at room temperature. Hematoxylin–eosin, alcian blue, and Geimsa staining (Sigma-Aldrich) were performed via standard protocols.
For immunohistochemical staining, slides were dewaxed in xylene and rehydrated in a series of graded ethanol to distilled water and then rinsed with 0.01M Tris-buffered saline (TBS). Endogenous peroxidase activity was eliminated with hydrogen peroxide for 30 min. Antigen retrieval was performed with either citrate buffer (CD68) or distilled water (myeloperoxidase), both at 90°C for 20 min. Nonspecific binding was blocked by incubation in 10% goat serum in TBS with 1% bovine serum albumin (BSA) for 2 h at room temperature. Slides were incubated at 4°C overnight with either mouse anti-rat CD68 monoclonal antibody (1:200; Neomarkers, Fremont, CA) for macrophage identification or rabbit anti-rat myeloperoxidase polyclonal antibody (1:200; AbCam, Cambridge, MA) for neutrophil (PMN) identification at 4°C overnight. The final dilutions for the primary antibodies were prepared in TBS with 1% BSA, and 250 μL was applied to each slide. Negative control was performed in parallel in the absence of primary antibody. After primary antibody incubation, the sections were rinsed with TBS and either horse anti-mouse or goat anti-rabbit biotinylated secondary antibody diluted to 1:400 (Vector Laboratories, Burlingame, CA) with TBS and 1% BSA for 2 h at room temperature. A total of 250 μL was applied to each slide. After TBS rinse, the slides were incubated with 1:400 dilution of streptavidin-conjugated horseradish peroxidase in TBS for 30 min at room temperature. Antibody binding was viewed after the incubation of slides with stable diaminobenzidine (Invitrogen, Carlsbad, CA) for 4 min, and color development was terminated with running distilled water. Slides were then counterstained with hematoxylin, dehydrated in graded alcohol, cleared in xylene, and mounted with coverslips.
Cell counting and image processing
To quantify the infiltration of inflammatory cells, tissue sections were measured optically with a 10 × 10 grid micrometer (Olympus, Center Valley, PA). Marking sutures were viewed to delineate the graft from native portions of the bladder. The micrometer was placed in the submucosal position to measure the circumference and thickness of the bladders between the marking sutures for the native and graft bladders. All cells that stained positive for the cell-type-specific marker were counted. Total counts for the graft and native bladder were reported as cell per mm2. Microscopic images were obtained with a Nikon Eclipse 80i (Nikon, Melville, NY) microscope.
Statistical analysis
Cell counts were obtained from three animals at each time point, giving a total of three data points per day. Mean cell count per unit area was calculated ± standard deviation. The Wilcoxon Rank-Sum test was used to determine differences in overall cell counts between the native and graft portions of the bladder. Trends in cell counts across study time points (day 2 through day 56) for the graft and native sections were separately compared using the Kruskal–Wallis test. All tests were two-sided and considered significant if p < 0.05. Analyses were performed with SPSS, version 17.0 (SPSS, Chicago, IL).
Results
Evaluation of bladder regeneration
Consistent with our prior experiments, 5 the grafts were largely composed of inflammatory cell infiltrate and hemorrhage until day 14 when a complete urothelium was identified. By day 28, a more significant yet hyperplastic urothelium was present, along with early fibroblast appearance. At day 56, the urothelial lining had smoothed and the muscularis layer was matured.
Evaluation of inflammatory cell influx
A total of three control rats were used for this study. No SIS was placed in these bladders, and each served as the time zero, unaltered baseline control. Very few inflammatory cells were identified. Mean leukocyte counts were as follows: PMNs, 0.77 ± 0.2 cells/mm2; eosinophils, 0.46 ± 0.1 cells/mm2; macrophages, 0.38 ± 0.07 cells/mm2; and mast cells, 1.3 ± 0.3 cells/mm2.
Day 2
Histologic details of the inflammatory time course within the distal SIS graft are detailed in Table 1 and Figure 1. As depicted, neutrophils (PMNs) led the inflammatory response at day 2. Large waves of PMNs entered the graft rapidly, 272.5 ± 174.0 cells/mm2. Several eosinophils were also present in the graft at this time (8.9 ±3.3 cells/mm2). Fewer numbers of macrophages and mast cells were identified (1.1 ± 0.91 cells/mm2 and 0.1 ± 0.1cells/mm2, respectively). The mast cell counts at this phase were significantly less than controls (p < 0.0001), while all other cell counts were significantly greater than controls (all p < 0.05).
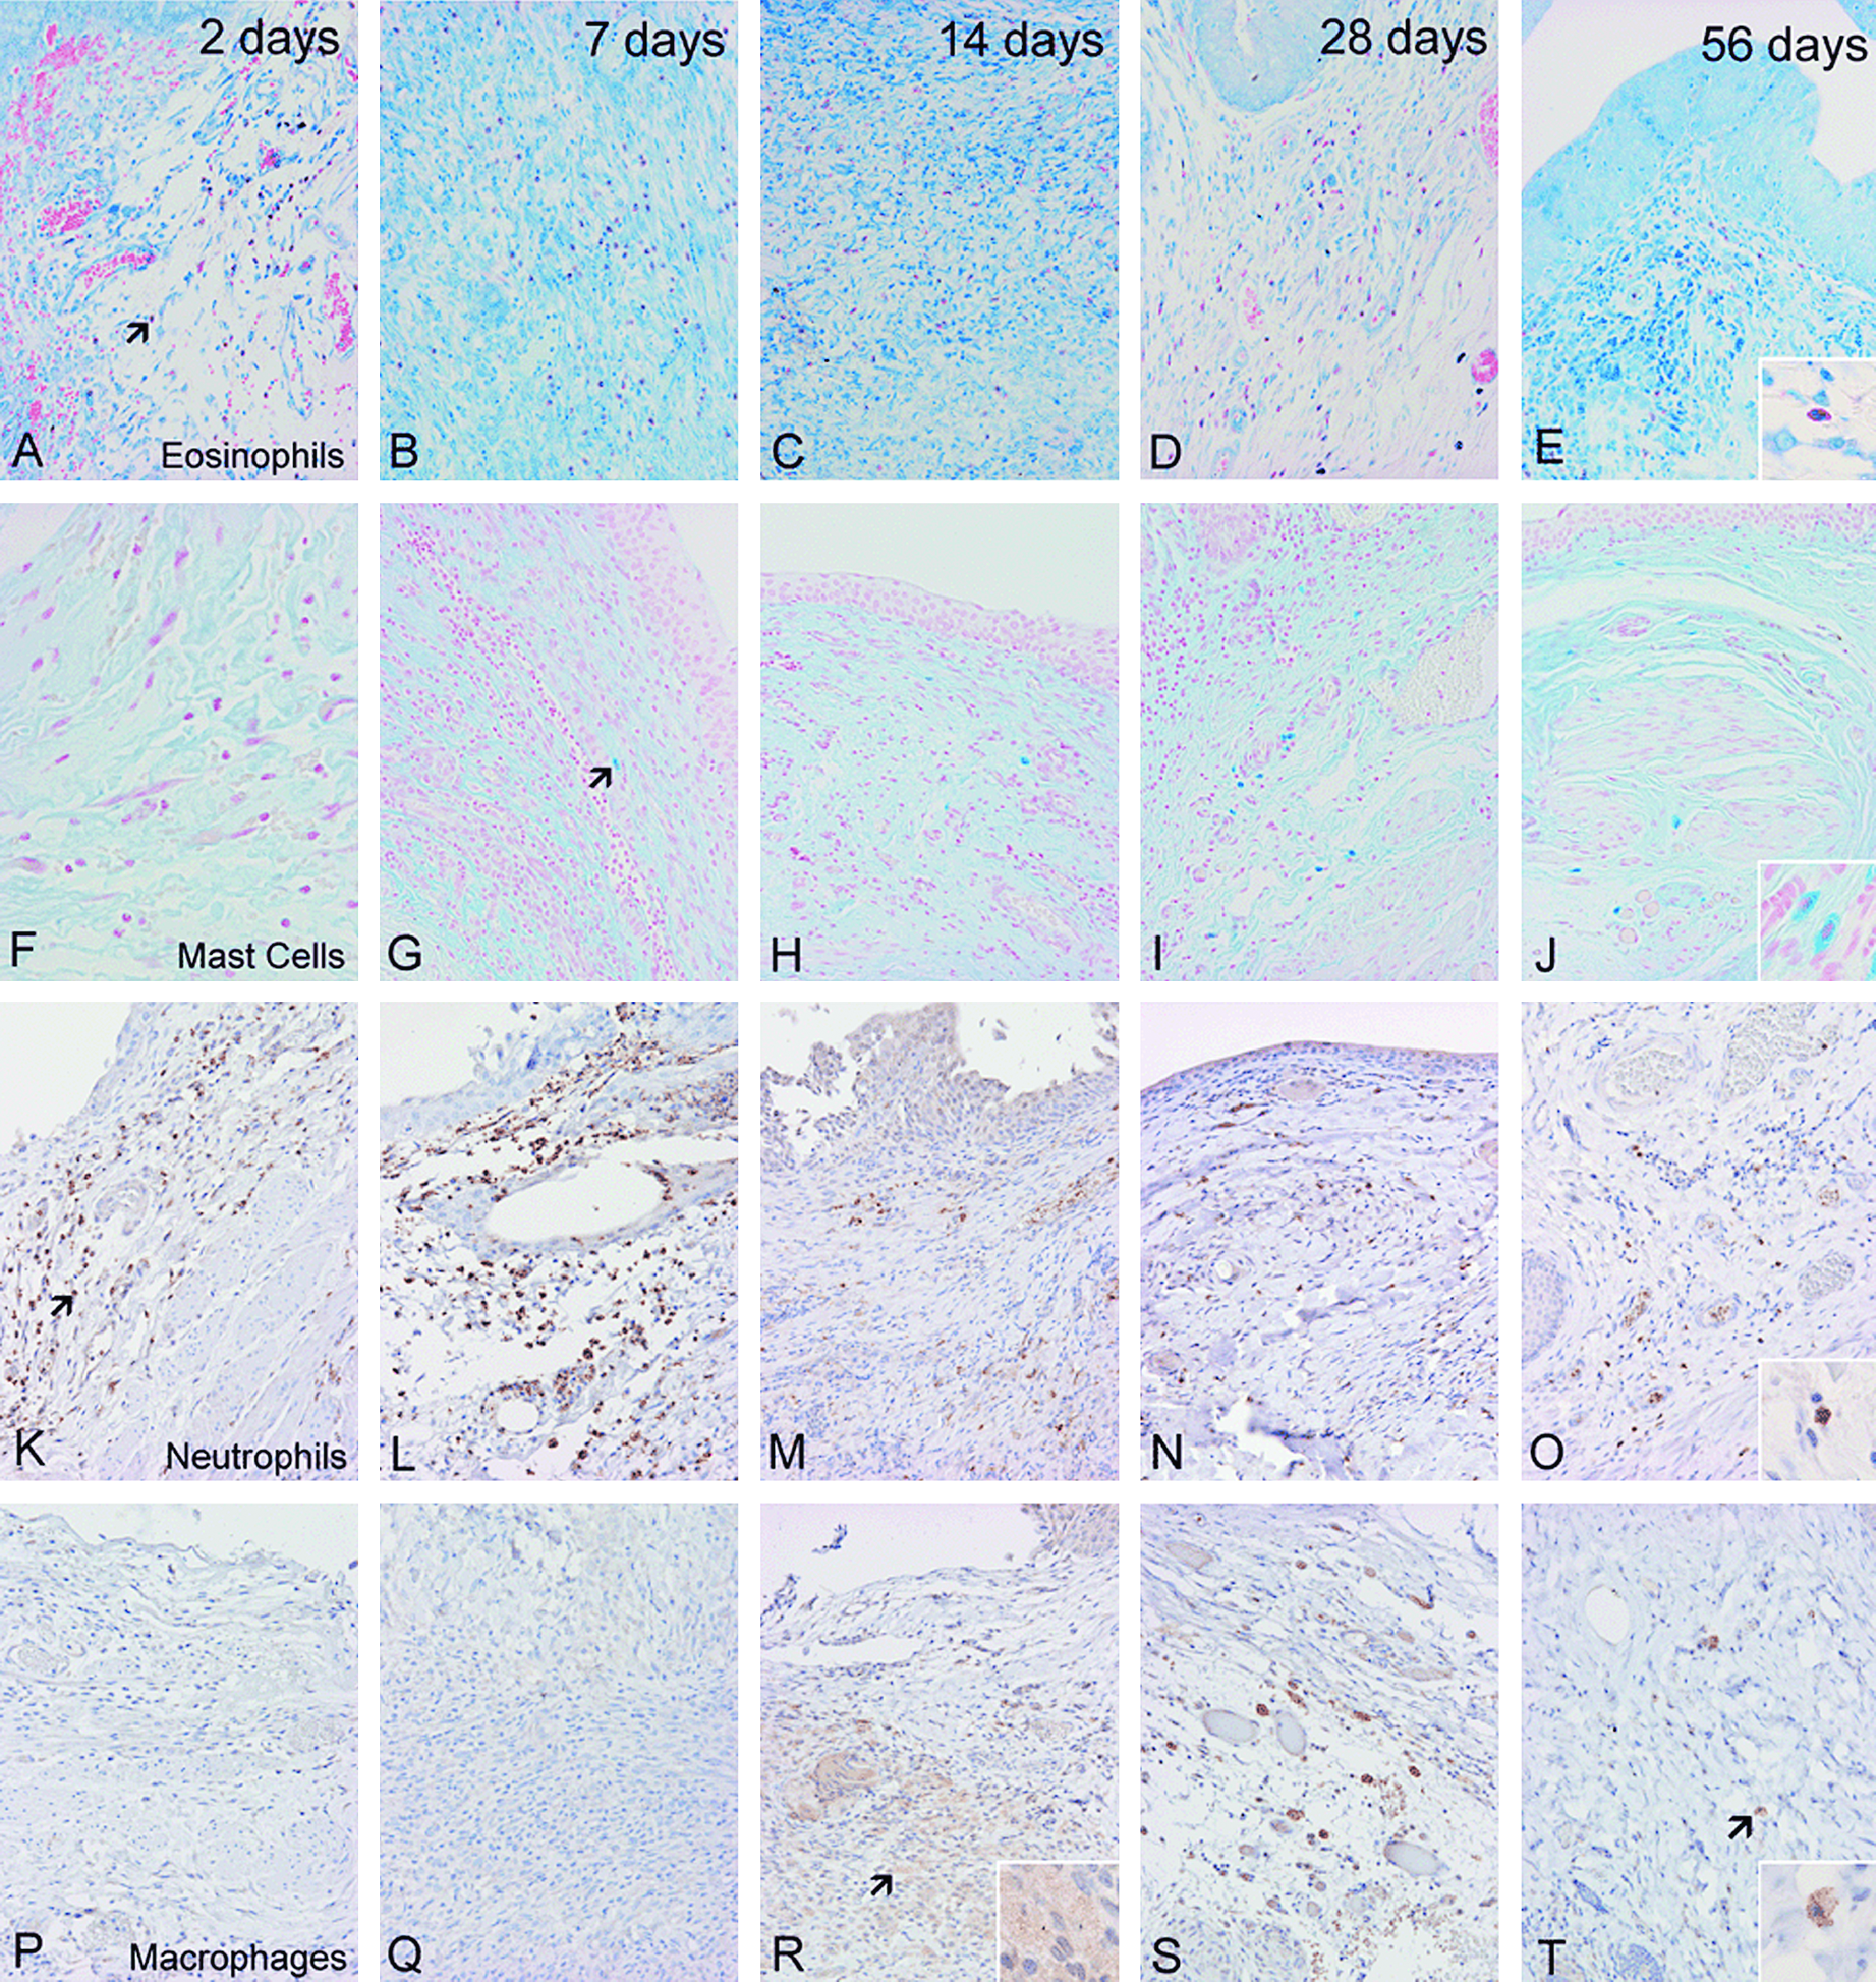
Histologic representation of inflammatory time course within the graft portion of the distal small intestinal submucosa bladder augmentation model from day 2 through day 56 for eosinophils (Giemsa stain,
p-Values reflect significance in the change in counts of each cell type across all time points.
Kruskal–Wallis test.
Day 7
The PMN cell counts decreased at this time to 90.6 ± 97.4 cells/mm2 as did the eosinophil infiltrate (7.4 ± 5.7 cells/mm2). Macrophage and mast cell numbers remained low and relatively stable with 1.7 ± 1.6 cells/mm2 and 0.6 ± 0.6 cells/mm2, respectively. At this time point, mast cell counts were still significantly less than baseline controls (p = 0.02), while all other cell counts were higher than control values (all p < 0.05).
Day 14
PMN cell counts remained flat at this time point (116.4 ± 117.7 cells/mm2), as did the eosinophil numbers (6.4 ± 7.4 cells/mm2). Macrophages developed the appearance of early foamy histiocytes, and their numbers increased to 3.9 ± 2.2 cells/mm2. Mast cells migrated to the graft at this timepoint, 1.1 ± 1.1 cells/mm2, and approximated the findings in control bladders (1.3 ± 0.3 cells/mm2, p = 0.39). In contrast, all other cell counts remained higher than those from control bladders (all p < 0.05).
Day 28
Fewer numbers of PMNs and eosinophils were identified in the grafts at this time with 23.7 ± 23.7 cells/mm2 and 1.6 ± 0.12 cells/mm2, respectively. In contrast, peak macrophage count as depicted by mature CD68 expression occurred at this time period, 6.4 ± 3.5 cells/mm2. Likewise, mast cells infiltrated the graft most prominently at this time with numbers reaching 8.8 ± 7.9 cells/mm2. At this stage, all cell counts were higher than those in control bladders (all p < 0.05).
Day 56
PMN and eosinophil counts continued to decline to 8.2 ± 3.4 cells/mm2 and 1.4 ± 0.94 cells/mm2, respectively. Macrophages began to egress slowly as well to 3.2 ± 0.7 cells/mm2. Mast cell numbers also decreased at this time to 6.4 ± 5.2 cells/mm2. At this stage, no leukocyte count had yet returned to baseline (all p < 0.05).
Inflammatory cell response within native and graft bladder
Numbers of inflammatory cells for the native bladder alone are detailed in Table 2. Similar to what occurred in the graft bladder, appearance of inflammatory cells changed over time in the native section of the bladder. Mean cell counts across all time points were compared between the native and graft portions of the rat bladders. The findings were relatively similar between native and graft sections of the bladder. The mean cell counts for macrophages (4.6 vs. 2.9 cells/mm2, p = 0.325), eosinophils (6.3 vs. 5.8 cells/mm2, p = 0.435), and mast cells (2.7 vs. 2.7 cells/mm2, p = 0.109) were nearly equivalent between the two regions. However, PMNs were found more frequently in the graft section of the bladder with 124.2 cells/mm2, as compared to the native region at 24.1 cells/mm2 (p = 0.0009).
The p-values reflect significance in the change in counts of each cell type across all time points.
Kruskal–Wallis test.
Discussion
Complex wound healing and tissue regeneration involves multiple cells and cytokines acting together in concert and correct sequence. The first part of any wound healing process and eventual regeneration involves hemostasis and inflammation. One cannot evaluate tissue regeneration alone without considering this concurrent immunologic phenomenon. These events are variable and can either promote fibrosis or encourage proper signaling cascades that lead to near-normal tissue regeneration. SIS derived from distal portions of porcine small intestine has been shown to serve as an excellent scaffold to encourage this outcome. 6
Several prior studies have evaluated the phases of wound healing and separated them into three stages: inflammation, tissue regrowth, and tissue remodeling. This study focused on the early inflammatory changes that coexist with regeneration, and it detailed the initial events in the SIS-augmented bladder model. A rapid and strong PMN influx dissipated over a 28-day period. An early eosinophilic infiltrate occurred along with PMNs and then decreased over a 28-day period. Similar to other models of wound healing and bladder regeneration, macrophage infiltration was not substantial until the second week of the regenerative process. 7 The mast cell response approximated the timing of macrophage infiltration.
As in other wounds, it is suspected that the injury to the bladder after hemicystectomy led to bleeding and release of inflammatory mediators that served to incite early PMN influx. 8 Fewer PMNs were identified in the native portion of the bladder as compared to the graft regions, and this was statistically significant. It is expected that the PMNs entered the graft for early decontamination and sterilization of the wound. 9 After this, the PMN numbers significantly decreased. Macrophages then entered the graft to continue the sterilization process, phagocytize dead PMNs, and initiate the proliferative phase of healing. 8
Early eosinophilic infiltrate was also identified and herein represents the first quantitative report in the field of bladder tissue engineering. These inflammatory cells responded rapidly and gradually dissipated over time. Historically, these cells have been noted to play a role in extracellular matrix degradation, along with production of both transforming growth factor-α and transforming growth factor-β, which have critical roles in wound repair.8,10–12 Eosinophil counts decreased significantly after day 14. This is likely a chronologically important finding, as it coincides with our prior studies that detail a confluent urothelium between day 14 and day 28 of the regeneration process. 5 If the eosinophils were to persist and remain in an active state, they may impede epithelialization and exude toxic eosinophil peroxidase that can alter urothelial permeability.13–15
The macrophage infiltration in this model was slower and did not peak until day 28, consistent with the decrease in PMN numbers at that time. Further work in this area is ongoing to determine if the macrophage numbers remain consistent at later time points, as suggested in other bladder regeneration models. 7 Since the PMN response was much stronger before macrophage arrival, it is likely that most decontamination was complete before macrophage influx. It is possible that in SIS-tissue regeneration models, the focus of the macrophage may lie more in regulation of later remodeling and proliferative pathways (i.e., the M2 macrophage profile), which occur at future time points.16,17 Although macrophage phenotypes were not evaluated separately in this study, the available data suggest that the M2 phenotype was the dominant class in this SIS-model. Indeed, giant cells and foci of chronic inflammation, which are typically associated with an M1-macrophage response, were absent in this study.
The mast cell activity appeared to mirror the macrophage influx. This study did not find high numbers of mast cells in the early phase of the regenerative process. These cells are known to be important in mucosal immunity and may coordinate early PMN infiltration of wounds via release of Tumor Necrosis Factor (TNF)-α.18,19 However, in this study, mast cell counts remained lower than baseline control levels until the 14th day. It is difficult to determine if this lack of mast cells is specific to SIS-based models or if the mast cells entered the site of injury before day 2 and thus would have been missed in this experiment. These results better correspond with other research that suggests that this lineage is a late responder in wound healing. Although mast cells have been shown to participate in all phases of wound healing by producing numerous proteases, cytokines, and growth factors, their major impact may occur during the later stages. 19 Their effects beyond the 56th day will be important to evaluate because mast cell tryptase and chymase can influence fibroblast-mediated events and tissue remodeling.17,20,21 Thus, late mast cell activity must be analyzed since their enzymatic potential may alter proper collagen distribution in wound healing.
The implications of these findings are significant for multiple reasons. Although prior bladder regeneration research has evaluated PMN and macrophage activity during inflammation, the complete leukocyte lineage has not been assessed. Proper wound healing involves PMN-mediated detoxification, along with macrophage activity to phagocytize debris and coordinate remodeling events. However, our results indicate that these processes are occurring in the presence of both eosinophils and mast cells. It is beyond the scope of this study to propose what cytokines these cells release, but they are known to be involved in allergic-type responses. The possibility of SIS inducing such activity has not been explored. Several future studies will be required to determine sequence and concentration of cytokines released during SIS-mediated bladder regeneration. This work will not be a small task. Numerous cytokines may be released in this setting, from multiple cell types, with multiple functions. Once these cytokine responses are characterized, future research may be necessary to determine if peri-procedural inflammatory modulation can further improve graft outcomes.
One pitfall of our study was failure to capture snapshots of the entire regenerative process and evolving inflammatory cascade. Thus, it may be likely that there are some missing cell counts from these immediate events. In addition, it may be necessary to study the inflammatory response beyond 56 days to further understand the impact on later stages of regeneration. However, this study provides an introduction to leukocyte infiltration during the initial decontamination and reparative stages of bladder augmentation with SIS. Future studies will assess changes in cell phenotype, cytokine release, intracellular events, and lymphocytic response during this process. Correlations between all immune cells at multiple time points and locations will allow for complete understanding of the host response to SIS in this setting. This will help identify what pathways are active during various regenerative time points and allow for modulation of these responses to provide the best tissue regeneration possible.
Conclusion
The inflammatory response is critical to proper wound healing. We have shown that this process evolves and changes over time, in conjunction with bladder regeneration. The PMN response follows patterns defined in other wound healing models. However, new information is gathered with respect to early eosinophilic infiltration with delayed macrophage and mast cell influx into the graft bladder. These findings represent initial assessment of the early inflammatory response and lay foundations for future studies to define the orchestration between inflammation and SIS-mediated bladder regeneration.
Footnotes
Disclosure Statement
Dr. Bradley P. Kropp has received research support from Cook Biotech, Inc., West Lafayette, IN, but was not provided extramural funding for the work discussed in this article.