
Abstract
There is an ongoing search for alternative tissue culture sera to engineer autologous tissues, since use of fetal bovine serum (FBS) is limited under Good Tissue Practice guidelines. We compared FBS with human platelet-lysate (PL) in media for in vitro cell culture. A threefold increase in duplication rate was found when human, saphenous vein-derived myofibroblasts were cultured in PL, whereas expression of marker proteins (α-smooth muscle actin, vimentin, desmin, and nonmuscle myosin heavy chain) was similar. Heat shock protein 47 mRNA expression was increased in PL cells, and type III collagen fibers were seen on PL-cell monolayers but not on cells cultured in FBS. These results imply a more efficient collagen fiber production. We also found higher levels of proteins involved in tissue repair and collagen remodeling, which could explain increased production of proteases and protease inhibitors by PL cells. Our findings indicate that PL is beneficial due to the increased duplication rate, in addition to the increased matrix production and remodeling. This could lead to production of strong tissue with properly organized collagen fibers, which is important for heart valve tissue engineering.
Introduction
Tissue engineering is considered a promising alternative method for production of viable heart valve constructs to replace diseased valves in patients. 9 Currently used valve replacement therapies suffer from several limitations, mostly related to lack of viable tissue. 10 The proof of principle for heart valve tissue engineering was provided by seeding of autologous vessel-derived myofibroblasts (MFs), expressing vimentin and α-smooth muscle actin (αSMA), on artificial scaffolds.11–13 Upon implantation into the pulmonary position in juvenile sheep, the constructs remained viable and intact for up to 20 weeks after implantation. For clinical application of MFs in heart valve tissue engineering, it is important that cells can be rapidly expanded in vitro to quantities large enough to seed on the scaffold surface. Subsequently, the valve constructs should be able to produce and remodel abundant amounts of extracellular matrix (ECM).
Native aortic heart valves have a tri-layered architecture including highly specialized and functionally adapted cells and ECM, to be able to direct high tensile forces generated during systole from the belly to the commisures and aortic wall.14,15 Valvular interstitial cells (VICs) are considered the most important regulators of specialized ECM synthesis and remodeling and, hence, the maintenance of strength and durability of valve cusps. 16 VICs display a certain degree of plasticity in vivo, which can be distinguished by expression of different markers. In developing, diseased, remodeling, and tissue-engineered heart valves, VICs have been reported to express markers of a contractile, activated myofibroblastic cell type, including vimentin, α-SMA, and nonmuscle heavy myosin chain (SMemb). The activated, developing, or remodeling state is usually followed by normalization of the phenotype to a secretory, quiescent fibroblast phenotype, in which VICs express only vimentin. 12
In this study, we investigated the application of PL as a replacement for FBS in the in vitro expansion of MFs and the effect on morphology, proliferation, phenotype, and the ability to produce collagen and proteins involved in matrix remodeling.
Materials and Methods
Cell isolation
Segments of vena saphena magna (±3 cm) were obtained from 10 patients undergoing coronary artery bypass surgery using a venous graft. Individual permission using standard informed consent procedures and prior approval of the ethics committee of the University Medical Center Utrecht was obtained, and tissue was further treated anonymously, as adapted from Schnell et al. 17 Briefly, venous segments were transferred to the laboratory in serum-free medium (Dulbecco's modified Eagle's medium-advanced [12491015; Gibco, Breda, The Netherlands], 2 mM GlutaMax [35050-028; Gibco], and 10 μg/mL gentamycin [BE02-012E; Lonza, Verviers, Belgium]), wherein the adventitia was removed from the medial/intimal layer. Subsequently, the vessel was washed in antibiotics solution (phosphate-buffered saline [PBS], 2.5 μg/mL AmphotericinB [AG A2612; Biochrom, Berlin, Germany], and 200 μg/mL Gentamycin [15710-049; Gibco]). The lumen of the vessel was incubated in endothelial cell medium with collagenase (endothelial basal medium-2 [EBM2] [Lonza], endothelial cell growth medium-2 [EGM2] single quots [CC-3162; Lonza], 20% FBS [CH30160.03; HyClone, Logan, UT], and 2 mg/mL collagenase A [10103578001; Roche, Woerden, The Netherlands]), after which endothelial cells were scraped off with a cell scraper. Tissue segments were cut into small squares (2 × 2 mm) and plated on culture plastic with the lumen faced down, receiving either FBS medium (serum-free medium + 10% [v/v] FBS) or PL medium (serum-free medium with 5% v/v PL and 10 U/mL heparin [013192-03; LEO, Breda, The Netherlands]). Human thrombocytes in serum were obtained from the hospital blood bank, pooled from five donors with similar blood type and rhesus-factor, and buffered with citrate-phosphate dextrose. PL was frozen in aliquots at −80°C, thawed, and centrifuged (8 min 900 rcf ) prior to addition to the culture medium to obtain PL, as described by others.7,18 Cells were cultured in a humid environment at 37°C and 5% CO2.
Cell culturing, morphology, growth curves
Cells derived directly from the tissue (passage 0 [P0]) were cultured up to P5. P1 and P2 were seeded at a density of approximately 2000 cells/cm2, whereas subsequent passages were split in a 1:3 surface ratio. After each passage, the time required to reach 85% confluency was noted per cell isolation and the number of cells was determined. A number of 108 cells was considered clinically significant. The time in days and the logarithm of the total number of cells that could have been obtained at each passage were fit into a linear model using SPSS 15 software (SPSS, Chicago, IL). Slopes of these models were determined and represented duplication rate. They were used to calculate the mean duplication rate of all patients per culture medium. Viability was determined using tryptan-blue staining and quantification with a Bürker-Türk-hemocytometer.
At P2 and P5, cells were plated for further culturing, for analysis by zymography, for collection in Tripure Isolation Reagent (11667165001; Roche), and for immunocytochemistry (ICC) on coverslips. These passages were selected, because P2 was needed to obtain enough cells for all the different analyses, whereas P5 represents the last stage, prior to seeding for possible tissue studies in the future. Morphology changes were analyzed using light microscopy and length/width-ratio measurements on cells plated for ICC from all patients in both conditions and both passages. Cellp-software (Olympus, Tokyo, Japan) was used to determine length and width of the ICC cells in micrometer.
Immunocytochemistry
ICC was performed on cells at P2 and P5, seeded on coverslips, and cultured for 3 days. Cells were subsequently fixed in 4% paraformaldehyde and permeabilized with 0.1% Triton-X100. Prior to staining, cells were washed and blocked in a 2% bovine serum albumin (10735086001; Roche) (w/v), 0.1% saponin (w/v) solution in PBS, and subsequently incubated for 1 h with primary antibodies in PBS. For extracellular proteins, all detergents were removed from the staining procedure. The following antibodies were used: αSMA (1:400; Sigma, Munich, Germany, A2547, stock concentration [sc]: 4.5 mg/mL), vimentin (1:400, ab20346, VI-10; Abcam, Cambridge, United Kingdom, sc: 1.0 mg/mL), SMemb (1:400, ab684-100; Abcam, sc: ND), desmin (1:50, Clone D33, M0760; Dako, Glostrup, Denmark, 0.235 mg/mL), and CD31 (1:200, JC70A, M0823; Dako, sc: 0.45 mg/mL). Staining for Heat shock protein 47 (Hsp47) (1:200, ab13510; Abcam, 1.0 mg/mL) and collagen type III (1:200, ab7778; Abcam, sc: 1.0 mg/mL) were used to address collagen synthesis.19–21 Expression of CD31 was analyzed to exclude the presence of venous-derived endothelial cells. Control stainings were performed by omitting primary antibody. The used secondary antibodies were Texas-Red labeled Goat-anti-Mouse (1:400; Vector Lab, Burlingame, CA, TI-2000, sc: 1.5 mg/mL), fluorescein isothiocyanate–labeled goat-anti-mouse (1:400; Southern Biotech, Birmingham, AL, 1010-02, sc: 2 mg/mL), or AlexaFluor-555-labeled goat-anti-rabbit (1:400; Invitrogen, Breda, The Netherlands, A21429, sc: 2 mg/mL). Cell nuclei were stained in 1 ng/mL Hoechst dye for 5 min. Coverslips were mounted with a 10% mowiol solution (w/v) (25% glycerol, 50% Tris-HCl, pH 8.5). Positive controls were included for CD31 (human venous-derived endothelial cells) and desmin staining (human adult cardiomyocytes). Cells were viewed by fluorescence microscopy (BX60; Olympus), and the percentage of positively stained cells was analyzed using Cellp-software (Olympus). For each condition, the average percentage of positively stained cells per patient was determined.
RNA isolation and quantification
RNA was extracted with Tripure Isolation Reagent (Roche) according to the manufacturer's protocol. Per sample, 500 ng DNA-free RNA was used to produce cDNA using the iScript cDNA synthesis kit (170-8891; Bio-Rad, Hercules, CA). For PCR, we used the MyIO quantitative real time (qRT)-PCR system and accompanied software (MyIQ; Bio-Rad). Template cDNA was added to a mastermix containing 2 × iQ SYBR-Green Supermix (172-5006CUST; Bio-Rad) and forward and reverse primers (each 0.5 μM). Primers were designed (OligoPerfect; Invitrogen) and optimal PCR conditions were determined. Product specificity was confirmed by postrun melting analysis and gel-electrophoresis. PCR conditions: 50 cycles of 95°C (30 s) and different annealing temperatures (45 s, details are given in Table 1). Samples were normalized for β-actin (ΔCt = Ctsample–Ctβ-actin) and presented as the difference between the FBS and PL group (ΔΔCt per patient = ΔCtFBS−ΔCtPL).
Hsp47, Heat shock protein 47; COL1A1, collagen type 1; COL3A1, collagen type 3; MMP, matrix metalloproteinase; TIMP, tissue inhibitor of metalloproteinase.
Zymography
Zymography analysis was performed in conditioned medium, containing low serum (2.5% for PL and 5% for the FBS group), corrected for the number of cells. The samples were prepared with Laemmli buffer (0.25 M Tris-HCl pH 6.8, 8% sodium dodecyl sulfate, 40% glycerol, and 0.004% Broomphenol blue) and loaded on 10–15% poly-acrylamide gels containing 2 mg/mL gelatin or 4 mg/mL casein, as described earlier. 19 After running, gels were incubated overnight at 37°C in Brij-solution (50 mM tris-HCL 7.4, 10 mM CaCl2, 0.05% Brij35) (w/v dilute 600 × ) and stained with Coomassie Blue (25% MeOH, 15% HAc, and 0.1% Coomassie Blue [CI42660; Polysciences, Inc., Eppelheim, Germany]). Unconditioned low-serum medium was loaded as a negative control. Analysis and quantification of total (active and inactive) protease secretion was performed using the ChemiDoc XRS system (Bio-Rad) and QuantityOne software (Bio-Rad). Quantification was corrected for presence of proteases in unconditioned medium.
Superarray
To determine the relative presence of growth factors and cytokines in both culture media, a biotin label-based human antibody array (AAH-BLM-1; RayBiotech, Norcross, GA) was performed according to the manufacturer's protocol. For this, complete, unconditioned culture medium was used, containing 5% PL or 10% FBS medium. Arrays were normalized based on internal positive controls and background signals were substracted. An exposure time of 15 s was used for the analysis to prevent saturation of the signal. An exposure time of 137 s was additionally used to determine the presence of a set of a priori selected growth factors. Homology on the protein level was determined using the Homologene function at the National Center for Biotechnology Information website.
Statistics
Results are expressed as means ± standard error of the mean. We used SPSS 15 software for statistical analysis. All results from similar passage were compared using paired samples t-tests (two-tailed) and a p-value <0.05 was considered significant. We used a regression analysis to create the linear models of the growth curves.
Results
Proliferation and morphology
Successful cell isolations for follow-up in both culture media were obtained from nine patients, including six men and three women (61 ± 4 years old). Cultures from one patient developed infection at an early passage in both culture media and were therefore excluded. Cell viability was approximately 95%, independent of the culture medium. PL cells reached 108 cells in approximately 20 days, whereas FBS cells required approximately 60 days on an average (Fig. 1). The linear models used to determine duplication rate closely resembled the raw data sets (Fig. 1, R 2 = 0.985 ± 0.007 and 0.975 ± 0.005 for PL cells and FBS cells, respectively). Analysis of the slopes of the individual linear models showed significant differences in proliferation of the cells between culture media and showed a threefold increase when cultured with PL medium (0.133 ± 0.006 and 0.043 ±0.002 for PL and FBS cells, respectively, p < 0.01).

Duplication rate analysis, starting at 150,000 cells. The time in days and number of cells per cell isolation are shown in this graph. The PL cells are depicted by the filled symbols and the FBS cells with the clear symbols, including a different symbol per passage. The line with the averaged slope is also shown in the figure. The slope of the PL cells was significantly higher than the slope of the FBS group (** : p < 0.01). The circled datapoints indicate outlying data for one PL-patient (P4 and P5). PL, platelet-lysate; FBS, fetal bovine serum.
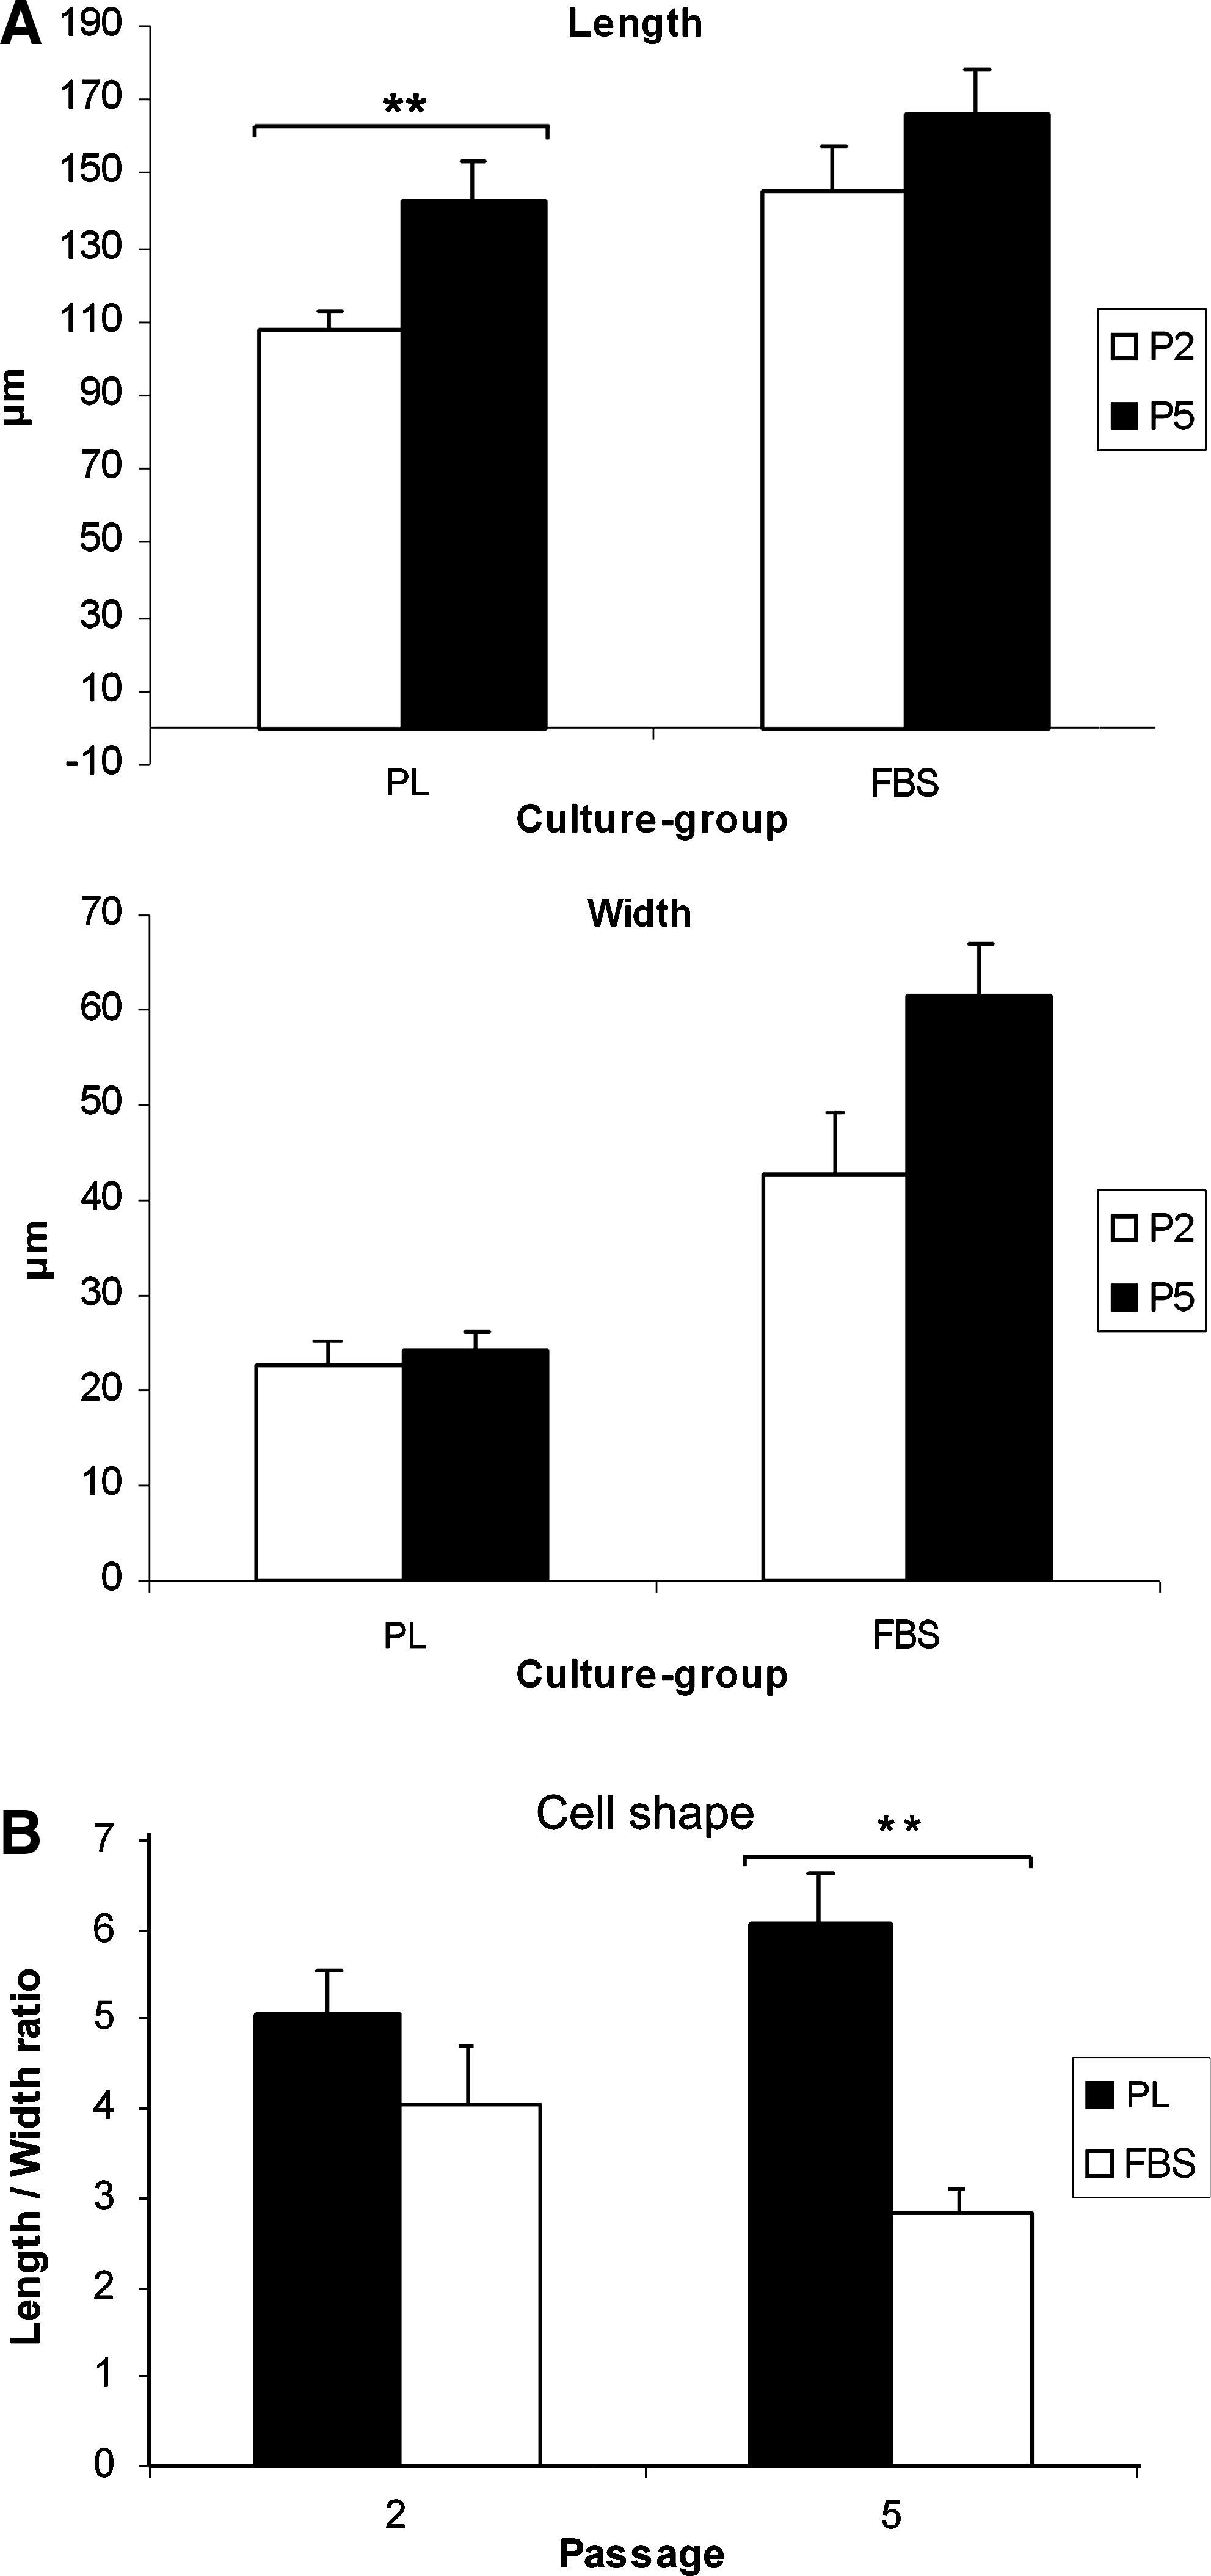
Platelets and small platelet clots are visible in the platelet-enriched PL medium (Fig. 2B, D, F). A distinct cell shape was already observed during the first few passages between cells cultured in different media (Fig. 2). Cells cultured in FBS showed a more stellate morphology, with abundant stress fibers, whereas cells cultured in PL were spindle-shaped and very dense. These observations were confirmed by length/width-ratio analysis, which showed a significantly higher ratio of cells cultured in PL at P5, as compared with the cells cultured in the FBS group (6.07 ± 0.57 vs. 2.83 ± 0.24, p < 0.01). The difference was not statistically significant at P2 (5.06 ± 0.46 vs. 4.06 ± 0.62) (Fig. 3B). Individual length- and width-analysis demonstrated an elongation of the PL cells (p < 0.01) and an increased width of the FBS cells (p = 0.06) (Fig. 3A).

Human MFs cultured in PL (
(
Phenotype
All cells of both media were positively stained for vimentin (Fig. 4A–D). For αSMA, the percentage of positive cells was higher in FBS cells as compared with PL cells at P2 (83 ± 8% and 31 ± 14%, respectively, p < 0.01), but this difference was absent at P5 (69 ± 13% and 76 ± 11%, respectively) (Figs. 4E–H and 5). For SMemb, the percentage of positive cells was not significantly different at P2 (PL: 16 ± 9% and FBS: 46 ± 13%), but it reached significance at P5 (37 ± 16% and 73 ± 14%, respectively, p = 0.047) (Figs. 4I–L and 5). The FBS samples displayed prominent intracellular SMemb- and αSMA-fiber structures, whereas these stainings appeared more diffuse in PL cells. There was a large variation of the percentage of cells positively stained for αSMA and SMemb between patients (Fig. 4E–L). Desmin staining was absent in all cells of all cultures (Fig. 4M–P). The positive control demonstrated intracellular fibers (Supplemental Fig. S1A, available online at www.liebertonline.com/ten).

Immunofluorescent staining of MF cultured in both media and at different passages. Results for phenotyping of one patient are displayed. (

Quantification of percentage of human MFs positive for expression of αSMA and SMemb (mean ± SEM). For αSMA, there was a significant difference in positively stained cells at P2 (* : p < 0.05; ** : p < 0.01) but not at P5. For SMemb, differences only reached significance at P5 (p = 0.047).
CD31 staining was negative for all cells in both groups and at both passages (Fig. 4Y–AB), whereas the positive control showed a positive membrane staining (Supplemental Fig. S1B, available online at www.liebertonline.com/ten).
Collagen synthesis
The ability to produce collagen fibers was investigated by immunostaining for Hsp47 and collagen type III (Fig. 4Q–X). All cells of both PL and FBS were positively stained for Hsp47 (Fig. 4Q–T). On the other hand, collagen staining was also positive in all cells of all conditions, but this appeared more prominent in the PL group. Cells cultured in both the PL and FBS group showed intracellular staining of collagen around the nucleus (Fig. 4U–X), but the PL group showed depositions of extracellular fibers covering the cells in addition to this (Supplemental Fig. 1F, available online at www.liebertonline.com).
On mRNA levels, lower ΔCt-values indicated that PL cells showed significantly higher expression of Hsp47 at P5, when compared with FBS cells (8.10 ± 0.43 vs. 19.33 ± 1.99, p < 0.01). There was no difference at P2. The amount of mRNA for collagen type 1 and collagen type 3 was similar at P2 and P5 (Fig. 6).

mRNA expression (mean ± SEM) in human MFs cultured in FBS- or PL-supplemented medium at P2 and P5. Significant differences were present at P5, where PL had higher gene expression for Hsp47 (** : p < 0.01), MMP1, MMP2, and TIMP1 (* : p < 0.05), as indicated by lower ΔCt-values. Error bars represent SEM. MMP, matrix metalloproteinase; TIMP, tissue inhibitor of metalloproteinase.
Protease and tissue inhibitor of metalloproteinase production
The amount of mRNA coding for proteins involved in matrix remodeling (matrix metalloproteinase [MMP]1, MMP2, tissue inhibitor of metalloproteinase [TIMP]1 and TIMP2) was not significantly different for any of the tested genes at P2. However, at P5, lower ΔCt-values indicated higher mRNA expression in the PL group for several genes: MMP1 (7.78 ± 0.71 vs. 14.10 ± 2.67), MMP2 (6.52 ± 0.28 vs. 14.47 ± 2.25), and TIMP 1 (4.00 ± 0.63 vs. 10.77 ± 2.66) were all significantly increased when compared with the FBS group (p < 0.05) (Fig. 6).
Zymographic analysis of gelatinolytic activity displayed high expression of active and inactive forms of MMP2 (72 and 64 kDa) in both PL- and FBS-conditioned medium at P2 and P5 (Fig. 7A). Levels of MMP9 and MMP9/NGAL-complexes were not different when compared with unconditioned medium. Quantification of total gelatinase activity indicated that the increase was more pronounced in PL cells at P2 (11.6 × 10⁴ ± 1.3 × 10⁴ vs. 7.4 × 10⁴ ± 1.1 × 10⁴, p < 0.01) and P5 (11.1 × 10⁴ ± 1.2 × 10⁴ vs. 5.0 × 10⁴ ± 1.4 × 10⁴, p < 0.01) (Fig. 7B).

(
On the casein-gels, the PL-conditioned medium showed some additional expression when compared with the unconditioned medium, suggesting MMP8 and MMP1 expression. This is also an increase when compared with FBS-conditioned medium, which did not show any increase of presence of proteases when compared with unconditioned medium (P2: 1.0 × 10³ ± 0.2 × 10³ vs. 0.3 × 10³ ± 0.2 × 10³, respectively, p = 0.011 and P5: 1.6 × 10³ ± 0.4 × 10³ vs. 0.1 × 10³ ±0.1 × 10³, respectively, p < 0.01) (Fig. 7C).
Superarray and western blots
Images of the superarrays are depicted in Supplemental Figure S2 (available online at www.liebertonline.com). The top 50 of proteins with the highest expression for each culture medium are displayed in Supplemental Table S1A, S1B (available online at www.liebertonline.com). Results of the growth factor expression at 15 and 137 exposure time are presented in Supplemented Table S1C, S1D (available online at www.liebertonline.com). Generally, the results show higher expression of proteins in PL. An analysis of the most abundantly expressed proteins indicated that high concentrations of heparin-binding epidermal growth factor (HB-EGF) were present in PL but not in FBS (Table 2). Also, high levels of specific interleukins, involved in tissue repair and matrix remodeling, were detected (Table 2). Higher exposure time analysis revealed higher concentrations of vascular endothelial growth factor and basic fibroblast growth factor (bFGF) in PL when compared with FBS.
Values indicate relative densities of spots in the array. Complete top 50 of proteins with highest expression at different exposure times are shown in Supplemental Table S1A, S1B, whereas the preselected growth factor results are displayed in Supplemental Table S1C, S1D.
Numbers in bold indicate medium with the highest expression.
IL, interleukin; HB-EGF, heparin-binding epidermal growth factor; NA, not available; PL, platelet-lysate; FBS, fetal bovine serum.
MIP-1a: macrophage inflammatory protein-1 alpha.
LRP-1: low density lipoprotein receptor-related protein-1.
Discussion
The aim of this study was to find an alternative, autologous source of growth factors for future clinical application of cardiovascular tissue engineering. Our results suggest a threefold increase in proliferation rate of MFs cultured in PL, potentially explained by higher concentrations of HB-EGF and bFGF in PL medium when compared with FBS. The pattern of marker proteins expressed by the cells resembles the pattern that has been previously reported for activated VICs12,22,23 and not smooth muscle cells.24,25 The change from FBS to PL thus caused a major improvement in culture time.
To meet the high mechanical demands of the systemic circulation, required for use of tissue-engineered heart valves in patients, active matrix production and remodeling is desired during the conditioning of the cells in the bioreactor both before and after implantation. We found higher RNA expression of Hsp47 in the PL cells. Hsp47 binds procollagen fibers, facilitates triple-helix formation, and is known to be an excellent marker protein for collagen synthesis.19–21 Combined with the extracellular staining for collagen type III on PL cells, this suggests that culturing in PL stimulates collagen expression, which could be beneficial for heart valve tissue engineering.
Our data were consistent in finding increased expression of MMPs and TIMPs by PL-cultured cells when compared with FBS, indicating an increased ability in matrix remodeling. However, there should be a balance between production and degradation of matrix proteins, and a net degradation of matrix reduces the strength of the tissue in which remodeling takes place. Other groups have previously used collagen gels to analyze matrix remodeling in a three-dimensional model.26–28 However, since it is difficult to simultaneously quantify newly produced collagen in this model, we have decided to investigate the balance of production and remodeling of collagen in a separate tissue model. The results of this study will show whether cells cultured in PL are capable of production of load-bearing tissue. Glycosaminoglycan and elastin production will also be addressed in these studies.
To start to elucidate some of the mechanisms behind our observations, we investigated a wide spectrum of cytokines and growth factors in our culture media, instead of a priori selected proteins, using a super array. We found higher amounts of HB-EGF and bFGF in PL when compared with FBS, which can explain the higher proliferation in PL.29,30 Moreover, our results suggest that the levels of several interleukins (IL17 and IL23) and other proteins involved in tissue repair and matrix remodeling (macrophage inflammatory protein-1 alpha [MIP1a] and urokinase [uPA]) are higher in PL than FBS, which could be an explanation for the higher increase of MMPs in PL.31–33 Interleukins are also among the proteins with highest expression in FBS medium, but expression is believed to be generally lower when compared with PL. FBS also has relatively high expression of low density lipoprotein receptor-related protein-1 (LRP-1), which has been shown to cause uptake of MMP2 by cells34,35 and inhibition of matrix remodeling. 36
The superarray did not find several growth factors that have been previously shown to be abundantly present in platelets, like EGF, platelet-derived growth factor, and transforming growth factor-beta (TGF-β).18,37 Since TGF-β has previously been shown to be identical in bovine and human, 38 this was the most suitable growth factor to test platelet activation using enzyme-linked immunosorbent assay (DB100B; R&D Systems, Abingdon, United Kingdom) and allow comparison between PL and FBS. Our results showed higher concentrations of total TGF-β in PL, confirming the release of growth factors from the platelets (Supplemental Table S2, available online at www.liebertonline.com/ten). The fact that several growth factors were not detected with the super array can be explained by differences between the activated and nonactivated forms of these growth factors. In our case, TGF-β was activated before the enzyme-linked immunosorbent assay but not before the superarray. TGF-β is a known stimulator of collagen production in wound repair, and the high levels in PL might thus contribute to the increased fiber production by the PL cells. 39
The aim of this study was to investigate the effect of replacing current culture protocols using animal serum with an autologous protocol for cells most often used for heart valve tissue engineering. For practical reasons, some steps were not performed completely autologously during this investigation, like the use of pooled PL, the use of FBS in the collagenase solution to collect endothelial cells, and the use of antibiotics during cell culture. We expect that these small modifications will not have affected the outcome of this study or the general outcome, which is that PL is suitable for use in cardiovascular tissue engineering. For clinical application, we aim to obtain plasma from the patient along with cells for expansion to ensure production of a completely autologous-engineered valve.
Conclusion
Our data suggest that the expression of marker proteins of cells cultured in PL and FBS is similar. We also found indications for increased matrix production and ability to remodel matrix in PL cells, which will be more thoroughly investigated in future tissue studies. The major increase in proliferation of cells cultured with PL is an important, beneficial effect, which reduces waiting time when applied in clinical practice. Thus, our data suggest that PL can be an alternative for FBS in cell culture for heart valve tissue engineering. This is an important step forward in translating this technique from the laboratory bench to clinical application.
Footnotes
Acknowledgments
The authors would like to thank Henk-Jan Prins, Anton Martens, and Ineke Slaper for sharing their experience with PL and Marie-Jose Goumans for the quantification of TGF-β in our samples.
Disclosure Statement
No competing financial interests exist.
References
Supplementary Material
Please find the following supplemental material available below.
For Open Access articles published under a Creative Commons License, all supplemental material carries the same license as the article it is associated with.
For non-Open Access articles published, all supplemental material carries a non-exclusive license, and permission requests for re-use of supplemental material or any part of supplemental material shall be sent directly to the copyright owner as specified in the copyright notice associated with the article.